 Xinyu Gao
 Bo Wang1*
94% of researchers rate our articles as excellent or good
Learn more about the work of our research integrity team to safeguard the quality of each article we publish.
Find out more
ORIGINAL RESEARCH article
Front. Environ. Sci. , 27 February 2025
Sec. Environmental Informatics and Remote Sensing
Volume 13 - 2025 | https://doi.org/10.3389/fenvs.2025.1522949
Landslide susceptibility assessment is crucial to mitigate the severe impacts of landslides. Although Bayesian network (BN) has been widely used in landslide susceptibility assessment, no study has compared the accuracy of different BN structure construction methods for this purpose. SBAS-InSAR technology plays a vital role in landslide research, but its advantages combined with BN to further improve prediction accuracy still need to be studied. This paper takes Hanyuan County as the study area. First, 20 traditional landslide impact factors were extracted from data such as topography and meteorology. A new method GDSP was designed to fuse GeoDetector and SHAP for dominant factor screening. Then, 8 different BN structure learning methods were compared using the AUC value of the ROC curve, among which Tabu&K2 method showed the highest accuracy. The deformation factor calculated by SBAS-InSAR is then incorporated into the BN model. The optimized Bayesian network (OPT-BN) outperformed the unoptimized version (ORI-BN) in accuracy, and the landslide susceptibility mapping was more reasonable. The reverse inference highlighted that areas with lower elevation, plow land, impervious cover, and higher rainfall are more prone to landslides. This method provides valuable insights into landslide hazard prevention and control and provides a new method for future landslide research.
Landslides, one of the most frequent natural hazards can cause significant harm to social development and land use leading to large-scale economic losses (Dai et al., 2002; Petley, 2012; Zhu et al., 2018). China ranks among the nations most vulnerable to landslide hazards globally. In 2016, 9,710 landslides occurred, resulting in 370 fatalities and approximately $457 million in direct economic losses (Yang et al., 2018). During 2019, 4,220 landslides occurred, accounting for 68.27% of all geologic risk (He et al., 2021). This is almost three times more frequent than the incidence of subsequent collapse catastrophes. The eastern edge of the Qinghai-Tibetan Plateau, the Loess Plateau, the southeast hilly and mountainous regions, and the mountains of eastern Sichuan, southern Chongqing, western Hubei, and western Hunan are the primary locations for geological risks in China (Chang, 2023). Improving the hazard early warning capacity is a hot and challenging topic in preventing and controlling geological hazards since early identification and prevention are the keys to minimizing the effects of hazards.
Landslide susceptibility assessment is based on posthazard landslide prediction and forecasting at medium and large scales. Landslide databases and topographic, meteorological, hydrological and other basic geoenvironmental data on possible hazards are used to make qualitative or quantitative assessments of the likelihood of landslides. It can determine the spatial distribution of potential landslides, allowing for preventive preparations and implementing prehazard transfer and avoidance for high-risk areas, changing “passive” into “active,” and reducing or even avoiding catastrophic landslide geological hazards. This approach is one of the most effective methods for preventing and reducing landslide hazards (He and Beighley, 2008; Pradhan and Lee, 2010; Wang et al., 2014; Khanna et al., 2021). Landslide susceptibility mapping (LSM) is the most commonly used tool for landslide susceptibility assessment and prevention because it can clearly and intuitively identify dangerous areas prone to landslides and has a long history of research. The majority of past studies used statistical methods such as the analytic hierarchy process (AHP) (Hasekioğulları and Ercanoglu, 2012) and weight of evidence (WOE) (Batar and Watanabe, 2021). As computer science has advanced, an increasing number of machine learning models, including neural networks (Mandal et al., 2019; Bui et al., 2020; Gameiro et al., 2021), logistic regression (Lombardo and Mai, 2018; Riegel et al., 2020), Naive Bayes (Nguyen and Kim, 2021; Shang et al., 2024), decision trees (Park et al., 2018; Thai Pham et al., 2018), support vector machines (Huang and Zhao, 2018; Kalantar et al., 2018), and random forests (Kim et al., 2018; Akinci et al., 2020; Zhao et al., 2020), have been added to LSM studies.
Although many machine learning models are used for landslide susceptibility analysis, they have the following disadvantages: (1) They do not account for the interactions between impact factors and their synergistic effects on the entire landslide system; (2) It is difficult for them to directly explain the prediction results and has a “black box” nature; (3) They cannot easily incorporate prior expert knowledge; (4) They cannot perform reverse inference to obtain data for prevention and mitigation measures.
In order to overcome the shortcomings of the above-mentioned machine learning models, the Bayesian network (BN) model is being applied to the study of LSM. BN combines graph theory and Bayesian theory and is a powerful modeling technique that can be used to apply statistical and mathematical knowledge to solve uncertain problems in complex systems. It is often used for uncertainty because it contains an almost perfect mathematical reasoning mechanism, a solid mathematical foundation, and an easy-to-understand graphical causal relationship description. The BN model is a perfect fusion of qualitative analysis and quantitative research methods. It successfully combines human prior knowledge with a series of objective information and makes practical reasoning about relevant materials. In terms of learning mechanism, it is also called a generative model because it can estimate the joint probability of a given influencing factor (x) and an influencing subject (y) from training sample data.
BN modeling offers a framework for handling complexity and uncertainty in catastrophe chain systems by combining causal linkages between variables with probabilistic techniques. The effectiveness of Bayesian network has been verified in landslide susceptibility assessment. Rong et al. (2020) utilized a BN model to construct a causal hazard chain network aimed at determining the probability and risk level of landslide occurrence. Validation through error rate analysis and scoring rules further confirmed the model’s practical applicability in landslide susceptibility assessment. However, the study has certain limitations, particularly regarding the subjective nature of network structure construction. Relying exclusively on expert judgment to define causal relationships between factors may introduce bias, which in turn affects the robustness and generalizability of the model. While expert knowledge can provide valuable insights, an over-reliance on it alone is insufficient, as it may compromise the model’s objectivity and validity. This highlights the need to incorporate data-driven approaches to improve the reliability of network structures. Song et al. (2012) introduced a hybrid BN approach to analyze slip-causing factors in earthquake-induced landslides and assess their susceptibility. Their model achieved high-precision landslide susceptibility detection, highlighting BN’s potential in earthquake-related disaster prediction. Nevertheless, the study lacks a thorough exploration of different network structures. A comparative analysis of multiple network configurations is crucial for enhancing the model’s adaptability and generalizability. Without this, it is unclear whether the selected structure is the most suitable for landslide susceptibility assessment, thus limiting the wider applicability of the model in different geographical or hazard scenarios. Han et al. (2019) compared the BN model with parallel modeling to generate a susceptibility map for the earthquake–landslide–debris flow disaster chain in the Changbai Mountain region of China. The study demonstrated that the BN model outperformed the parallel model, highlighting its effectiveness in addressing multiple disaster types simultaneously. However, the study relied solely on expert-selected factors for constructing the BN, without systematically identifying and selecting the most significant drivers of risk. This approach may have led to the inclusion of less relevant factors and the omission of critical drivers, potentially limiting the accuracy and comprehensiveness of the model.
In general, the current application of BN in landslide susceptibility research remains limited for several reasons: (1) Due to the complexity of Bayesian network and the limitation of computing resources, it is usually necessary to select representative factors to participate in network construction rather than using all factors. Determining a better combination of factors for building a network is still under study; (2) Current research only focuses on applying subjective, specific Bayesian networks to assess landslide susceptibility, but does not focus on how to construct or compare to obtain better Bayesian network structure construction strategy; (3) The introduction of surface deformation factors can further improve the rationality of landslide susceptibility assessment of random forest models (Liu et al., 2022; Lin et al., 2024; Wei et al., 2024). However, in the existing Bayesian network research, scholars have not yet noticed the importance of surface deformation factors. How to make full use of the advantages of the two and improve the effect of landslide susceptibility assessment is still under study; (4) No research has yet used the powerful reverse inference feature of Bayesian network to conduct landslide hazard prevention and mitigation analysis. However, this function has been applied in fields such as engineering projects and Arctic shipping routes, demonstrating great potential (Zheng, 2014; Li et al., 2022).
Therefore, this study aims to develop a landslide susceptibility assessment framework using SBAS-InSAR optimized Bayesian network to scientifically and accurately assess landslide susceptibility and reasonably calculate specific reference measures for landslide hazard prevention and control. The detailed objectives of this study are as follows: (1) Design a GDSP method that combines the advantages of the GeoDetector model and the SHAP interpreter to identify the important factors impact landslide hazards; (2) Compare the commonly used Bayesian network construction strategies to obtain better Bayesian network structure construction method; (3) Use the deformation factor calculated by SBAS-InSAR technology to optimize the Bayesian network and verify its accuracy; (4) Use the reverse inference characteristics of the BN model to obtain landslide hazard prevention and mitigation measures.
Hanyuan County, Ya’an City, Sichuan Province, China, is the study region for this work. Its geographic coordinates are between 102°16′– 103°00′E longitude and 29°05′– 29°43′N latitude. Its length is 71.4 km in the east‒west direction, and its width is 70.1 km in the north‒south direction. The county has a subtropical monsoon humid climate, four distinct seasons, warm winters and mild summers, significant elevation differences ranging from 559 m to 3,944 m (Figure 1A), and spans 2,382 square kilometers. It is located at the intersection of the three main faults in the eastern section of the Tibetan Plateau’s Hengduan Mountain Range. The region is prone to frequent small earthquakes and a wide range of geologic hazards. Simultaneously, it experiences considerable precipitation, much of which falls as heavy rains during the summer. On August 21, 2020, a landslide occurred in Zhonghai Village in Hanyuan County in the study area, destroying houses, roads, and a large forested area, resulting in substantial economic losses. As of 5:00 p.m. on the same day, seven of the nine people victims had been found, six of whom showed no signs of life, and one of whom was seriously injured (Ye et al., 2021). Thus, analyzing the susceptibility of landslides in the study area is crucial.
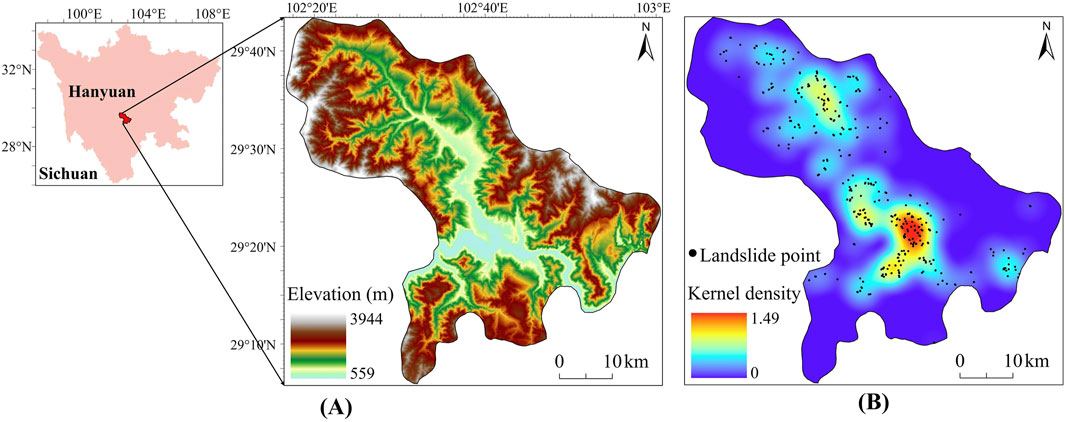
Figure 1. Location of the study area (A) and kernel density map of landslides (B).
Historical landslide point data and impact factor data serve as the foundation for landslide susceptibility assessment. Landslide susceptibility models are based on the assumption that future landslide events are likely to occur under the same or similar environmental conditions as past events. The landslide data is a critical component, as it directly influences the quality and accuracy of the modeling results. In this study, a computational model for landslide susceptibility was developed using historical landslide data from Hanyuan County, provided by the Center for Resource and Environmental Science and Data (RESDC) (https://www.resdc.cn/). The dataset records a total of 377 landslide occurrences in Hanyuan County over the past 2 decades within the WGS 84 coordinate system, capturing the latitude and longitude coordinates of each landslide event. These coordinates were collected using mobile terminals equipped with high-precision sensors, such as GPS, with a positional accuracy of 5 m (Tang et al., 2024). The data collection involved rigorous field surveys and the use of advanced gyroscopic technology to ensure high precision and reliability. The dataset is provided in Excel format and includes comprehensive information, such as the landslide hazard name, field number, indoor number, latitude and longitude coordinates, number of casualties, damage to houses and roads, risk level, and recommended mitigation measures. A thorough validation process was conducted to ensure data quality, including cross-referencing with satellite imagery and historical records. These measures collectively enhance the reliability of the dataset, providing a solid foundation for the computational modeling undertaken in this study. The kernel density map of landslide events is presented in Figure 1B. The areas with high landslide kernel density are mostly distributed in areas with low elevations.
Approximately 100 factors impact the occurrence of landslides (Reichenbach et al., 2018). Therefore, selecting appropriate factors to map landslide susceptibility with sufficient accuracy is crucial. Based on extensive reading of previous studies, 20 impact factors commonly used in related studies were initially selected for this study (Table 1). These factors were categorized into three major groups: topographic factors, including elevation, slope, aspect, flat curvature, profile curvature, stream power index (SPI), terrain wetness index (TWI), slope variability, relief, roughness, surface cutting depth, and elevation variation coefficient (12 factors in total); environmental factors, including normalized difference vegetation index (NDVI), modified normalized difference water index (MNDWI), rainfall, lithology, and river density (5 factors in total); and human engineering factors, consisting of land use, normalized difference built-up index (NDBI), and road density (3 factors in total). The following sections describe the relationship between these impact factors and landslide occurrence.
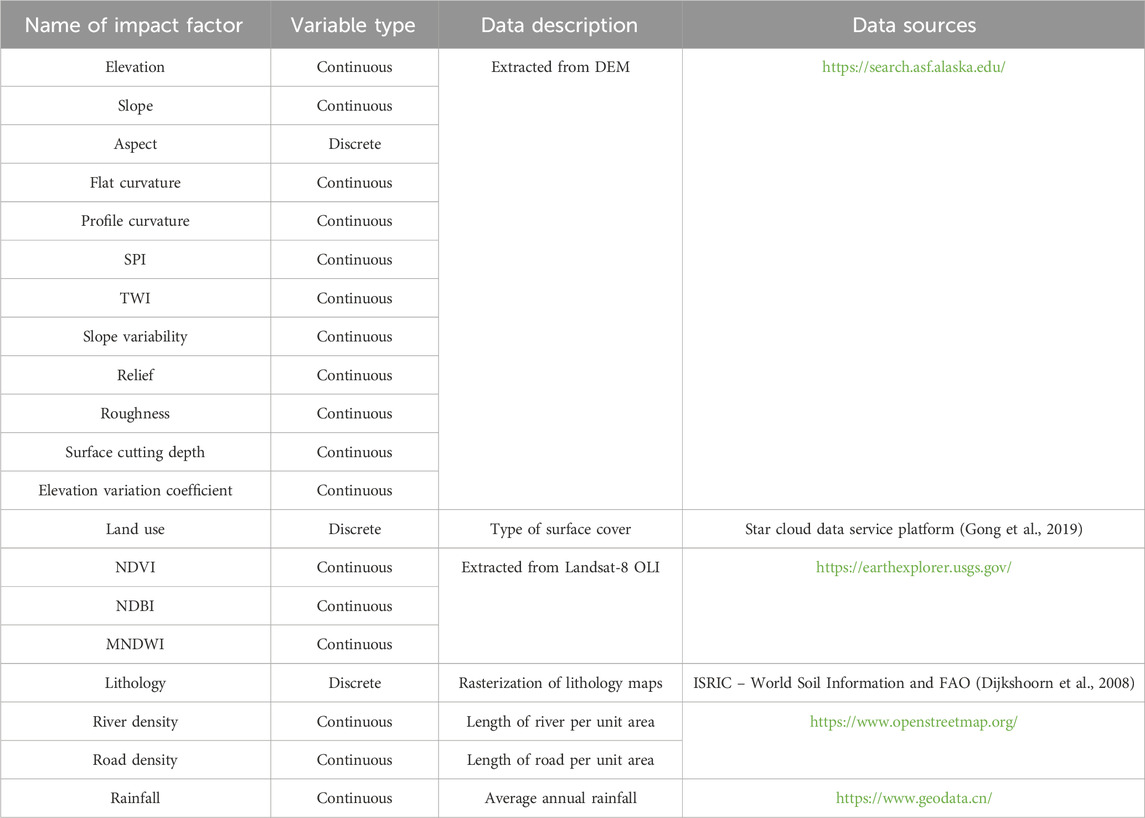
Table 1. Names of factors impact landslide hazards, types of variables, data descriptions, and data sources.
Elevation is widely used in landslide susceptibility assessments due to its association with external factors such as rainfall, vegetation cover, and human activities. It also serves as a basis for deriving other topographic factors that influence landslide susceptibility (Brock et al., 2020). Slope, a critical factor in evaluating slope stability, directly impacts the integrity of slopes. Variations in slope affect water infiltration processes and soil stress distribution, both of which influence the likelihood of landslides (Ayalew et al., 2004). Aspect, another important topographic factor, controls water infiltration and solar radiation absorption on slopes, both of which impact slope stability and landslide potential (Cellek, 2021). Flat curvature and profile curvature describe the geometric characteristics of the slope surface. The former influences surface water flow distribution, while the latter is associated with erosion features. Together, both factors affect the path and erosive power of water flow, contributing to landslide occurrence (Chen et al., 2016; Shirzadi et al., 2017). Slope variability, which describes the degree of slope variation within an area, influences soil moisture distribution and slope stress conditions, further affecting landslide susceptibility (Niu et al., 2018; Hu et al., 2020). The SPI measures the erosive power of water flow, considering slope and watershed area. It reflects the ability of water to erode soil, weakening slope stability and increasing landslide risk (Althuwaynee et al., 2012; Ortiz and Martínez-Graña, 2018). The TWI reflects water accumulation on slopes and the role of topography in directing water flow and accumulation. Water accumulation can weaken soil stability, thus influencing landslide occurrences (Park et al., 2018; Chen and Li, 2020). Relief measures the variation in elevation within a region, affecting both slope stability and water flow processes, and contributing to landslide risk (Broeckx et al., 2018). Roughness indicates the irregularity of slope surfaces, which influences water distribution and landslide occurrence (Goetz et al., 2015; Korzeniowska et al., 2018). Surface cutting depth assesses the degree of slope incision, either from natural processes or human activity. Greater incision can destabilize slopes, thereby increasing landslide risk (Guo et al., 2021). Elevation variation coefficient quantifies fluctuations in elevation within an area, influencing soil moisture distribution and soil type, both of which affect landslide occurrences (Liao et al., 2022; Ma et al., 2023).
The NDVI reflects vegetation biomass, which plays a key role in regulating runoff processes. Vegetation can help reduce soil moisture accumulation, thus stabilizing slopes and lowering landslide risk within certain limits. However, beyond a certain threshold, excessive vegetation may increase the weight of the slope, which can actually promote landslides by destabilizing the slope structure (Lin et al., 2023). The MNDWI measures the distribution of water bodies, which can influence landslide susceptibility by increasing soil saturation and altering water levels in rivers or lakes, thereby destabilizing slopes (Zhang et al., 2016; Dey et al., 2024). Areas with high MNDWI values, particularly near water bodies during periods of heavy rainfall, are more prone to landslides. Rainfall is a major triggering factor for landslides, particularly in mountainous regions. Intense rainfall can saturate the soil, raise pore water pressure, and reduce slope shear strength, making landslides more likely (Shou and Lin, 2020; Huang et al., 2022a). Lithology reflects the physical and chemical properties of rocks and has an important impact on slope stability. Different rock types have varying impacts on slope stability, particularly in regions with complex geological formations. In general, areas with low permeability rocks are more likely to experience landslides (Zhou et al., 2021). River density measures the extent of erosion at the base of slopes, where rivers can saturate slope bases with water, weakening slope stability and increasing landslide risk (Chen et al., 2019; Huang et al., 2022b).
Land use refers to both the type of vegetation cover and human engineering activities. On one hand, vegetation cover affects the stability of slopes by influencing soil properties and water retention. On the other hand, human activities such as urbanization and agriculture alter the landscape, disrupting natural water flow and soil composition, which can increase the likelihood of landslides (Rabby et al., 2022; Pacheco Quevedo et al., 2023). The NDBI differentiates urbanized from non-urbanized areas. Urbanization often leads to more impervious surfaces, which changes runoff and water flow, further increasing landslide risk (Thomas et al., 2021; Huang et al., 2023). Road density refers to the density of road networks within an area. Road construction disrupts natural slope structures, alters water flow patterns, and destabilizes slopes, particularly in mountainous regions, thereby contributing to landslide risk (Huang et al., 2022b; Shahabi et al., 2023).
In this study, various factors were derived from different data sources. The topographic factors, including elevation, slope, aspect, flat curvature, profile curvature, SPI, TWI, slope variability, relief, roughness, surface cutting depth, and elevation variation coefficient, were directly or indirectly calculated from the 12.5 m resolution ALOS-DEM data (https://search.asf.alaska.edu/). Elevation was obtained directly from the DEM. For the other factors, calculations were performed using various tools in ArcGIS Pro: the “Slope” tool for calculating slope and slope variability, the “Aspect” tool for deriving aspect, and the “Curvature” tool for calculating flat and profile curvatures. The “Hydrology” toolset and “Raster Calculator” were used to compute TWI and SPI, while the “Neighborhood Analysis” toolset and “Raster Calculator” were employed to calculate relief, roughness, surface cutting depth, and elevation variation coefficient. The resulting 12 factors were represented as raster data at a 12.5 m resolution. The land use factor was obtained directly from the Star Cloud Data Service Platform (https://data-starcloud.pcl.ac.cn/zh/resource/1), with raster data at a resolution of 10 m. For remote sensing indices, NDVI, NDBI, and MNDWI were derived from Landsat-8 OLI data (30 m resolution), accessed via the USGS Earth Explorer platform (https://earthexplorer.usgs.gov/). These indices were calculated using the “Band Arithmetic” function in ArcGIS Pro and represented as raster data with a resolution of 30 m. To balance precision with computational efficiency, all of the aforementioned factors were resampled to a uniform 100 m resolution (Luti et al., 2020). The lithology factor was derived from vector polygon data at a 1:1,000,000 scale, downloaded from ISRIC (https://www.isric.org/), and then rasterized to a 100 m resolution using the “Feature to Raster” tool in ArcGIS Pro. River density and road density factors were calculated using line vector data for rivers and roads from OpenStreetMap (https://www.openstreetmap.org/), employing the “Line Density” tool in ArcGIS Pro. The resulting data were then resampled to a 100 m resolution raster to ensure consistency with the other factors. The rainfall factor was derived from monthly precipitation data (2012–2022) obtained from the National Earth System Science Data Center (https://www.geodata.cn/), in NC format with an initial resolution of 1,000 m. The annual average rainfall was calculated using the “Cell Statistics” tool in ArcGIS Pro, and the data were bilinearly interpolated to a 100 m resolution raster to align with the spatial scale of the other factors. In summary, all 20 factors were resampled to a consistent 100 m resolution raster format, ensuring uniformity for subsequent analyses.
The distribution of the 20 landslide impact factors in this study is shown in Figure 2. It is close to the interior of Hanyuan County and has a lower elevation, higher road density, and higher river density. The lithology is dominated by limestone and siltstone, and the land use is dominated by forest. Near the river, the slope variability, SPI, relief, and slope are lower, the rainfall and TWI are greater, and the flat curvature and profile curvature are near 0.
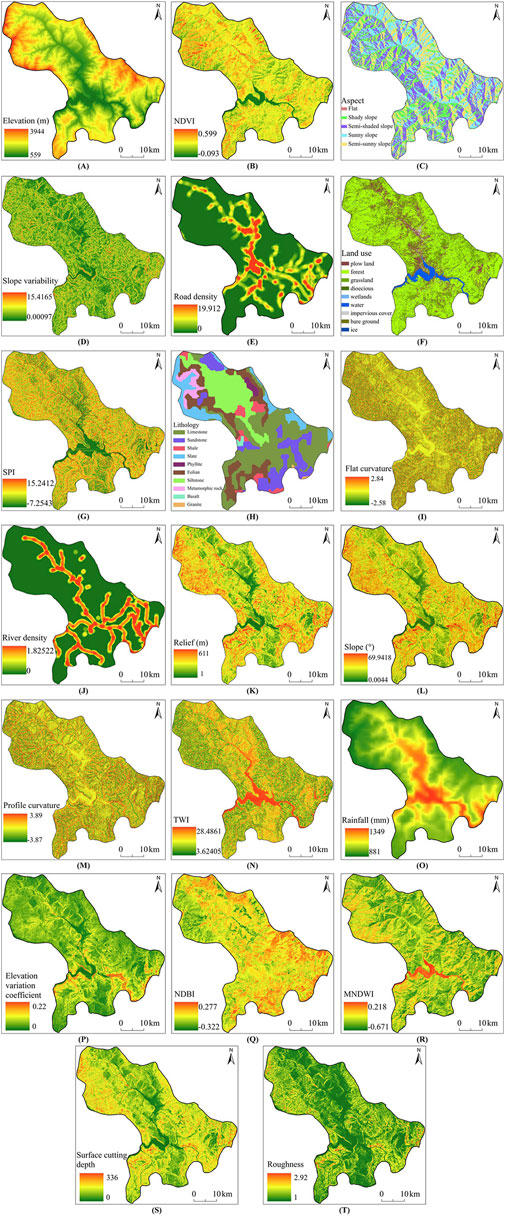
Figure 2. Distribution map of impact factors (A) Elevation, (B) NDVI, (C) Aspect (D) Slope variability, (E) Road density, (F) Land use, (G) SPI, (H) Lithology, (I) Flat curvature, (J) River density, (K) Relief, (L) Slope (M) Profile curvature, (N) TWI, (O) Rainfall, (P) Elevation variation coefficient, (Q) NDBI, (R) MNDWI, (S) Surface cutting depth, (T) Roughness.
Our research is based on the SAR satellite data of Sentinel-1A and uses SBAS-InSAR technology to calculate the surface deformation rate in the LOS direction. This process requires three data: Sentinel-1A, POD precise ephemeris orbit file, and the DEM dataset. Although the ALOS-DEM (12.5 m resolution) is well suited for extracting topographic factors due to its higher resolution, it is not suitable for application in SBAS-InSAR techniques as it may introduce significant terrain residual phases in the interferogram, potentially affecting deformation analysis accuracy. In contrast, the 30 m resolution COP-DEM, which is commonly used for SBAS-InSAR deformation calculations, was selected due to its better compatibility for this application (Li et al., 2023; Chang et al., 2024).
Sentinel-1A data in Single Look Complex (SLC) format with Interferometric Wide Swath (IW) mode was downloaded from the Copernicus Data Space Ecosystem (https://dataspace.copernicus.eu/), with a total of 29 descending orbit data from January to December 2019. The spatial resolution of the Sentinel-1A data is 5 m × 20 m (range × azimuth). The corresponding POD precise ephemeris orbit file was downloaded from the ASF (https://search.asf.alaska.edu/), and the 30 m resolution COP-DEM digital elevation model data was downloaded from the Open Topography website (https://opentopography.org/), which together serve as the basis for calculating the deformation rate using SBAS-InSAR technology.
Figure 3 shows the workflow of the method. First, based on the collected DEM, land cover, Landsat-8 remote sensing images, lithology vector, precipitation, road and river data, processing and calculation were performed to extract 20 factors impact landslide hazards, such as elevation, lithology and NDVI. Second, based on the factors obtained in step 1, Multicollinearity analysis, GeoDetector model and SHAP interpreter were used for calculation to screen the dominant factors of landslides related to the construction of BN structure. Third, a sample set was constructed based on the dominant factor data and landslide data (see Section 3.2 for details). It was randomly divided into 8:2 for training and testing BN models. Based on the training set, expert experience was used to construct the initial structure, and the final structure was obtained using three methods: score search, variant Naive Bayes, and combination of constraint and score. Then, after using the maximum likelihood estimation (MLE) algorithm for parameter learning, the best Bayesian network construction method among them was obtained using the AUC value test. Fourth, based on Sentinel-1A data, SBAS-InSAR technology was used to obtain the deformation rate, and the Kriging interpolation method was used to process the incoherent area to obtain the deformation factor. It was added to the dominant factors and modeled using the best Bayesian network construction method to obtain the optimized Bayesian network model (OPT-BN). Finally, OPT-BN was used to map the landslide susceptibility, and ACC, MCC, AUC and FR were used to test the accuracy of the assessment results, and then reverse inference was performed to provide a reference for landslide hazard prevention and control measures.

Figure 3. Technical workflow of the study.
A 100 m × 100 m resolution grid was used as the assessment unit, considering both the computing speed and prediction accuracy. Since water bodies were not included in the landslide susceptibility assessment, 210,242 grid cells were generated in the study area after removing water bodies. The total number of historical landslide points in the study area was 377. The analysis of landslide impact factors and the modeling process analyzed the landslide and non-landslide points overall. Non-landslide points can effectively suppress the overestimation of landslide susceptibility by the model (Zhu et al., 2018). However, non-landslide points cannot be obtained directly. Random sampling is the most commonly used method for generating non-landslide points in landslide susceptibility modeling. In this paper, based on the research results of Liu et al. (2021a), the non-landslide points were randomly sampled in outer space, which is three times the size of the warning grid unit from the landslide point, to obtain more realistic “non-landslide points.” In addition, the ratio of landslide points to non-landslide points was uncertain, which had implications for the landslide susceptibility modeling accuracy (Hong et al., 2019). The ratio of landslide points to the number of non-landslide points in the range of 1:5–1:10 is more reasonable and accurate for constructing the total sample for the landslide classification model (Das et al., 2012). In this paper, the ratio of landslide points to non-landslide points was finally chosen to be 1:10 after several experiments, i.e., 3,770 non-landslide points were selected based on 377 historical landslide points. Therefore, the total number of sample units obtained in this study is 4,147.
GeoDetector and BN models specify that the input data must be discrete (Jensen and Nielsen, 2007; Yang et al., 2019; Zhu et al., 2020). Additionally, the classification intervals of landslide impact factors significantly affect the accuracy of landslide susceptibility predictions. Therefore, prior to discretizing the datasets, water body areas were removed, as water bodies are not included in the landslide susceptibility assessment. After removing the water bodies, each continuous dataset was clustered to obtain discretized data based on Sun (2022) improved K-means method, which uses the sum of the square errors (SEE) (Thinsungnoena et al., 2015; Nainggolan et al., 2019) to evaluate the clustering results. The optimal k value is determined based on the distance of each point from the line connecting the start and end points in the elbow diagram, where the maximum distance corresponds to the optimal number of clusters. In addition, the aspect was classified as flat slope (−1), shady slope (0°–45°, 315°–360°), semishaded slope (45°–135°), sunny slope (135°–225°), and semisunny slope (225°–315°) according to the four-direction method (Fuju et al., 2007; Cui et al., 2021) and were assigned as T1 to T5, respectively, for the sake of uniformity and computation. The land use data were based on the Pengcheng Laboratory Classification Table (Gong et al., 2019) and the National 2017 Land Use Status Classification Standard, and combined with the actual location of the landslide, they were classified as plow land, forest, grassland, wetlands, impervious cover, bare ground, and ice, and assigned as T1 to T7, respectively. There were ten categories of lithology data in the study area, namely, limestone, sandstone, shale, slate, phyllite, eolian, siltstone, metamorphic rock, basalt, and granite, which were assigned T1 to T10. The results are shown in Table 2.

Table 2. Classification of impact factors and new fields.
In summary, all factor data were processed into 100 m resolution raster datasets, excluding water body areas. Each factor dataset consisted of 210,242 grid cells, with each cell containing the corresponding discretized “new fields” as shown in Table 2. Based on a total of 4,147 sample units, which included both landslide and non-landslide points, the “Extract Multi Values to Points” tool in ArcGIS Pro was used to assign the 20 factor values to the corresponding sample units for subsequent key factor identification. Non-important factor data were then removed from the sample units, leaving only the key factors. Then the total sample units were randomly divided into training and test sets in an 8:2 ratio, which were used for training and testing the BN model, respectively.
The GeoDetector model is a spatial statistical method for measuring the spatial heterogeneity of geographic elements and revealing the driving forces behind spatial heterogeneity. The model has been widely used in the natural sciences, social sciences, environmental sciences, and human health and has been gradually applied to remote sensing and earth sciences in the last 10 years (Hu et al., 2014). The central idea is that the spatial distributions of the independent and dependent variables should be similar if there is a vital effect between several components and geographic events (Wang et al., 2010). The GeoDetector model is used to assess potential factors associated with spatial phenomena quantitatively and can be used for factor selection (Wang and Hu, 2012). Luo and Liu (2018) used the GeoDetector model for the first time to screen dominant factors in landslide risk assessment studies.
The GeoDetector model consists of four main detectors: factor, factor interaction, risk zone, and ecological (Su et al., 2020). A factor detector is utilized in this study to detect the impact factors that significantly influence the spatial distribution of landslides to establish an objective and scientific assessment index system. The theory of the factor detector is shown in Equation 1:
The SHAP (SHapley Additive exPlanations) interpreter is a tool for explaining the prediction results of machine learning models (Parsa et al., 2020; Li, 2022). It provides a transparent and unified explanation method by calculating the contribution of each feature to the model output, which can quantify the impact of each feature on the prediction results. The core idea of the SHAP model is to use Shapley values, a concept in game theory that is used to fairly distribute the benefits of each player in a cooperative game. In machine learning, feature values can be regarded as “players” and the output of the model as “benefits”. SHAP measures the contribution of each feature to the prediction result by calculating its marginal contribution under different combinations. Assume that the model output is a linear combination of the contributions of each feature, as shown in Equation 2:
GeoDetector focuses on spatial heterogeneity and spatial correlation between factors, while SHAP can reveal the contribution of each factor in a complex model to the prediction results. The combination of the two can comprehensively analyze the factors impact landslides from both spatial and characteristic perspectives. Therefore, we designed a landslide impact factor assessment and screening method that integrates GeoDetector and SHAP, named GDSP method, and the principle is shown in Equation 3.
This method combines the advantages of GeoDetector and SHAP and makes up for each other’s shortcomings, which can more comprehensively calculate the influence of each factor on the landslide. Through this comprehensive analysis, we can obtain more accurate impact measurements, laying the foundation for the construction and simplification of the subsequent BN model.
BN modeling is very useful for simulating complicated causal network systems (Heckerman, 2008; Chen and Pollino, 2012). It is highly helpful for probabilistic inference and can visually express joint probability distributions of variables and their conditional independence in a graphical network structure, which can save numerous computations. A BN is a directed acyclic graph (DAG) that consists of a series of nodes, arcs, and conditional probability tables (CPTs) to indicate joint probability distributions between node factors (Friedman and Koller, 2003; Marcot and Penman, 2019). These nodes can be categorized into parent and child nodes, representing the variables' predisposing factors and consequences, respectively. The BN model can calculate the joint probability function given the nodes
In this equation,
BN structure learning represents the construction of the network topology, i.e., the relationship between the interacting nodes. The learning modalities include subjective and objective learning (Shuo-ha and Jun, 2015). Subjective learning is a method in which experts in related fields determine the network structure based on prior knowledge. Objective learning is a method in which network structure is automatically constructed from a large amount of sample data based on search methods (Huang, 2013). Landslide susceptibility modeling is a subjective activity in which the subject selects relevant indicators and methods based on a priori qualitative knowledge. Landslide hazards are affected by meteorological, geographical, and other factors, and a large quantity of observational and statistical data exists on these impact factors. Therefore, qualitative a priori knowledge and quantitative objective data should be combined in the assessment process to make the assessment more reasonable.
There are four main approaches to learning BN structures from objective data using machine learning: score search, constraint search, combination of constraint and score, and variant Naive Bayes (Xia et al., 2018; Scanagatta et al., 2019; Kitson et al., 2023). The basic idea of score search is to select a suitable search strategy, traverse all possible structures, measure each structure with a suitable scoring function, and then determine the best topology (Lee and van Beek, 2017). Common search strategies include Hill Climbing Search and Tabu Search. Hill Climbing is a heuristic local search algorithm that aims to find the optimal solution by gradually improving the current solution. The algorithm “climbs” towards the goal by continuously selecting the best solution in the neighborhood of the current solution (that is, the solution with a higher value or smaller error on the objective function) until the local optimal solution is reached or there is no better neighborhood solution, but this method is prone to falling into the local optimal solution (Gámez et al., 2011). Tabu Search is a heuristic algorithm based on local search. It introduces a tabu list to avoid falling into the local optimal solution during the search process, and guides the search through a memory mechanism to finally find the global optimal solution (Pan et al., 2019). The core idea of tabu search is to jump out of the local optimum in each step of the search and explore more possibilities in the solution space, thereby improving the optimization efficiency. Commonly used scoring functions include BIC, K2, and BDs. Bayesian Information Criterion (BIC) is a scoring method for model selection based on the likelihood function and prevents overfitting by introducing a penalty term (Lv et al., 2021). K2 is a scoring method based on Bayesian estimation, which is used to evaluate the data fit under a given network structure and is suitable for large data sets (Gao and Huang, 2020; Chen et al., 2024). BDs is the full name of Bayesian Dirichlet sparse scoring, which is characterized by the introduction of a sparsity induction mechanism to encourage the generation of a more concise and sparse network structure (Scutari, 2016).
The constraint search method uses statistical or information theory methods to quantitatively analyze the dependencies between variables and obtain the network structure that best expresses the relationship (Srivastava et al., 2023). When the amount of data is large, the number of conditional independence tests that need to be performed will grow exponentially, so it is not suitable for our research (Tian et al., 2023).
The typical algorithm that combination of constraint and score is MMHC (Max-Min Hill-Climbing), which combines the advantages of constraint search and score search (Chanda and Das, 2023). MMHC balances the advantages and disadvantages of both by constraining first and then scoring, thereby improving the accuracy of structural learning while ensuring efficiency.
Variant Naive Bayes is a model that modifies or extends the standard Naive Bayes (NB) to address its strict independence assumptions and other limitations. Typical algorithms such as TAN relax the strict independence assumptions of NB and allow dependencies between features. Specifically, TAN adds a feature tree structure on the basis of Naive Bayes, so that each feature can depend on another feature in addition to the target variable (Cao et al., 2023).
Once the BN model structure is known, parameter learning is required, i.e., determining the CPTs for each network node (Jaeger, 2007). The conditional probability directly affects the BN inference speed and accuracy. Using the actual data to learn the network parameters and update the conditional probability table is the focus of the complex BN parameter learning problem (Ji et al., 2015).
Under the condition of complete data, the primary parameter learning algorithms include Bayesian estimation (BE) and maximum likelihood estimation (MLE). The latter is particularly well-suited for large datasets, making it ideal for this study, so we use the MLE algorithm (Tian et al., 2023). The MLE method estimates the optimal model parameters by maximizing the likelihood function of the data, given a specific model. Let
In this equation,
SBAS-InSAR technology is a differential interferometry technology based on synthetic aperture radar (SAR), which is used to monitor surface deformation, especially slow surface deformation and early warning of geological hazards (Kulsoom et al., 2023; Zhang et al., 2023a). It accurately measures the deformation of the surface within a specific time period by analyzing multi-temporal SAR image data. The main steps are shown in Figure 4.
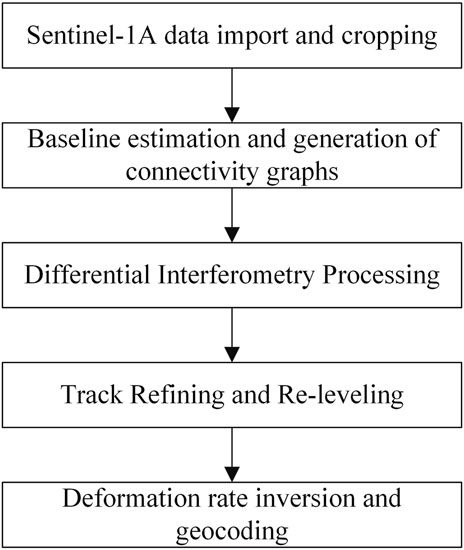
Figure 4. SBAS-InSAR technology main processing flow.
The specific principle is as follows: Select
Assume that in a given interferometric pair, the acquisition times of the primary image and the secondary image are
In the LSM, the BN model assigns a probability result of landslide occurrence to each grid element. The spatial distribution of landslide occurrence probability was mapped using ArcGIS, and the probability values were reclassified into five levels—very low (VL), low (L), medium (M), high (H), and very high (VH)—using the Geometrical Interval Classification (GIC) (Li and Shan, 2022) to make better distinctions. We used the VH as the landslide simulation occurrence area and the VL, L, M and H as the non-landslide simulation occurrence area to binarize the prediction results to obtain the confusion matrix and test the model performance using the test set, which contains landslide and non-landslide data.
We selected the ACC (Shen and Cao, 2017), MCC (Li et al., 2012), ROC curve (Hoo et al., 2017; Nhu et al., 2020) and FR (Zhang et al., 2023b; Jin et al., 2024) methods to effectively evaluate the accuracy and predictive ability of a BN model for landslide susceptibility mapping. The percentage of correctly classified to total grids is known as the ACC value. The formula is shown in Equation 9:
where
The MCC effectively measures machine learning binary classification performance. It can be used even when there are significantly varying numbers of samples in two categories (Matthews, 1975). The MCC is calculated as in Equation 10:
The value of the MCC ranges from −1 to 1. The closer the value is to 1, the better the model’s prediction performance is; a value of 0 means that it is equivalent to random prediction, and −1 means that the prediction is entirely wrong.
The most widely used and accepted technique for evaluating the effectiveness of landslide hazard prediction models is the ROC curve, which has “sensitivity” on the vertical axis and “1-specificity” on the horizontal axis. The AUC indicates the model accuracy, with values ranging from 0.5 to 1.0. The closer the curve is to the upper left, the larger the AUC value, the more accurate the model, and the better the generalization ability. The ROC curve has a very good property: when the distribution of positive and negative samples in the test set changes, the ROC curve can remain unchanged. The sensitivity and specificity were calculated as shown in Equations 11, 12:
In addition, we use the frequency ratio (FR) method to statistically categorize the landslide susceptibility mapping results. This method shows the density of landslide hazards between different risk levels. If the model is accurate, the FR value should be higher for the higher risk level and lower for the lower risk level. The FR value is calculated as shown in Equation 13:
where
Before conducting landslide susceptibility analysis, multicollinearity analysis must be performed on the impact factors, because multicollinearity problems may reduce the prediction accuracy of the model or even cause the model to fail to operate effectively. Tolerance (TOL) and variance inflation factor (VIF) are key indicators widely used to detect multicollinearity. If the TOL value is less than 0.1 or the VIF value is greater than 10, this indicates serious multicollinearity. In this study, multicollinearity analysis was performed on the selected 20 impact factors using SPSS software, and the results are shown in Table 3.
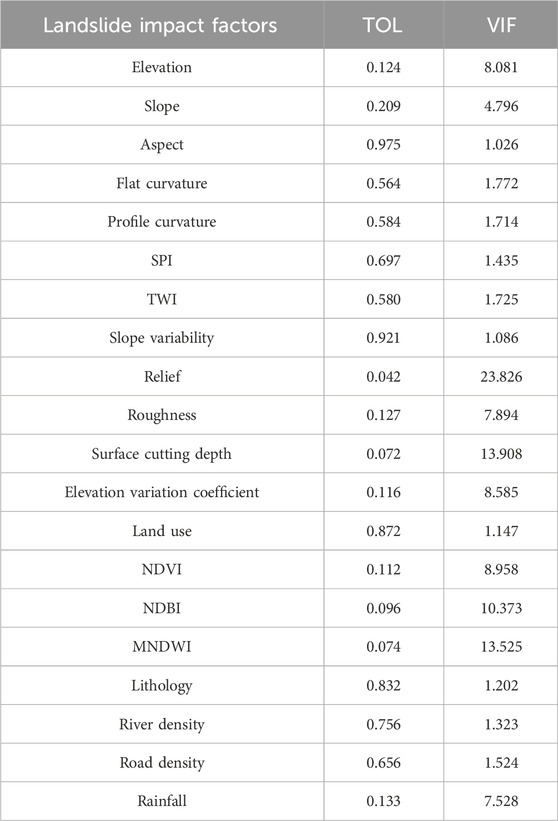
Table 3. Calculation results of multicollinearity of landslide impact factors.
The TOL of Relief, NDBI, MNDWI, and Surface cutting depth is less than 0.1 and the VIF is greater than 10, which means there is a serious collinearity problem, so these four factors need to be eliminated.
We used GeoDetector model and SHAP interpreter to calculate the importance ranking of the remaining 16 landslide impact factors, and then further evaluated and screened them using the GDSP method. We selected a total of 70,499 data from 4,147 research units (each research unit contains discrete data of 16 impact factors and data on whether a landslide occurred), input them into the GeoDetector model, and calculated the explanatory power of all factors on the spatial distribution of landslide hazards (corresponding to
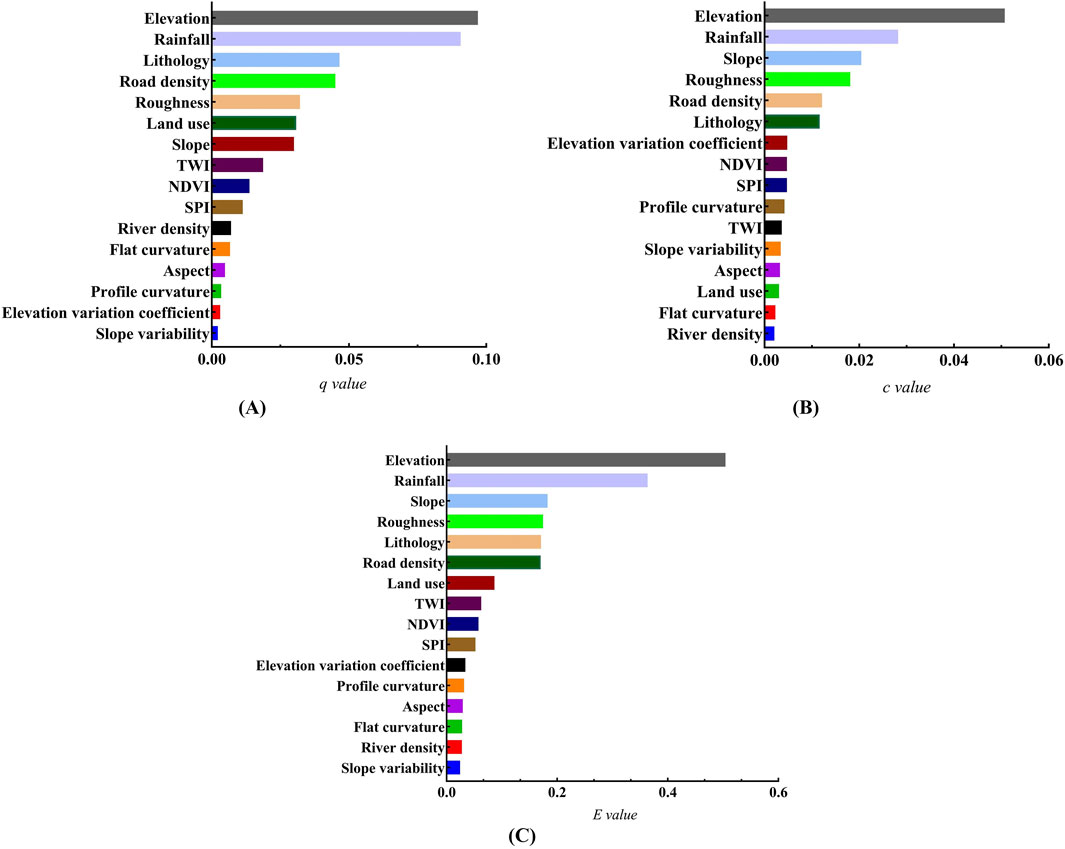
Figure 5. Importance ranking of landslide impact factors. Calculation results of GeoDetector (A), calculation results of SHAP model (B), and comprehensive calculation results of GDSP (C).
In this study, 80% of the total sample unit data set of the dominant factor was randomly selected as the training set, and the remaining 20% was the test set. For the convenience of display and calculation, we will use the first five letters instead of the full name, such as lithology, using “LITHO” instead. Based on the training set, we used a combination of subjective and objective methods to construct Bayesian network models for landslide susceptibility assessment. First, we constructed the initial network structure shown in Figure 6A based on expert knowledge to complete the subjective initial structure construction. On this basis, three major types of objective Bayesian network construction methods, score search, variant Naive Bayes, and combination of constraint and score, were used to search to complete the final network structure construction, and the results are shown in Figure 6. Figure 6B is the search result of BIC scoring and hill climbing algorithm; Figure 6C is the search result of BIC scoring and tabu search algorithm; Figure 6D is the search result of BDs scoring and hill climbing algorithm; Figure 6E is the search result of BDs scoring and tabu search algorithm; Figure 6F is the search result of K2 scoring and hill climbing Algorithm; Figure 6G is the search result of K2 score and tabu search algorithm; Figure 6H is the search result of MMHC algorithm; Figure 6I is the search result of TAN algorithm.
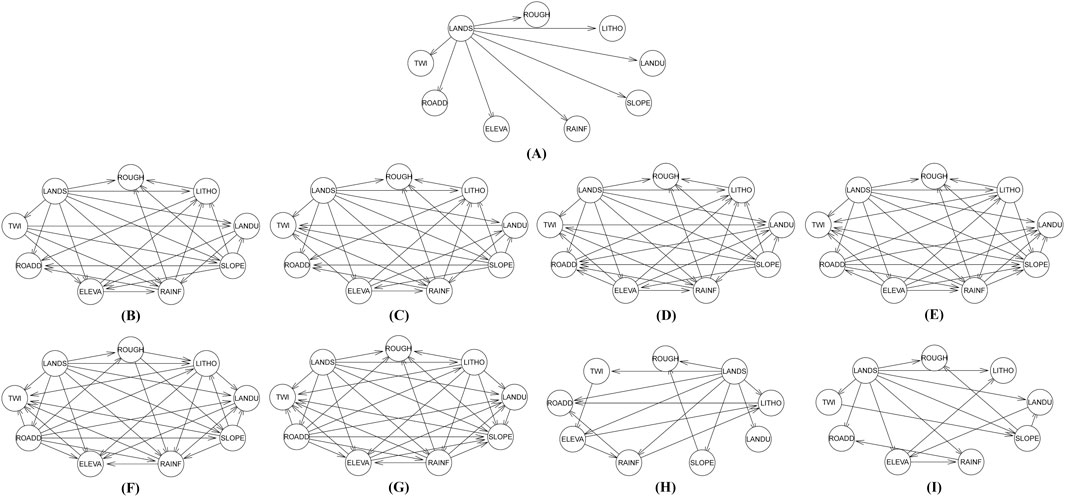
Figure 6. Results of Bayesian network structure construction. Expert experience initial structure (A), BIC scoring and hill climbing algorithm (B), BIC scoring and tabu search algorithm (C), BDs scoring and hill climbing algorithm (D), BDs scoring and tabu search algorithm (E), K2 scoring and hill climbing Algorithm (F), K2 score and tabu search algorithm (G), MMHC algorithm (H) and TAN algorithm (I).
From the Bayesian network structure diagram, we can clearly see the relationship between the various hazard impact factors. Different from the traditional hierarchical indicator system, each impact factor no longer only contributes to and affects the risk components to which it belongs. They are interconnected and integrated, and influence each other. The model fully and clearly presents this complex and uncertain synergistic influence relationship in the form of a network.
After the Bayesian network structure is constructed, parameter learning can be performed to obtain a trained Bayesian network model. Based on the training set data and the Bayesian network structure in Figures 6B–I, we apply the GeNIe analysis software to learn the parameters via the maximum likelihood estimation (MLE) algorithm, and to simulate and visualize the results. GeNIe is widely used Bayesian network development software with the advantages of stability, simplicity and high performance (https://www.bayesfusion.com/genie/). Taking the K2 score and tabu search structure as an example (corresponding to Figure 6G), the parameter learning results are shown in Figure 7. A conditional probability table (CPT) is stored in each factor node, which can be used for prediction and reasoning.
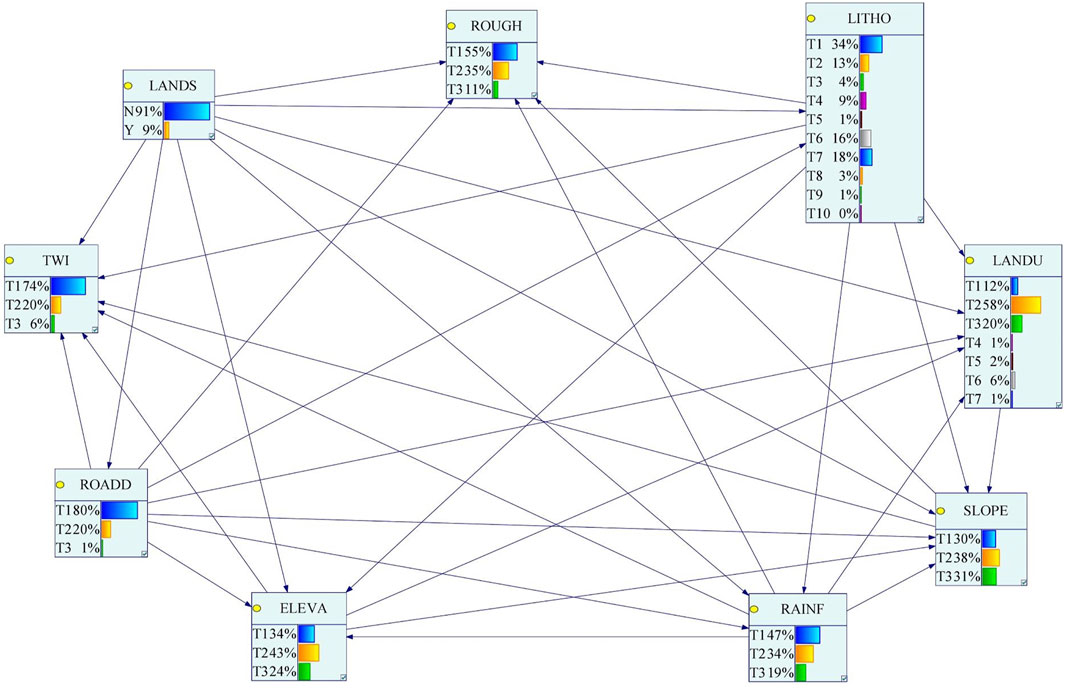
Figure 7. Using MLE algorithm for parameter learning (taking Tabu search combined with the K2 scoring function as an example).
In order to compare which Bayesian network structure construction strategy is more suitable for landslide susceptibility assessment, we used the Bayesian networks of 8 different construction strategies after training to evaluate the test set, and selected the AUC value of the ROC curve as the evaluation index. The results are shown in Figure 8. It can be seen that the score search has a larger AUC value than combination of constraint and score, and variant Naive Bayes, with higher accuracy and better performance, and is more suitable for landslide susceptibility assessment. In the score search method, the tabu search algorithm is better than the hill climbing algorithm, the K2 scoring function is better than BDs and BIC. The Bayesian network model with the tabu search algorithm combined with the K2 scoring function has the highest AUC value, reaching 0.934.
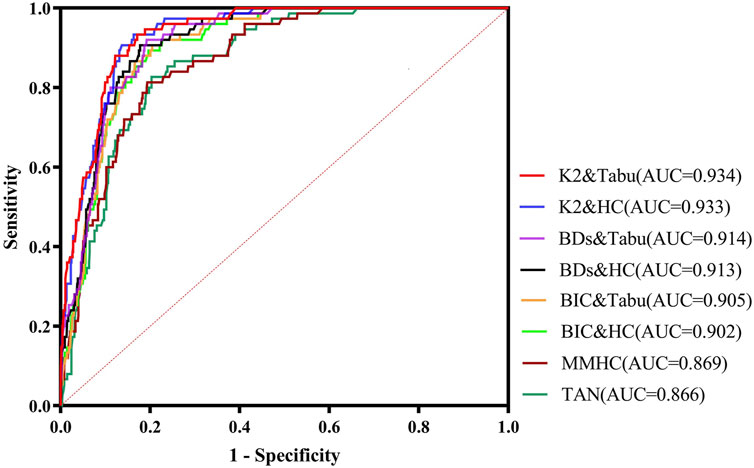
Figure 8. Comparison of Bayesian network results of 8 different construction strategies using the ROC curve of the test set.
We collected 29 descending-orbit Sentinel-1A data from January to December 2019 in the study area as the data source of the surface deformation rate factor. Based on the SBAS-InSAR technology, we calculated the deformation rate of the surface in the direction of the satellite line of sight (LOS), and the results are shown in Figure 9. Figure 9A is a connection diagram after removing the data pairs that are greatly affected by atmospheric effects and have low coherence. The main image is 14. Figure 9B is a histogram of the deformation rate calculation results after geocoding. The deformation rate curve is approximately normally distributed, and the mean is near 0. Due to the incoherence in the local area, there are null value areas in the deformation rate results. Therefore, we use the Kriging interpolation (Wu et al., 2023) method to interpolate the inverted deformation results to obtain a deformation rate map covering the entire study area, as shown in Figure 9C. In this map, the positive value is the direction close to the radar along the line of sight, and the negative value is the direction away from the radar along the line of sight.
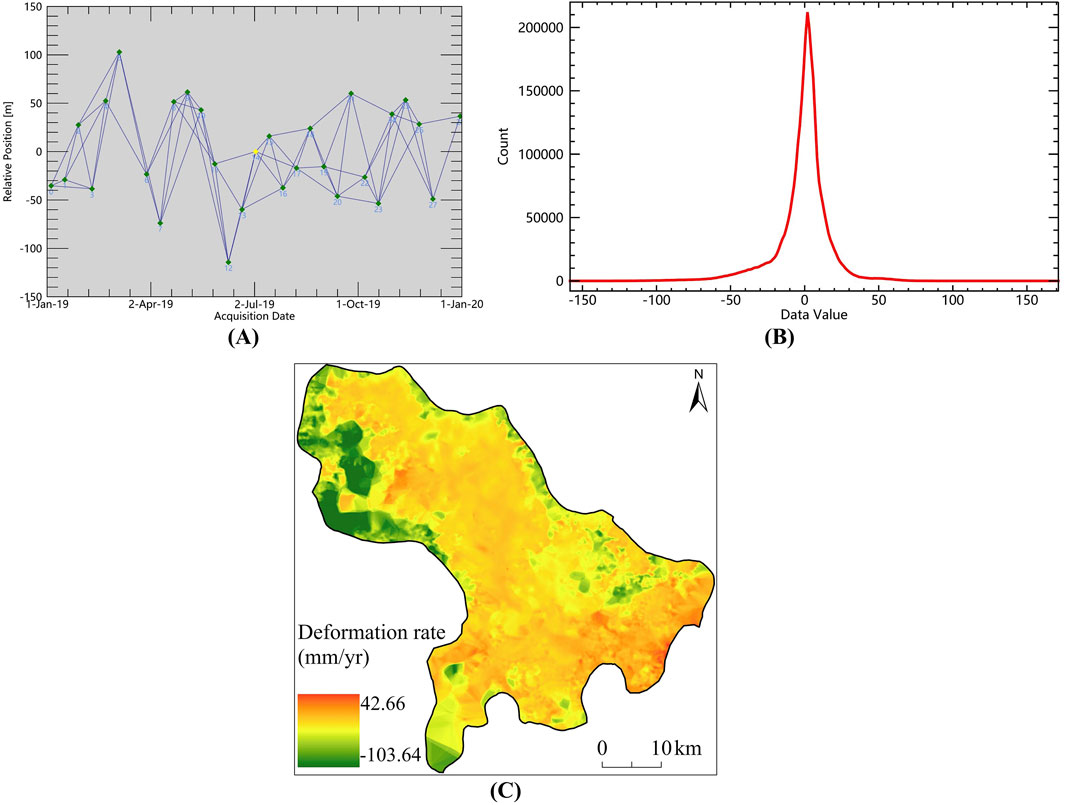
Figure 9. Deformation rate calculation results. Connectivity diagram after removing poor quality data (A), deformation rate histogram (B), and deformation rate distribution of the entire study area after Kriging interpolation (C).
The deformation rate data were first resampled to a uniform 100 m resolution, with areas covered by water bodies removed. Then, the data were discretized using Sun (2022) improved K-means method as the deformation factor, and the discrete results were: −103.64 ∼ −40.02 mm/yr for T1, -40.02 ∼ −7.77 mm/yr for T2, and -7.77 ∼ 42.66 mm/yr for T3. Combined with the other eight dominant factors, the expert knowledge in Figure 6A is used as the initial structure, and the tabu search algorithm and K2 scoring function are used to construct the final Bayesian network structure. The result is shown in Figure 10A. Then, the parameter learning was performed using the MLE algorithm, and the result is shown in Figure 10B. We named this optimized Bayesian network with deformation factor as “OPT-BN”, and the best Bayesian network before optimization obtained in Section 4.2 as “ORI-BN.”
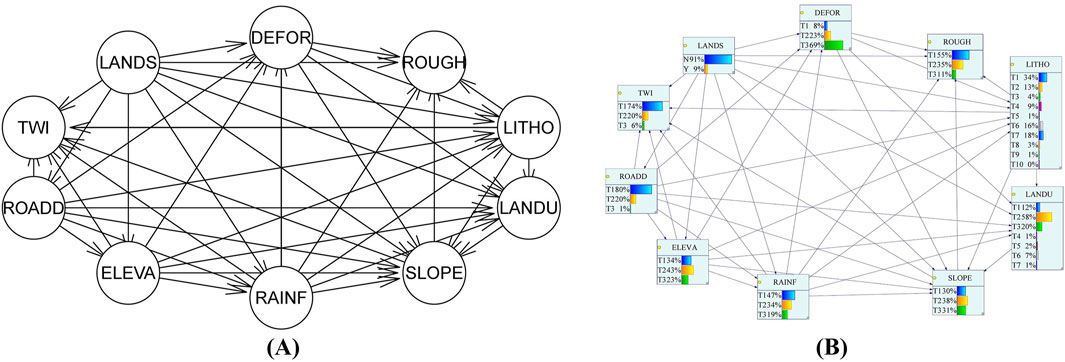
Figure 10. Bayesian network after adding deformation factors. The structure (A) and parameters (B) of the OPT-BN model.
The landslide susceptibility maps of the study area were drawn using the OPT-BN and ORI-BN models and compared. The results are shown in Figure 11. Figures 11A, B are the landslide probability distribution maps of OPT-BN and ORI-BN, respectively. In order to better distinguish, the calculation results are divided into five levels using the Geometrical Interval Classification (GIC) method: very low (VL), low (L), medium (M), high (H) and very high (VH). The landslide susceptibility zoning of OPT-BN is shown in Figure 11C, and the landslide susceptibility zoning of ORI-BN is shown in Figure 11D. It can be seen from the figure that the areas with high landslide susceptibility are mainly concentrated in the vicinity of water systems, low elevations and areas with high rainfall, while the areas with low landslide susceptibility are mainly distributed in areas far away from water systems, with wide forest distribution and high elevations.
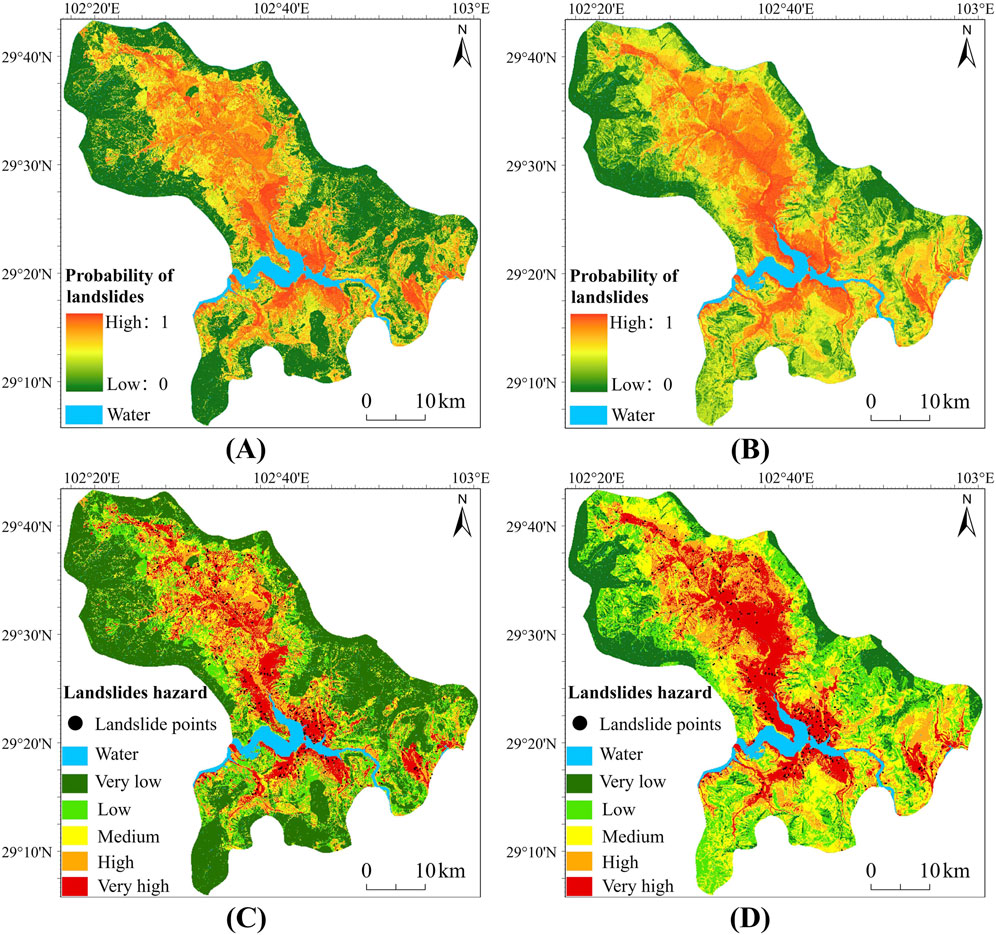
Figure 11. Landslide susceptibility mapping results. Landslide probability distribution map of OPT-BN (A), landslide probability distribution map of ORI-BN (B), landslide susceptibility zoning map of OPT-BN (C), landslide susceptibility zoning map of ORI-BN (D).
The accuracy of OPT-BN and ORI-BN is compared by confusion matrix, ACC, MCC, and AUC values. The results are shown in Table 4. All indicators of OPT-BN (ACC = 0.90, MCC = 0.56, AUC = 0.94) are better than ORI-BN (ACC = 0.83, MCC = 0.40, AUC = 0.93). The statistical analysis tools were used to obtain the area and proportion of each risk level, the number and proportion of landslides in each risk level, and the FR was calculated, which together presented a detail of landslide susceptibility zoning map. The results are shown in Table 5. It can be seen that the landslide number ratio (
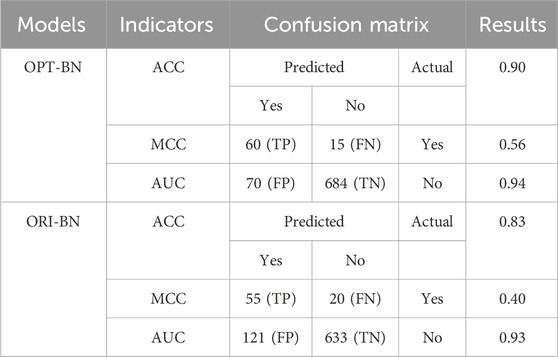
Table 4. Confusion matrix, ACC, MCC, and AUC value calculation results of OPT-BN and ORI-BN models.
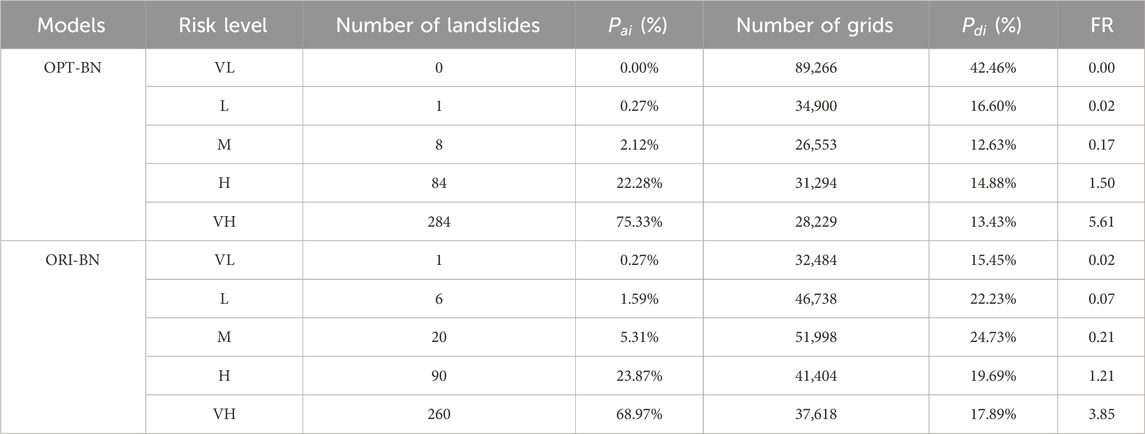
Table 5. Statistics of landslide susceptibility zoning results of OPT-BN and ORI-BN models.
Reverse inference is a special function of Bayesian network, which can identify the factor state category and its probability distribution where landslide is more likely to occur. We use the better OPT-BN model for reverse inference. Based on the OPT-BN model simulation interface shown in Figure 10B, we set the N (no landslide) and Y (landslide) levels of the target node “LANDS” to 100% respectively. The reverse inference results are shown in Table 6. When landslide hazards change from non-occurrence to occurrence, the probability of lower elevation categories, lower slope categories, plow land and impervious cover categories of land use, medium road density categories, limestone and siltstone categories of lithology, higher rainfall categories, lower roughness categories, and deformation rate values ranging from −7.77 to 42.66 mm/yr increases significantly, reflecting that these environmental conditions may promote the occurrence of landslides. The probability of forest categories in land use types decreases significantly, reflecting that these environmental conditions may inhibit the occurrence of landslides.
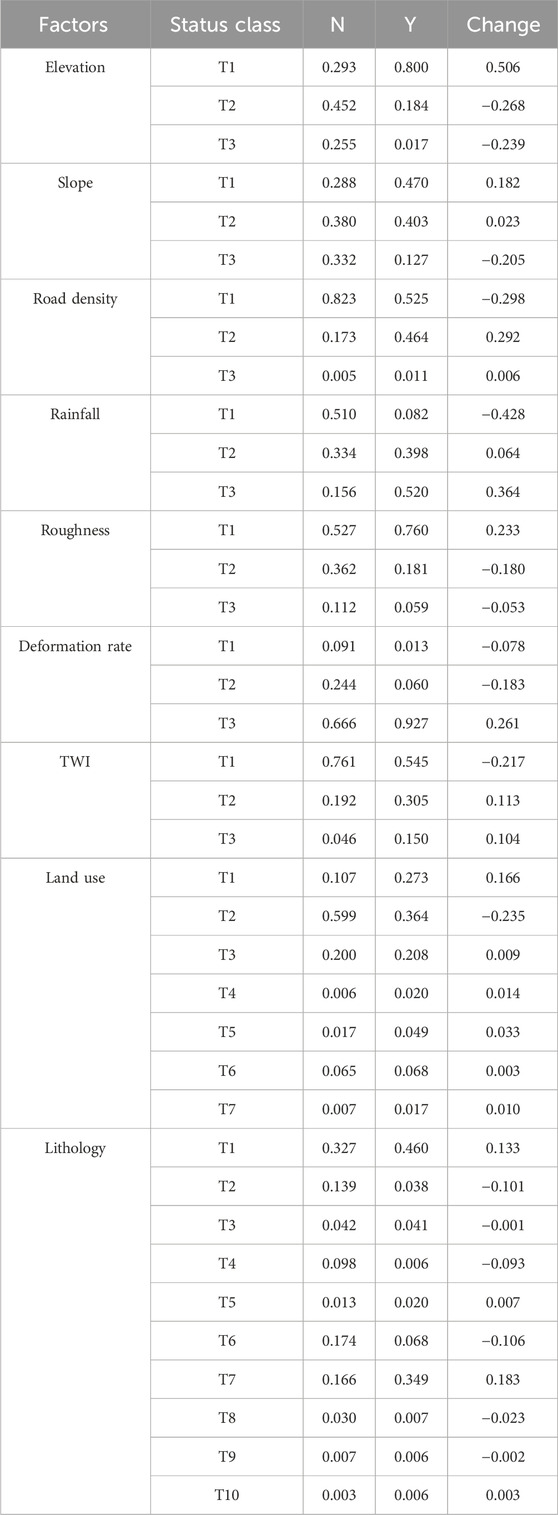
Table 6. Reverse inference results for the OPT-BN model.
This study proposes a landslide susceptibility assessment method using SBAS-InSAR technology to optimize the Bayesian network. In this research process, we divide it into 4 parts and implement it step by step. In the first step, we preliminarily screen the landslide impact factors through multicollinearity analysis, and then further assess and screen the remaining landslide impact factors by integrating GeoDetector and SHAP as the GDSP method to obtain the landslide dominant factors. In the second step, we use a combination of subjective and objective methods to construct the Bayesian network structure based on the dominant factors, that is, to build the network structure by combining expert experience and data-driven methods, and use the MLE algorithm for parameter learning. By comparing eight objective Bayesian network structure construction methods, including score search (hill climbing or tabu search strategy combined with K2, BDs and BIC score functions), variant Naive Bayes (TAN) and combination of constraint and score (MMHC), we obtained the Bayesian network construction strategy with the highest accuracy. In the third step, we used SBAS-InSAR technology to obtain surface deformation rate data based on Sentinel-1A data. After Kriging interpolation and discretization, it was used as a deformation factor, combined with the dominant factor, and the structure was constructed based on expert knowledge and the highest accuracy K2&Tabu obtained in the second step, and the MLE algorithm parameter learning was used. The optimized Bayesian network (OPT-BN) using SBAS-InSAR was obtained. In the fourth step, we compared ORI-BN (Bayesian network before optimization) with OPT-BN (Bayesian network after optimization), and finally adopted the better OPT-BN for reverse inference.
In summary, the OPT-BN proposed in this study integrates the Bayesian network model, GeoDetector model, SHAP interpreter, and SBAS-InSAR technology. This model has significant advantages in the screening and interpretation of landslide impact factors, landslide susceptibility assessment, and hazard prevention and mitigation decision-making assistance. First, Bayesian network (BN), as a graphical model based on probability theory, has been widely used in many fields, including landslide susceptibility analysis, due to its ability to handle uncertainty, express complex dependencies between variables and strong reasoning ability. In addition, GeoDetector model and SHAP interpreter, as effective tools, are also widely used in landslide susceptibility analysis and other environmental factors. The GeoDetector model quantifies the contribution of each impact factor to landslide occurrence by analyzing the spatial distribution of variables in spatial data, helping decision makers better understand the triggering mechanism of landslides. SHAP interpreter, as a model interpretation tool based on game theory, can provide feature importance scores for each prediction in the machine learning model and quantify the contribution of each factor to the prediction results. SHAP not only reveals the importance of features, but also shows how each factor can positively or negatively affect the model prediction results, providing in-depth explanatory analysis. Finally, SBAS-InSAR technology, as an advanced surface deformation monitoring tool, is also widely used in landslide monitoring and geological hazard assessment. Using SBAS-InSAR technology, researchers can identify dynamic changes in landslide-prone areas, providing critical data support for hazard warning and prevention measures. As shown in Table 4, Table 5; Figure 11, the proposed OPT-BN (ACC = 0.90, MCC = 0.56, AUC = 0.94) performs better than ORI-BN (ACC = 0.83, MCC = 0.40, AUC = 0.93) in both the test set and landslide susceptibility mapping.
This study comprehensively considers the advantages and disadvantages of the GeoDetector model and the SHAP interpreter, designs and uses the GDSP method to analyze the comprehensive influence of various factors on landslide hazards in order to eliminate redundant factors. The results shown in Figure 5 show that the elevation factor has the greatest comprehensive influence on landslide hazards, which is consistent with the results of earlier studies (Rong et al., 2020; Zhou et al., 2021; Xiao et al., 2024).
BN has the unique function of reverse inference. It can identify the environmental conditions under which landslides are more likely to occur. Correspondingly, it can also be concluded that the conditions under which landslides are less likely to occur are of great significance for hazard prevention and mitigation decision support. In this study, through OPT-BN reverse inference, it was found that the probability of landslide hazards in low categories of elevation,medium and high categories of road density and high categories of rainfall increased when landslide hazards went from no occurrence to occurrence, indicating that landslides are more likely to occur in areas with low elevation categories, medium and high road density categories and high rainfall categories, which is consistent with the results of earlier studies (Xiao et al., 2024). The reduced probability of forests in land use types reflects that the probability of landslides under forest cover may be relatively low, which is consistent with the results of earlier studies (Nilaweera and Nutalaya, 1999). In addition, it can be seen from Figure 11 that areas with high risk of landslide hazards are mainly concentrated near water systems, in areas with lower elevations and areas with greater rainfall. This is mainly because the areas near water systems are eroded by rivers, and rainwater flows to lower elevation areas due to gravity, resulting in soil content. The amount of water can easily exceed the stability critical value. Moreover, strong human engineering activities such as road construction near the water system and in areas with lower elevations make landslides more susceptible. The areas with low landslide susceptibility are mainly distributed in areas far away from water systems, with wide forest distribution and high elevation. These areas are easier to evacuate rainwater and are less affected by human activities, showing relatively low susceptibility. The OPT-BN reverse inference results proposed in this paper are mutually confirmed by the landslide susceptibility mapping results and previous studies, and the results are reliable. The unique reverse inference of the Bayesian network can obtain the state or range in which any environmental factor is prone to landslides, which is a function that other machine learning models do not have. Therefore, the OPT-BN proposed in this paper has good application potential for hazard prevention and mitigation decision-making assistance.
In the GeoDetector model and SHAP interpreter calculations, the importance ranking of features is based on the contribution of the variable’s spatial distribution and the degree of influence on the prediction results, respectively. When comparing the GeoDetector model results with the SHAP interpreter calculation results, the ranking of key factors such as elevation and rainfall remains consistent in both methods. However, less significant factors such as flat curvature and slope variability are ranked differently between the two methods.
These inconsistencies may be due to the GeoDetector model’s greater focus on the interpretation of spatial distribution, and its results reflect the spatial dependence of factors on landslide occurrence. Therefore, GeoDetector is more inclined to capture the nonlinear and interactive effects of factors in different regions. SHAP interpreter, on the other hand, analyzes from the perspective of the contribution of features to the model prediction results, focusing on evaluating the impact of individual features on the overall model prediction. Therefore, SHAP may highlight those features that have a strong explanatory power for the prediction results in a statistical sense, even if they are not necessarily significant in spatial distribution. SHAP interpreter provides a more detailed view of the model, not only ranking the importance of features, but also revealing the positive or negative impact of each feature on the prediction results. Figure 12 is the relationship between the feature value of the landslide impact factor and the SHAP value output by the SHAP interpreter. The analysis shows that there is a significant negative correlation between the elevation, slope and roughness in the study area and the occurrence of landslides, indicating that the lower the elevation, slope and roughness, the more obvious the positive impact on the occurrence of landslides. There is a significant positive correlation between rainfall and road density and the occurrence of landslides, indicating that the higher the rainfall and road density, the more obvious the positive impact on the occurrence of landslides. At the same time, this also confirms the results of OPT-BN reverse inference to a certain extent.
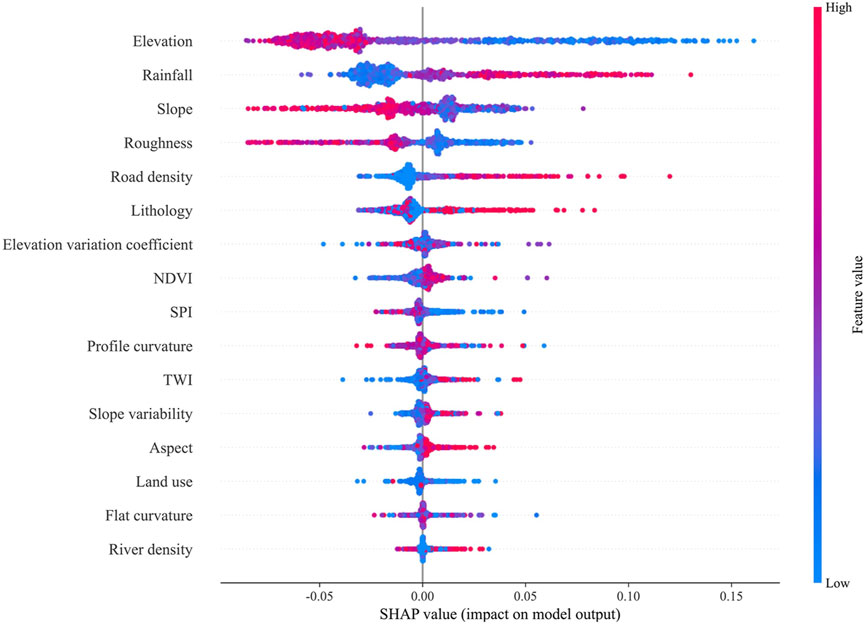
Figure 12. A comprehensive relationship diagram of the feature value and SHAP value output by the SHAP interpreter.
Although the OPT-BN proposed in this paper has achieved certain results in landslide susceptibility assessment (ACC = 0.90, MCC = 0.56, AUC = 0.94), it still has some defects and limitations. First, the establishment of the model mainly relies on existing data sets, especially the data on meteorology, soil, geology and human activities may not be comprehensive enough, resulting in the failure to fully consider the impact of some key factors. Second, although we used multiple algorithms for comparison, the selection and parameter tuning of the model may not cover all possible configurations, thus affecting the performance and generalization ability of the model. In addition, although the 20 landslide impact factors selected in the study cover multiple aspects such as precipitation, surface characteristics and human activities, in some specific areas, additional factors may still need to be introduced to improve the accuracy and adaptability of the prediction. Finally, due to the complexity and variability of landslide events, our model may not be able to fully capture all potential interactions and nonlinear relationships, thus affecting the reliability of the prediction results. Therefore, future research needs to make further improvements in data quality, model parameter optimization and factor comprehensiveness.
This study uses SBAS-InSAR technology to optimize the Bayesian network and establishes a framework for landslide susceptibility assessment. The framework first screens the landslide impact factors through multicollinearity analysis, and then uses the GDSP method (combined with GeoDetector and SHAP) to further screen the dominant factors; then, combining expert knowledge and objective methods, the Bayesian network structure is constructed based on the dominant factors, and the highest accuracy construction strategy is obtained by comparing 8 construction methods; then, based on this strategy, the deformation factor calculated by SBAS-InSAR technology is added, and the optimized Bayesian network (OPT-BN) is constructed through MLE parameter learning; finally, OPT-BN is used to carry out landslide susceptibility mapping, accuracy verification and reverse inference. The results showed that:
(1) According to the calculation results of the GDSP method, the top eight factors impact landslides are ranked from the largest to the smallest according to the comprehensive influence degree
(2) According to the comparison results of the Bayesian network construction strategies (score search, variant Naive Bayes, and combination of constraint and score), it is concluded that K2&Tabu in the score search has the highest accuracy.
(3) The optimized Bayesian network (OPT-BN) using SBAS-InSAR technique had ACC = 0.90, MCC = 0.56, and AUC = 0.94 which were better than the unoptimized Bayesian network ORI-BN (ACC = 0.83, MCC = 0.40, and AUC = 0.93). And from the statistical results of susceptibility zoning, it can be seen that the susceptibility zoning results of OPT-BN are more concentrated in the distribution of landslides in high risk level than those of ORI-BN, indicating that the calculation results of OPT-BN are more reasonable.
(4) According to the results of susceptibility mapping, the high risk level of landslide hazards in Hanyuan County are mainly concentrated in areas near water systems, with low elevation and high rainfall, while the low risk level are mainly distributed in areas far from water systems, with wide forest distribution and high elevation. According to the results of Bayesian network reverse inference, landslides are more likely to occur in areas with lower elevation categories; plow land and impervious cover categories of land use; higher rainfall categories and deformation rate value range of −7.77 ∼ 42.66 mm/yr categories. Relevant departments should take certain hazard prevention and mitigation emergency management measures for these environmental conditions.
The original contributions presented in the study are included in the article/supplementary material, further inquiries can be directed to the corresponding author.
XG: Conceptualization, Data curation, Investigation, Methodology, Software, Writing–original draft, Writing–review and editing. BW: Conceptualization, Funding acquisition, Project administration, Writing–original draft, Writing–review and editing. WD: Funding acquisition, Investigation, Project administration, Validation, Writing–original draft, Writing–review and editing. YL: Data curation, Funding acquisition, Project administration, Validation, Writing–original draft, Writing–review and editing.
The author(s) declare that financial support was received for the research, authorship, and/or publication of this article. The author(s) declare that financial support was received for the research, authorship, and/or publication of this article. This research was supported by the National Natural Science Foundation of China (42301478), the Natural Science Foundation of the Jiangsu Higher Education Institutions of China (22KJB170016), and the Postgraduate Research and Practice Innovation Program of Jiangsu Province (SJCX23_0581).
We are grateful to Professors Peng Gong and JinFeng Wang for providing the open access land use data and the free GeoDetector software, respectively.
The authors declare that the research was conducted in the absence of any commercial or financial relationships that could be construed as a potential conflict of interest.
The author(s) declare that no Generative AI was used in the creation of this manuscript.
All claims expressed in this article are solely those of the authors and do not necessarily represent those of their affiliated organizations, or those of the publisher, the editors and the reviewers. Any product that may be evaluated in this article, or claim that may be made by its manufacturer, is not guaranteed or endorsed by the publisher.
Akinci, H., Kilicoglu, C., and Dogan, S. (2020). Random forest-based landslide susceptibility mapping in coastal regions of Artvin, Turkey. ISPRS Int. J. geo-information 9 (9), 553. doi:10.3390/ijgi9090553
Althuwaynee, O. F., Pradhan, B., and Lee, S. (2012). Application of an evidential belief function model in landslide susceptibility mapping. Comput. and Geosciences 44, 120–135. doi:10.1016/j.cageo.2012.03.003
Ayalew, L., Yamagishi, H., and Ugawa, N. (2004). Landslide susceptibility mapping using GIS-based weighted linear combination, the case in Tsugawa area of Agano River, Niigata Prefecture, Japan. Landslides 1, 73–81. doi:10.1007/s10346-003-0006-9
Batar, A. K., and Watanabe, T. (2021). Landslide susceptibility mapping and assessment using geospatial platforms and weights of evidence (WoE) method in the Indian Himalayan Region: recent developments, gaps, and future directions. ISPRS Int. J. Geo-Information 10 (3), 114. doi:10.3390/ijgi10030114
Brock, J., Schratz, P., Petschko, H., Muenchow, J., Micu, M., and Brenning, A. (2020). The performance of landslide susceptibility models critically depends on the quality of digital elevation models. Geomatics, Nat. Hazards Risk 11 (1), 1075–1092. doi:10.1080/19475705.2020.1776403
Broeckx, J., Vanmaercke, M., Duchateau, R., and Poesen, J. (2018). A data-based landslide susceptibility map of Africa. Earth-Science Rev. 185, 102–121. doi:10.1016/j.earscirev.2018.05.002
Bui, D. T., Tsangaratos, P., Nguyen, V.-T., Van Liem, N., and Trinh, P. T. (2020). Comparing the prediction performance of a Deep Learning Neural Network model with conventional machine learning models in landslide susceptibility assessment. Catena 188, 104426. doi:10.1016/j.catena.2019.104426
Cao, Y., Wang, X., Wang, Y., Fan, S., Wang, H., Yang, Z., et al. (2023). Analysis of factors affecting the severity of marine accidents using a data-driven Bayesian network. Ocean. Eng. 269, 113563. doi:10.1016/j.oceaneng.2022.113563
Cellek, S. (2021). “The effect of aspect on landslide and its relationship with other parameters,” in Landslides. IntechOpen.
Chanda, K., and Das, P. (2023). “Dimensionality reduction of correlated meteorological variables by Bayesian network-based graphical modeling,” in Handbook of hydroinformatics (Elsevier), 69–76.
Chang, F., Li, H., Dong, S., and Yin, H. (2024). Pre-Co-and post-failure deformation analysis of the catastrophic xinjing open-pit coal mine landslide, China, from optical and radar remote sensing observations. Remote Sens. 17 (1), 19. doi:10.3390/rs17010019
Chang, Z. L. (2023). “Regional rainfall-induced landslide hazard assessment method based on data-driven and forming mechanism,”. [Nan Chang]: Nanchang University. [PhD thesis].
Chen, S. H., and Pollino, C. A. (2012). Good practice in Bayesian network modelling. Environ. Model. and Softw. 37, 134–145. doi:10.1016/j.envsoft.2012.03.012
Chen, W., Chai, H., Zhao, Z., Wang, Q., and Hong, H. (2016). Landslide susceptibility mapping based on GIS and support vector machine models for the Qianyang County, China. Environ. Earth Sci. 75, 474–513. doi:10.1007/s12665-015-5093-0
Chen, W., and Li, Y. (2020). GIS-based evaluation of landslide susceptibility using hybrid computational intelligence models. Catena 195, 104777. doi:10.1016/j.catena.2020.104777
Chen, W., Panahi, M., Tsangaratos, P., Shahabi, H., Ilia, I., Panahi, S., et al. (2019). Applying population-based evolutionary algorithms and a neuro-fuzzy system for modeling landslide susceptibility. Catena 172, 212–231. doi:10.1016/j.catena.2018.08.025
Chen, X., Ma, X., Jia, L., Zhang, Z., Chen, F., and Wang, R. (2024). Causative analysis of freight railway accident in specific scenes using a data-driven Bayesian network. Reliab. Eng. and Syst. Saf. 243, 109781. doi:10.1016/j.ress.2023.109781
Cowell, R. G., Dawid, P., Lauritzen, S. L., and Spiegelhalter, D. J. (2007). Probabilistic networks and expert systems: exact computational methods for Bayesian networks. Springer Science and Business Media.
Cui, J., Liu, Y., Sun, J., Hu, D., and He, H. (2021). Study on feng shui (geomantic) suitability evaluation of mausoleums in nanjing city based on GIS. ISPRS Int. J. Geo-Information 10 (11), 752. doi:10.3390/ijgi10110752
Dai, F., Lee, C. F., and Ngai, Y. Y. (2002). Landslide risk assessment and management: an overview. Eng. Geol. 64 (1), 65–87. doi:10.1016/s0013-7952(01)00093-x
Das, I., Stein, A., Kerle, N., and Dadhwal, V. K. (2012). Landslide susceptibility mapping along road corridors in the Indian Himalayas using Bayesian logistic regression models. Geomorphology 179, 116–125. doi:10.1016/j.geomorph.2012.08.004
Dey, S., Das, S., and Roy, S. K. (2024). Landslide susceptibility assessment in Eastern Himalayas, India: a comprehensive exploration of four novel hybrid ensemble data driven techniques integrating explainable artificial intelligence approach. Environ. Earth Sci. 83 (22), 641–725. doi:10.1007/s12665-024-11945-z
Dijkshoorn, K., van Engelen, V., and Huting, J. (2008). Soil and landform properties for LADA partner countries. ISRIC Rep. 6, 1–28. Available at: https://scholar.google.com/scholar?hl=en&as_sdt=0%2C5&q=Dijkshoorn%2C+K.%2C+van+Engelen%2C+V.%2C+and+Huting%2C+J.+%282008%29.+Soil+and+landform+properties+for+LADA+partner+countries.+ISRIC+Rep.+6%2C+1%E2%80%9328.&btnG=
Friedman, N., and Koller, D. (2003). Being Bayesian about network structure. A Bayesian approach to structure discovery in Bayesian networks. Mach. Learn. 50, 95–125. doi:10.1023/a:1020249912095
Fuju, X., Duning, X., and Xiuzhen, L. (2007). Forest crown density restoration and influencing factors in the burned area of northern Great Hing′ an Mountains of China. Acta Ecol. Sin. 27 (3), 879–886. doi:10.1016/s1872-2032(07)60025-0
Gameiro, S., Riffel, E. S., de Oliveira, G. G., and Guasselli, L. A. (2021). Artificial neural networks applied to landslide susceptibility: the effect of sampling areas on model capacity for generalization and extrapolation. Appl. Geogr. 137, 102598. doi:10.1016/j.apgeog.2021.102598
Gámez, J. A., Mateo, J. L., and Puerta, J. M. (2011). Learning Bayesian networks by hill climbing: efficient methods based on progressive restriction of the neighborhood. Data Min. Knowl. Discov. 22, 106–148. doi:10.1007/s10618-010-0178-6
Gao, F., and Huang, D. (2020). “A node sorting method for k2 algorithm in bayesian network structure learning,” in 2020 IEEE international Conference on artificial Intelligence and computer applications ICAICA: ieee, 106–110.
Goetz, J., Brenning, A., Petschko, H., and Leopold, P. (2015). Evaluating machine learning and statistical prediction techniques for landslide susceptibility modeling. Comput. and geosciences 81, 1–11. doi:10.1016/j.cageo.2015.04.007
Gong, P., Liu, H., Zhang, M., Li, C., Wang, J., Huang, H., et al. (2019). Stable classification with limited sample: transferring a 30-m resolution sample set collected in 2015 to mapping 10-m resolution global land cover in 2017. Sci. Bull. 64 (6), 370–373. doi:10.1016/j.scib.2019.03.002
Guo, Z., Shi, Y., Huang, F., Fan, X., and Huang, J. (2021). Landslide susceptibility zonation method based on C5. 0 decision tree and K-means cluster algorithms to improve the efficiency of risk management. Geosci. Front. 12 (6), 101249. doi:10.1016/j.gsf.2021.101249
Han, L., Zhang, J., Zhang, Y., and Lang, Q. (2019). Applying a series and parallel model and a Bayesian networks model to produce disaster chain susceptibility maps in the Changbai Mountain area, China. Water 11 (10), 2144. doi:10.3390/w11102144
Hasekioğulları, G. D., and Ercanoglu, M. (2012). A new approach to use AHP in landslide susceptibility mapping: a case study at Yenice (Karabuk, NW Turkey). Nat. Hazards 63, 1157–1179. doi:10.1007/s11069-012-0218-1
He, M., Ren, S., and Tao, Z. (2021). Remote monitoring and forecasting system of Newton force for landslide geological hazards and its engineering application. Chin. J. Rock Mech. Eng. 40 (11), 2161–2172. doi:10.13722/j.cnki.jrme.2020.1189
He, Y., and Beighley, R. E. (2008). GIS-based regional landslide susceptibility mapping: a case study in southern California. Earth Surf. Process. Landforms J. Br. Geomorphol. Res. Group 33 (3), 380–393. doi:10.1002/esp.1562
Heckerman, D. (2008). A tutorial on learning with Bayesian networks. Innovations Bayesian Netw. Theory Appl., 33–82. doi:10.1007/978-3-540-85066-3_3
Heckerman, D., Geiger, D., and Chickering, D. M. (1995). Learning Bayesian networks: the combination of knowledge and statistical data. Mach. Learn. 20, 197–243. doi:10.1007/bf00994016
Hong, H., Miao, Y., Liu, J., and Zhu, A.-X. (2019). Exploring the effects of the design and quantity of absence data on the performance of random forest-based landslide susceptibility mapping. Catena 176, 45–64. doi:10.1016/j.catena.2018.12.035
Hoo, Z. H., Candlish, J., and Teare, D. (2017). What Is an ROC Curve?. Emerg. Med. J. 34, 357–359. doi:10.1136/emermed-2017-206735
Hu, Q., Zhou, Y., Wang, S., and Wang, F. (2020). Machine learning and fractal theory models for landslide susceptibility mapping: case study from the Jinsha River Basin. Geomorphology 351, 106975. doi:10.1016/j.geomorph.2019.106975
Hu, Z., Tang, G., and Lu, G. (2014). A new geographical language: a perspective of GIS. J. Geogr. Sci. 24 (3), 560–576. doi:10.1007/s11442-014-1106-2
Huang, F., Chen, J., Liu, W., Huang, J., Hong, H., and Chen, W. (2022a). Regional rainfall-induced landslide hazard warning based on landslide susceptibility mapping and a critical rainfall threshold. Geomorphology 408, 108236. doi:10.1016/j.geomorph.2022.108236
Huang, F., Pan, L., Fan, X., Jiang, S.-H., Huang, J., and Zhou, C. (2022b). The uncertainty of landslide susceptibility prediction modeling: suitability of linear conditioning factors. Bull. Eng. Geol. Environ. 81 (5), 182. doi:10.1007/s10064-022-02672-5
Huang, F., Xiong, H., Yao, C., Catani, F., Zhou, C., and Huang, J. (2023). Uncertainties of landslide susceptibility prediction considering different landslide types. J. Rock Mech. Geotechnical Eng. 15 (11), 2954–2972. doi:10.1016/j.jrmge.2023.03.001
Huang, Y., and Zhao, L. (2018). Review on landslide susceptibility mapping using support vector machines. Catena 165, 520–529. doi:10.1016/j.catena.2018.03.003
Huang, Y.-p. (2013). Survey on Bayesian network development and application. Trans. Beijing Inst. Technol. 33 (12), 1211–1219. doi:10.3969/j.issn.1001-0645.2013.12.001
Huo, H., and Sun, C. (2021). Spatiotemporal variation and influencing factors of vegetation dynamics based on Geodetector: a case study of the northwestern Yunnan Plateau, China. Ecol. Indic. 130, 108005. doi:10.1016/j.ecolind.2021.108005
Jaeger, M. (2007). “Parameter learning for relational bayesian networks,” in Proceedings of the 24th international conference on Machine learning. Editor M. Jaeger, 369–376.
Jensen, F. V., and Nielsen, T. (2007). Bayesian networks and decision graphs. New york: Springer-Verlag.
Ji, Z., Xia, Q., and Meng, G. (2015). “A review of parameter learning methods in Bayesian network,” in Advanced intelligent computing theories and applications: 11th international conference, ICIC 2015, fuzhou, China, august 20-23, 2015. Proceedings, Part III 11. Editors Z. Ji, Q. Xia, and G. Meng (Springer), 3–12.
Jin, B., Yin, K., Gui, L., Zhao, B., Guo, B., and Zeng, T. (2024). Susceptibility assessment of land subsidence of transmission line towers in the salt lake area based on remote sensing interpretation. Earth Sci. 49 (2), 538–549. doi:10.3799/dqkx.2022.109
Kalantar, B., Pradhan, B., Naghibi, S. A., Motevalli, A., and Mansor, S. (2018). Assessment of the effects of training data selection on the landslide susceptibility mapping: a comparison between support vector machine (SVM), logistic regression (LR) and artificial neural networks (ANN). Geomatics, Nat. Hazards Risk 9 (1), 49–69. doi:10.1080/19475705.2017.1407368
Khanna, K., Martha, T. R., Roy, P., and Kumar, K. V. (2021). Effect of time and space partitioning strategies of samples on regional landslide susceptibility modelling. Landslides 18, 2281–2294. doi:10.1007/s10346-021-01627-3
Kim, J.-C., Lee, S., Jung, H.-S., and Lee, S. (2018). Landslide susceptibility mapping using random forest and boosted tree models in Pyeong-Chang, Korea. Geocarto Int. 33 (9), 1000–1015. doi:10.1080/10106049.2017.1323964
Kitson, N. K., Constantinou, A. C., Guo, Z., Liu, Y., and Chobtham, K. (2023). A survey of Bayesian Network structure learning. Artif. Intell. Rev. 56 (8), 8721–8814. doi:10.1007/s10462-022-10351-w
Korzeniowska, K., Pfeifer, N., and Landtwing, S. (2018). Mapping gullies, dunes, lava fields, and landslides via surface roughness. Geomorphology 301, 53–67. doi:10.1016/j.geomorph.2017.10.011
Kulsoom, I., Hua, W., Hussain, S., Chen, Q., Khan, G., and Shihao, D. (2023). SBAS-InSAR based validated landslide susceptibility mapping along the Karakoram Highway: a case study of Gilgit-Baltistan, Pakistan. Sci. Rep. 13 (1), 3344. doi:10.1038/s41598-023-30009-z
Lee, C., and van Beek, P. (2017). “Metaheuristics for score-and-search Bayesian network structure learning,” in Advances in artificial intelligence: 30th Canadian conference on artificial intelligence, Canadian AI 2017 (Springer), 129–141. Edmonton, AB, Canada, May 16-19, 2017, Proceedings 30.
Li, C., Li, L., and Zhang, C. (2023). Deformation analysis of guobu slope based on SBAS-InSAR. Acad. J. Sci. Technol. 5 (3), 126–131. doi:10.54097/ajst.v5i3.7803
Li, S., and Shan, J. (2022). Adaptive geometric interval classifier. ISPRS Int. J. Geo-Information 11 (8), 430. doi:10.3390/ijgi11080430
Li, Y., Xia, J., Zhang, S., Yan, J., Ai, X., and Dai, K. (2012). An efficient intrusion detection system based on support vector machines and gradually feature removal method. Expert Syst. Appl. 39 (1), 424–430. doi:10.1016/j.eswa.2011.07.032
Li, Z. (2022). Extracting spatial effects from machine learning model using local interpretation method: an example of SHAP and XGBoost. Comput. Environ. Urban Syst. 96, 101845. doi:10.1016/j.compenvurbsys.2022.101845
Li, Z., Yao, C., Zhu, X., Gao, G., and Hu, S. (2022). A decision support model for ship navigation in Arctic waters based on dynamic risk assessment. Ocean. Eng. 244, 110427. doi:10.1016/j.oceaneng.2021.110427
Liao, M., Wen, H., and Yang, L. (2022). Identifying the essential conditioning factors of landslide susceptibility models under different grid resolutions using hybrid machine learning: a case of Wushan and Wuxi counties, China. Catena 217, 106428. doi:10.1016/j.catena.2022.106428
Lin, N., Zhang, D., Feng, S., Ding, K., Tan, L., Wang, B., et al. (2023). Rapid landslide extraction from high-resolution remote sensing images using SHAP-OPT-XGBoost. Remote Sens. 15 (15), 3901. doi:10.3390/rs15153901
Lin, Q., Zhang, Z., Yang, Z., Zhang, X., Rong, X., Yang, S., et al. (2024). Co-seismic landslides susceptibility evaluation of Bayesian random forest considering InSAR deformation: a case study of the Luding Ms6. 8 earthquake. Geomatics, Nat. Hazards Risk 15 (1), 2383783. doi:10.1080/19475705.2024.2383783
Liu, W., Zhang, Y., Liang, Y., Sun, P., Li, Y., Su, X., et al. (2022). Landslide risk assessment using a combined approach based on InSAR and random forest. Remote Sens. 14 (9), 2131. doi:10.3390/rs14092131
Liu, Y., Fang, R., Su, Y., and Xiao, R. (2021a). Machine learning based model for warning of regional landslide disasters. J. Eng. Geol. 29 (1), 116–124. doi:10.13544/j.cnki.jeg.2020-533
Liu, Y., Zhang, W., Zhang, Z., Xu, Q., and Li, W. (2021b). Risk factor detection and landslide susceptibility mapping using Geo-Detector and Random Forest Models: the 2018 Hokkaido eastern Iburi earthquake. Remote Sens. 13 (6), 1157. doi:10.3390/rs13061157
Lombardo, L., and Mai, P. M. (2018). Presenting logistic regression-based landslide susceptibility results. Eng. Geol. 244, 14–24. doi:10.1016/j.enggeo.2018.07.019
Luo, W., and Liu, C.-C. (2018). Innovative landslide susceptibility mapping supported by geomorphon and geographical detector methods. Landslides 15, 465–474. doi:10.1007/s10346-017-0893-9
Luti, T., Segoni, S., Catani, F., Munafò, M., and Casagli, N. (2020). Integration of remotely sensed soil sealing data in landslide susceptibility mapping. Remote Sens. 12 (9), 1486. doi:10.3390/rs12091486
Lv, Y., Miao, J., Liang, J., Chen, L., and Qian, Y. (2021). BIC-based node order learning for improving Bayesian network structure learning. Front. Comput. Sci. 15 (6), 156337. doi:10.1007/s11704-020-0268-6
Ma, S., Chen, J., Wu, S., and Li, Y. (2023). Landslide susceptibility prediction using machine learning methods: a case study of landslides in the Yinghu Lake Basin in Shaanxi. Sustainability 15 (22), 15836. doi:10.3390/su152215836
Mandal, S., Mondal, S., Mandal, S., and Mondal, S. (2019). “Artificial neural network (ann) model and landslide susceptibility,” in Statistical approaches for landslide susceptibility assessment and prediction, 123–133.
Marcot, B. G., and Penman, T. D. (2019). Advances in Bayesian network modelling: integration of modelling technologies. Environ. Model. and Softw. 111, 386–393. doi:10.1016/j.envsoft.2018.09.016
Matthews, B. W. (1975). Comparison of the predicted and observed secondary structure of T4 phage lysozyme. Biochimica Biophysica Acta (BBA)-Protein Struct. 405 (2), 442–451. doi:10.1016/0005-2795(75)90109-9
Nainggolan, R., Perangin-angin, R., Simarmata, E., and Tarigan, A. F. (2019). “Improved the performance of the K-means cluster using the sum of squared error (SSE) optimized by using the Elbow method,” in Journal of physics: conference series. Editors R. Nainggolan, R. Perangin-angin, E. Simarmata, and A. F. Tarigan (IOP Publishing).012015. doi:10.1088/1742-6596/1361/1/012015
Nguyen, B.-Q.-V., and Kim, Y.-T. (2021). Landslide spatial probability prediction: a comparative assessment of naive Bayes, ensemble learning, and deep learning approaches. Bull. Eng. Geol. Environ. 80, 4291–4321. doi:10.1007/s10064-021-02194-6
Nhu, V.-H., Hoang, N.-D., Nguyen, H., Ngo, P. T. T., Bui, T. T., Hoa, P. V., et al. (2020). Effectiveness assessment of Keras based deep learning with different robust optimization algorithms for shallow landslide susceptibility mapping at tropical area. Catena 188, 104458. doi:10.1016/j.catena.2020.104458
Nilaweera, N., and Nutalaya, P. (1999). Role of tree roots in slope stabilisation. Bull. Eng. Geol. Environ. 57, 337–342. doi:10.1007/s100640050056
Niu, Q., Dang, X., Li, Y., Zhang, Y., Lu, X., and Gao, W. (2018). Suitability analysis for topographic factors in loess landslide research: a case study of Gangu County, China. Environ. Earth Sci. 77, 294–312. doi:10.1007/s12665-018-7462-y
Ortiz, J. A. V., and Martínez-Graña, A. M. (2018). A neural network model applied to landslide susceptibility analysis (Capitanejo, Colombia). Geomatics, Nat. Hazards and Risk 9 (1), 1106–1128. doi:10.1080/19475705.2018.1513083
Pacheco Quevedo, R., Velastegui-Montoya, A., Montalván-Burbano, N., Morante-Carballo, F., Korup, O., and Daleles Rennó, C. (2023). Land use and land cover as a conditioning factor in landslide susceptibility: a literature review. Landslides 20 (5), 967–982. doi:10.1007/s10346-022-02020-4
Pan, J., Rao, H., Zhang, X., Li, W., Wei, Z., Zhang, Z., et al. (2019). Application of a Tabu search-based Bayesian network in identifying factors related to hypertension. Medicine 98 (25), e16058. doi:10.1097/md.0000000000016058
Park, S.-J., Lee, C.-W., Lee, S., and Lee, M.-J. (2018). Landslide susceptibility mapping and comparison using decision tree models: a Case Study of Jumunjin Area, Korea. Remote Sens. 10 (10), 1545. doi:10.3390/rs10101545
Parsa, A. B., Movahedi, A., Taghipour, H., Derrible, S., and Mohammadian, A. K. (2020). Toward safer highways, application of XGBoost and SHAP for real-time accident detection and feature analysis. Accid. Analysis and Prev. 136, 105405. doi:10.1016/j.aap.2019.105405
Petley, D. (2012). Global patterns of loss of life from landslides. Geology 40 (10), 927–930. doi:10.1130/g33217.1
Pourret, O., Na, P., and Marcot, B. (2008). Bayesian networks: a practical guide to applications. John Wiley and Sons.
Pradhan, B., and Lee, S. (2010). Regional landslide susceptibility analysis using back-propagation neural network model at Cameron Highland, Malaysia. Landslides 7 (1), 13–30. doi:10.1007/s10346-009-0183-2
Rabby, Y. W., Li, Y., Abedin, J., and Sabrina, S. (2022). Impact of land use/land cover change on landslide susceptibility in Rangamati Municipality of Rangamati District, Bangladesh. ISPRS Int. J. Geo-Information 11 (2), 89. doi:10.3390/ijgi11020089
Reichenbach, P., Rossi, M., Malamud, B. D., Mihir, M., and Guzzetti, F. (2018). A review of statistically-based landslide susceptibility models. Earth-science Rev. 180, 60–91. doi:10.1016/j.earscirev.2018.03.001
Riegel, R. P., Alves, D. D., Schmidt, B. C., de Oliveira, G. G., Haetinger, C., Osório, D. M. M., et al. (2020). Assessment of susceptibility to landslides through geographic information systems and the logistic regression model. Nat. Hazards 103, 497–511. doi:10.1007/s11069-020-03997-8
Rong, G., Li, K., Han, L., Alu, S., Zhang, J., and Zhang, Y. (2020). Hazard mapping of the rainfall–landslides disaster chain based on GeoDetector and bayesian network models in shuicheng county, China. Water 12 (9), 2572. doi:10.3390/w12092572
Scanagatta, M., Salmerón, A., and Stella, F. (2019). A survey on Bayesian network structure learning from data. Prog. Artif. Intell. 8 (4), 425–439. doi:10.1007/s13748-019-00194-y
Scutari, M. (2016). “An empirical-Bayes score for discrete Bayesian networks,” in Conference on probabilistic graphical models: pmlr, 438–448.
Shahabi, H., Ahmadi, R., Alizadeh, M., Hashim, M., Al-Ansari, N., Shirzadi, A., et al. (2023). Landslide susceptibility mapping in a mountainous area using machine learning algorithms. Remote Sens. 15 (12), 3112. doi:10.3390/rs15123112
Shang, H., Liu, S., Zhong, J., Tsangaratos, P., Ilia, I., Chen, W., et al. (2024). Application of Naive Bayes, kernel logistic regression and alternation decision tree for landslide susceptibility mapping in Pengyang County, China. Nat. Hazards 120, 12043–12079. doi:10.1007/s11069-024-06672-4
Shen, X., and Cao, L. (2017). Tree-species classification in subtropical forests using airborne hyperspectral and LiDAR data. Remote Sens. 9 (11), 1180. doi:10.3390/rs9111180
Shirzadi, A., Bui, D. T., Pham, B. T., Solaimani, K., Chapi, K., Kavian, A., et al. (2017). Shallow landslide susceptibility assessment using a novel hybrid intelligence approach. Environ. Earth Sci. 76, 60–18. doi:10.1007/s12665-016-6374-y
Shou, K.-J., and Lin, J.-F. (2020). Evaluation of the extreme rainfall predictions and their impact on landslide susceptibility in a sub-catchment scale. Eng. Geol. 265, 105434. doi:10.1016/j.enggeo.2019.105434
Shuo-ha, L., and Jun, Z. (2015). Review of Bayesian networks structure learning. Appl. Res. Computers/Jisuanji Yingyong Yanjiu 32 (3). doi:10.3969/j.issn.1001-3695.2015.03.001
Song, Y., Gong, J., Gao, S., Wang, D., Cui, T., Li, Y., et al. (2012). Susceptibility assessment of earthquake-induced landslides using Bayesian network: a case study in Beichuan, China. Comput. and Geosciences 42, 189–199. doi:10.1016/j.cageo.2011.09.011
Srivastava, A., Chockalingam, S. P., and Aluru, S. (2023). A parallel framework for constraint-based Bayesian network learning via Markov blanket discovery. IEEE Trans. Parallel Distributed Syst. 34 (6), 1699–1715. doi:10.1109/tpds.2023.3244135
Su, Y., Li, T., Cheng, S., and Wang, X. (2020). Spatial distribution exploration and driving factor identification for soil salinisation based on geodetector models in coastal area. Ecol. Eng. 156, 105961. doi:10.1016/j.ecoleng.2020.105961
Sun, S. K. (2022). Application of data mining technology in landslide monitoring and early warning. [Jiao Zuo]: Henan Polytechnic University. [master's thesis].
Tang, X., Wang, L., Wang, H., Yuan, Y., Huang, D., and Zhang, J. (2024). Predicted climate change will increase landslide risk in hanjiang river basin, China. J. Earth Sci. 35 (4), 1334–1354. doi:10.1007/s12583-021-1511-2
Thai Pham, B., Tien Bui, D., and Prakash, I. (2018). Landslide susceptibility modelling using different advanced decision trees methods. Civ. Eng. Environ. Syst. 35 (1-4), 139–157. doi:10.1080/10286608.2019.1568418
Thinsungnoena, T., Kaoungkub, N., Durongdumronchaib, P., Kerdprasopb, K., and Kerdprasopb, N. (2015). The clustering validity with silhouette and sum of squared errors. learning 3 (7), 44–51. doi:10.12792/iciae2015.012
Thomas, A. V., Saha, S., Danumah, J. H., Raveendran, S., Prasad, M. K., Ajin, R., et al. (2021). Landslide susceptibility zonation of Idukki district using GIS in the aftermath of 2018 Kerala floods and landslides: a comparison of AHP and frequency ratio methods. J. Geovisualization Spatial Analysis 5, 21–27. doi:10.1007/s41651-021-00090-x
Tian, C., Li, X., Du, Y., Li, M., Xie, Y., and Xia, J. (2023). Assessment of tropical cyclone disaster risk based on the Bayesian network and GIS. J. Trop. Oceanogr. 42 (5), 17–29. doi:10.11978/2022092
Wang, J.-F., and Hu, Y. (2012). Environmental health risk detection with GeogDetector. Environ. Model. and Softw. 33, 114–115. doi:10.1016/j.envsoft.2012.01.015
Wang, J. F., Li, X. H., Christakos, G., Liao, Y. L., Zhang, T., Gu, X., et al. (2010). Geographical detectors-based health risk assessment and its application in the neural tube defects study of the Heshun Region, China. Int. J. Geogr. Inf. Sci. 24 (1), 107–127. doi:10.1080/13658810802443457
Wang, X., Zhang, L., Wang, S., and Lari, S. (2014). Regional landslide susceptibility zoning with considering the aggregation of landslide points and the weights of factors. Landslides 11, 399–409. doi:10.1007/s10346-013-0392-6
Wei, Y., Qiu, H., Liu, Z., Huangfu, W., Zhu, Y., Liu, Y., et al. (2024). Refined and dynamic susceptibility assessment of landslides using InSAR and machine learning models. Geosci. Front. 15 (6), 101890. doi:10.1016/j.gsf.2024.101890
Wu, R.-j., Xia, J., Chen, K.-y., Chen, J.-j., Liu, Q.-f., and Jin, W.-l. (2023). Spatiotemporal interpolation of surface chloride content for marine RC structures based on non-uniform spatiotemporal Kriging interpolation method. Struct. Saf. 103, 102329. doi:10.1016/j.strusafe.2023.102329
Xia, K., Gao, H., Liu, C., Yuan, J., Sun, J., Wang, H.-T., et al. (2018). A novel superhard tungsten nitride predicted by machine-learning accelerated crystal structure search. Sci. Bull. 63 (13), 817–824. doi:10.1016/j.scib.2018.05.027
Xiao, X., Zou, Y., Huang, J., Luo, X., Yang, L., Li, M., et al. (2024). An interpretable model for landslide susceptibility assessment based on Optuna hyperparameter optimization and Random Forest. Geomatics, Nat. Hazards Risk 15 (1), 2347421. doi:10.1080/19475705.2024.2347421
Yang, G., Zhou, W., and Fang, J. (2018). Assessment of landslide susceptibility based on information quantity model and data normalization. J. Geo-Information Sci. 20, 674–683. doi:10.12082/dqxxkx.2018.170535
Yang, J., Song, C., Yang, Y., Xu, C., Guo, F., and Xie, L. (2019). New method for landslide susceptibility mapping supported by spatial logistic regression and GeoDetector: a case study of Duwen Highway Basin, Sichuan Province, China. Geomorphology 324, 62–71. doi:10.1016/j.geomorph.2018.09.019
Ye, F., Fu, W.-X., Zhou, H.-F., Liu, Y., Ba, R.-J., and Zheng, S. (2021). The “8·21” rainfall-induced Zhonghaicun landslide in Hanyuan County of China: surface features and genetic mechanisms. Landslides 18 (10), 3421–3434. doi:10.1007/s10346-021-01722-5
Zhang, M., Cao, X., Peng, L., and Niu, R. (2016). Landslide susceptibility mapping based on global and local logistic regression models in Three Gorges Reservoir area, China. Environ. Earth Sci. 75, 958–1011. doi:10.1007/s12665-016-5764-5
Zhang, Z., Hu, C., Wu, Z., Zhang, Z., Yang, S., and Yang, W. (2023a). Monitoring and analysis of ground subsidence in Shanghai based on PS-InSAR and SBAS-InSAR technologies. Sci. Rep. 13 (1), 8031. doi:10.1038/s41598-023-35152-1
Zhang, Z., Qian, Z., Wei, Y., Zhu, X., and Wang, L. (2023b). Landslide susceptibility evaluation considering optimal combination of influencing factors: a case study of Shuicheng District. Sci. Technol. Eng. 23 (10), 4091–4099. doi:10.12404/j.issn.1671-1815.2023.23.10.04091
Zhao, L., Wu, X., Niu, R., Wang, Y., and Zhang, K. (2020). Using the rotation and random forest models of ensemble learning to predict landslide susceptibility. Geomatics, Nat. Hazards Risk 11 (1), 1542–1564. doi:10.1080/19475705.2020.1803421
Zheng, Y. C. (2014). Research on schedule risk of large engineering projects based on Bayesian network. [Cheng Du]: Southwest Jiaotong University. [master's thesis].
Zhou, X., Wen, H., Zhang, Y., Xu, J., and Zhang, W. (2021). Landslide susceptibility mapping using hybrid random forest with GeoDetector and RFE for factor optimization. Geosci. Front. 12 (5), 101211. doi:10.1016/j.gsf.2021.101211
Zhu, A.-X., Miao, Y., Yang, L., Bai, S., Liu, J., and Hong, H. (2018). Comparison of the presence-only method and presence-absence method in landslide susceptibility mapping. Catena 171, 222–233. doi:10.1016/j.catena.2018.07.012
Keywords: landslide susceptibility, Bayesian network, GeoDetector model, SHAP interpreter, reverse inference
Citation: Gao X, Wang B, Dai W and Liu Y (2025) A landslide susceptibility assessment method using SBAS-InSAR to optimize Bayesian network. Front. Environ. Sci. 13:1522949. doi: 10.3389/fenvs.2025.1522949
Received: 05 November 2024; Accepted: 05 February 2025;
Published: 27 February 2025.
Edited by:
Erhan Sener, Süleyman Demirel University, TürkiyeReviewed by:
Francesco Finazzi, University of Bergamo, ItalyCopyright © 2025 Gao, Wang, Dai and Liu. This is an open-access article distributed under the terms of the Creative Commons Attribution License (CC BY). The use, distribution or reproduction in other forums is permitted, provided the original author(s) and the copyright owner(s) are credited and that the original publication in this journal is cited, in accordance with accepted academic practice. No use, distribution or reproduction is permitted which does not comply with these terms.
*Correspondence: Bo Wang, MDAzMjU0QG51aXN0LmVkdS5jbg==
Disclaimer: All claims expressed in this article are solely those of the authors and do not necessarily represent those of their affiliated organizations, or those of the publisher, the editors and the reviewers. Any product that may be evaluated in this article or claim that may be made by its manufacturer is not guaranteed or endorsed by the publisher.
Research integrity at Frontiers
Learn more about the work of our research integrity team to safeguard the quality of each article we publish.