 Jianfeng Li
 Yongxin Hu
 Jian Li5
- 1Technology Innovation Center for Land Engineering and Human Settlements, Shaanxi Land Engineering Construction Group Co., Ltd and Xi’an Jiaotong University, Xi’an, China
- 2School of Civil Engineering and Architecture, Shaanxi University of Technology, Hanzhong, China
- 3Institute of Land Engineering and Technology, Shaanxi Provincial Land Engineering Construction Group Co., Ltd., Xi’an, China
- 4Bureau of Housing and Urban-Rural Development and Management, LiuBa, China
- 5Shaanxi Geological and Mineral Sixth Geological Team Co., Ltd., Xi’an, China
With the intensification of global climate change and environmental degradation, the goals of carbon peaking and carbon neutrality have become crucial strategies for promoting sustainable development in various countries. However, most studies on ecological environment quality (EEQ) focus on urban areas, with limited attention to county-level analyses, particularly regarding the complex interactions between climate, topography, and human activities. This study aims to address this gap by investigating the spatiotemporal evolution and multidimensional driving factors of EEQ in 107 counties of Shaanxi Province, China. Using the Google Earth Engine (GEE) platform and MODIS imagery, along with methods such as the Remote Sensing Ecological Index (RSEI), Hurst exponent, and GeoDetector, this study analyzed the evolutionary characteristics and driving mechanisms of county-level EEQ, and explored improvement and management strategies for different types of county EEQ within the framework of dual carbon goals. The results indicate that: 1) From 2000 to 2020, the overall EEQ in Shaanxi Province showed a fluctuating upward trend, improving from a moderate level to a good level, although some counties experienced slight degradation from 2010 to 2020. 2) The spatial distribution of county-level EEQ displayed a “low-high-low-high” gradient from north to south, indicating superior ecological conditions in the southern and central-northern counties, while northern regions faced significant ecological challenges. 3) The future trend of EEQ in Shaanxi Province is expected to be one of continuous improvement, although attention must be paid to the ongoing degradation risks in highly urbanized areas. 4) The spatial differentiation of county-level EEQ is primarily driven by climate factors and influenced by the synergistic effects of multiple factors. For counties with varying levels of EEQ, it is essential to comprehensively consider the interactions between climate, topography, and human factors, and to implement tailored carbon sequestration enhancement strategies. The results not only propose targeted approaches to reinforce carbon storage but also offer valuable policy guidance, thereby making a significant contribution to achieving the dual carbon goals at the county level.
1 Introduction
The intensification of global climate change and environmental degradation presents a significant challenge for contemporary society (Zhao and You, 2020; Raven and Wagner, 2021; Arshad et al., 2024). Climate change profoundly impacts global ecosystems and places considerable pressure on economic development, food security, and social stability in various countries (Gebara et al., 2023; Tang H. et al., 2024; Wang et al., 2024a). In response to these pressing issues, the concept of “dual carbon” goals has emerged as a pivotal strategy in global environmental policy (Xinfa and Xue, 2022; Wang P. P. et al., 2024). The dual carbon goals refer to the commitment to achieve peak carbon dioxide emissions and attain carbon neutrality within specified timeframes (Zhao et al., 2022). Within the context of China, the world’s largest emitter of carbon dioxide, the dual carbon goals hold particular importance. China has pledged to peak its carbon emissions before 2030 and achieve carbon neutrality by 2060, aligning with the global commitments outlined in the Paris Agreement (Xinfa et al., 2023). This ambitious objective necessitates a transformation of the energy structure, industrial upgrades, and substantial improvements in ecological protection and carbon sequestration capacity (Li et al., 2023c). A high-quality ecological environment can effectively mitigate carbon emissions and enhance the stability and resilience of ecosystems by bolstering natural carbon sequestration capabilities (Dang et al., 2024). In central China, Shaanxi Province, with its complex geographic features and diverse landforms, faces numerous challenges in improving ecological quality (Zou et al., 2022b). Consequently, examining changes in EEQ and enhancement strategies in the context of dual carbon goals in Shaanxi can offer valuable theoretical insights and practical experiences for the province and beyond, and is of significant importance for achieving global carbon reduction targets.
The quality of the ecological environment is a key indicator of a country or region’s capacity for sustainable development (Fang et al., 2023; Gebara and Laurent, 2023; Li et al., 2023b). Substantial progress has been made in research on EEQ, resulting in the development of various methods for monitoring and evaluation, including the Analytic Hierarchy Process, Ecological Footprint Analysis, and Integrated Ecological Index (Tothova and Heglasova, 2022; Zhang Z. et al., 2022; Roesch et al., 2023). However, traditional methods in long-term ecological monitoring and analysis face significant challenges, such as difficulties in data acquisition, strong subjectivity in indicator selection, and limitations in the accuracy of evaluation results (Beaussier et al., 2019; Liao and Jiang, 2020; Tothova and Heglasova, 2022). In contrast, satellite remote sensing technology offers significant advantages, including ease of data acquisition, broad spatial coverage, short revisit periods, and high spatial resolution, making it an indispensable tool for environmental monitoring, ecological surveys, and resource assessments (Zhang H. et al., 2022; Dube et al., 2023). Researchers globally have extensively explored the feasibility of using remote sensing indices to monitor and assess environmental quality. For example, the Normalized Difference Vegetation Index (NDVI) and Enhanced Vegetation Index (EVI) are used to monitor vegetation growth (Wang et al., 2024b), the Standardized Precipitation Evapotranspiration Index (SPEI) is applied to drought assessment (Qin et al., 2023), and the Land Surface Temperature (LST) index is utilized to study the urban heat island effect (Wang et al., 2023). Xu Hanqiu’s Remote Sensing Ecological Index (RSEI) (Xu HanQiu, 2013), which integrates greenness, wetness, dryness, and heat, provides a more comprehensive, accurate, and objective measure of ecological quality, gaining widespread recognition. RSEI has been applied across various spatial scales—national, provincial, and urban clusters—for EEQ evaluation (Liu et al., 2023; Sun J. et al., 2023; Zhang N. et al., 2023). The traditional method of obtaining RSEI involves downloading remote sensing images and processing them using software like ENVI or ArcGIS (Kamran and Yamamoto, 2023). While this method is practical for small-scale and short-term studies, it presents limitations in data acquisition and analysis for large areas (e.g., provincial, national, or global scales) over extended time periods. The GEE platform (Gorelick et al., 2017), designed for satellite imagery and geospatial data processing, overcomes these limitations by providing a 40-year data span with global coverage, making it highly advantageous for long-term, large-scale remote sensing ecological research (Zhang N. et al., 2023; Airiken and Li, 2024).
Despite considerable progress in research on EEQ, several critical issues remain unresolved. Firstly, most studies have focused on urban areas (Morandi et al., 2020; Casanelles-Abella et al., 2021; Geng et al., 2022), overlooking assessments and comparative analyses of EEQ at the county level and smaller spatial scales. County-level analysis is essential as it captures spatial heterogeneity and localized ecological dynamics that broader urban or regional studies may overlook. Counties, as fundamental administrative units, possess distinct socio-economic and environmental characteristics that influence ecological quality. By concentrating on the county level, our study addresses a significant gap in the existing literature, enabling a more nuanced understanding of ecological variations and facilitating the development of targeted, region-specific environmental policies and strategies. This granular approach enhances the ability to manage and improve EEQ effectively across diverse local contexts, promoting more equitable and sustainable ecological development. Secondly, while significant efforts have been devoted to exploring the driving mechanisms behind dynamic changes in EEQ (Geng et al., 2022; Yang et al., 2023; Guo et al., 2024), comprehensive and systematic analyses of the interactions between topography, climate, and human activities are still lacking. Furthermore, existing research on long-term strategies for improving EEQ predominantly emphasizes ecological protection (Xu et al., 2020; Dong et al., 2024), with insufficient consideration of these strategies within the context of the dual carbon goals.
This study focused on the EEQ at the county level in Shaanxi Province from 2000 to 2020, aiming to reveal its spatiotemporal evolution patterns and multidimensional driving mechanisms. Guided by the dual carbon goals, the research explored strategies to improve EEQ, tailored to different counties. The main objectives were: 1) to analyze the spatiotemporal heterogeneity and sustainability characteristics of county-level EEQ in Shaanxi Province, utilizing the GEE platform and MODIS imagery; 2) to quantify the impact of topography, climate, and human activities on the spatial distribution of EEQ using the Geodetector; and 3) to propose targeted and practical strategies for improving and managing EEQ, aligned with the dual carbon goals. These findings aim to provide scientific support and practical guidance for the sustainable development of Shaanxi Province and similar regions globally.
2 Materials and methods
2.1 Study area
Shaanxi Province (Figure 1), situated in central China along the middle reaches of the Yellow River, serves as a crucial geographic link between the eastern and western regions of the country (Li Y. et al., 2023). Economically, it plays a pivotal role in driving development in western China, with a diverse industrial base encompassing high-tech industries, manufacturing, energy production, and modern agriculture. The province is distinguished by its unique geographical features, with the terrain transitioning from the Loess Plateau in the north to the Guanzhong Plain, and finally to the Qinba Mountains in the south, creating a variety of landforms and a complex ecological landscape. Additionally, Shaanxi’s counties exhibit a range of development models, including industrial, agricultural, ecological, and energy-focused types. These diverse county types display significant differences in economic development, industrial structure, and ecological pressures, making Shaanxi a representative and valuable case for studying EEQ.
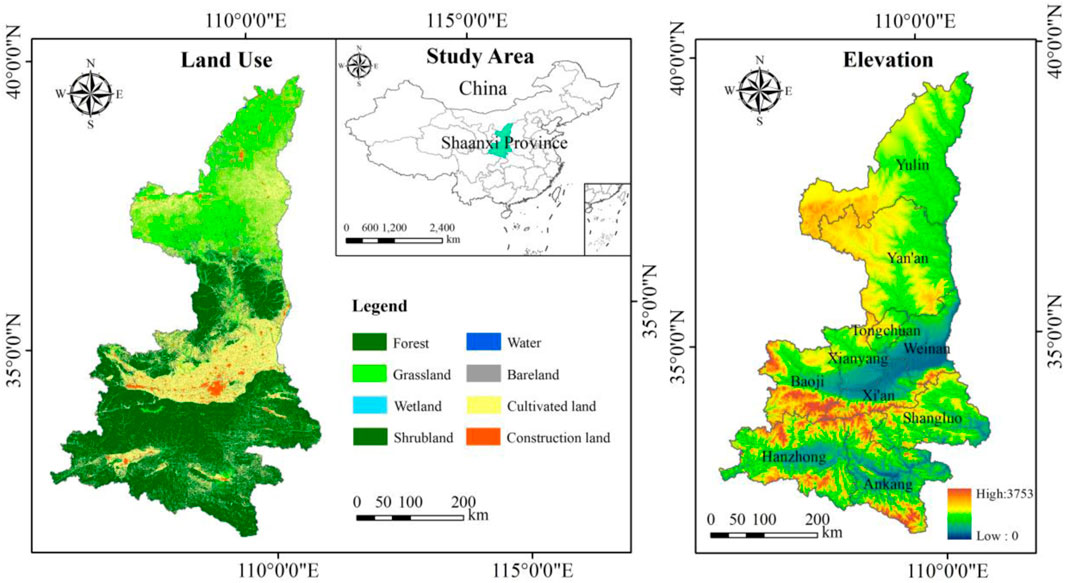
Figure 1. The locations of the study areas.
2.2 Data
This study utilized five data types: MODIS, topography, climate, human activities, and administrative boundaries, as detailed in Table 1. MODIS data were primarily employed to assess the RSEI, with MOD09A1 used to calculate the WET and NDBSI indices, while MOD11A2 and MOD13A1 were applied for quantifying LST and NDVI, respectively. To minimize the impact of cloud cover on the accuracy of RSEI estimates, MODIS images from August to September were selected, followed by maximum value compositing and cloud removal processing. Additionally, the Modified Normalized Difference Water Index (MNDWI) was used to remove water bodies in the images.

Table 1. The specific information of data.
Topography, climate, and human activity-related data were mainly used to estimate the driving factors affecting EEQ. Drawing on existing studies (Chen et al., 2022b; Li D. et al., 2023), and considering data availability and accuracy, this study selected ten indicators across three dimensions—topography, climate, and human activities—to comprehensively evaluate the drivers of EEQ at the county level in Shaanxi Province. Topographic factors included elevation (Ⅰ), slope (Ⅱ), aspect (Ⅲ), and relief degree (Ⅳ), all derived from SRTM DEM data. Climate factors focused on temperature (Ⅴ) and precipitation (Ⅵ), with annual averages calculated using the 1-km monthly temperature and precipitation datasets for China (Peng et al., 2017; Peng et al., 2018; Peng et al., 2019; Shouzhang, 2020) published by Peng Shouzhang’s research team. Human activity impacts were quantified using four indicators: population density (Ⅶ), land-use intensity (Ⅷ), nighttime light intensity (Ⅸ), and land-use carbon emissions (Ⅹ). Population density, land-use intensity, and nighttime light intensity were assessed using Worldpop (Tatem, 2017), GlobeLand30 (chen et al., 2015), and NPP-VIIRS-like NTL data (Chen et al., 2021), respectively. Land-use carbon emissions were evaluated using both direct and indirect methods, with direct emissions calculated using GlobeLand30 data and the carbon emission coefficient method, while indirect emissions were quantified using the ODIAC dataset (Oda et al., 2018). Notably, all calculations for the RSEI and associated driving factors were performed within the GEE platform.
3 Methodologies
Figure 2 depicts the process of investigating the spatiotemporal characteristics and enhancement strategies for EEQ at the county level in Shaanxi Province within the framework of the dual carbon goals. This process includes: 1) assessment of EEQ; 2) development of a multidimensional driving system for EEQ; and 3) multidimensional analysis and optimization strategies for EEQ at the county level in alignment with the dual carbon objectives.
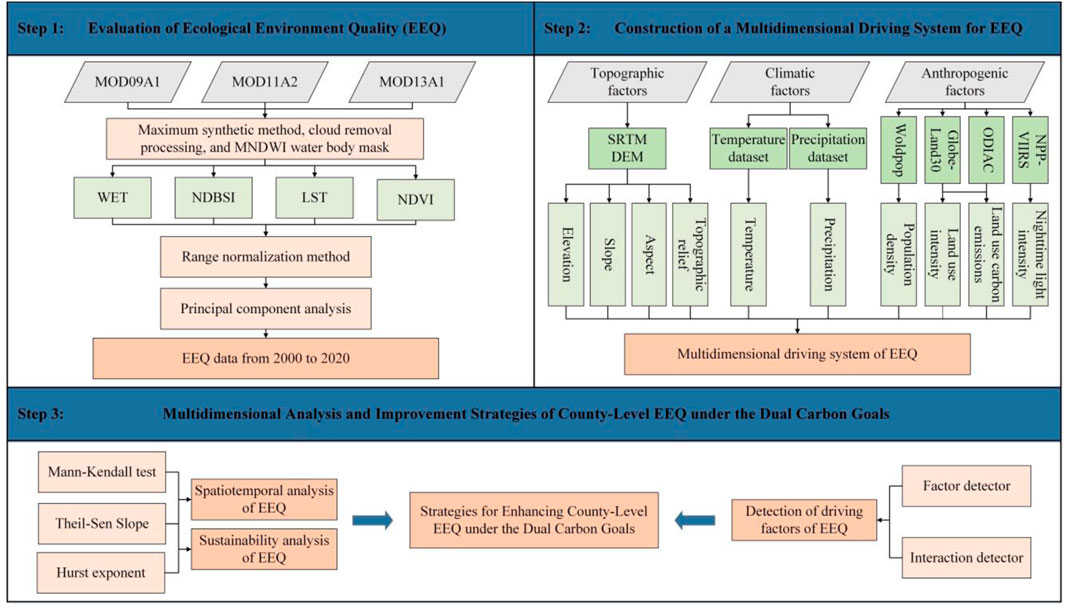
Figure 2. Technology roadmap.
3.1 Estimation process of RSEI
The RSEI is an index that employs remote sensing technology to evaluate and monitor EEQ. It consists of four primary indicators: greenness (NDVI), wetness (WET), temperature (LST), and dryness (NDBSI) (Xu HanQiu, 2013). By reducing potential biases associated with human subjectivity in ecological factor analysis, RSEI improves the objectivity and accuracy of ecological quality assessments, making it widely applicable in ecological monitoring and evaluation (Yuan et al., 2021). The calculation methods for the four indicators are as follows:
where,
Given the differing units of measurement for the various indicators (Equations 1–4), a range normalization method (Singh and Singh, 2020) was applied to standardize the data. Subsequently, RSEI was constructed using Principal Component Analysis (PCA) (Kherif and Latypova, 2020). A higher RSEI value signifies better EEQ. According to established classification standards for RSEI (Yang et al., 2023; Zhang X. et al., 2023), EEQ was categorized into five levels: worst (0–0.2), poor (0.2–0.4), moderate (0.4–0.6), good (0.6–0.8), and excellent (0.8–1).
To validate the accuracy of the RSEI estimates, this study conducted a correlation analysis between the 2020 RSEI results and the China High-Resolution Ecological Environment Quality Dataset (CHEQ). The analysis produced an R2 of 0.69 and an RMSE of 0.12, demonstrating robust accuracy and reliability. These results confirm the suitability of RSEI for further research and practical applications.
3.2 Mann-Kendall test
The Mann-Kendall test is a quantitative, non-parametric method commonly used for significance testing in time series data (Dad et al., 2021). It is robust against outliers, making it a reliable tool for trend detection. The calculation formula is as follows:
where,
3.3 Theil-Sen slope
The Theil-Sen slope estimation method is a highly robust non-parametric analysis technique (Leo et al., 2020). It does not rely on distributional assumptions, making it effective in mitigating the effects of missing data and uneven distributions in time series analysis. One of its key advantages is its resistance to data noise and outliers, which enables stable and accurate trend assessments. The calculation formula is as follows:
where,
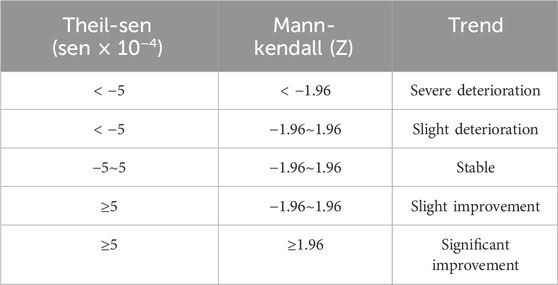
Table 2. Classification of EEQ change trends.
3.4 Hurst exponent
The Hurst exponent is a statistical measure that describes long-term dependence and self-similarity in time series data, and it has been widely applied in fields such as hydrology, economics, climatology, and geology (Grzesiek et al., 2024). For a given time series
If there exists an
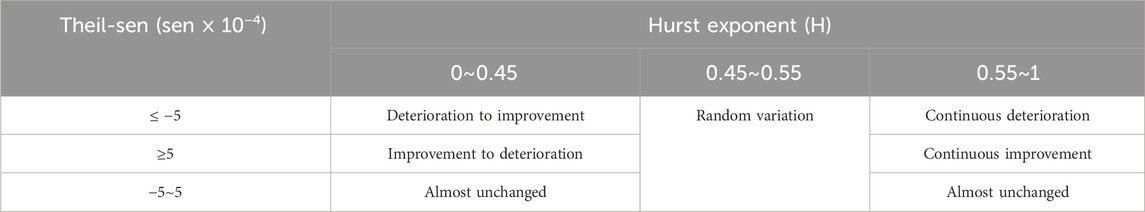
Table 3. Classification of RSEI change sustainability.
3.5 Geodetector
The Geodetector is a statistical method utilized for analyzing spatial data, designed to uncover the spatial heterogeneity of geographical phenomena and their underlying drivers (Lin et al., 2024). This method comprises four main modules: the factor detector, interaction detector, risk detector, and ecological detector. The factor detector evaluates the explanatory power of individual factors on geographical phenomena, while the interaction detector investigates the relationships between two factors and their combined effects. A notable advantage of the Geodetector is its independence from linear assumptions, enabling it to effectively address nonlinear relationships and complex interactions, thus demonstrating considerable robustness (Lin et al., 2024). The explanatory power of each factor is represented by the
where,
4 Results
4.1 Temporal variation analysis of EEQ
From 2000 to 2020, the average RSEI across various regions in Shaanxi Province demonstrated a significant fluctuating upward trend, indicating a sustained and effective improvement in the EEQ throughout the province (Figures 3, 4A–E). Ankang, Hanzhong, and Shangluo cities, benefiting from favorable natural conditions and high vegetation coverage, maintained the highest average RSEI values in the province, thus preserving a healthy ecological status. In contrast, Yulin City, situated in the Loess Plateau, experienced an increase in average RSEI from 0.19 in 2000 to 0.36 in 2020, yet it continues to face challenges regarding its overall ecological quality. This situation can be attributed to the region’s harsh natural conditions, including frequent droughts and severe soil erosion, along with the cumulative ecological pressure resulting from historical economic development. Xi’an, the city with the highest level of urbanization, generally enjoys good ecological quality, a trend bolstered by the positive influence of the southern Qinling Mountains on regional ecology and the ongoing expansion of urban greening initiatives. Notably, Tongchuan City achieved the most significant increase in average RSEI during this period (0.24), successfully advancing from a moderate level to a good state, likely due to proactive ecological protection measures and effective environmental management practices in the area.

Figure 3. Average RSEI values of Shaanxi Province cities from 2000 to 2020.
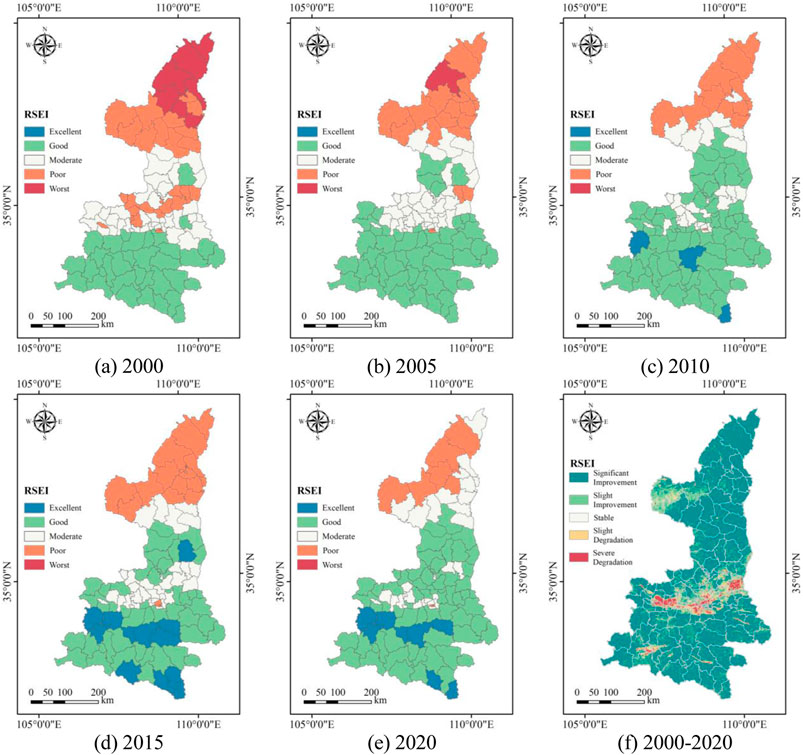
Figure 4. (A–E) Average RSEI values of Shaanxi Province counties from 2000 to 2020. (F) Change trend of RSEI in Shaanxi Province from 2000 to 2020.
4.2 Spatial heterogeneity characteristics of EEQ
The EEQ in Shaanxi Province exhibited significant spatial heterogeneity, following a gradient distribution pattern of “low-high-low-high” from north to south (Figures 4A–E). High-quality ecological counties were predominantly located in the Qinba mountainous region of southern Shaanxi and the southern part of Yan’an in northern Shaanxi, areas that typically possessed a robust natural ecological foundation. In contrast, ecological quality in Yulin City, northern Yan’an, and the highly urbanized counties of the Guanzhong area lagged behind. Between 2000 and 2020, counties with the worst average RSEI values completely disappeared, and the number of counties categorized as poor significantly decreased to nine, primarily concentrated in the northern Loess Plateau and northern Guanzhong Plain. At the same time, the number of counties rated as good or excellent surged to 69, accounting for over 64%, highlighting a substantial improvement in EEQ.
To better capture the spatial and temporal variations in Shaanxi Province’s ecological environment and the significance of changes in ecological quality, the RSEI index was analyzed for different time periods using the Mann-Kendall test (Equations 5–7) and Theil-Sen slope estimation (Equation 8) categorized according to Table 2. As shown in Figures 4F, 5A–D; Table 4, the results indicate that from 2000 to 2020, EEQ improved significantly across 78.39% of Shaanxi Province (|Z| ≥ 1.96, passing the 95% confidence significance test). Slightly improved areas were more dispersed, accounting for 14.73% (|Z| < 1.96, not passing the 95% confidence significance test), while severely and slightly degraded areas were fewer and primarily concentrated in urban centers and peripheral zones, particularly in the Guanzhong urban agglomeration, likely due to the environmental pressures of rapid urbanization and industrialization.
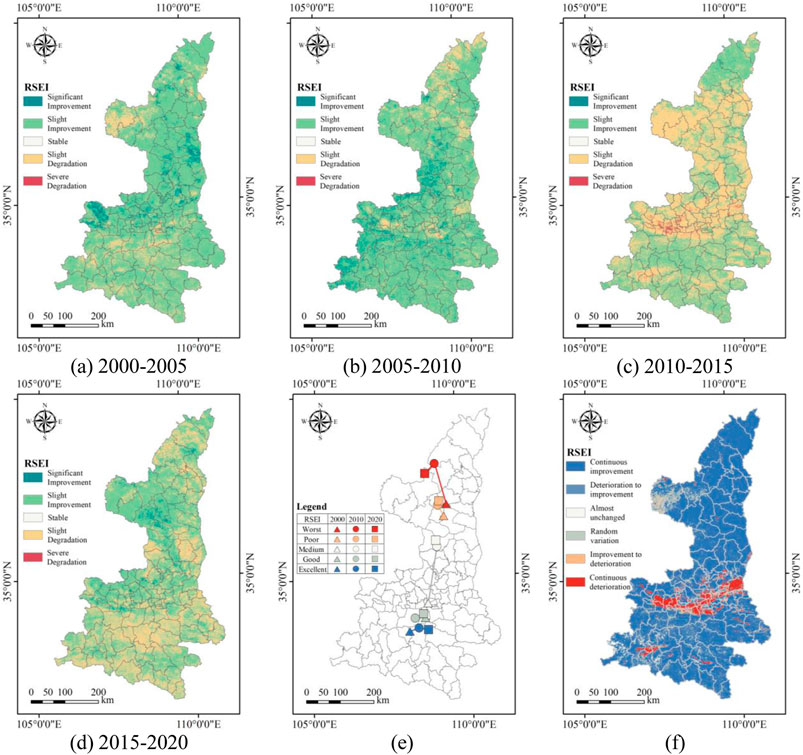
Figure 5. (A–D) Change trend of RSEI across different periods in Shaanxi Province. (E) Migration of the center of gravity for EEQ in Shaanxi Province from 2000 to 2020. (F) Trends in the sustainability of RSEI in Shaanxi Province from 2000 to 2020.
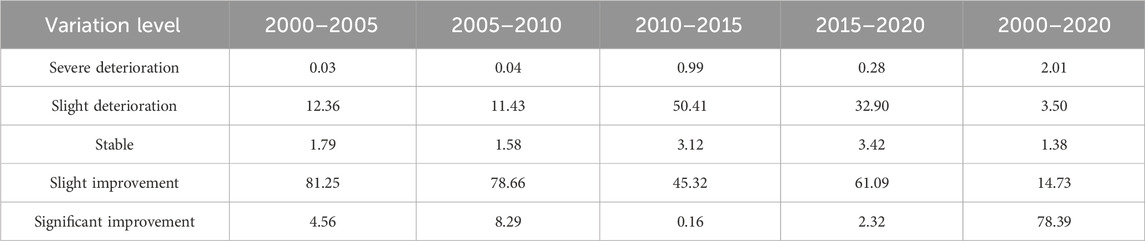
Table 4. Area proportion of RSEI change levels in Shaanxi Province from 2000 to 2020 (%).
Unlike the long-term trend from 2000 to 2020, the 5-year intervals showed varied patterns of ecological change. From 2000 to 2005, 85.81% of the province experienced ecological improvement, likely driven by ecological protection policies such as the “Grain for Green” project and restoration initiatives. During this period, 81.25% of the region exhibited slight improvement, with significant gains concentrated in the northern Guanzhong Plain and southern Loess Plateau. In contrast, slightly degraded areas were scattered in southern Shaanxi’s Qinba Mountains and urban expansion zones such as Dingbian County. From 2005 to 2010, the cumulative effects of policies and diversified ecological protection measures led to further improvements, with 86.95% of the region seeing enhanced ecological quality. The proportion of significantly improved areas increased to 8.29%, though their distribution became more scattered. However, between 2010 and 2015, nearly half of the province experienced ecological degradation, particularly in the central and southern parts of the Loess Plateau and Guanzhong Plain, driven by rapid urbanization and industrialization. This degradation trend persisted from 2015 to 2020, although the affected areas shifted, concentrating in southern and central-northern Shaanxi, likely due to intensified human activity and frequent natural disasters.
To better understand the temporal characteristics of areas with varying ecological levels, the migration directions of the centroids for different ecological grades in 2000, 2010, and 2020 were calculated at 10-year intervals (Figure 5E). From 2000 to 2020, the centroids of the excellent, good, moderate, poor, and worst ecological levels were distributed sequentially from south to north. The migration distances for all levels were notably greater during 2000–2010 compared to 2010–2020. The centroid of the excellent level was primarily located in Ningshan County, in the northern Qinba Mountains, with a slight west-to-east shift, likely due to the stable ecological quality of the Qinba Mountains as a critical ecological barrier. The centroid of the good level was positioned at the northern edge of the Qinba Mountains and exhibited the smallest migration. In contrast, the moderate level had the largest migration, with its centroid moving from Weicheng District in the Guanzhong Plain to Fu County in the Loess Plateau, covering 173.17 km between 2000 and 2010, reflecting significant ecological improvement in the Loess Plateau. The centroid of the poor level was located in central northern Shaanxi, with a smaller shift from northern Baota District to northern Ansai District. The worst level’s centroid was in the northern Loess Plateau and displayed the second-largest migration range. It moved from southern Zichang City to southwestern Yuyang District between 2000 and 2010, and slightly southwest to northern Jingbian County between 2010 and 2020. These migration patterns underscore the complexity and challenges of improving ecological quality in this region.
4.3 Sustainability analysis of EEQ changes
To better understand future trends in the ecological quality of Shaanxi Province, the Hurst exponent (Equations 9, 10) and Theil-Sen slope were calculated for each pixel and classified according to Table 3. The results are shown in Figure 5F; Table 5. The overall trend indicates continuous improvement in ecological quality across 83.07% of the province. However, 5.09% of the area, primarily in the Guanzhong Plain urban agglomeration and central Hanzhong City, shows ongoing degradation, reflecting the tension between ecological protection and economic development during urbanization. Areas transitioning from improvement to degradation account for 1.06%, mainly in urban fringe zones that have seen ecological gains followed by urban expansion over the past 2 decades. The smallest proportion, 0.17%, represents areas shifting from degradation to improvement, mostly concentrated in Dingbian County. Nearly unchanged regions make up 2.35%, largely scattered across the Qinba Mountains in southern Shaanxi, where ecological stability has persisted. Furthermore, 8.56% of the province has a Hurst index near 0.5, making it difficult to predict future changes in ecological quality in these areas. Enhanced monitoring and timely adjustments to protection strategies are needed to address potential environmental risks.
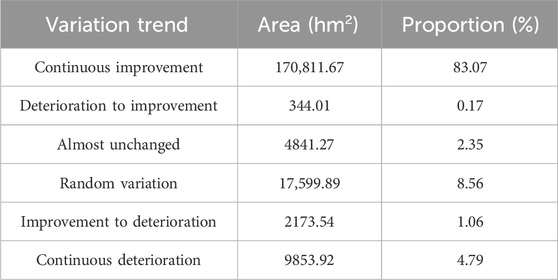
Table 5. Area proportion of RSEI sustainability levels in Shaanxi Province from 2000 to 2020 (%).
4.4 Detection of driving factors influencing EEQ at the county level
The factor detection results quantify the explanatory power of various factors on the spatial variation of county-level ecological quality, represented by the q value. A higher q value indicates a stronger influence of the factor on the spatial distribution of ecological quality. Analysis of the factor detection results for 2000, 2010, and 2020 (Figure 6A) ranked the average explanatory power of different factors in Shaanxi Province as follows: precipitation (Ⅵ) > slope (Ⅱ) > land-use carbon emissions (Ⅹ) > land-use intensity (Ⅷ) > nighttime light intensity (Ⅸ) > aspect (Ⅲ) > temperature (Ⅴ) > population density (Ⅶ) > elevation (Ⅰ) > relief degree (Ⅳ). Multi-year q values showed stability for factors with strong or weak explanatory power, while factors with moderate explanatory power exhibited greater fluctuation. Precipitation, slope, and land-use carbon emissions had strong and consistent explanatory power, while population density, elevation, and relief degree showed weaker, saturated effects. In contrast, factors with moderate explanatory power (land-use intensity, nighttime light intensity, aspect, and temperature) displayed fluctuating patterns without a clear trend. Precipitation consistently had the highest q value, highlighting its dominant role in influencing spatial variation. It directly affected vegetation growth and water distribution, while also impacting ecological processes such as soil erosion and the hydrological cycle, making it a key driver of ecological quality in Shaanxi. Slope ranked second, with q values consistently above 0.4. Anthropogenic factors showed moderate explanatory power with less variation, with land-use carbon emissions being the strongest among them. As economic development and population growth continued, carbon emissions from land-use changes became a major pressure on ecological quality, especially during urbanization and industrialization. The relatively low explanatory power of elevation and relief degree, with q values below 0.2, indicated that these factors were not primary drivers of spatial variation in county-level ecological quality based on single-factor analysis.
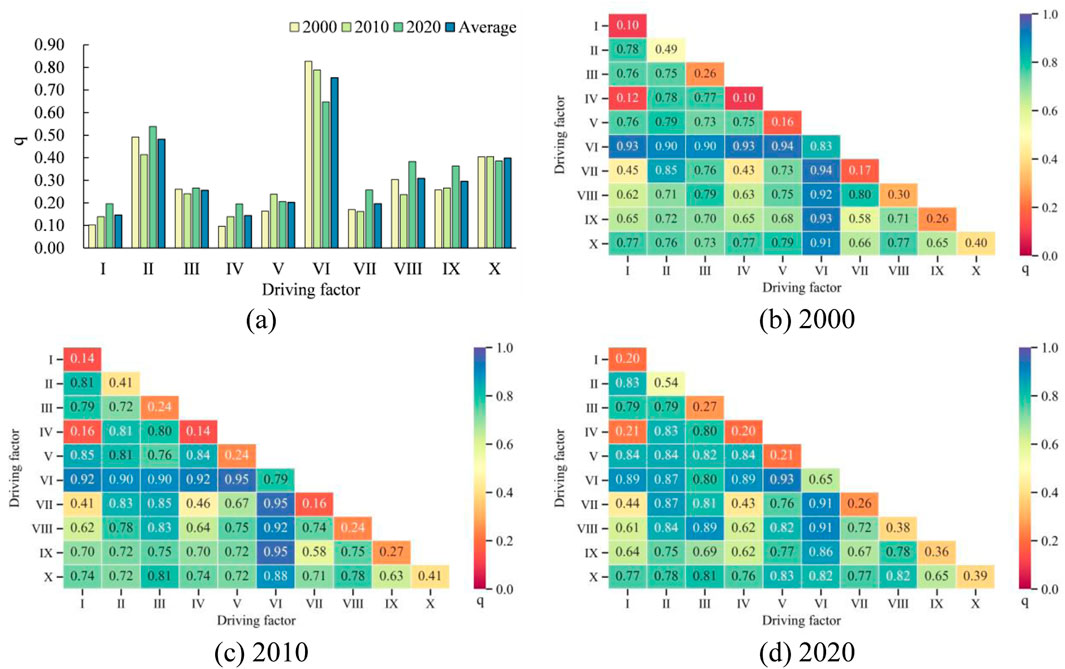
Figure 6. (A) Results of the factor detection. (B–D) Results of factor interaction detection for 2000, 2010, and 2020.
Interaction detection analysis further reveals the synergistic effects of different factors on the spatial variation of county-level ecological quality. The results (Figures 6B–D) showed that factor interactions significantly enhanced their explanatory power, with no evidence of independent or diminishing interactions. This suggested that factor interactions were more influential than their individual effects. The primary types of interaction observed were bivariate enhancement and nonlinear enhancement, with the latter accounting for two-thirds of all interactions. Among factor combinations, precipitation—which had the strongest single-factor explanatory power—continued to exhibit strong explanatory power in combination with other factors. However, the interaction outcomes did not always align with the explanatory power of the individual factors. Notably, the interaction between temperature, a weaker single-factor, and precipitation, the strongest factor, yielded the highest explanatory power, even surpassing the combination of precipitation and slope. This was attributed to the direct influence of temperature and precipitation on key ecological processes such as water balance, plant growth, and biodiversity, which amplified their combined effect. In contrast, although slope was a critical topographic feature, its combination with precipitation had a less direct and significant impact on ecological quality than the temperature-precipitation interaction. Most factor interactions had q values exceeding 0.6, accounting for over 90% of all interactions. The interaction between elevation and topographic relief consistently produced the lowest q values across different years. Consequently, county-level EEQ in Shaanxi Province is primarily driven by climatic factors, coupled with the synergistic effects of multiple other factors. When developing ecological protection measures, it is essential to consider both the independent and interactive effects of various factors and to implement comprehensive management strategies for sustained ecological improvement and coordinated regional development.
5 Discussion
5.1 Spatiotemporal characteristics of county-level EEQ in Shaanxi Province
Shaanxi Province spans a vast area and crosses three major climate zones. Its complex and diverse climate, combined with varied natural environments, significantly influences the ecosystem’s carrying capacity, resulting in pronounced regional differences (Zhang et al., 2019). In northern Shaanxi, the arid, low-rainfall climate exacerbates soil erosion, while the region’s energy and chemical industries pose substantial challenges to the ecological environment (Sun Y. et al., 2023). The Guanzhong Plain, with its flat terrain, has experienced rapid urbanization in recent years, leading to the encroachment on ecological land and a marked increase in pollution emissions (Yang and Cai, 2020). Southern Shaanxi, characterized by a complex terrain of mountains and valleys, suffers from environmental damage due to mining and tourism activities (Kang et al., 2018). The province’s varied climate, geography, and topography have shaped diverse county-level regions, including industrial, energy, agricultural, and tourism zones. Given these dynamics, scientifically assessing and optimizing Shaanxi’s ecological quality is essential. However, most existing research on EEQ evolution in Shaanxi has focused on macro scales (Zhang R. et al., 2022; Zou et al., 2022a), with limited in-depth studies at the county level.
This study explored the spatiotemporal changes and sustainability characteristics of EEQ at the county scale. The results indicate that, from north to south, the EEQ of Shaanxi Province exhibited a distinct “low-high-low-high” gradient pattern, highlighting the heterogeneity of ecological conditions within the province. Counties in the southern and north-central regions benefited from mild climates, more abundant water resources, and better-preserved ecosystems, thereby possessing high-quality ecological environments. In contrast, northern counties faced harsher climatic conditions, limited water resources, and increased anthropogenic pressures from urbanization and industrial activities, leading to severe ecological challenges. Furthermore, despite its central location, the Guanzhong Plain experienced significant land use changes, soil pollution, and resource depletion due to rapid urban expansion and intensified industrialization, resulting in a relatively low level of EEQ. This gradient pattern underscores the complex interactions between natural and anthropogenic factors affecting the ecological health of different regions. From 2000 to 2020, the RSEI in Shaanxi Province followed a fluctuating upward trend, indicating sustained and effective improvements in ecological quality, consistent with the findings of Zou et al (2022a). However, the study also revealed periods of degradation in certain counties. For example, slight degradation occurred in the Guanzhong Plain and the central and southern Loess Plateau between 2010 and 2015, and in regions with high vegetation coverage in southern and central-northern Shaanxi between 2015 and 2020. The distribution centers of different ecological grades, from high to low, were arranged from south to north, with a greater migration observed from 2000 to 2010 compared to 2010 to 2020. Moreover, sustainability analysis suggests that Shaanxi’s ecological quality is likely to continue improving in the coming years, although highly urbanized areas may face risks of ecological degradation.
5.2 Analysis of driving factors of county-level EEQ
The results of the interaction detection analysis indicate that county-level EEQ is primarily driven by climatic factors, along with the synergistic effects of multiple variables, a conclusion supported by numerous studies (Zhang M. et al., 2022; Zhang Y. et al., 2022; Sawut et al., 2023). While investigating the drivers of spatial variation in county-level EEQ, we identified an intriguing and significant phenomenon: although temperature (Figure 7A) exhibited relatively weak explanatory power as a single factor across different years, its interaction with precipitation (Ⅵ) (Figure 7B)—the strongest factor—had the most significant influence on spatial variation. This finding underscores the complex, nonlinear relationships between ecosystem factors, particularly the interactions between climatic variables. As key climatic drivers, temperature and precipitation not only have substantial individual impacts on ecological quality but also interact to shape ecosystem spatial patterns (Cui et al., 2021). Temperature affects physiological processes such as plant growth cycles and water-use efficiency, while precipitation directly influences water resource availability and soil moisture (Cui et al., 2021; Tang H. et al., 2024). When these two variables interact, they produce additive or amplifying effects on ecological quality through complex processes like changes in vegetation cover and soil erosion, explaining why their interaction shows the strongest explanatory power for spatial variation in county-level EEQ.
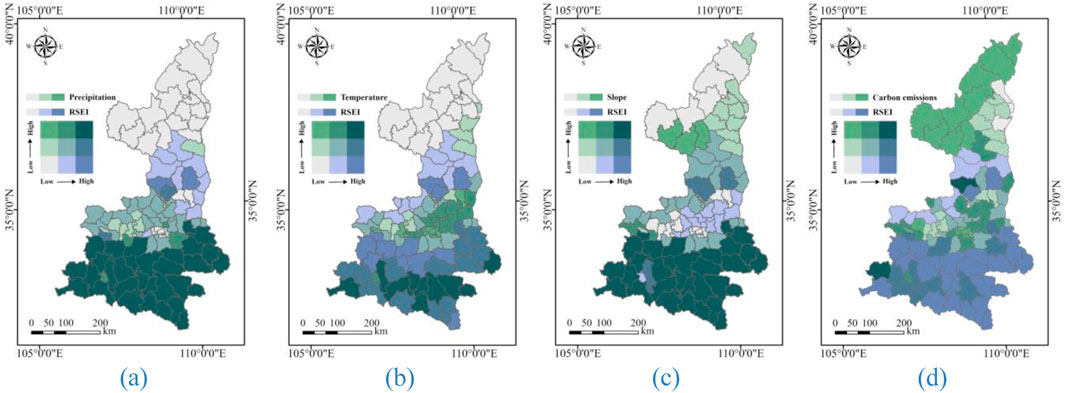
Figure 7. Relationships between (A) precipitation, (B) temperature, (C) slope, and (D) land-use carbon emissions and RSEI.
Among topographic factors, slope demonstrated strong explanatory power, second only to precipitation, in explaining spatial variation of EEQ in Shaanxi Province. Slope, as a critical topographic variable, influences soil and water conservation, runoff patterns, and soil erosion rates, indirectly shaping vegetation distribution and ecosystem structure, and thus having a profound effect on ecological quality (Gadana et al., 2020). Despite the steep slopes in southern Shaanxi, the region maintains relatively high ecological quality (Figure 7C). The Qinba Mountains, characterized by complex terrain and steep slopes, benefit from favorable precipitation and abundant vegetation, which help mitigate soil erosion and enhance ecosystem stability. Additionally, local conservation policies and ecological restoration efforts have further improved ecological quality. Therefore, although steep slopes typically increase ecosystem vulnerability, their negative impacts have been effectively mitigated by specific natural and human factors, making slope an important driver of spatial variation in the region’s EEQ.
Multi-period factor detection results revealed that the average explanatory power of land-use carbon emissions ranked third, following only precipitation and slope, indicating a long-term and relatively strong impact on the EEQ at the county level. Regions with higher carbon emissions often experience greater ecological pressure (Figure 7D). On one hand, the ongoing urbanization and industrialization processes led to the gradual conversion of land types such as farmland, grassland, and forest into construction land, resulting in substantial fossil fuel consumption and biomass loss, thereby increasing carbon emissions (Wang et al., 2019; Churkina et al., 2020). On the other hand, high carbon emissions exacerbate ecosystem degradation by affecting vegetation growth and water resource allocation and imposing continuous pressure on ecological processes through alterations in soil physicochemical properties and other pathways (Kuzyakov et al., 2019; Ramesh et al., 2019). Notably, land-use carbon emissions not only independently affected county-level EEQ but also exhibited higher explanatory power for ecological quality through interactions with other factors. This suggests that during rapid urbanization and economic development, climate conditions and human activities jointly shape the spatial and temporal patterns of the ecological environment. As a significant anthropogenic disturbance, land-use carbon emissions impact key ecological processes such as plant growth, soil and water conservation, and biodiversity, often coupling with hydrological conditions, population density, and land-use patterns, thereby further exacerbating or alleviating their effects on ecosystems.
5.3 Strategies for improving county-level EEQ under the dual-carbon goals
In the context of global climate change, achieving carbon peak and carbon neutrality has become a global consensus and a key development goal for all nations (Chen et al., 2022a; Tang X. et al., 2024). As the foundation of Earth’s life support system, the ecological environment directly influences the global carbon cycle and climate stability, making it essential for realizing dual-carbon goals (Humphrey et al., 2021). The quality of the ecological environment is closely tied to carbon absorption and storage capacities: a healthy ecosystem enhances natural carbon sinks, facilitating carbon sequestration and storage (Heinrich et al., 2021). Conversely, ecological degradation can intensify carbon emissions, creating a negative feedback loop (Noë et al., 2021). The diversity and complexity of Shaanxi’s ecological environment require differentiated and targeted optimization strategies to advance the dual-carbon agenda.
Based on this study’s findings, counties in Shaanxi Province were classified into three categories: counties in southern and central-northern Shaanxi with good or excellent EEQ (Type I), counties in the central region with moderate ecological quality (Type II), and counties in northern Shaanxi with moderate to poor EEQ (Type III). Figure 8 presents strategies for improving EEQ in these counties under the dual-carbon goals. Type I counties, with favorable natural conditions and high ecological quality, should focus on enhancing carbon sequestration through ecosystem management, developing low-carbon eco-tourism and carbon-efficient agriculture, and promoting smart ecological management through intelligent technologies and environmental education. Type II counties, located primarily in the highly urbanized and industrialized Guanzhong Plain, should prioritize building low-carbon cities by enhancing urban greening, developing sustainable infrastructure, promoting green industries through renewable energy and efficient technologies, and optimizing land use to control urban sprawl and restore ecological functions. Type III counties, located in the ecologically fragile and erosion-prone Loess Plateau, should concentrate on ecological restoration through afforestation and water resource management, developing carbon trading and investing in carbon sink products, and establishing ecological compensation mechanisms to support conservation efforts.
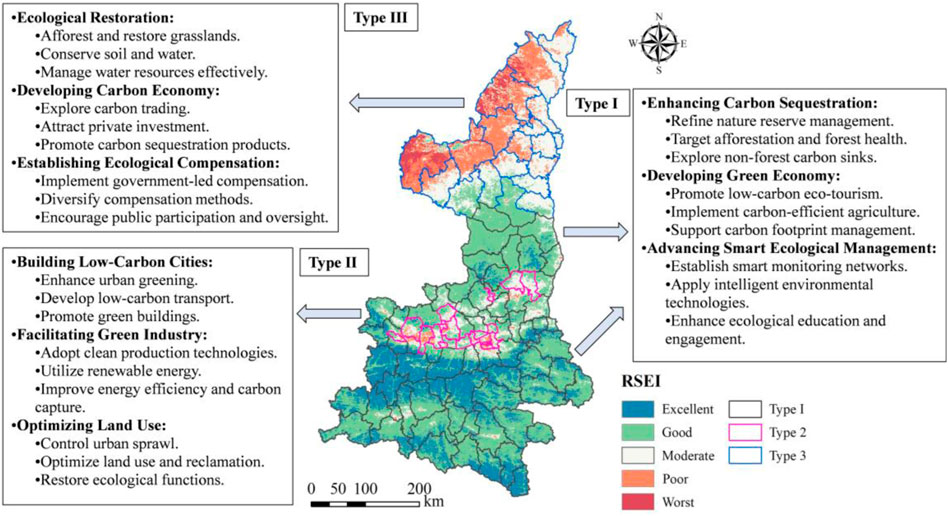
Figure 8. Strategies for improving EEQ in different types of counties under the dual-carbon goals.
6 Conclusion
This study systematically analyzed the spatiotemporal evolution of county-level EEQ in Shaanxi Province and its driving factors, while exploring optimization strategies for different types of counties under the dual-carbon goals. The results indicate that: 1) From 2000 to 2020, ecological quality in Shaanxi Province improved steadily, with an overall upward trend despite fluctuations, though some counties experienced slight degradation between 2010 and 2020. 2) Significant spatiotemporal heterogeneity was observed at the county level, following a “low-high-low-high” distribution pat-tern from north to south. 3) In the coming years, EEQ is expected to continue improving, though highly urbanized areas may face risks of degradation. 4) The spatial variation in EEQ is primarily driven by climatic factors, with additional contributions from the synergistic effects of multiple factors. Customized carbon sink enhancement strategies are recommended for counties based on their ecological conditions. Counties in the southern and central-northern regions should strengthen carbon sink functions and promote the green economy, while counties in the Guanzhong Plain should focus on developing low-carbon cities and green industrial systems. In the northern Loess Plateau, efforts should prioritize ecological restoration and carbon sink development. These findings support the region’s low-carbon transition and sustainable development, while offering scientific and practical insights for ecological protection, emissions reduction, and carbon sink enhancement in other regions globally.
Data availability statement
The datasets presented in this study can be found in online repositories. The names of the repository/repositories and accession number(s) can be found in the article/supplementary material.
Author contributions
JfL: Conceptualization, Funding acquisition, Methodology, Software, Writing–original draft, Writing–review and editing. YH: Conceptualization, Funding acquisition, Validation, Writing–review and editing. JaL: Data curation, Formal Analysis, Software, Writing–review and editing. LY: Formal Analysis, Methodology, Software, Writing–review and editing. JY: Writing–review and editing, Conceptualization.
Funding
The author(s) declare that financial support was received for the research, authorship, and/or publication of this article. This work was supported by the Talent Introduction Project of Shaanxi University of Technology (X20240017), the Technology Innovation Center for Land Engineering and Human Settlements, Shaanxi Land Engineering Construction Group Co., Ltd. and Xi’an Jiaotong University (2021WHZ0090 and 2024WHZ0238), the Enterprise Innovation and Youth Talent Support Program of Shaanxi Association for Science and Technology (20230517), and the Scientific Research Item of Shaanxi Provincial Land Engineering Construction Group (DJNY-2024-39, DJNYYB-2023-33, and DJTD-2023-2).
Acknowledgments
We sincerely express our deep gratitude to all those who contributed to the success of this research. We are particularly thankful to the institutions and individuals who offered invaluable data support, without which this study would not have been possible.
Conflict of interest
Authors JfL and LY were employed by Shaanxi Land Engineering Construction Group Co., Ltd. Author JaL was employed by Shaanxi Geological and Mineral Sixth Geological Team Co., Ltd.
The remaining authors declare that the research was conducted in the absence of any commercial or financial relationships that could be construed as a potential conflict of interest.
Generative AI statement
The author(s) declare that no Generative AI was used in the creation of this manuscript.
Publisher’s note
All claims expressed in this article are solely those of the authors and do not necessarily represent those of their affiliated organizations, or those of the publisher, the editors and the reviewers. Any product that may be evaluated in this article, or claim that may be made by its manufacturer, is not guaranteed or endorsed by the publisher.
References
Airiken, M., and Li, S. (2024). The dynamic monitoring and driving forces analysis of ecological environment quality in the Tibetan plateau based on the google earth engine. Remote Sens. 16 (4), 682. doi:10.3390/rs16040682
Arshad, K., Hussain, N., Ashraf, M. H., and Saleem, M. Z. (2024). Air pollution and climate change as grand challenges to sustainability. Sci. Total Environ. 928, 172370. doi:10.1016/j.scitotenv.2024.172370
Beaussier, T., Caurla, S., Bellon-Maurel, V., and Loiseau, E. (2019). Coupling economic models and environmental assessment methods to support regional policies: a critical review. J. Clean. Prod. 216, 408–421. doi:10.1016/j.jclepro.2019.01.020
Casanelles-Abella, J., Chauvier, Y., Zellweger, F., Villiger, P., Frey, D., Ginzler, C., et al. (2021). Applying predictive models to study the ecological properties of urban ecosystems: a case study in zürich, Switzerland. Landsc. Urban Plan. 214, 104137. doi:10.1016/j.landurbplan.2021.104137
Chen, J., Liao, A., Cao, X., Chen, L., Chen, X., He, C., et al. (2015). Global land cover mapping at 30m resolution: a POK-based operational approach. ISPRS J. Photogrammetry Remote Sens. 103, 7–27. doi:10.1016/j.isprsjprs.2014.09.002
Chen, L., Msigwa, G., Yang, M., Osman, A. I., Fawzy, S., Rooney, D. W., et al. (2022a). Strategies to achieve a carbon neutral society: a review. a Rev. 20 (4), 2277–2310. doi:10.1007/s10311-022-01435-8
Chen, L., Zhang, H., Zhang, X., Liu, P., Zhang, W., and Ma, X. (2022b). Vegetation changes in coal mining areas: naturally or anthropogenically driven? Catena 208, 105712. doi:10.1016/j.catena.2021.105712
Chen, Z., Yu, B., Yang, C., Zhou, Y., Yao, S., Qian, X., et al. (2021). An extended time series (2000–2018) of global NPP-VIIRS-like nighttime light data from a cross-sensor calibration. Earth Syst. Sci. Data 13 (3), 889–906. doi:10.5194/essd-13-889-2021
Churkina, G., Organschi, A., Reyer, C. P. O., Ruff, A., Vinke, K., Liu, Z., et al. (2020). Buildings as a global carbon sink. Nat. Sustain. 3 (4), 269–276. doi:10.1038/s41893-019-0462-4
Cui, F., Wang, B., Zhang, Q., Tang, H., De Maeyer, P., Hamdi, R., et al. (2021). Climate change versus land-use change—what affects the ecosystem services more in the forest-steppe ecotone? Sci. Total Environ., 759, 143525, doi:10.1016/j.scitotenv.2020.143525
Dad, J. M., Muslim, M., Rashid, I., and Reshi, Z. A. (2021). Time series analysis of climate variability and trends in kashmir himalaya. Ecol. Indic. 126, 107690. doi:10.1016/j.ecolind.2021.107690
Dang, C., Shao, Z., Fu, P., Zhuang, Q., Xu, X., and Qian, J. J. R. S. o.E. (2024). Causal inference reveals the dominant role of interannual variability of carbon sinks in complicated environmental-terrestrial ecosystems. Remote Sens. Environ. 311, 114300. doi:10.1016/j.rse.2024.114300
Dong, F., Shi, M., and Li, W. (2024). Research on ecological protection mechanisms in watersheds based on evolutionary games-inter-provincial and intra-provincial perspectives. Water Resour. Manag. 38 (7), 2377–2397. doi:10.1007/s11269-024-03773-4
Dube, T., Seaton, D., Shoko, C., and Mbow, C. (2023). Advancements in earth observation for water resources monitoring and management in Africa: a comprehensive review. J. hydrology 623, 129738. doi:10.1016/j.jhydrol.2023.129738
Fang, C., Fan, Y., Bao, C., Li, G., Wang, Z., Sun, S., et al. (2023). China?s improving total environmental quality and environment-economy coordination since 2000: progress towards sustainable development goals. J. Clean. Prod. 387, 135915. doi:10.1016/j.jclepro.2023.135915
Gadana, D. B., Sharma, P. D., and Selfeko, D. T. J. A. i.A. (2020). Effect of soil management practices and slope on soil fertility of cultivated lands in Mawula watershed, Loma district. South. Ethiop. 2020 (1), 8866230. doi:10.1155/2020/8866230
Gebara, C. H., and Laurent, A. (2023). National SDG-7 performance assessment to support achieving sustainable energy for all within planetary limits. Renew. and Sustain. Energy Rev. 173, 112934. doi:10.1016/j.rser.2022.112934
Gebara, C. H., Renewable, A. L. J., and Reviews, S. E. (2023). National SDG-7 performance assessment to support achieving sustainable energy for all within planetary limits. 173. 112934. doi:10.1016/j.rser.2022.112934
Geng, J., Yu, K., Xie, Z., Zhao, G., Ai, J., Yang, L., et al. (2022). Analysis of spatiotemporal variation and drivers of ecological quality in fuzhou based on RSEI. Remote Sens. 14 (19), 4900. doi:10.3390/rs14194900
Gorelick, N., Hancher, M., Dixon, M., Ilyushchenko, S., Thau, D., and Moore, R. (2017). Google earth engine: planetary-scale geospatial analysis for everyone. Remote Sens. Environ. 202, 18–27. doi:10.1016/j.rse.2017.06.031
Grzesiek, A., Gajda, J., Thapa, S., and Wylomanska, A. (2024). Distinguishing between fractional brownian motion with random and constant Hurst exponent using sample autocovariance-based statistics. Chaos (Woodbury, N.Y.) 34 (4), 043154. doi:10.1063/5.0201436
Guo, Q., Yang, C., Wang, X., Wan, Z., Zhang, G., Cui, J., et al. (2024). New insights on the spatial and temporal distribution characteristics of Chinese marine environmental quality and its driving factors from 2003 to 2021. Ecol. Indic. 161, 111903. doi:10.1016/j.ecolind.2024.111903
Heinrich, V. H., Dalagnol, R., Cassol, H. L., Rosan, T. M., de Almeida, C. T., Silva Junior, C. H., et al. (2021). Large carbon sink potential of secondary forests in the Brazilian Amazon to mitigate climate change. Clim. change 12 (1), 1785. doi:10.1038/s41467-021-22050-1
Humphrey, V., Berg, A., Ciais, P., Gentine, P., Jung, M., Reichstein, M., et al. (2021). Soil moisture–atmosphere feedback dominates land carbon uptake variability, 592(7852), 65–69. doi:10.1038/s41586-021-03325-5
Kamran, M., and Yamamoto, K. (2023). Evolution and use of remote sensing in ecological vulnerability assessment: a review. Ecol. Indic. 148, 110099. doi:10.1016/j.ecolind.2023.110099
Kang, H., Tao, W., Chang, Y., Zhang, Y., Xuxiang, L., and Chen, P. (2018). A feasible method for the division of ecological vulnerability and its driving forces in southern shaanxi. J. Clean. Prod. 205, 619–628. doi:10.1016/j.jclepro.2018.09.109
Kherif, F., and Latypova, A. (2020). “Principal component analysis,” in Machine learning (Elsevier), 209–225.
Kuzyakov, Y., Horwath, W. R., Dorodnikov, M., and biology, E. B. J. S.biochemistry (2019). Review and synthesis of the effects of elevated atmospheric CO2 on soil processes: No changes in pools, but increased fluxes and accelerated cycles, 128. 66, 78. doi:10.1016/j.soilbio.2018.10.005
Leo, F. D., Leo, A. D., Besio, G., and Briganti, R. (2020). Detection and quantification of trends in time series of significant wave heights: an application in the Mediterranean Sea. Ocean. Eng. 202, 107155. doi:10.1016/j.oceaneng.2020.107155
Li, D., Yang, W., and Huang, R. (2023a). The multidimensional differences and driving forces of ecological environment resilience in China. Environ. Impact Assess. Rev. 98, 106954. doi:10.1016/j.eiar.2022.106954
Li, W., An, M., Wu, H., An, H., Huang, J., and Khanal, R. (2023b). The local coupling and telecoupling of urbanization and ecological environment quality based on multisource remote sensing data. J. Environ. Manag. 327, 116921. doi:10.1016/j.jenvman.2022.116921
Li, W., An, M., Wu, H., An, H., Huang, J., and management, R. K. J. J. o.e. (2023c). The local coupling and telecoupling of urbanization and ecological environment quality based on multisource remote sensing data. Remote Sens. Data 327, 116921. doi:10.1016/j.jenvman.2022.116921
Li, Y., He, Y., Liu, W., Jia, L., and Zhang, Y. (2023d). Evaluation and prediction of water Yield services in shaanxi province, China. Forests 14 (2), 229. doi:10.3390/f14020229
Liao, W., and Jiang, W. (2020). Evaluation of the spatiotemporal variations in the eco-environmental quality in China based on the remote sensing ecological index. Remote Sens. 12, 2462. doi:10.3390/rs12152462
Lin, J., He, S., Liu, X., Huang, Z., Li, M., Chen, B., et al. (2024). Identifying conservation and restoration priorities for degraded coastal wetland vegetations: integrating species distribution model and GeoDetector. Sci. Total Environ. 906, 167491. doi:10.1016/j.scitotenv.2023.167491
Liu, P., Ren, C., Yu, W., Ren, H., and Xia, C. (2023). Exploring the ecological quality and its drivers based on annual remote sensing ecological index and multisource data in Northeast China. Ecol. Indic. 154, 110589. doi:10.1016/j.ecolind.2023.110589
Morandi, D. T., de Jesus França, L. C., Menezes, E. S., Machado, E. L. M., da Silva, M. D., and Mucida, D. P. (2020). Delimitation of ecological corridors between conservation units in the Brazilian Cerrado using a GIS and AHP approach. Ecol. Indic. 115, 106440. doi:10.1016/j.ecolind.2020.106440
Noë, J. L., Erb, K.-H., Matej, S., Magerl, A., Bhan, M., and communications, S. G. J. N. (2021). Altered growth conditions more than reforestation counteracted forest biomass carbon emissions 1990–2020. Nat. Commun. 12, 6075. doi:10.1038/s41467-021-26398-2
Oda, T., Maksyutov, S., and Andres, R. J. (2018). The Open-source Data Inventory for Anthropogenic CO 2, version 2016 (ODIAC2016): a global monthly fossil fuel CO 2 gridded emissions data product for tracer transport simulations and surface flux inversions. Earth Syst. Sci. Data 10 (1), 87–107. doi:10.5194/essd-10-87-2018
Peng, S., Ding, Y., Liu, W., and Li, Z. (2019). 1 km monthly temperature and precipitation dataset for China from 1901 to 2017. Earth Syst. Sci. Data 11 (4), 1931–1946. doi:10.5194/essd-11-1931-2019
Peng, S., Ding, Y., Wen, Z., Chen, Y., Cao, Y., and Ren, J. (2017). Spatiotemporal change and trend analysis of potential evapotranspiration over the Loess Plateau of China during 2011–2100. Agric. For. meteorology 233, 183–194. doi:10.1016/j.agrformet.2016.11.129
Peng, S., Gang, C., Cao, Y., and Chen, Y. (2018). Assessment of climate change trends over the Loess Plateau in China from 1901 to 2100. Int. J. Climatol. 38 (5), 2250–2264. doi:10.1002/joc.5331
Qin, N., Lu, Q., Fu, G., Wang, J., Fei, K., and Gao, L. (2023). Assessing the drought impact on sugarcane yield based on crop water requirements and standardized precipitation evapotranspiration index. Agric. Water Manag. 275, 108037. doi:10.1016/j.agwat.2022.108037
Ramesh, T., Bolan, N. S., Kirkham, M. B., Wijesekara, H., Kanchikerimath, M., Rao, C. S., et al. (2019). Soil organic carbon dynamics: impact of land use changes and management practices: a review. A Rev. 156, 1–107. doi:10.1016/bs.agron.2019.02.001
Raven, P. H., and Wagner, D. L. (2021). Agricultural intensification and climate change are rapidly decreasing insect biodiversity. Proc. Natl. Acad. Sci. 118 (2), e2002548117. doi:10.1073/pnas.2002548117
Roesch, A., Flury, C., Nemecek, T., Mann, S., Ritzel, C., and Gilgen, A. (2023). Indicator-based agri-environmental direct payments: assessment of three systems of different complexity levels. Ecol. Indic. 147, 109886. doi:10.1016/j.ecolind.2023.109886
Sawut, R., Li, Y., Kasimu, A., and Ablat, X. (2023). Examining the spatially varying effects of climatic and environmental pollution factors on the NDVI based on their spatially heterogeneous relationships in Bohai Rim, China. J. Hydrology 617, 128815. doi:10.1016/j.jhydrol.2022.128815
Shouzhang, P. (2020). 1-km monthly mean temperature dataset for China (1901-2022). Natl. Tibet. Plateau Data Cent. doi:10.11888/Meteoro.tpdc.270961
Singh, D., and Singh, B. (2020). Investigating the impact of data normalization on classification performance. Appl. Soft Comput. 97, 105524. doi:10.1016/j.asoc.2019.105524
Sun, J., Hu, Y., Li, Y., Weng, L., Bai, H., Meng, F., et al. (2023a). A temporospatial assessment of environmental quality in urbanizing Ethiopia. J. Environ. Manag. 332, 117431. doi:10.1016/j.jenvman.2023.117431
Sun, Y., Jiang, J., Yang, F., Chen, X., Yu, Z., Guo, Q., et al. (2023b). Spatial-temporal variation analysis of water storage and its impacts on ecology and environment in high-intensity coal mining areas. Land Degrad. and Dev. 34 (2), 338–352. doi:10.1002/ldr.4462
Tang, H., Fang, J., Li, Y., and Yuan, J. J. W. (2024a). Increased sensitivity and accelerated response of vegetation to water variability in China from 1982 to 2022, 16(18), 2677, doi:10.3390/w16182677
Tang, X., Liu, S., Wang, Y., Wan, Y. J. E. S., and Research, P. (2024b). Study on carbon emission reduction countermeasures based on carbon emission influencing factors and trends. Environ. Sci. Pollut. Res. 31 (9), 14003–14022. doi:10.1007/s11356-024-31962-6
Tatem, A. J. (2017). WorldPop, open data for spatial demography. Sci. data 4 (1), 170004–4. doi:10.1038/sdata.2017.4
Tothova, D., and Heglasova, M. (2022). Measuring the environmental sustainability of 2030 agenda implementation in EU countries: how do different assessment methods affect results? J. Environ. Manag. 322, 116152. doi:10.1016/j.jenvman.2022.116152
Wang, C., Liu, L., Zhou, Y., Liu, X., Wu, J., Tan, W., et al. (2024a). Comparison between satellite derived solar-induced chlorophyll fluorescence, NDVI and kNDVI in detecting water stress for dense vegetation across southern China. Remote Sens. (Basel). 16 (10), 1735. doi:10.3390/rs16101735
Wang, C., Liu, L., Zhou, Y., Liu, X., Wu, J., Tan, W., et al. (2024b). Comparison between satellite derived solar-induced chlorophyll fluorescence, NDVI and kndvi in detecting water stress for dense vegetation across southern China. Remote Sens. 16 (10), 1735. doi:10.3390/rs16101735
Wang, P. P., Huang, G. H., Li, Y. P., Liu, Y. Y., and energy, Y. F. L. J. A. (2024c). An ecological input-output CGE model for unveiling CO2 emission metabolism under China's dual carbon goals. Appl. Energy 365, 123277. doi:10.1016/j.apenergy.2024.123277
Wang, Q., Wang, X., Meng, Y., Zhou, Y., and Wang, H. (2023). Exploring the impact of urban features on the spatial variation of land surface temperature within the diurnal cycle. Sustain. cities Soc. 91, 104432. doi:10.1016/j.scs.2023.104432
Wang, Z., Cui, C., and production, S. P. J. J. o.c. (2019). How do urbanization and consumption patterns affect carbon emissions in China? A decomposition analysis. 211, 1201–1208. doi:10.1016/j.jclepro.2018.11.272
Xinfa, T., Guozu, H., Yonghua, W., Dan, L., and Yan, L. J. F. i.E. S. (2023). Research on an equilibrium development model between urban and rural areas of Henan including carbon sink assets under the dual carbon goal. Front. Environ. Sci. 10, 1037286. doi:10.3389/fenvs.2022.1037286
Xinfa, T., and Xue, L. J. F. i.E. S. (2022). Research on energy policies of Jiangxi province under the dual-carbon constraints. Front. Environ. Sci. 10, 986385. doi:10.3389/fenvs.2022.986385
Xu, K., Wang, J., Wang, J., Wang, X., Chi, Y., and Zhang, X. (2020). Environmental function zoning for spatially differentiated environmental policies in China. J. Environ. Manag. 255, 109485. doi:10.1016/j.jenvman.2019.109485
Yang, H., Yu, J., Xu, W., Wu, Y., Lei, X., Ye, J., et al. (2023). Long-time series ecological environment quality monitoring and cause analysis in the Dianchi Lake Basin, China. Ecol. Indic. 148, 110084. doi:10.1016/j.ecolind.2023.110084
Yang, Y., and Cai, Z. (2020). Ecological security assessment of the Guanzhong Plain urban agglomeration based on an adapted ecological footprint model. J. Clean. Prod. 260, 120973. doi:10.1016/j.jclepro.2020.120973
Yuan, B., Fu, L., Zou, Y., Zhang, S., Chen, X., Li, F., et al. (2021). Spatiotemporal change detection of ecological quality and the associated affecting factors in Dongting Lake Basin, based on RSEI. J. Clean. Prod. 302, 126995. doi:10.1016/j.jclepro.2021.126995
Zhang, H., Liu, Y., Li, X., Feng, R., Gong, Y., Jiang, Y., et al. (2022a). Combing remote sensing information entropy and machine learning for ecological environment assessment of hefei-nanjing-hangzhou region, China. J. Environ. Manag. 325, 116533. doi:10.1016/j.jenvman.2022.116533
Zhang, K., Wang, S., Bao, H., and Zhao, X. (2019). Characteristics and influencing factors of rainfall-induced landslideand debris flow hazards in Shaanxi Province, China. Nat. Hazards Earth Syst. Sci. 19 (1), 93–105. doi:10.5194/nhess-19-93-2019
Zhang, M., Kafy, A.-A., Ren, B., Zhang, Y., Tan, S., and Li, J. (2022b). Application of the optimal parameter geographic detector model in the identification of influencing factors of ecological quality in Guangzhou, China. Land 11 (8), 1303. doi:10.3390/land11081303
Zhang, N., Xiong, K., Zhang, J., and Xiao, H. (2023a). Evaluation and prediction of ecological environment of karst world heritage sites based on google earth engine: a case study of Libo-Huanjiang karst. Environ. Res. Lett. 18 (3). doi:10.1088/1748-9326/acba2f
Zhang, R., Li, P., and Xu, L. (2022c). Evaluation and analysis of ecological security based on the improved three-dimensional ecological footprint in shaanxi province, China. Ecol. Indic. 144, 109483. doi:10.1016/j.ecolind.2022.109483
Zhang, X., Fan, H., Liu, F., Lv, T., Sun, L., Li, Z., et al. (2023b). Coupling coordination between the ecological environment and urbanization in the middle reaches of the Yangtze River urban agglomeration. Urban Clim. 52, 101698. doi:10.1016/j.uclim.2023.101698
Zhang, Y., She, J., Long, X., and Zhang, M. (2022d). Spatio-temporal evolution and driving factors of eco-environmental quality based on RSEI in Chang-Zhu-Tan metropolitan circle, central China. Ecol. Indic. 144, 109436. doi:10.1016/j.ecolind.2022.109436
Zhang, Z., Cai, Z., Yang, J., and Guo, X. (2022e). Ecological environmental quality assessment of Chinese estuarine wetlands during 2000–2020 based on a remote sensing ecological index. Front. Mar. Sci. 9. doi:10.3389/fmars.2022.981139
Zhao, N., and You, F. J. A. E. (2020). Can renewable generation, energy storage and energy efficient technologies enable carbon neutral energy transition? Appl. Energy 279, 115889. doi:10.1016/j.apenergy.2020.115889
Zhao, X., Ma, X., Chen, B., Shang, Y., and Song, M. J. R. (2022). Challenges toward carbon neutrality in China: strategies and countermeasures. Resour. Conserv. Recycl. 176, 105959. doi:10.1016/j.resconrec.2021.105959
Zou, C., Zhu, J., Lou, K., and Yang, L. (2022a). Coupling coordination and spatiotemporal heterogeneity between urbanization and ecological environment in Shaanxi Province, China. Ecol. Indic. 141, 109152. doi:10.1016/j.ecolind.2022.109152
Keywords: remote sensing ecological index (RSEI), hurst exponent, google earth engine (GEE), geodetector, dual carbon goals
Citation: Li J, Hu Y, Li J, Yang L and Yan J (2025) Multidimensional analysis and enhancement strategies for ecological environment quality at the county level under dual carbon goals: a case study of Shaanxi Province, China. Front. Environ. Sci. 13:1513325. doi: 10.3389/fenvs.2025.1513325
Received: 18 October 2024; Accepted: 02 January 2025;
Published: 20 January 2025.
Edited by:
Changchun Huang, Nanjing Normal University, ChinaReviewed by:
Tang Xinfa, Jiangxi Science and Technology Normal University, ChinaZhen Zhang, Anhui University of Science and Technology, China
Copyright © 2025 Li, Hu, Li, Yang and Yan. This is an open-access article distributed under the terms of the Creative Commons Attribution License (CC BY). The use, distribution or reproduction in other forums is permitted, provided the original author(s) and the copyright owner(s) are credited and that the original publication in this journal is cited, in accordance with accepted academic practice. No use, distribution or reproduction is permitted which does not comply with these terms.
*Correspondence: Yongxin Hu, aHV5b25neGluMThAbWFpbHMudWNhcy5hYy5jbg==