
94% of researchers rate our articles as excellent or good
Learn more about the work of our research integrity team to safeguard the quality of each article we publish.
Find out more
ORIGINAL RESEARCH article
Front. Environ. Sci., 21 March 2025
Sec. Environmental Policy and Governance
Volume 13 - 2025 | https://doi.org/10.3389/fenvs.2025.1511882
This article is part of the Research TopicClimate Risk and Green and Low-Carbon Transformation: Economic Impact and Policy ResponseView all 21 articles
 Haiyan Lu
 Xiaofei Zhao*
Introduction: In order to improve ecological and environmental governance capacities, this study explores the creation and efficacy of a horizontal carbon ecological compensation, aiming to enhance ecological and environmental governance capabilities. The research addresses the critical need for innovative solutions to balance carbon emissions and ecological preservation in river basins, with the YRB serving as a primary case study.
Methods: Net carbon emissions were computed for each YRB province using data from 2013 to 2022, 13 differentiating between carbon surplus and deficit locations. An evolutionary game model that examined dynamic interactions under incentive and punishment mechanisms was built using these computations as the foundation. Important elements affecting the ecological compensatory process for horizontal carbon were found. The viability of the system was demonstrated by the use of machine learning techniques to forecast net carbon 17 emissions under a voluntary trade scenario.
Results: The findings show that the YRB’s carbon emission management and conservation may be greatly enhanced by market-based incentives and appropriate advice. The evolutionary game model revealed that integrating incentive and penalty mechanisms effectively promotes cooperation among provinces, leading to enhanced carbon management. Machine learning predictions further validated the potential of voluntary carbon trading to reduce net emissions, highlighting the practicality of the proposed compensation mechanism.
Discussion: The results offer a theoretical framework for the YRB’s implementation of horizontal carbon ecological compensation. The proposed mechanism, founded on the trade of carbon emissions and backed by confirmation from machine learning, offers a novel approach to ecological protection. This model not only addresses the unique challenges of the YRB but moreover acts as a model for ecological management in other river basins., contributing to broader efforts in sustainable environmental management.
1. Enphasizing the necessity of establishing a horizontal carbon ecological compensation mechanism in the Yellow River Basin.
2. Establishing the horizontal carbon ecological compensation mechanism in the Yellow River Basin.
3. The introduction of machine learning verifies the effectiveness of the horizontal carbon ecological compensation mechanism in the Yellow River Basin.
The severity of the global climate change problem is growing severe. An essential tool for combating climate change and coordinating regional development and ecological protection, carbon ecological compensation has received extensive attention (Mishra et al., 2024). Ecological compensation is a strategic approach that promotes sustainable ecosystem utilization while balancing stakeholder interests through economic incentives (Gao et al., 2019). It works well to lessen regional disparities in ecological and social development and to increase interest in preserving the natural environment (Wu et al., 2024). Currently, research on ecological compensation primarily explores questions like identifying the responsible compensators (Yan and Cao, 2024), who will be compensated (Zhen et al., 2024), how to compensate (Plantinga et al., 2024), and how much to compensate (Chi et al., 2024), seeking to address the disparity between economic gains and the environment. At present, the research on ecological compensation focuses on answering questions such as who compensates (Wang and Mao, 2024). Carbon ecological compensation combines the characteristics of carbon emission reduction and the carbon absorption function of the ecosystem (Tang et al., 2024). The concept of carbon ecological compensation originates from the theory of ecological compensation. Carbon ecological compensation is a new field in the area of ecological compensation and has attracted extensive attention from scholars (Dumortier and Elobeid, 2021; Yang D. et al., 2024). At present, the academic community has not yet formed a unified definition of carbon ecological compensation. According to the concept of ecological compensation, carbon ecological compensation is an arrangement within a market or provisioned via a policy that is designed to compensate carbon sink providers within the ecosystem and encourage them to protect this function and further increase carbon absorption. At the same time, carbon ecological compensation aims to constrain carbon emitters or require them to pay fees, allowing for the dual goals of carbon emission reduction and ecological protection to be achieved. Scholars have emphasized that carbon ecological compensation is a monetized manifestation of the value of ecosystem carbon sink services (Wang B. et al., 2024). Through economic incentives, land users (Yang Y. et al., 2024) or ecosystem managers (Chu et al., 2024) are prompted to take measures conducive to carbon fixation and storage to increase carbon absorption. Forest ecosystems absorb carbon dioxide through photosynthesis and fix it in vegetation and soil. Carbon ecological compensation provides compensation for the costs and service value provided by forest owners or managers for maintaining the forest’s carbon sink functions (Pan et al., 2024). Other scholars have suggested that carbon ecological compensation should also cover the control and regulation of carbon emissions (Li and Xing, 2024). This includes establishing a carbon emission trading market (Bai and Ru, 2024), allowing carbon-emitting enterprises to offset their excess emissions by purchasing carbon quotas or carbon credits (Feng et al., 2024) and transferring funds to carbon sink projects or toward the research and development of emission reduction technologies (Aryal et al., 2024) to optimize the allocation of carbon resources on a society-wide scale (Di et al., 2024). A comprehensive understanding of the mechanism through which carbon ecological compensation balances carbon budgets and promotes the benign operation of the carbon cycle is necessary.
After clarifying the definition and mechanism of carbon ecological compensation, next, we will conduct an in-depth analysis of why carbon ecological compensation is necessary from three aspects: addressing climate change, coordinating regional development, and balancing ecological and economic interests. Global climate change primarily results from excessive greenhouse gas emissions, with carbon dioxide being the most significant contributor. Carbon ecological compensation mitigates global warming by promoting carbon absorption and limiting emissions through economic incentives (Han et al., 2024). The research has shown that ecosystems such as forests (Li P. et al., 2024), wetlands (Xing et al., 2024) and grasslands (Loges et al., 2024) have high carbon sequestration potential. A reasonable carbon ecological compensation mechanism can fully mobilize the enthusiasm of all parties and reduce carbon emissions (Xiufan and Fan, 2024).
At the regional level, differences in economic development levels, industrial structures, and resource endowments among different regions lead to an unbalanced distribution of carbon emissions and absorption (Liu et al., 2024). In general, economically developed regions are often areas with concentrated carbon emissions, manifested as carbon deficits (Tao et al., 2024). In contrast, less developed regions, which are rich in ecological resources, have more carbon sink resources and can generate more carbon absorption, manifested as carbon surpluses (Zeng et al., 2024). Carbon ecological compensation enables economically developed regions to support ecological protection and the construction of carbon sink areas through compensation methods such as funds (Li X. et al., 2024) and technology (Wang and Wang, 2023). The Yellow River Basin’s upper and middle regions in China are rich in ecological resources like forests and grasslands but face economic underdevelopment. In contrast, the lower and middle reaches have a more developed economy, resulting in high industrial activity, energy consumption, and carbon emissions (Xu et al., 2024). Implementing carbon ecological compensation can help close the regional development gap and encourage the coordinated development of the Yellow River (Wang T. et al., 2024).
Carbon ecological compensation can provide economic impetus for ecosystem protection (Deng etal., 2024). When the carbon absorption capacity can be reasonably compensated, carbon absorbers will be more willing to prevent excessive growth and devastation while preserving and enhancing the natural environment (Deng et al., 2024). Taking wetland ecosystems as an example, wetlands have highly efficient carbon sink functions (Zhang et al., 2024). However, owing to the lack of an effective economic incentive mechanism, wetlands have long faced threats such as reclamation and pollution (Mei et al., 2024). Implementing carbon ecological compensation can encourage wetland protection and restoration actions and achieve the sustainable use of ecosystems.
Establishing a carbon ecological compensation strategy is necessary. The next step is to focus on how to specifically implement a carbon ecological compensation mechanism, which involves four crucial aspects. First, the compensation subjects and objects must be defined. Clearly defining the responsible subjects and the beneficiary objects is the foundation and requirement for building an ecological carbon compensation system. Second, compensation standards should be formulated. This requires comprehensively considering a variety of complex factors to ensure that the compensation amount not only reasonably reflects the actual value of lowering carbon emissions and ecological protection but also considers the actual situations of different regions and subjects. Third, compensation models should be selected. In a method for carbon ecological compensation, The real circumstances and development requirements of different locations must be combined and most suitable methods must be choosen to promote the effective allocation of elements such as funds and technologies. Fourth, the compensation methods should be determined. It is essential to select methods that are scientific, feasible, and precise to ensure that the work of the carbon ecological compensation mechanism can be carried out in an orderly and efficient manner.
The key to carbon ecological compensation mechanism lies in reasonably determining the compensation standards. In traditional ecological compensation mechanism, the responsible subjects causing the ecological damage include enterprises that discharge pollutants in violation of regulations and developers who overexploit natural resources. The beneficiary groups include the downstream water-using enterprises that rely on high-quality ecological resources and the nearby residents who benefit from a good ecological environment (Gao et al., 2021). Carbon ecological compensation mechanisms face numerous difficulties in this context. From the perspective of attributing carbon emission responsibility, the various areas’ industrial structures are complex, and accurately determining the carbon emission characteristics of emerging industries is difficult. During the process of industrial transformation, the definitions of historical carbon emission responsibilities and current emission reduction obligations are ambiguous, resulting in difficulties in tracing responsibilities. Because to the impact of elements like shifting land use and variations in the climate, the carbon absorption functions of the carbon-absorbing beneficiary areas are unstable, making it difficult to accurately define the beneficiary range. As a result, there is great uncertainty in the identification of the compensation subjects and objects. When cross-regional carbon projects are implemented, disputes often arise due to the unclear division of responsibilities and rights, which hinders the effective initiation of carbon ecological compensation mechanisms.
Research on carbon ecological compensation has a particular methodological foundation thanks to the ecological compensation accounting techniques now in use, but limitations exist when these methods are applied to carbon ecological compensation scenarios. In order to establish the bottom limit of compensation, the opportunity cost technique attempts to quantify the alternative economic development potential (Du et al., 2023). Regarding the ecological preservation of carbon, it is difficult to accurately quantify intangible costs such as potential market expansion opportunities forgone when enterprises transform to low-carbon production models. The ecosystem service value method conducts monetized valuations from the perspective of various service functions of the ecosystem and serves as a reference for the compensation scale (Du et al., 2023). However, for the carbon ecosystem, owing to the high complexity of the carbon cycle and the strong correlation of different ecological processes, the selection of parameters is relatively subjective, leading to notable variations in the assessments of carbon sinks across various geographical areas. The contingent valuation method uses the public’s subjective valuation of ecological services and their willingness to pay through questionnaires, integrating social preferences into compensation pricing (Peng et al., 2022). However, in carbon ecological compensation mechanisms, owing to the public’s limited knowledge of carbon-related issues and their changeable perspectives in light of the unpredictability of future climate change, the representativeness of the samples is insufficient, and the reliability of the results is poor. The ecological footprint method reflects the compensation demand on the basis of the occupation of natural resources by humans and the ecological carrying status (Yang et al., 2022). Owing to the special flow patterns and spatiotemporal dynamic characteristics of carbon dioxide in ecosystems, this method cannot precisely meet the needs of carbon ecological compensation mechanisms.
One of the fundamental components of carbon ecological compensation systems is the compensation standard. Its formulation requires the comprehensive consideration of various factors. The accounting model developed by combining factors such as gross domestic product, watershed area and population aims to accurately Determine the subjects and objects of compensation and the criteria that relate to them and correlate them with the macroscopic characteristics of the region (Gao et al., 2021). When this method is applied to carbon ecological compensation mechanisms, due to the scattered carbon data statistics and the lack of unified standards, significant variations exist in the accounting standards for carbon emissions and absorption among regions, so it cannot be precisely adapted to the actual needs of carbon compensation mechanisms. When the analysis methods for the ecological service transfer mechanism in the Minjiang River Basin (Lin et al., 2021) are used to analyse the carbon benefit transfer process, owing to the rapid exchange of carbon among multiple media and the frequent interference of human carbon emission activities, the data of key nodes are prone to errors, making it challenging to guarantee the accuracy of carbon ecological compensation systems. The compensation accounting index system in the middle and lower reaches of the Yellow River Basin (Hu et al., 2022) has not fully considered the dynamic changes in carbon elements and cannot flexibly adjust to meet the real-time needs of carbon compensation payments. When evaluating the value of ecosystem services in the Yellow River Basin (Liu et al., 2023) are used to evaluate the worth of ecosystem services related to carbon, they lack an effective response mechanism to external shocks such as fluctuations in carbon market prices and innovation in emission reduction technologies and thus lack stability. The equivalent factor method assessment framework (Yuan et al., 2024) does not completely utilize carbon ecological compensation methods’ potential for varied funding of diversified fundraising and distribution optimization at the local level, which restricts the utilization efficiency of the funds and the compensation effects.
Carbon ecological compensation methods are diverse. Common compensation methods include monetary compensation and policy compensation (Gong et al., 2024). Monetary compensation methods enable carbon absorption providers to obtain economic benefits by paying them cash or other forms of monetary compensation, which can be used to support the continuous operation of carbon sink projects and ecological protection activities (Yan and Cao, 2024). Policy compensation methods mainly reduce the operating costs of carbon absorption projects and improves their economic benefits and competitiveness by formulating preferential policies (Gong et al., 2024). In China, ecological compensation funds primarily depend on central government financial support, leading to a limited and singular funding source. China’s carbon ecological compensation model remains in the early exploratory phase. Financing from the central government provides support, but the enthusiasm of local capital markets to participate is not high.
A survey of the body of research indicates that the following problems exist in the theoretical assumptions and practical applications of carbon ecological compensation mechanisms. First, the division of responsibilities is ambiguous. In carbon ecological compensation mechanisms, there is a lack of clear detailed rules for defining the responsibilities between the subject and the object. In complex situations such as cross-regional industrial transfer and energy allocation, Clarifying the attribution of carbon absorption rights and interests as well as the traceability of carbon emission obligations is challenging, which hinders the operation of the compensation mechanism. Second, there is a lack of unified measurement standards. There is currently no universally recognized and effective method for accounting for carbon emissions. Owing to the diverse data sources and varying levels of precision adopted in the existing studies and the poor fit between model assumptions and complex real-world carbon cycle scenarios, the results obtained by different research teams vary greatly, making it difficult to form authoritative conclusions and provide reliable bases for policy formulation. Third, there is a lack of means to quantify ecological capital. Owing to the unique physical and chemical properties and complex flow characteristics of carbon resources, it is difficult to monetize them. The carbon finance market has developed slowly, and relevant derivatives are scarce, resulting in the absence of a strong basis for norms of compensation. The implementation of the market mechanism in carbon ecological compensation mechanisms faces obstacles, and long-term planning is often difficult because of short-term fluctuations in carbon market prices and the complex interactions among stakeholders, which affects the stability and sustainability of carbon ecological compensation mechanisms. Many scholars have achieved remarkable results in terms of the construction of a theoretical framework for carbon ecological compensation (Sun et al., 2024), value assessment (Niu H. et al., 2024) and defining the necessity (Zhu et al., 2023); however, there are still obvious deficiencies in the exploration of the implementation path for carbon ecological compensation mechanisms. Most of the current studies focus on conceptual definitions and theoretical analyses at the macro level. The main perspectives used to describe carbon ecological compensation mechanisms are the control of carbon emissions and the commercialization of the ecosystem’s carbon sink service value. The significance of carbon ecological compensating mechanisms in terms of requirement in responding to climate change, coordinating regional development and promoting ecological protection has also been fully demonstrated. However, with respect to the specific implementation of carbon ecological compensation mechanisms, the existing studies have failed to provide clear, comprehensive and highly operable implementation paths.
To verify the effectiveness of ecological compensation mechanisms, The majority of current research has been on assessing the efficacy of the policies that have been put into place. By collecting various types of data after implementation and applying traditional statistical analysis methods and empirical research models, such as cost‒benefit analysis and the DID method, how policies affect goals such as ecological protection and regional coordinated development can be measured. The binary unordered logit regression model has been used in previous studies to investigate the regional advantages of the Yellow River Basin’s horizontal ecological (Zhu et al., 2023). Heterogeneity analysis assessed The upstream horizontal ecological compensation mechanism’s profitability in (Liu et al., 2022). The Xin’an River ecological compensation policy’s 238 environmental consequences were assessed using the DID technique. (Jing and Zhang, 2018) and how it affects the Shiyang River Basin’s economic growth (Shang et al., 2022). Additionally, the data envelopment analysis (DEA) model measured the efficiency of a government-led watershed ecological initiative (Chen et al., 2018). Postevaluation methods can provide a basis for the improvement and perfection of implemented policies. However, for policies that have not yet been implemented, the ability of these methods to predict the effectiveness of a policy is obviously limited. At present, China has not yet established a carbon ecological compensation mechanism. Machine learning technology provides a new perspective for verifying the effectiveness of carbon ecological compensation policies. Compared with traditional methods, machine learning has several key advantages in terms of its ability to identify complex, nonpredefined structures in the data (Mullainathan and Spiess, 2017). Although traditional social science research is usually rooted in theory-driven deductive reasoning, this approach sometimes limits the ability to discover hidden patterns (Kreif and DiazOrdaz, 2019). Machine learning is adept at fitting complex and flexible models to data, effectively avoiding overfitting, and simultaneously revealing complex relationships that might remain ambiguous when traditional methods are used. This ability to uncover hidden insights explains why machine learning has been widely employed in data generation (Haenlein and Kaplan, 2019), predictive analyses (Shamshoddin et al., 2020) and causal identification (Bajari et al., 2015). By leveraging the predictive power of machine learning, researchers can estimate causal effects more accurately and explore counterfactual scenarios to conduct policy evaluations in advance (Hindman, 2015; Abrell et al., 2019; Cicala, 2022). When designing carbon ecological compensation policies, machine learning can predict the impacts of a policy on increases in carbon absorption and reductions in carbon emissions when taking into account modifications to elements like the requirements for compensation combinations of compensation methods, and definitions of the target audience. Machine learning can also promote research on carbon ecological compensation policies, shifting the research from simple postevent analyses to comprehensive research paradigms that combines prevent predictions and postevent evaluations.
The government, businesses, communities, and other organizations have paid close attention to the ecological preservation of the Yellow River (Jin, 2019). A thorough framework and institutional mechanism for ecological compensation in the Yellow River Basin (YRB) have been gradually built by China. The Implementation Plan for the Pilot Program to Support and Guide the Establishment of a Horizontal Ecological Compensation Mechanism across the Entire Yellow River Basin was released in April 2020 by the National Forestry and Grassland Administration, the Ministry of Finance, the Ministry of Ecology and Environment, and the Ministry of Water Resources. The Outline of the Yellow River Basin Ecological Protection and High-quality Development Plan was released in October 2021 by the State Council and the Central Committee of the Communist Party of China. A significant legislative milestone was reached in October 2022 with the promulgation of the People’s Republic of China’s Yellow River Protection Law. This law demonstrates the ambition of the Chinese central government to strengthen comprehensive governance and coordination in establishing an ecological protection compensation across administrative regions. Additionally, the plan encourages government entities in the upper and lower reaches, as well as along the main and tributary rivers, to actively engage in and support the compensation mechanism. It also promotes implementing horizontal ecological protection compensation through cooperation, negotiation, or market-based approaches. The significance of a horizontal ecological compensation method within the Yellow River Basin’s (YRB) ecological framework is emphasized by this law. On June 1, 2024, the Regulations on Ecological Protection Compensation went into force. They provided comprehensive details about what ecological protection compensation is, its working principles and mechanisms, as well as information about market-oriented compensation, fiscal vertical compensation, interregional horizontal compensation, and bolstering guarantee, supervision, and management mechanisms. It highlights the need of fully using the market mechanism and pushes social forces and local governments to implement ecological compensation in line with market regulations. The various Yellow River Basin regions range greatly in terms of their degrees of economic growth and carbon emission status (Niu J. et al., 2024). The majority of the higher reaches are crucial ecological barrier zones, highlighting crucial 293 duties such soil and water conservation. Their industrial development is restricted, and their economies are relatively underdeveloped (Wang Z. et al., 2024). The downstream areas are densely populated and have many industries, resulting in a large total amount of carbon emissions (Dong, 2024). In the Yellow River Basin, the horizontal carbon ecological compensation mechanism can act as a bridge between coordinated economic growth and ecological preservation. Economic incentives have been utilized to promote carbon absorption and emission reductions in order to alleviate the ecological issues brought on by climate change in the Yellow River Basin. These actions are intended to promote ecological preservation and high-quality development, guarantee equitable resource distribution, and balance the rights of development between upstream and downstream areas as well as both riverbanks.
In order to determine the net carbon emissions of nine provinces in the Yellow River Basin, this study begins with the goal of lowering carbon emissions and views carbon emission rights as a limited resource. A cost-benefit game model is developed to examine the carbon ecological compensation concerns of carbon-deficit and carbon-surplus provinces in the Yellow River Basin by combining prospect theory and the game technique from the standpoint of net carbon emissions. In order to arrive at the best solution, it seeks to inspire people to work together to conserve the carbon ecological environment. The horizontal carbon ecological compensation mechanism’s implementation path in the Yellow River Basin is the subject of additional empirical research, and voluntary transactions are encouraged as a means of achieving the mechanism. The following issues are intended to be resolved by this study: (1) Establish the compensation criteria as well as the issues and goals of the Yellow River Basin’s carbon ecological compensation system. Taking the years from 2013 to 2022 as an example, the subjects and objects are distinguished according to their net carbon emissions, and the carbon prices corresponding to each year are used as the corresponding compensation standards. (2) A horizontal carbon ecological compensation mechanism is constructed. This mechanism involves several key entities, namely, supply entities, demand entities, regulatory entities, technical support systems, and trading platform entities. These organizations work together to encourage provinces to trade their voluntary carbon emission rights, which makes it possible to put the interprovincial horizontal carbon ecological compensation system into place. (3) Finally, the mechanism’s efficacy is confirmed. The net carbon emissions of each province under the trade circumstances are predicted using machine learning, which also simulates the voluntary trading of carbon emission rights. Figure 1 depicts the research methodology used in this study.
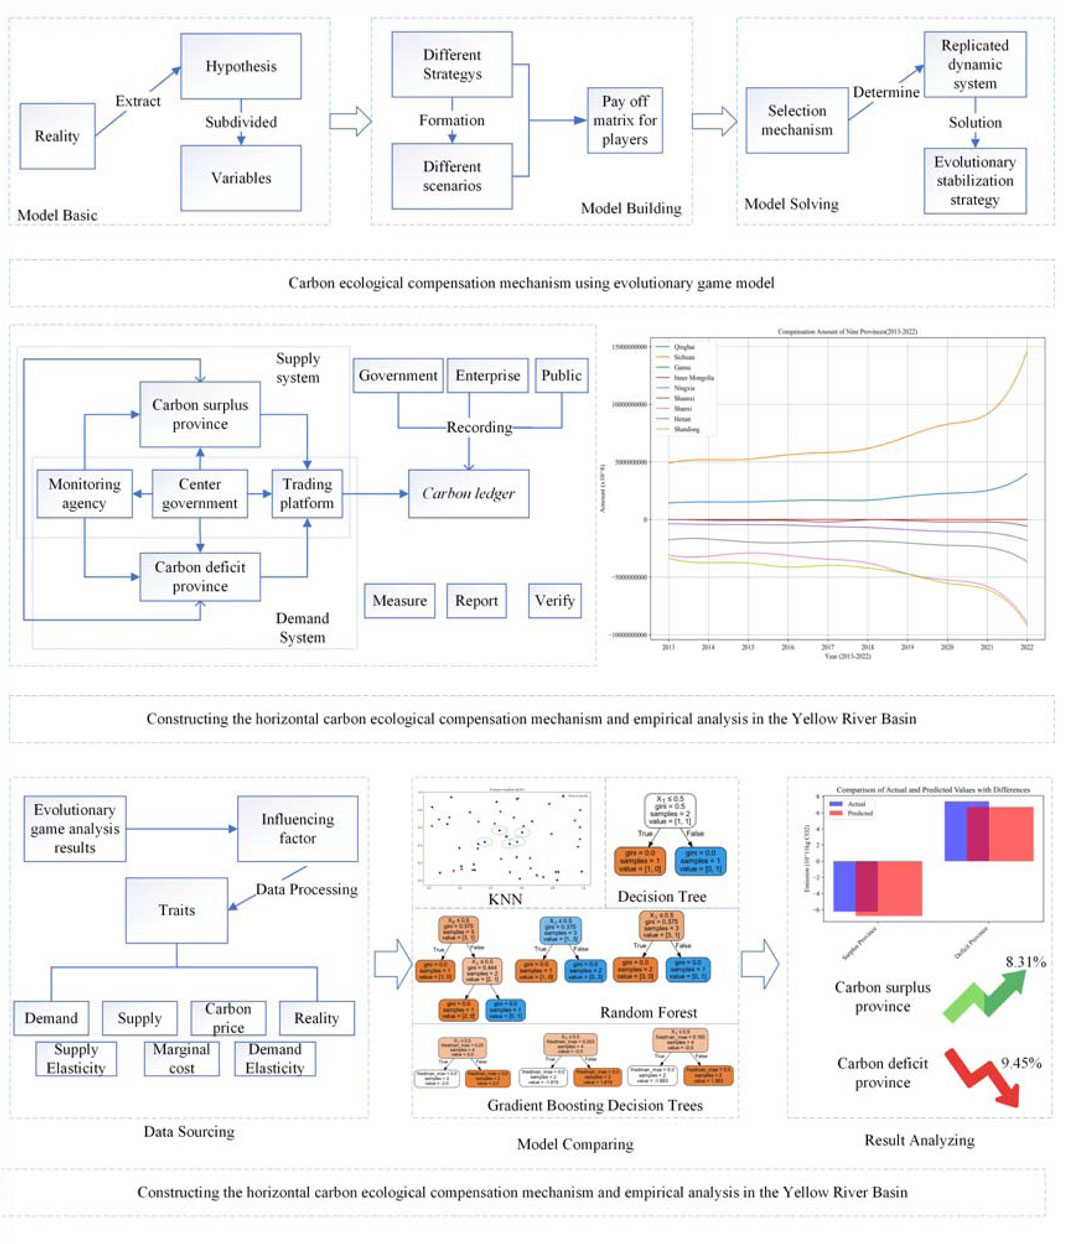
Figure 1. Flow chart of the research presented in this paper.
In this study, the complementary approaches of evolutionary game theory and machine learning offer a thorough examination of the ecological compensation mechanism for horizontal carbon in the Yellow River Basin.
Evolutionary game theory offers the context and direction for machine learning. Based on the bounded rationality of local governments in the provinces of the Yellow River Basin, evolutionary game theory constructs a strategic interaction model between carbon surplus and carbon deficit provinces. By analyzing the strategy choices of provinces under different cost-benefit scenarios, key factors influencing the carbon ecological compensation mechanism are identified, such as carbon ecological protection costs, benefits, and the central government’s rewards and punishments. These factors form the core variables that the machine learning model needs to consider, clarifying the research context and direction for machine learning. The analytical findings of evolutionary game theory may be utilized to concentrate on the aspects that significantly influence provinces’ strategy choices when choosing the input variables for the machine learning model. This will bring the model closer to the real decision-making process.
Machine learning provides quantitative support and validation for evolutionary game theory. Machine learning may reveal the intricate non-linear links between carbon emissions and a wide range of influencing factors by learning and analyzing vast volumes of historical data. Machine learning can forecast the net carbon emissions of the Yellow River Basin provinces under various scenarios and strategies by using these linkages. This provides concrete quantitative data support for the analysis of strategy choices in evolutionary game theory. Through the predictions of machine learning, the effects of different strategy combinations in evolutionary game theory can be validated, making the theoretical analysis more convincing.
Machine learning compensates for the lack of quantification in evolutionary game theory: Although evolutionary game theory can analyze the strategic interactions and decision-making logic of provinces under the carbon ecological compensation mechanism from a theoretical perspective, it is difficult to precisely quantify the actual impact of different strategies on carbon emissions. Evolutionary game theory may suggest that carbon deficit provinces, under high compensation pressure, may choose emission reduction strategies, but it cannot predict the exact amount of reduction. Machine learning excels at handling complex data and making precise numerical predictions, addressing this gap and providing more specific quantitative support for policy formulation.
Evolutionary game theory overcomes the issue of the lack of decision-making logic explanation in machine learning. While machine learning can accurately predict carbon emissions, it cannot deeply explain the decision-making logic behind the predictions and the strategic interaction mechanisms between provinces. For example, machine learning can predict that changes in carbon trading prices will lead to changes in carbon emissions but cannot explain how this change occurs in the strategic game between provinces. Evolutionary game theory, on the other hand, can explain the reasons for strategy choices and the dynamic process of change from the perspective of the participants’ decision-making behavior.
Combining the two methods allows us to comprehend the overall policy logic and development trends, as well as the strategic interactions and decision-making behavior of the parties involved in the carbon ecological compensation mechanism from the standpoint of evolutionary game theory. We can also take advantage of machine learning’s capacity to process and analyze vast amounts of data in order to accurately predict carbon emissions under various strategies and evaluate the real effects of policies. The working principles of the horizontal carbon ecological compensation mechanism in the Yellow River Basin may be more thoroughly and thoroughly revealed by this multi-perspective study approach, offering more trustworthy backing for the development and improvement of policies
The Yellow River rises in the Bayankara Mountains of Qinghai Province, China, and runs through nine provinces before emptying into the Bohai Sea. These provinces are Qinghai, Sichuan, Gansu, Ningxia, Inner Mongolia, Shanxi, Shaanxi, Henan, and Shandong. It encompasses a basin area of 795,000 km2 and is 5,464 kilometers long overall. (Figure 2). Ensuring the reasonable and sustainable utilization of these lands is crucial for continued regional development.
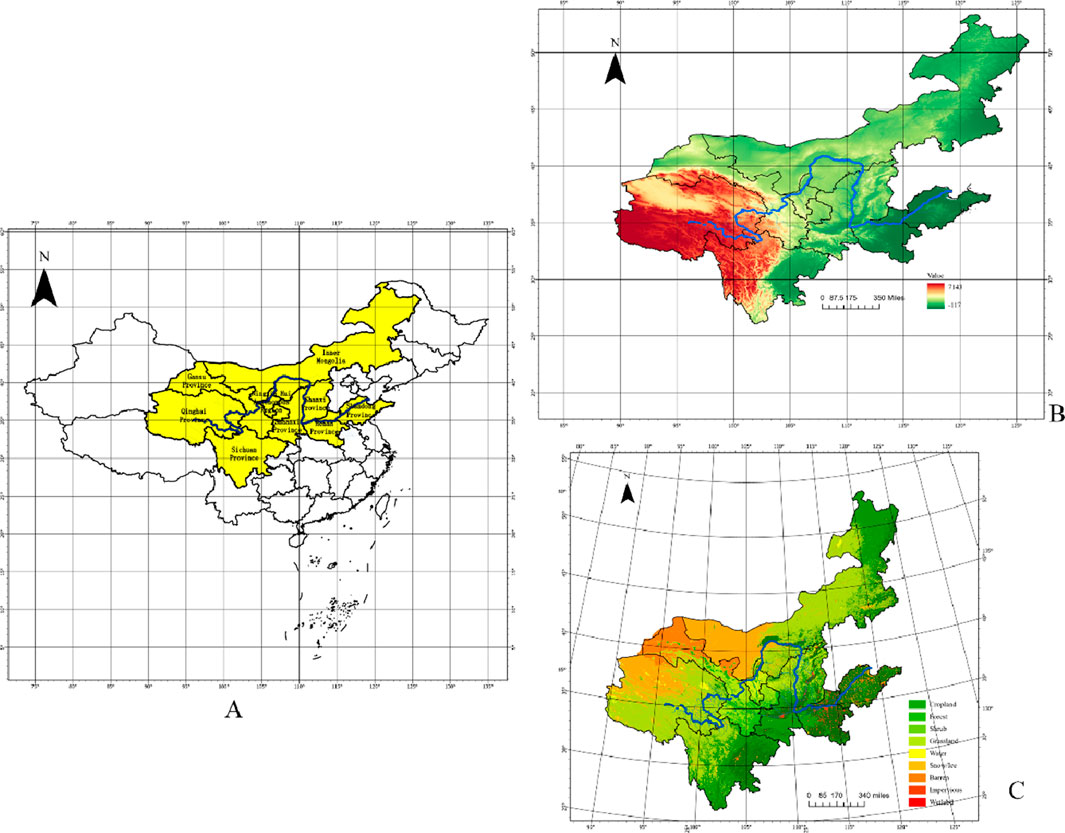
Figure 2. General situation of study area. (A) National area map; (B) DEM map; (C) land use type.
CO2 emission sources in the Yellow River Basin (YRB) can be classified into 3 main groups. The first group is industrial activities. Heavy industries such as cement production and steel manufacturing significantly impact regional CO2 emissions because of their high emission characteristics during the industrial production process due to the combustion of fossil fuel. The secondly group is agricultural practices, which contribute to the emissions of greenhouse gases, including both CO and CO2. Activities such as fertilizer application, tillage, and rice cultivation emit these gases through microbial processes. The third group is municipal solid waste (MSW) treatment. Landfilling and incineration add to CO2 emissions. Organic waste decomposition in landfills generates methane, whereas incineration releases CO2 and other harmful gases. Additionally, livestock farming, particularly with ruminant animals such as cows and goats, is a significant source of CO2 emissions in the YRB.
CO2 absorption in the Yellow River Basin (YRB) occurs primarily in natural ecosystems and urban green spaces. Forests and grasslands serve as major terrestrial carbon sinks, actively converting atmospheric CO2 into organic matter through photosynthesis and storing it in vegetation and soil. Forest ecosystems, in particular, possess significant carbon storage capacity, with tree canopies and roots contributing to biomass accumulation. The decomposition of fallen leaves and litter further promotes long-term carbon fixation in the soil. Wetlands and reservoirs in the YRB also play crucial roles in the carbon cycle. These water bodies effectively store carbon through the photosynthesis of aquatic plants and the decomposition of dead plant tissues. The anaerobic environment of wetlands slows the decomposition rate of organic matter, facilitating long-term stable carbon storage. Compared with natural ecosystems, urban green spaces, including city parks, street greenbelts, community gardens, and roof gardens, contribute to CO2 absorption in cities, albeit on a smaller scale. Soil, one of the largest active carbon pools on Earth, has significant carbon storage potential that can be enhanced through sustainable land management practices such as no-tillage, organic agriculture, rotation and intercropping systems, and the application of organic fertilizers.
To address the multiple challenges facing the YRB, including water resource management, ecological protection, and land use, concerted efforts from the government and all stakeholders are essential. The formulation of scientific, thoughtful, and practical policies and measures is crucial to promoting sustainable development in the basin, ensuring economic prosperity, ecological balance, and social progress.
Taking 2013–2022 as an example, the data for the nine provinces in the Yellow River Basin were collected from the IPCC2006 report [Publications - IPCC-TFI (iges.or.jp)], China Statistical Yearbook (stats.gov.cn), China Environmental Statistical Yearbook (nbsti.net), China Energy Statistical Yearbook (ctbu.edu.cn), and China Rural Statistical Yearbook (ctbu.edu.cn). The missing data were treated by interpolation, and these data were checked, examined and finally developed into a socioeconomic database for further analyses.
To maintain data integrity and ensure analytical accuracy, we employed multiple interpolation methods to handle anomalies in the data, including missing values and negative numbers. In this study, five distinct interpolation methods were utilized: linear interpolation, nearest-neighbor interpolation, median interpolation, polynomial interpolation, and spline interpolation. Comparing the efficacy of different approaches and choosing the best strategy based on the study’s data characteristics was the aim.
Linear interpolation is a straightforward and commonly used method that assumes a linear relationship between adjacent data points. This method constructs a linear function based on known data points and calculates the interpolated value for anomalies by leveraging the linear relationship between neighboring normal data points. Nearest-neighbor interpolation replaces anomalies with the closest non-anomalous value. In the implementation, we iterated through all anomalies, identified the nearest normal data point, and assigned its value to the anomaly’s position. Median interpolation involves calculating the median of non-anomalous values within a defined window around the anomaly and using this median as the interpolated value. Specifically, for each anomaly, a window of a certain range before and after the anomaly was determined, non-anomalous values within the window were extracted, and their median was computed and used to replace the anomaly. Polynomial interpolation approximates the data’s trend by fitting a polynomial function. We used the “polyfit” function from the “numpy” library to fit a cubic polynomial, obtained the polynomial coefficients, and then created the polynomial function using the “poly1d” function. This function was subsequently applied to interpolate the anomalies. Spline interpolation employs cubic spline functions, which ensure smoothness while effectively capturing local features of the data. We utilized the “CubicSpline” function from the “scipy” library, with boundary conditions set to “natural,” to perform spline interpolation.
We evaluated each strategy using MSE and MAE in order to determine the best interpolation technique. The average squared discrepancy between expected and actual values is measured by MSE. while MAE represents the average absolute difference. Lower error values indicate better interpolation performance. By comparing the evaluation metrics of different interpolation methods, we considered factors such as error magnitude, data characteristics, and research requirements. Ultimately, we chose different interpolation methods for different datasets, aiming to minimize error values. This approach ensures data accuracy while better reflecting the inherent patterns in the data, providing a solid basis for further research and model development.
Innovative strategies are desperately needed to support both the YRB’s ecological conservation and high-quality interregional growth. Existing ecological compensation mechanisms often inadequately address the regional disparities in carbon emissions and absorption capacities. This study proposes a horizontal carbon ecological compensation mechanism aimed at promoting regional collaborative governance in the YRB by internalizing the externalities of ecological services. The constructed horizontal carbon ecological compensation mechanism in the YRB aims to strengthen basin governance. To improve basin governance, the YRB has implemented a horizontal carbon ecological compensation scheme. It treats carbon emission rights as a limited resource while recognizing the CO2 absorption capacity of provinces along the Yellow River Basin as a source of revenue. By internalizing the externalities of ecological basin services, this mechanism utilizes interprovincial transfer payments to promote high-quality regional development. It promotes voluntary trade for horizontal carbon ecological compensation amongst YRB provinces. The supply subject is one of the main parties taking part in the YRB’s horizontal carbon ecological compensation system. This mechanism facilitates voluntary carbon emission rights trading among provinces in the YRB. Machine learning is applied to simulate these transactions and predict net carbon emissions across provinces, evaluating the horizontal carbon ecological compensating mechanism’s efficacy.
Before a carbon ecological compensation mechanism can be put into place, its purpose and subject must be made clear. The principle of “who provides, who benefits” has been recognized in defining ecological compensation objects. Based on their net carbon emissions, each province is classified as either a carbon 475 surplus or a carbon deficit province once the topic and goal of carbon 474 ecological compensation mechanisms are established. The following is the 476 calculating model for net carbon emissions:
The meaning of each parameter is shown in Table 1.
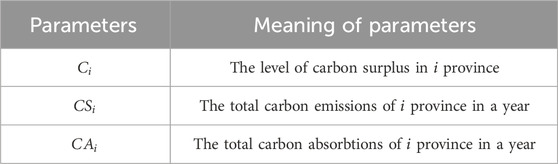
Table 1. Parameters in the discriminant model and their implications.
When
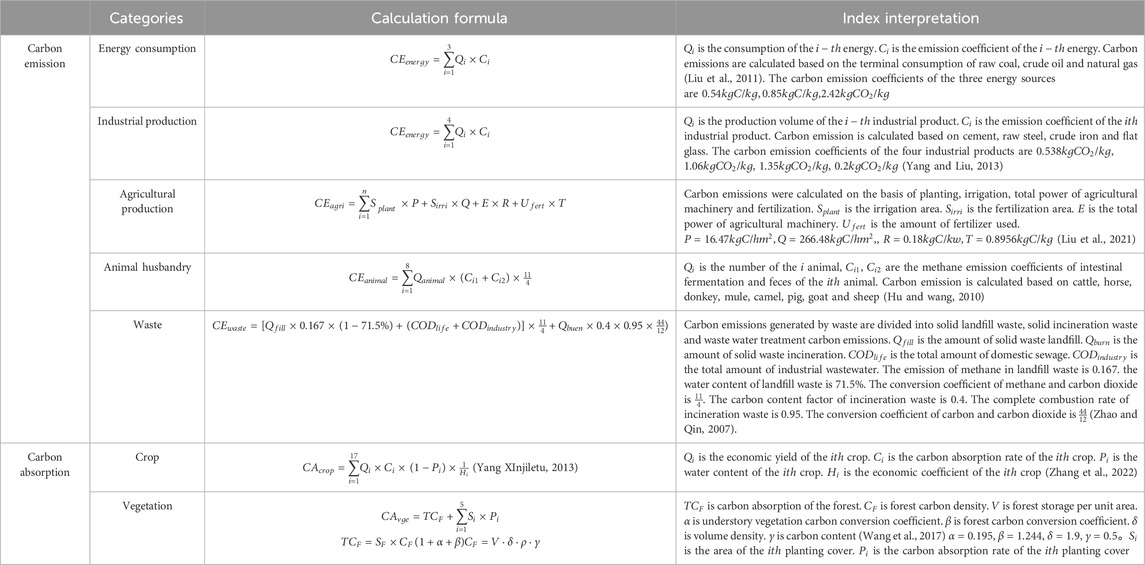
Table 2. The accounting methods of carbon absorption and emissions.
Each local government is treated as a bounded rational actor, incorporating insights from prospect theory. The parameters pertaining to the game’s participants are established. On the basis of the calculations mentioned earlier, provinces are classified into carbon deficit provinces and carbon surplus provinces. Using a cost‒benefit evolutionary game model, governments in deficit and surplus scenarios engage in strategic interactions, and the outcomes of these strategies are analysed in Appendix A.
After the reward and punishment mechanism are introduced, a new game model is constructed to examine the evolutionary stability of carbon surplus provinces, carbon deficit provinces, and the associated entities. The analysis process is detailed in Appendix B.
The cost of carbon ecological protection in carbon surplus provinces is denoted as
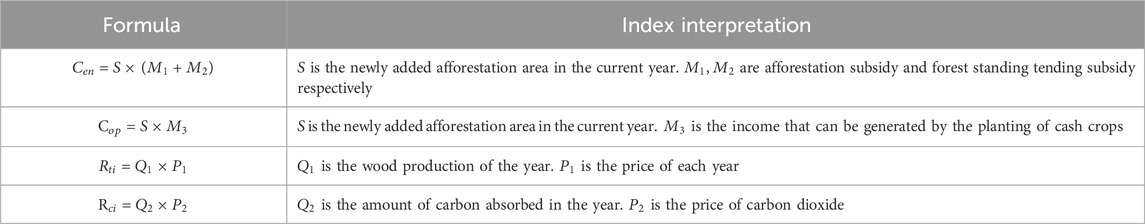
Table 3. Cost-benefit accounting methods.
A new test feature vector in the KNN method is categorized according to the class of its k nearest neighbors. To calculate closeness, the technique usually uses the Euclidean distance measure. (Hmeidi et al., 2008). In the KNN algorithm, a new test feature vector is classified based on the class of its k nearest neighbors. The algorithm typically employs the Euclidean distance metric to determine proximity. (Pan et al., 2004). The Euclidean distance index d (x,y) is calculated as follows:
where
The data pertaining to the Yellow River Basin’s carbon ecological compensation mechanism is analyzed in this study using the KNN method. For example, it may be used to predict the category or a certain trend of carbon surplus or deficit provinces under different conditions. By finding historical data samples that are similar to the current situation (i.e., the nearest neighbors) and basing on the characteristics of these samples to infer future situations, It supports the research of the carbon ecological compensation mechanism in the Yellow River Basin with data and serves as a foundation for decision-making. The advantages of the KNN algorithm lie in its simplicity and intuitiveness, being easy to understand and implement, and being capable of handling multi - classification problems, as well as having a certain adaptability to complex data distributions. However, it also has some limitations. For example, the computational complexity is relatively high, especially when dealing with large - scale data sets, as it needs to determine the separation between every training sample and every test sample. it is sensitive to feature scaling. If the scales of features vary greatly, it may lead to deviations in distance calculation and thus affect the classification results; and it is easily affected by noisy data and outliers, because a few abnormal samples may change the distribution of the nearest neighbors and thus affect the classification decision.
Because it is nonparametric and provides a great deal of flexibility, the decision tree approach is one of the most often used machine learning techniques. All potential predictor values are separated into discrete, nonoverlapping sections known as the predictor space via a classification and regression tree (CART). This process, known as recursive partitioning, automatically identifies main effects, including nonlinear correlations and interactions. The tree structure grows on the basis of these nonoverlapping regions, with the terminal regions referred to as leaf nodes, representing distinguishable subgroups. For classification tasks, predictions assign observations to the most prevalent class within the leaf node (James et al., 2013). For continuous outcomes, the prediction in a decision tree is the average response value of the observations within a specific node. The growth of a tree involves splitting it according to specific criteria. In contrast, conditional inference trees grow on the basis of the strength of univariate associations (Strobl et al., 2007). Individual decision trees are highly interpretable and adept at identifying nonlinear correlations and interactions between variables. They typically split once on a single feature, which simplifies the decision logic of the tree and enhances interpretability.
Random forest (RF), a machine learning algorithm, was initially proposed by Breiman in 2001 (Breiman, 2001). By employing bootstrap aggregation, commonly referred to as bagging, RF significantly minimizes errors in both classification and regression analyses. This method demonstrates strong resilience and maintains high accuracy even when the target data contains noise or inconsistencies (Kontschieder et al., 2015). Its ability to handle complex datasets while preserving reliability has made it a widely adopted tool in various predictive modeling applications. The essence of RF lies in minimizing prediction errors while considering the correlation between the decision trees within the forest and their predictions (Chan and Paelinckx, 2008). This method has been successful in solving both regression and classification problems. RF and other machine learning algorithms have been applied to predict urban runoff quality on the basis of variables representing rainfall events. Researchers have also analysed the relative importance of these rainfall variables to assess their impact on urban stormwater quality (Jeung et al., 2019). In CO2 emission prediction, researchers have developed a random forest model that incorporates a comprehensive array of urban governance factors to predict CO2 emissions. They have also conducted detailed analyses on how these governance factors relate to CO2 emissions (Zhang et al., 2023). In numerous studies, simple regression models are commonly used for predicting target variables because of their structural simplicity (Jiang etal., 2020). However, these models have inherent limitations, including susceptibility to underfitting, sensitivity to outliers, and lower accuracy in handling nonlinear data (Qiao et al., 2020). The RF algorithm, on the other hand, surpasses simple regression models by leveraging techniques such as random sampling of training data subsets and random algorithms for tree construction (Panov and Džeroski, 2007). This approach enhances prediction performance by mitigating overfitting and improving robustness against noise in the data. In RF, the final estimated value is the average of all results from each tree, where each tree contributes to the estimation with a specific weight. However, owing to the “black box” nature of this approach, individual examinations of each tree cannot be conducted (Prasad et al., 2006). RF models offer significant advantages in handling multivariate data. They enhance the prediction accuracy and improve the generalizability by constructing a series of decision trees and combining their prediction results. This characteristic makes RF more robust and reliable in providing forecasting outcomes, especially when dealing with complex environmental and economic data. RF models can assess the impact of each feature on the prediction results. By calculating feature importance and visualizing it, we can determine which features are most crucial for predicting demand and supply quantities. This helps us to understand the inherent relationships in the data, guiding further data exploration and feature engineering.
An ensemble learning technique called Gradient Boosting Decision Tree (GBDT) creates decision trees in a step-by-step manner while reducing the loss function to get close to the actual value. It combines many decision trees and GBDT is widely used for various tasks, including regression (Ding et al., 2018) and logistic regression (Lombardo et al., 2015). It represents a specific implementation of boosting machines (Sutton, 2005). GBDT is renowned as one of the most powerful algorithms in machine learning and has achieved remarkable success rates across diverse fields, such as healthcare (Ding et al., 2018; Morid et al., 2017), education (Hew et al., 2020), energy (Lu et al., 2020), and economics (Carmona et al., 2019). GBDT is often considered a “black-box” model, implying that its algorithms and predictions are not easily interpretable by humans through simple examination of its parameters and features.
On the basis of the analysis results in Section 2.3.2, six key variables were used to evaluate the carbon ecological compensation mechanism in the YRB. These variables include the net CO2 emissions of the carbon surplus and deficit provinces, the costs associated with carbon ecological protection, the related revenues, the CO2 trading volume and the CO2 price. During the simulated voluntary trading process, the net carbon emissions of the carbon surplus provinces and the carbon deficit provinces served as the supply and demand, respectively. The collected data underwent rigorous cleaning procedures, which involved identifying and addressing outliers (Figure 3), filling in missing values, correcting errors and inconsistencies in the data records, and ensuring the overall accuracy and consistency of the datasets (Figure 4). Data cleaning is crucial for maintaining the reliability of subsequent analyses and the validity of model predictions, thereby ensuring the quality of the data analysis and the credibility of the research outcomes.
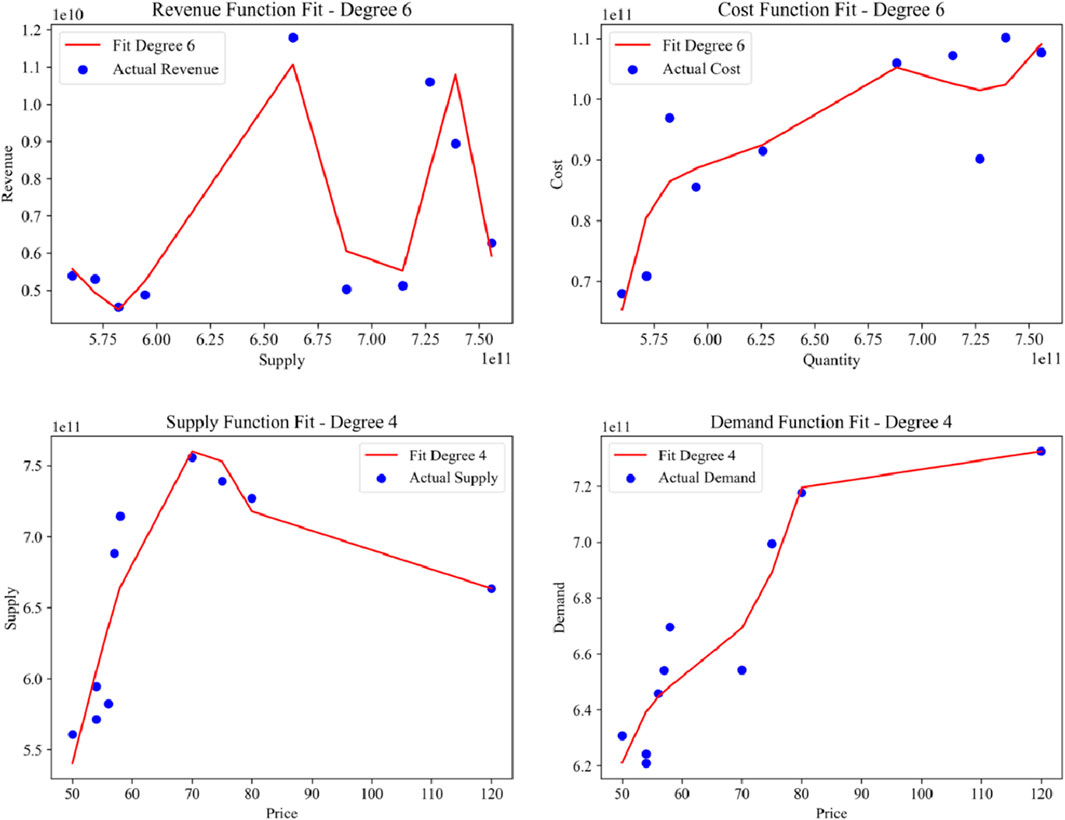
Figure 3. Eigenvalue function fitting.
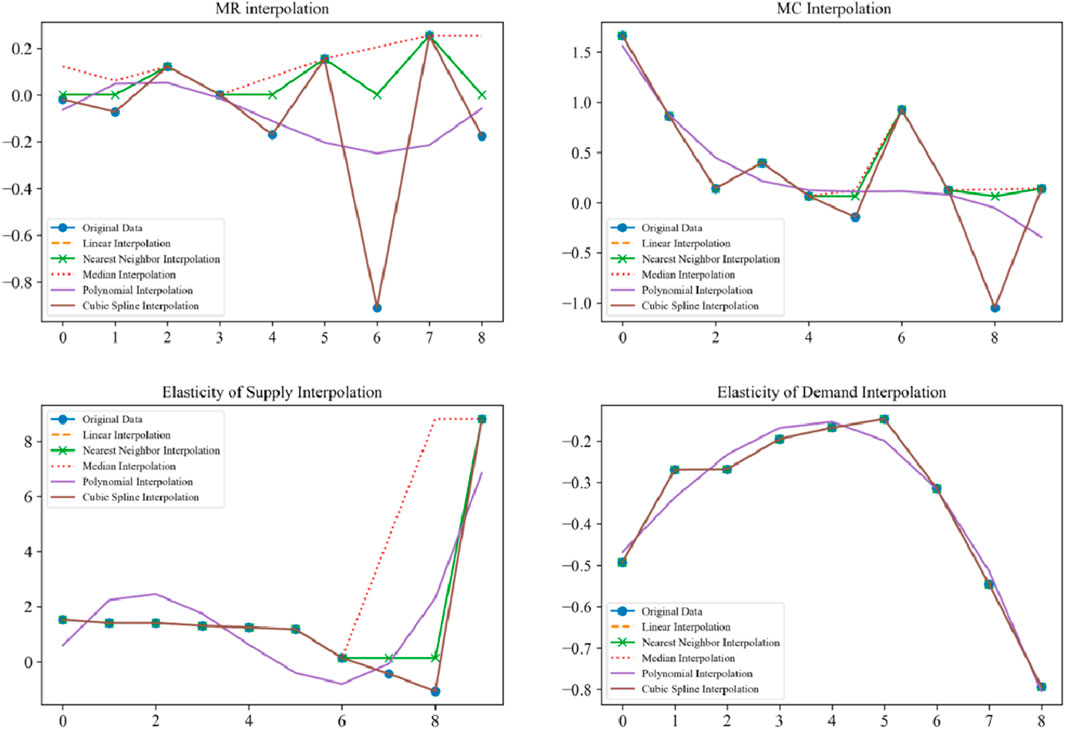
Figure 4. Machine learning feature data cleaning.
This study used the Anaconda 3 distribution of Python as the development environment for constructing the machine learning models. Throughout this process, we depended primarily on the widely utilized libraries scikit-learn and Pandas for the data mining and machine learning tasks, given their rich functionalities and tools. We employed the “describe ()” function in Pandas to perform an initial statistical analysis of the dataset. This function efficiently computes descriptive statistics, including the mean, standard deviation, minimum, maximum, and quantiles. The dataset was then split into a training set (80%) and a testing set (20%) using the ‘train_test_split()’ function. This approach ensured an accurate model evaluation while maintaining data integrity. During the model construction phase, we selected “RandomForestRegressor ()” from the scikit-learn library as our regression analysis tool. In the implementation, we configured several key parameters of the “RandomForestRegressor ()” model. We set “n_estimators = 100,” indicating that the model would consist of 100 decision trees. We also specified “random_state = 42” to ensure the reproducibility of the model training process. Additionally, we set “min_samples_split = 2” and “min_samples_leaf = 1” to manage the decision tree’s complexity and used the “max_features” parameter to optimize the feature selection. By invoking the “fit ()” method, the RF model learns and captures the underlying patterns in the training data. We subsequently utilized the “predict ()” function to make predictions on the testing set, thereby evaluating the model’s performance on unseen data (Figure 5).
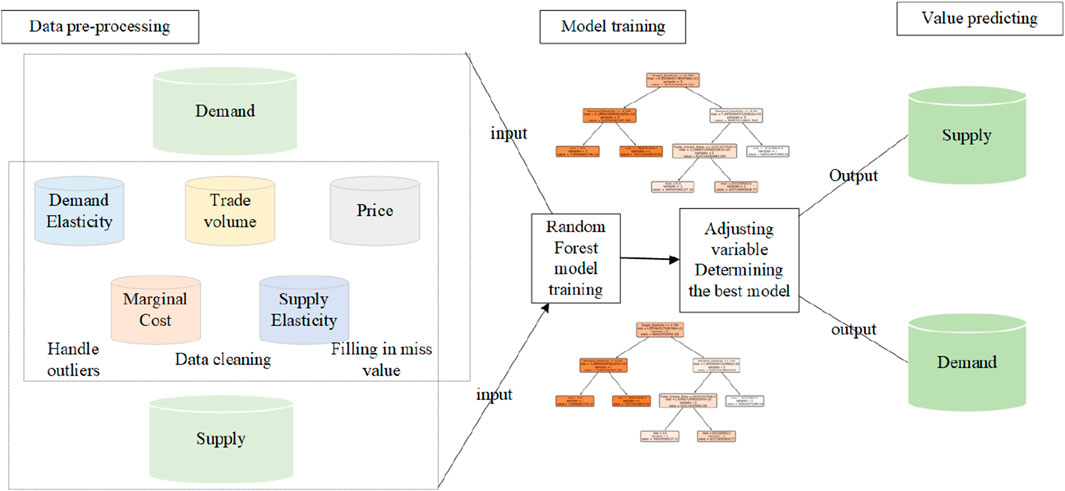
Figure 5. Machine learning validation technology.
A robustness test was carried out utilizing the technique of injecting noise in order to evaluate the resilience of the four distinct machine learning models. This involved generating repeated predictions by introducing noise to the model and then calculating the mean and standard deviation of the prediction results. This process helps evaluate the model’s ability to withstand variations in input. For the prediction models of net CO2 emissions (supply) in surplus provinces and net CO2 emissions (demand) in CO2 deficit provinces, a noise level of 0.1 was chosen. With a mean of 0 and a standard deviation of 0.1, this noise was distributed normally. The test was conducted with 100 iterations of 10-year data. The means and standard deviations of the prediction results were used as indicators for assessing robustness. The mean reflects the average prediction performance of the model after introducing noise, whereas the standard deviation indicates the degree of variation in the model’s prediction results. A smaller standard deviation typically suggests better robustness of the model to fluctuations caused by noise.
To investigate the impact of various feature variables on prediction outcomes through sensitivity analysis, the process begins with data preparation and model training. The code constructs or loads a dataset spanning 10 years, encompassing seven variables: demand elasticity, supply elasticity, price, marginal revenue, trade volume, demand quantity, and supply quantity. These data are organized into a DataFrame format. The feature variables X and target variables Y are separated. The first 9 years of data are used as the training set, while the 10th year’s data serve as the test set. The feature data are scaled using MinMaxScaler, and then a Random Forest Regression model is employed to train separately for demand quantity and supply quantity, resulting in the trained models.
Next, a sensitivity analysis function is defined. This function accepts the trained model, input feature data, base feature data, the index of the feature to be altered, the range of parameter values, and the number of iterations as parameters. Within the function, for each value in the parameter range, the feature value at the specified index in the base feature data is modified to generate new feature data. The trained model is then used to predict the new feature data multiple times (n_iterations times), and each prediction result is recorded. The average and standard deviation of these results are calculated, and the parameter value, average prediction, and standard deviation are saved as a set of results. Finally, the function returns the analysis results for all parameter values.
Subsequently, sensitivity analysis is conducted for demand quantity. The list of feature variable names is iterated over, and for each feature, a range of 10 uniformly distributed parameter values is generated based on the minimum and maximum values of the scaled training data. The sensitivity_analysis function is called, passing in the demand prediction model model_demand and related parameters, to obtain the sensitivity analysis results for the feature’s impact on demand prediction. The average prediction and standard deviation for each parameter value are printed, visually demonstrating the influence of feature changes on demand prediction.
Finally, sensitivity analysis is performed for supply quantity. This process is similar to that for demand quantity, except that the model is replaced with the supply prediction model model_supply. Each feature is iterated over, parameter value ranges are generated, the sensitivity analysis function is called, and the results are printed, thereby illustrating the impact of each feature on supply prediction.
The carbon emissions, carbon absorption, and net carbon emissions of nine provinces in various years were derived by adding matching data into the model. Table 4 displays the particular outcomes.
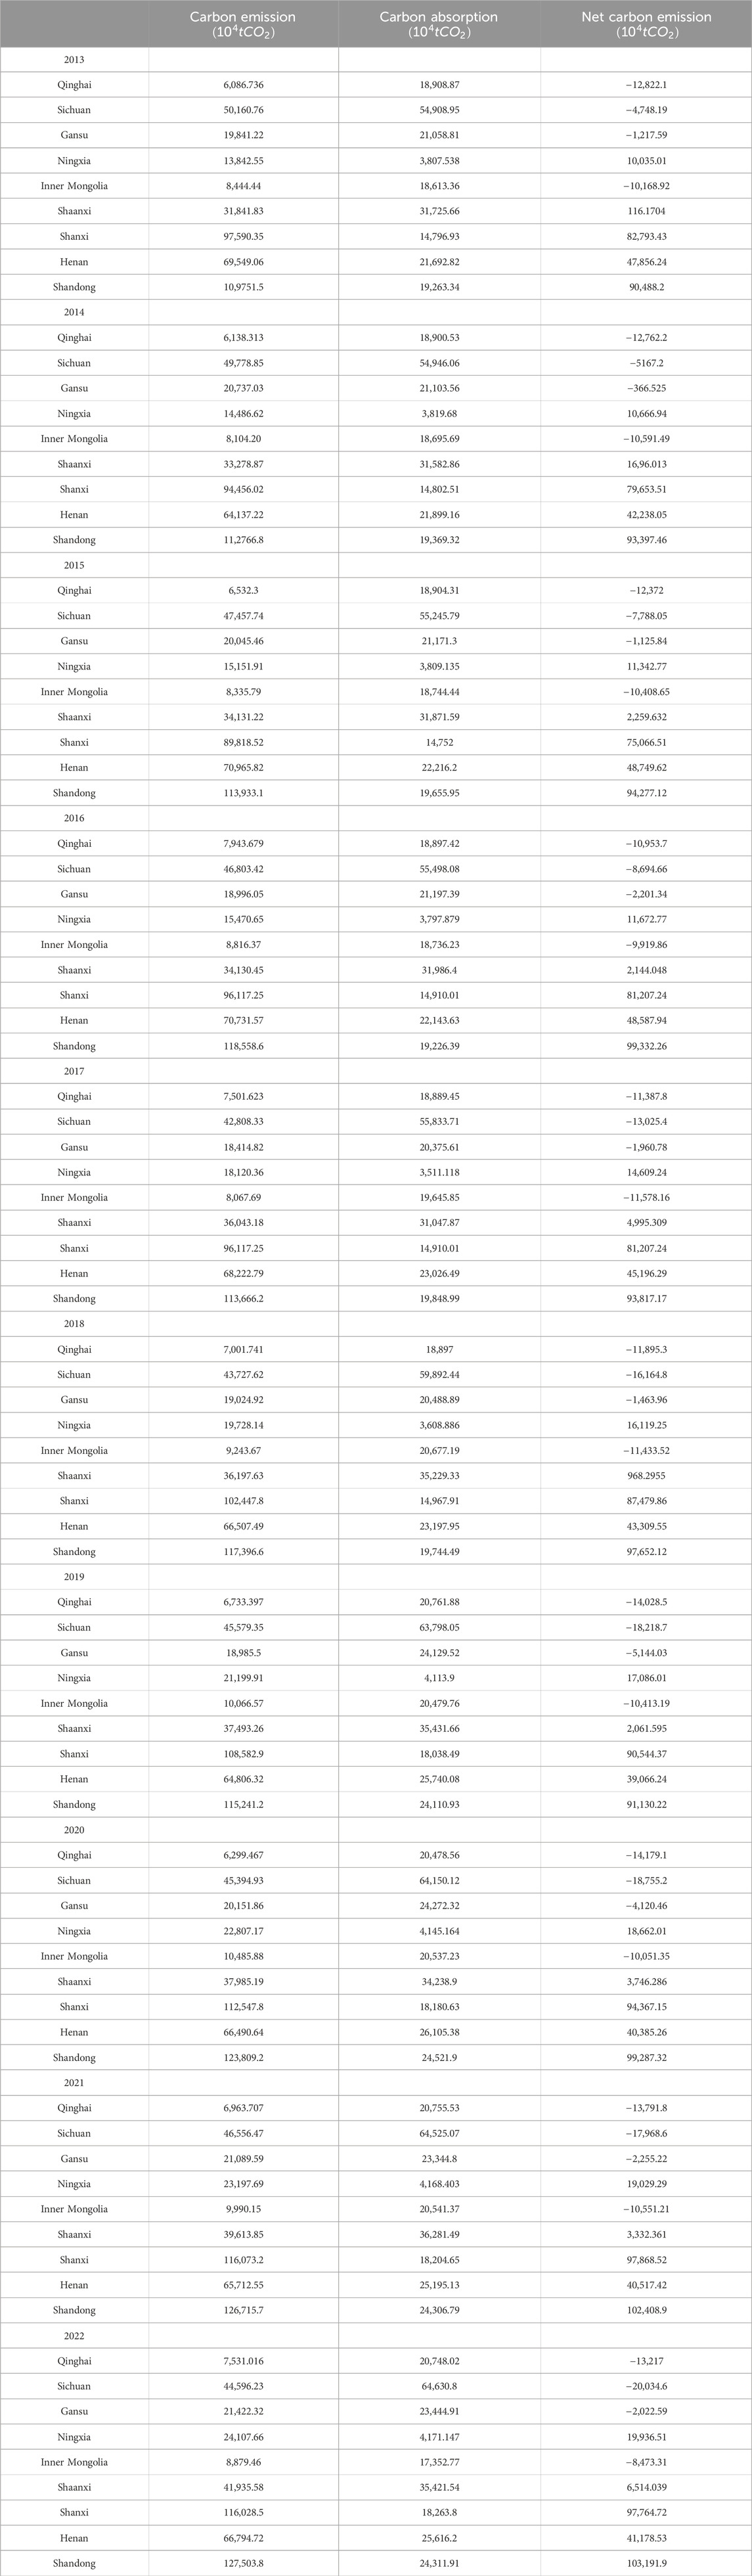
Table 4. Calculation results of net carbon emissions in the 9 provinces across the YRB from 2013 to 2022.
For provinces with a carbon surplus, “protection” is chosen as a strategy when the benefits of ecological protection outweigh the associated costs. However, in practice, the benefits often do not outweigh the costs incurred. To prevent carbon surplus and deficit provinces from falling into a “prisoner’s dilemma” scenario where neither protection nor compensation is chosen, the central government acts as an impartial third party. It implements reward and punishment policies to supervise and incentivize appropriate actions. The parameters of the central government’s reward and punishment mechanism depend on the costs and benefits of carbon surplus provinces engaging in ecological protection, as well as the compensation required by carbon deficit provinces. The costs and benefits involved in calculating compensation and the participation of carbon surplus provinces in ecological protection are detailed in Table 5. The scope of rewards and punishments for the supervision mechanism established by the central government is shown in Table 6.
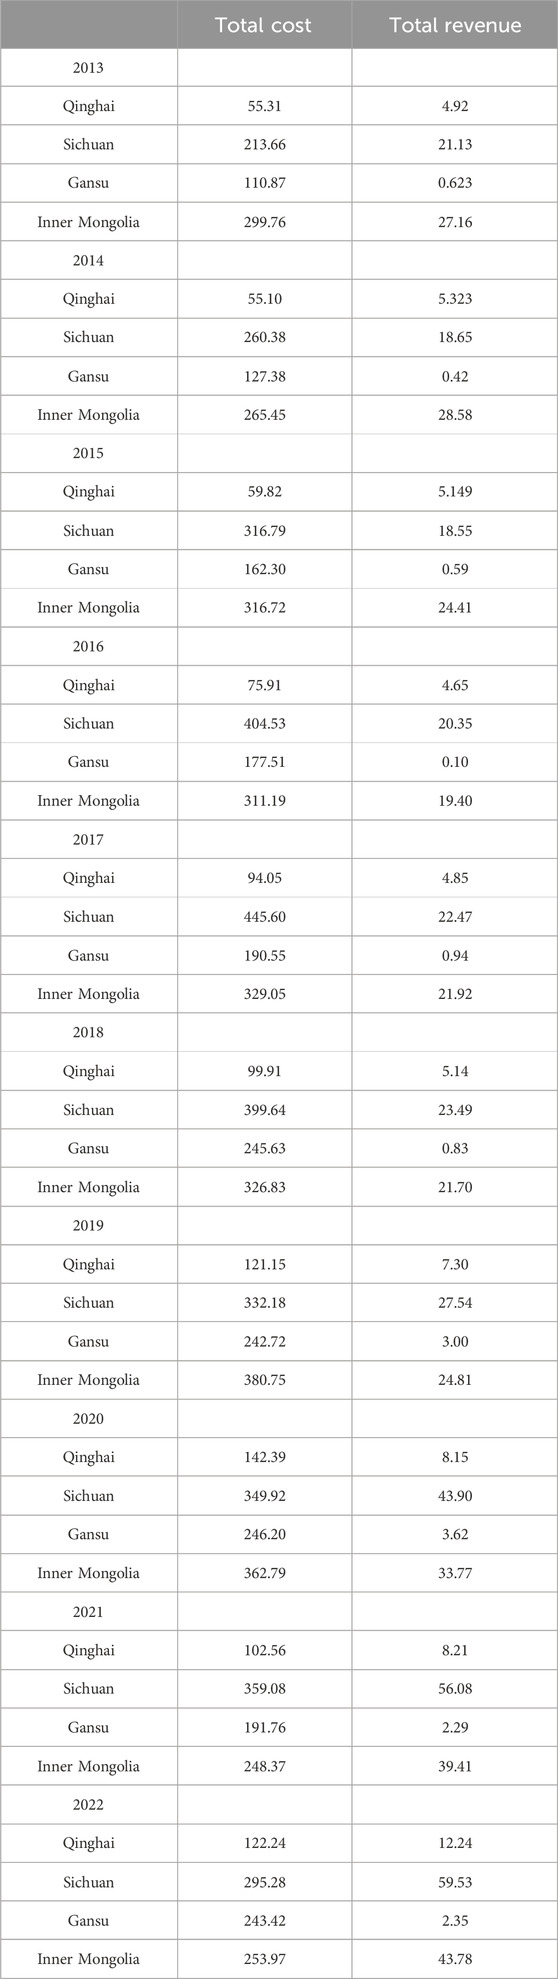
Table 5. 2013-2022 carbon surplus provinces ecological protection costs and revenue.
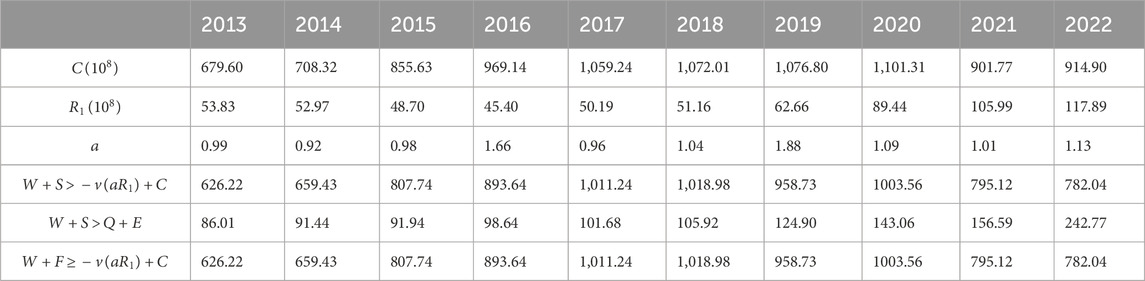
Table 6. The threshold of monitoring mechanism in the YRB from 2013 to 2022.
The output results of the supply forecasting model and the demand forecasting model are shown in Table 7 (Figure 6).

Table 7. Comparison of machine learning predictions.
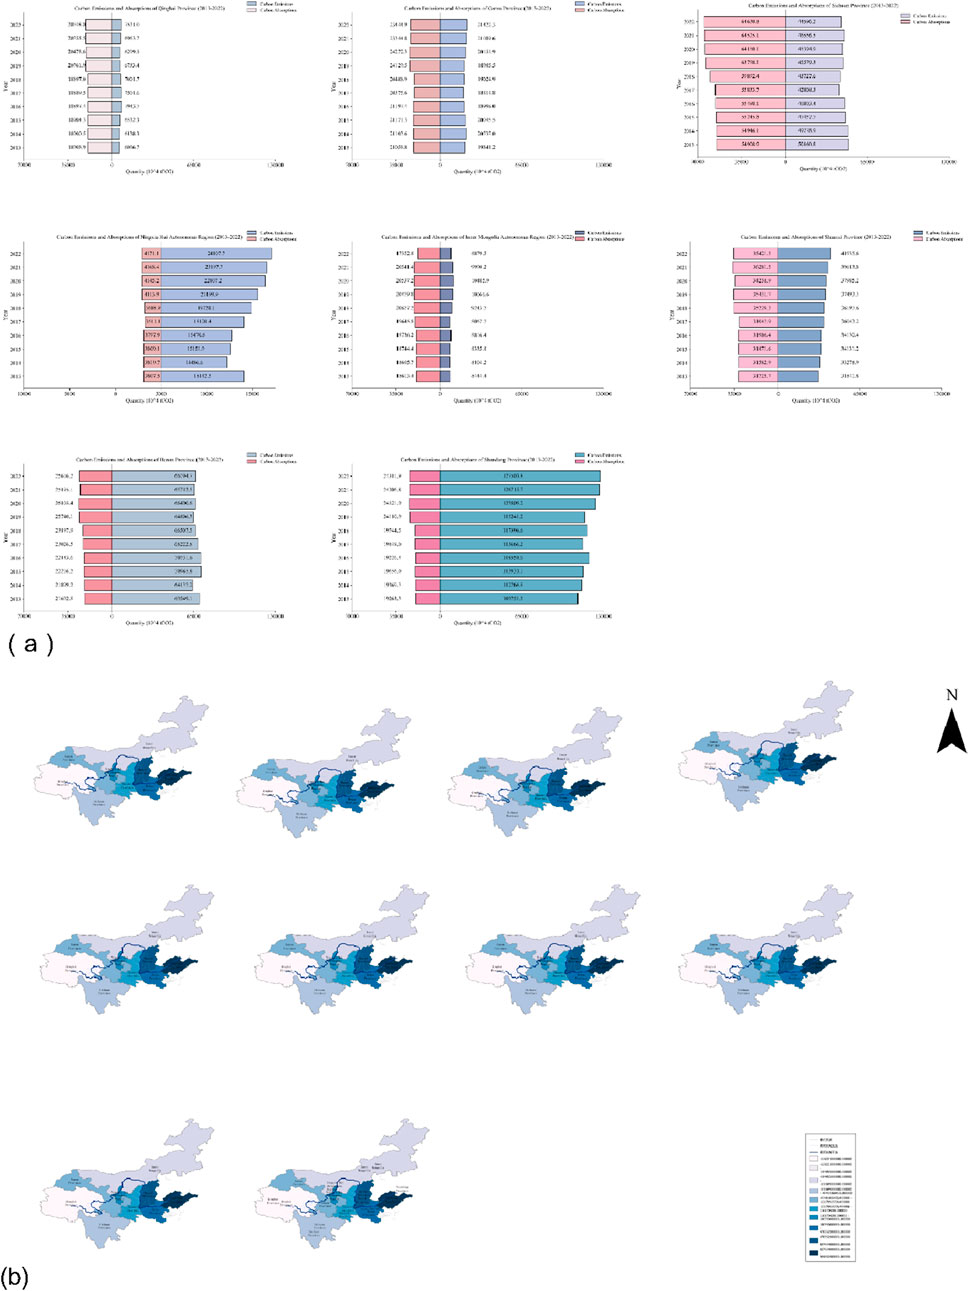
Figure 6. Calculation results of net carbon emissions in the 9 provinces across the YRB from 2013 to 2022.
Table 8 displays the output data from both the supply and demand forecasting models.
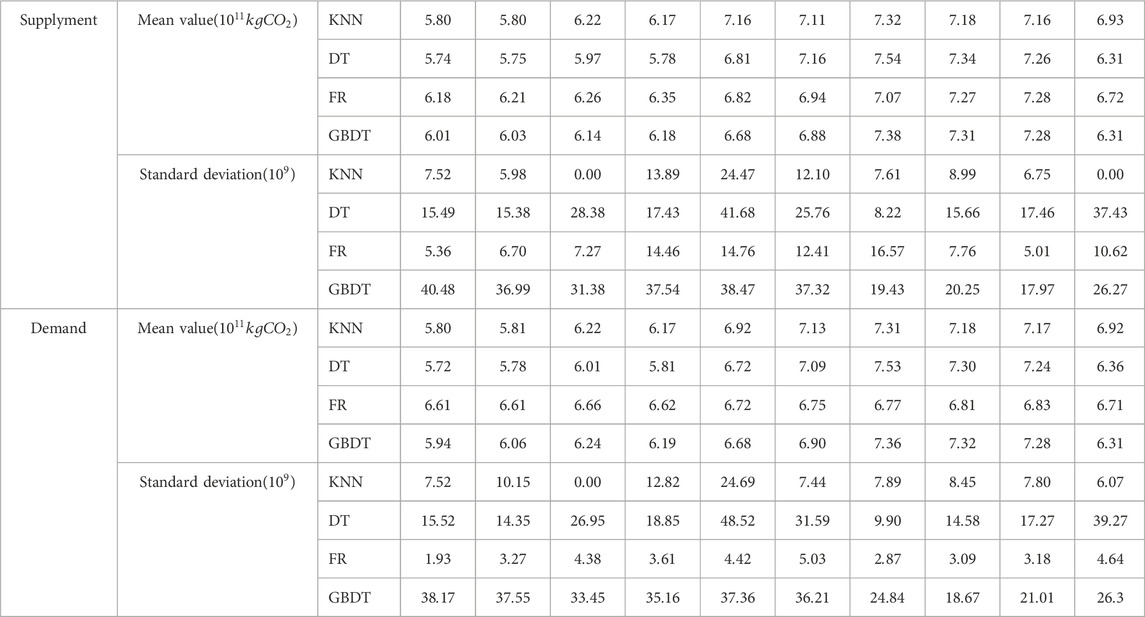
Table 8. The output results of the mean and standard deviation of the demand forecasting model and the supply forecasting model after adding noise.
The results indicate that the RF model consistently delivers stable and reliable forecasts across multiple datasets. In supply forecasting, the average predictions range from 6.18 to 7.28, predominantly clustering at approximately 6.6–6.7, demonstrating minimal fluctuations. For demand forecasts, the RF model also yields stable average predictions ranging from 6.61 to 6.83. This finding indicates robust predictive performance with noise incorporation. With respect to variability, the RF model typically exhibits standard deviations ranging between 5 and 16 for supply forecasts, which is notably lower than those of the other models, such as KNN and GBDT. For demand forecasting, the RF model consistently shows lower standard deviations across all datasets, especially compared with the DT and GBDT models, which tend to exhibit greater volatility. In contrast, the KNN model occasionally had zero standard deviations in some of the datasets, suggesting potential issues with overfitting or inadequate performance. The DT model displays significant standard deviation fluctuations, particularly in supply forecasting, where instability is evident in more than 40 cases. The GBDT model occasionally achieves superior average predictions but tends to exhibit higher standard deviations, indicating increased variability. Considering both the average predictive stability and standard deviation, the RF model consistently outperforms the other models when subjected to noise, demonstrating strong predictive capability and stability across various noise levels.
The sensitivity analysis was conducted on six key features—demand elasticity, supply elasticity, carbon price, trade volume, and demand quantity—to evaluate their impact on supply quantity. The results are visualized in Figure 7 that illustrates the average predicted supply quantity and the standard deviation of predictions corresponding to different scaled values of demand elasticity. For supply elasticity, as the scaled value increases from 0.0000 to 0.3333, the average predicted supply quantity remains constant at
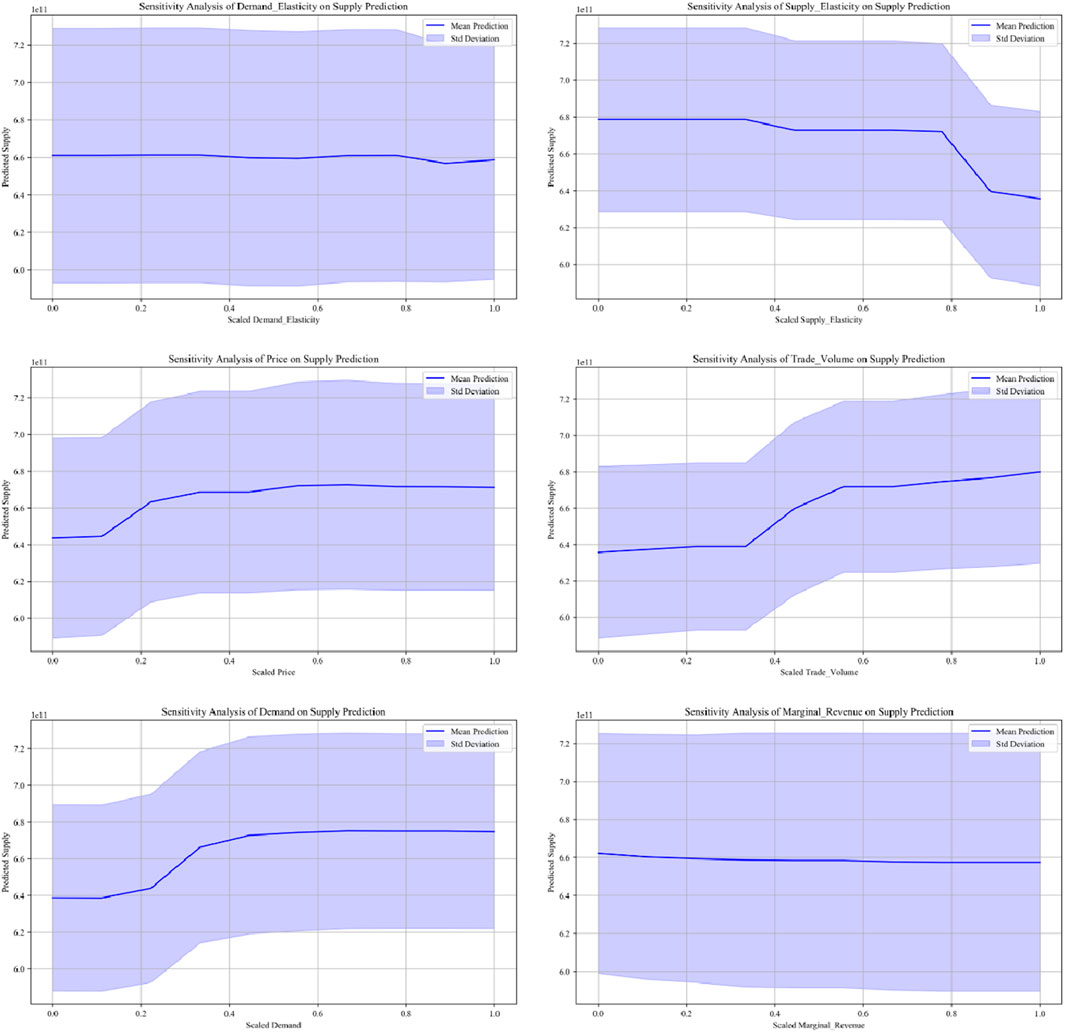
Figure 7. The average predicted value of supply quantity corresponding to the elasticity value and the standard deviation of the predicted value.
Regarding carbon price, as the scaled price increases from 0.0000, the average predicted supply quantity initially rises and then stabilizes with slight fluctuations. From 0.0000 to 0.3333, the average predicted value increases from
The sensitivity analysis for marginal revenue shows the average predicted supply quantity and its standard deviation corresponding to different scaled marginal revenue values. As the scaled marginal revenue increases from 0.0000, the average predicted supply quantity generally declines, starting from
For trade volume, as the scaled value increases from 0, the average predicted demand quantity shows an overall upward trend. Similarly, for demand quantity, as the scaled value increases from 0.0000, the average predicted supply quantity initially rises and then stabilizes. At lower scaled demand values (0.0000–0.3333), the average predicted value increases rapidly from
Another sensitivity analysis was conducted on the six characteristic values. The results of the sensitivity analysis of demand elasticity, supply elasticity, carbon price, trading volume, and supply quantity with respect to demand quantity are as follows. The Figure 8 shows the average predicted value of the supply quantity and the standard deviation of the predicted value corresponding to different scaled demand elasticity values.
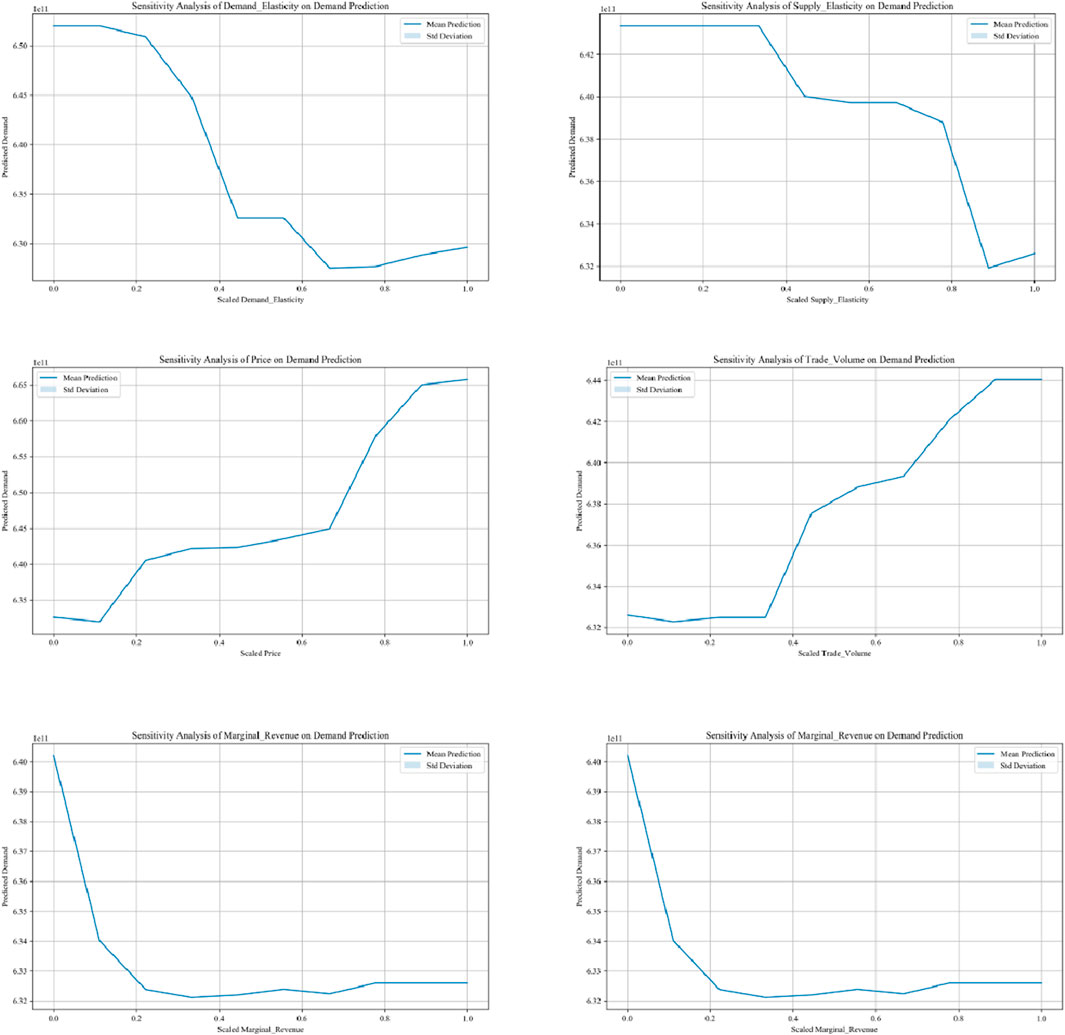
Figure 8. The average predicted value of demand quantity corresponding to the elasticity value and the standard deviation of the predicted value.
For the sensitivity analysis of demand elasticity, when the scaling value of demand elasticity starts to increase from 0, the average predicted demand quantity generally shows a trend of first decreasing and then increasing. When the scaling value ranges from 0 to approximately 0.4444, the average predicted demand quantity gradually decreases, from 6.5201197 × 10¹¹ to 6.3259989 × 10¹¹. In this range, the increase in demand elasticity makes the market demand more sensitive to factors such as price. Carbon - deficit provinces may significantly adjust their purchase volume due to small price changes, resulting in a decrease in the predicted value of the overall demand quantity. When the scaling value of demand elasticity exceeds 0.4444, the average predicted demand quantity begins to rise again, indicating that at a higher level of demand elasticity, some special situations occur in the market, so that even though demand is sensitive to price, the overall demand quantity still increases. Demand elasticity reflects the sensitivity of the demand quantity to changes in factors such as price. In the stage of low demand elasticity, carbon - deficit provinces are not very sensitive to price changes, and the government can increase the income of carbon - surplus provinces by appropriately adjusting the price. In the stage of high demand elasticity, small price changes may lead to large fluctuations in the demand quantity, so the government needs to be more cautious in formulating price strategies.
When the scaling value of supply elasticity is between 0 and 0.3333, the average predicted demand quantity remains unchanged. Starting from 0.4444, the average predicted demand quantity generally shows a downward trend, gradually decreasing from 6.4002166 × 10¹¹ to 6.3259989 × 10¹¹. This indicates that when the supply elasticity exceeds a certain threshold, the supply becomes more sensitive to factors such as price, which may lead to instability in the commodity supply in the market, thus affecting the demand expectations of carbon - deficit provinces and causing the predicted demand quantity to decline.
As the price scaling value gradually increases from 0, the average predicted demand quantity generally shows an upward trend. When the price scaling value is relatively low (around 0–0.2222), the change in the average predicted demand quantity is relatively gentle. When the price scaling value exceeds 0.2222, the increase in the average predicted demand quantity becomes more significant, reaching 6.6575625 × 10¹¹ when the price scaling value is 0.9999. It is possible that carbon - deficit provinces regard the price increase as a signal of increased commodity scarcity, thus increasing their willingness to purchase.
When the marginal revenue scaling value increases from 0, the average predicted demand quantity generally shows a downward trend. When the marginal revenue scaling value is 0, the average predicted demand quantity is relatively high in some cases. As the marginal revenue scaling value increases to 0.1111, the average predicted demand quantity drops to 6.3401310 × 10¹¹, and then continues to decline and remains basically stable in the range of 0.3333–1.0. The extra money made by each extra unit of output is represented by the marginal revenue. When there is little marginal income, carbon - surplus provinces may adopt a low - price strategy to expand sales volume, thus stimulating market demand and making the predicted demand quantity relatively high. As the marginal revenue increases, carbon - surplus provinces may raise prices to obtain higher profits, which will suppress the purchasing willingness of carbon - deficit provinces and lead to a decrease in the demand quantity. When the marginal revenue reaches a certain level, the price and output strategies are relatively stable, so the predicted value of the demand quantity also tends to be stable.
Carbon emissions in the Yellow River Basin gradually increased from 2013 to 2022 (Figure 9), which is consistent with the findings of Zhao (Zhao et al., 2022). Concurrently, the increase in carbon absorption has helped mitigate net carbon emissions. Factors such as economic and industrial development, the energy structure, policy interventions, technological advancements and natural conditions have collectively influenced the overall carbon emissions and absorption dynamics in the YRB. In the upstream areas, carbon absorption significantly outweighs emissions, resulting in negative net carbon emissions. However, the middle reaches experienced notable increases in carbon emissions, leading to a continued increase in net carbon emissions. Conversely, the downstream region achieved substantial reductions in carbon emissions through industrial adjustments and technological advancements, which is consistent with previous research by Meng (Meng et al., 2023).
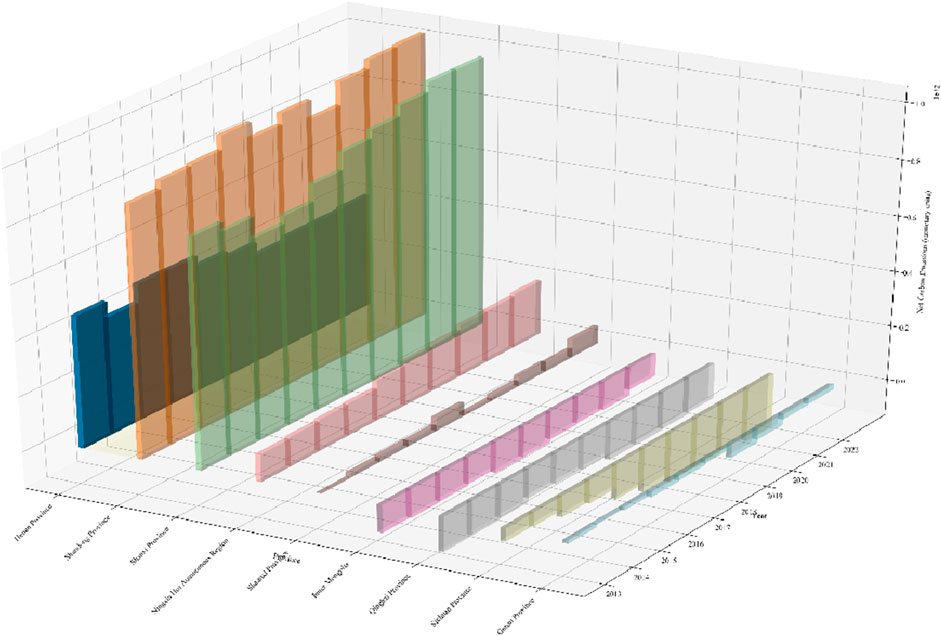
Figure 9. Net carbon emissions of provinces in the YRB (2013–2022).
According to recent research, effective oversight by the central government is essential for establishing ecological compensation systems in river basins (Wang Q. et al., 2022). However, the absence of sufficient checks and incentives from local governments poses a significant challenge to developing such mechanisms across various river basins in China (Jing and Zhang, 2021). As discussed in Section 3.2, the current conditions do not support the evolution of society’s desired optimal strategy into a stable approach within the game system, highlighting the critical need for implementing a reward and punishment mechanism. Further exploration in Section 3.2 revealed that the parameter range for introducing this mechanism by the central government hinges on the costs and benefits associated with carbon surplus provinces engaging in carbon ecological protection, as well as the compensation provided to carbon deficit provinces.
Currently, the research on ecological compensation predominantly focuses on theoretical policies, compensation methods, and the necessity of compensation (Jing et al., 2021). Specific discussions on the operational mechanisms of ecological compensation are limited. Building upon previous research, this study explores the development of a horizontal carbon ecological compensation mechanism in the YRB.
The horizontal carbon ecological compensation mechanism in the YRB promotes carbon emission reduction through market-based approaches, primarily voluntary trading. At its core, the scheme facilitates the emission rights of CO2 trading, enabling carbon-deficit provinces to collaborate with carbon-surplus provinces. This partnership involves investing in emission reduction projects funded by compensation mechanisms aimed at achieving a balance in carbon emissions. The YRB Carbon Reduction Promotion Center, established by the Ministry of Ecology and Environment, oversees the establishment of registration and trading institutions and related systems to ensure the standardization and transparency of trading (Figure 10). The national carbon emission trading market operates under established laws and regulations, compensation scope, trading management system, monitoring, reporting, and verification (MRV) system, and regulatory mechanism. Implementation of the MRV system guarantees the authenticity of the emissions data and the trading accuracy, whereas regulatory mechanisms include supervision, management, and legal responsibilities to uphold market integrity and health. The total amount of carbon emission trading in the YRB is determined on the basis of the net carbon emissions of the provinces with a carbon surplus and is managed through the national carbon emission trading system, which supports various trading methods. The participants include the suppliers, demanders, regulators, technical support system operators and trading platform operators. The carbon surplus provinces serve as the suppliers, whereas the carbon deficit provinces act as the demanders. The central government functions as the regulatory body, ensuring fairness in the privatization process of public property rights. Technical support systems and trading platforms record transactions and provide settlement services. The carbon trading process involves identifying supply and demand parties, forming a “carbon ledger,” and trading emission reduction credits on the basis of projects, products, or public low-carbon behaviour. Project development must adhere to the nationally standardized voluntary greenhouse gas emission reduction methodology and undergo rigorous procedures, including filing, evaluation, monitoring, verification and certification. Low-carbon products are required to undergo carbon footprint calculations and public disclosure, whereas public low-carbon behaviour is quantified through an app and recorded in a personal “carbon ledger.” Third-party certification verifies emission reductions to ensure methodological applicability and calculation accuracy. The main functions of the trading platform include account opening review, consultation, market promotion, and other services to supervise trading behaviour and prevent risks. The central government has established a reward and punishment mechanism to promote the adoption of optimal strategies, along with a regulatory information sharing and law enforcement cooperation mechanism with relevant departments. The settlement bank provides services such as fund settlements, financial products, carbon trading settlements, financial advice and support within the system to ensure smooth and secure fund flow. It also offers financial solutions for projects and assists in planning capital operations and management strategies. Through these measures, the horizontal carbon ecological compensation mechanism in the YRB aims to effectively control carbon emissions, promote rational resource allocation, and achieve sustainable development of the ecological environment.
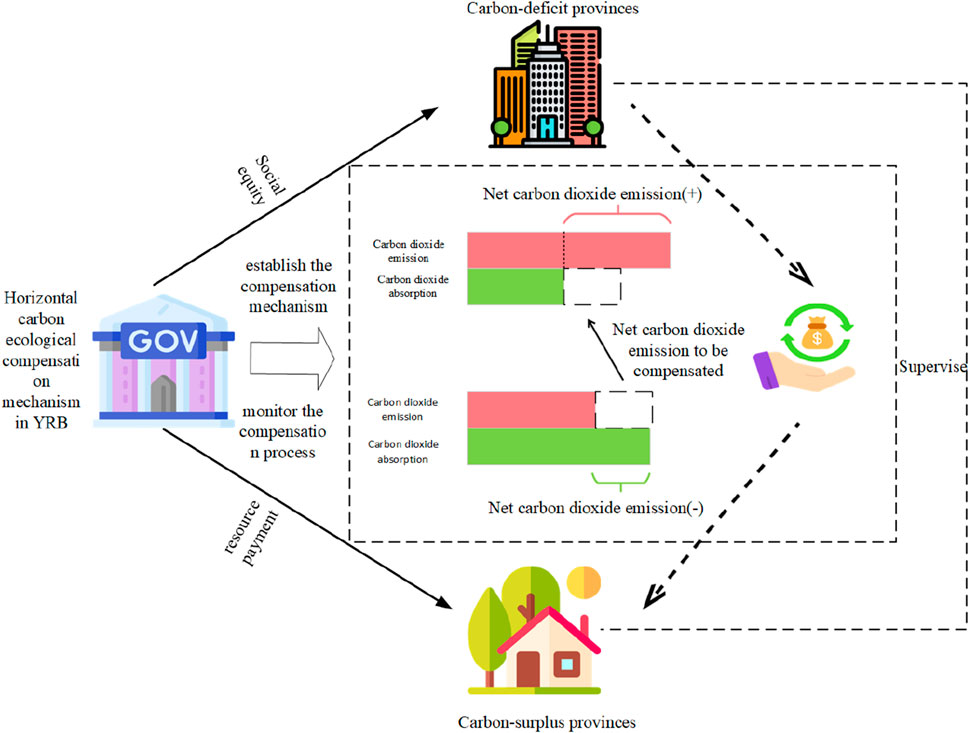
Figure 10. Conceptual framework for constructing the horizontal carbon ecological compensation mechanism in the YRB.
This study mainly focuses on the carbon ecological compensation mechanism Different carbon sink generation pathways have varying effects on other ecosystem functions such as water quality and biodiversity.
Forests are important carbon sinks, and their carbon storage can be increased through afforestation and forest management. However, although monoculture plantations can rapidly increase carbon sinks, they may reduce biodiversity as they suppress the growth of understory vegetation, thus reducing food sources and habitats for insects and birds. In contrast, broad - leaved mixed forests can provide complex habitat structures, promoting the development of biodiversity. In terms of water quality, healthy forests can reduce soil erosion, purify rainwater, and lower the pollutant content in water bodies. Nevertheless, large - scale deforestation or unreasonable afforestation can damage the soil structure, exacerbate soil erosion, and affect water quality.
Wetlands are also significant carbon sinks, with their unique environments capable of storing large amounts of organic carbon. Wetlands serve as habitats for numerous rare animals and plants. Protecting and restoring wetlands can increase biodiversity. For example, coastal wetlands are crucial for the survival and migration of migratory birds. Moreover, wetlands have a powerful water purification function. Wetland plants can absorb and transform nutrients in water bodies, and the soil and microorganisms can decompose and remove pollutants. Constructed wetlands are widely used in sewage treatment.
In farmland, reasonable management measures such as no - tillage, straw returning, and the application of organic fertilizers can increase soil carbon storage. Increasing farmland carbon sinks can improve soil structure, enhance fertility, and water and fertilizer retention capacity. Straw returning can increase soil organic matter, improve aeration and water permeability. Reasonable management can also provide a suitable environment for farmland organisms, increasing biodiversity. For instance, reserving natural habitats around farmland can provide food and habitats for insects, birds, and small mammals.
The ocean is the largest carbon reservoir on Earth, and its carbon sinks are mainly achieved through the photosynthesis of phytoplankton and the calcification of marine organisms. The increase in ocean carbon sinks helps to regulate the global climate and slow down the rise of atmospheric carbon dioxide concentration. Marine biodiversity is closely related to the carbon sink process. Phytoplankton are the basis of the marine food chain. Protecting the marine environment and promoting the increase of carbon sinks are beneficial for maintaining biodiversity. However, overfishing and pollution can disrupt the ecological balance, affecting carbon sink functions and biodiversity.
Grasslands can increase carbon sinks through reasonable grazing management, protection, and restoration. The roots of grassland vegetation can fix the soil and prevent erosion. Reasonable grazing can promote vegetation growth and enhance the soil’s anti - erosion ability. Grasslands provide habitats for many animals and plants, and reasonable management helps to maintain biodiversity. Overgrazing can lead to grassland degradation and a decline in biodiversity.
Although desert ecosystems have sparse vegetation, they also have certain carbon sink functions, which are realized through the photosynthesis of desert plants and soil carbon fixation. The growth of desert plants can improve soil quality, fix sand, and reduce wind - sand erosion. They also provide habitats for unique biological communities. However, human activities such as over - reclamation and over - exploitation of water resources can damage desert ecosystems, affecting carbon sink functions and biodiversity.
In conclusion, when implementing the carbon ecological compensation mechanism, the impacts of different carbon sink pathways on other ecosystem functions should be fully considered. Comprehensive management measures should be taken to achieve a win - win situation of increasing carbon sinks and protecting other ecosystem services, promoting the sustainable development of ecosystems and the improvement of human wellbeing.
According to the stochastic forest model, the net
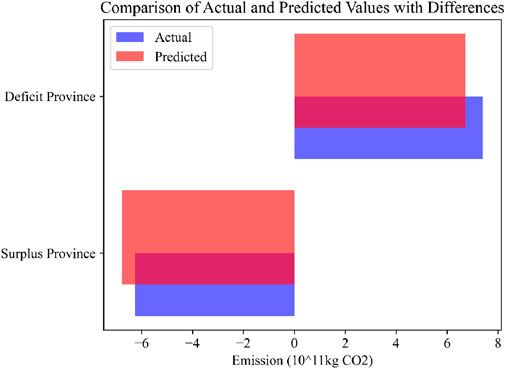
Figure 11. Comparison between the predicted net carbon emissions and the actual situation under the background of voluntary trading of carbon emission rights.
First, the practicality of the evolutionary game model constructed in this study could be affected by the interaction of different variables. The analysis conducted here examines the influence of individual variables such as the carbon ecological environmental governance costs, governance benefits, central government compensation and penalties, and oversight costs in the carbon deficit provinces. It does not account for potential cross-effects among these variables. Future research could build a more complex model to analyse the different scenarios comprehensively.
Additionally, this study used a random forest model to forecast the decrease in CO2 emissions in each YRB province once the carbon ecological compensation mechanism was implemented through a voluntary trading system without a control group. This demonstrates how well the YRB’s horizontal carbon ecological compensation system works. In order to increase prediction accuracy and model resilience, future studies should look at ensemble approaches by combining machine learning techniques like random forests, support vector machines, and neural networks
In summary, this study establishes a solid foundation for future research endeavours. Future studies could develop more intricate models, encompass a broader array of variables, and establish a stronger bridge between theoretical constructs and practical applications.
In this study, the net carbon emissions of 9 provinces in the YRB from 2013 to 2022 were calculated, and the provinces with a carbon surplus and carbon deficit were divided according to the calculations. Carbon emission rights were regarded as a scarce resource, the carbon surplus provinces and carbon deficit provinces were regarded as the game players, and the relevant parameters were set in combination with prospect theory to build an evolutionary game model. Through the analysis of the dynamic evolutionary game model of introducing the incentive and punishment mechanism, the threshold value of the central government for implementing the incentive and punishment mechanism was determined, and the influencing factors of the horizontal carbon ecological compensation mechanism in the YRB were obtained. This paper further explained the operation of the horizontal carbon ecological compensation mechanism in the YRB and proposed encouraging the realization of the horizontal carbon ecological compensation mechanism via voluntary trading. In addition, machine learning was used to predict the net carbon emissions against the background of voluntary trading of carbon emission rights to verify the effectiveness of the horizontal carbon ecological compensation mechanism in the YRB and emphasized the necessity of establishing a horizontal carbon ecological compensation mechanism in the YRB.
This study used a machine learning model for predictive analysis to assess the effectiveness of the horizontal ecological compensation mechanism in the YRB. The horizontal CO2 ecological compensation mechanism in the YRB seems to affect CO2 deficit provinces more than carbon surplus provinces, when both absolute and relative values are taken into account. This observation suggests that the mechanism has a stronger promoting effect on reducing CO2 emissions in deficit provinces. The enhanced promotion effect in carbon deficit provinces can be attributed to several factors. First, these provinces face greater economic pressure, as they need to pay more compensation to balance their CO2 emissions and sinks. This economic burden motivates them to adopt more aggressive measures to reduce CO2 emissions, such as investing in renewable energy technology, improving energy efficiency, and adopting CO2 capture and storage technology. Second, to reduce CO2 deficits effectively, CO2 deficit provinces may implement stricter environmental protection policies. These policies strive for long-term economic and social change toward green and low-carbon development in addition to short-term objectives. Additionally, carbon deficit provinces often rely more on fossil fuels, indicating greater potential and demand for adjusting their energy structure and developing clean energy. The endogenous motivation stimulated by the compensation mechanism may accelerate the transition from traditional to clean energy. On the other hand, although carbon surplus provinces perform relatively well in terms of CO2 emissions, the difference between the predicted and actual net CO2 emissions was small, with a limited increase in the actual and predicted values. These provinces have been effective in maintaining their current CO2 sink levels but still need to increase their emission reduction potential. While helping carbon deficit provinces reduce their CO2 emissions, the YRB’s horizontal carbon ecological compensation mechanism encourages carbon surplus provinces to increase their efforts to reduce CO2 emissions. This approach enhances environmental quality, encourages the development of clean technologies, and helps reduce regional CO2 emissions
Guarantee measures for the horizontal carbon ecological compensation mechanism in the YRB should be further explored to strengthen the implementation effect of the mechanism and ensure its long-term sustainability, robustness, and adaptability.
(1) Under the guidance of higher-level regulations such as the Yellow River Protection Law of the People’s Republic of China and the Regulations Governing Ecological Protection Compensation, legislation should be enacted for the horizontal carbon ecological compensation mechanism in the YRB. This legislation should include the establishment of trading rules for the voluntary CO2 emission trading mechanism, as well as the delineation of the rights and obligations of the participants within this mechanism. To reach the objective of carbon neutrality, institutional assurances and legal support can be given by creating a trading system that promotes the preservation of the natural environment and the reduction of CO2 emissions. This institutional framework encourages the reduction of CO2 emissions and the restoration of carbon ecosystems by allowing all parties to actively participate in CO2 emission trading in accordance with the rules. This strategy promotes the socioeconomic and ecological environments’ sustainable growth.
(2) Based on prediction models and real observation data, machine learning models may be applied to improve the YRB’s horizontal carbon ecological compensation mechanism’s data-driven decision-making skills. This includes evaluating policy effectiveness, conducting simulations for different policy scenarios, and providing a decision-making basis. The machine learning analysis results can be applied to adjust policies in real time, ensuring flexibility and adaptation to environmental changes and new data. Long-term environmental protection and emission reduction targets can be developed and machine learning model predictions should be incorporated into planning. Regular environmental impact assessments should be conducted to evaluate the actual impact of the compensation mechanism on environmental quality and to respond effectively to market and environmental changes.
(3) Blockchain technology should be utilized to establish a market monitoring system, ensuring data accuracy and transparency. Transaction traceability and tamper-proof nature should be improved, ensuring compliance with transaction rules and environmental protection standards. Illegal behaviours such as market manipulation, fraud, and insider trading should be detected and addressed promptly. Long-term stable funding sources should be secured to support the continuous operation of the compensation mechanism. The supervision of the CO2 trading market should be strengthened to promote its healthy development and ensure the achievement of emission reduction goals and environmental protection.
(4) The innovation and knowledge transfer of CO2 reduction technologies between provinces with a carbon surplus and deficit should be encouraged and supported. This initiative will promote the dissemination and application of CO2 reduction technologies across provinces, aiding in the reduction of carbon emissions and fostering balanced CO2 trading. Technological innovation and knowledge transfer will enable deficit provinces to effectively reduce CO2 emissions, reducing the costs of CO2 trading and promoting the sustainable development of the voluntary CO2 trading market.
The original contributions presented in the study are included in the article/supplementary material, further inquiries can be directed to the corresponding author.
HL: Conceptualization, Funding acquisition, Methodology, project administration, Supervision, Writing-review and editing. XZ: Data curation, Formal analsis, Investigation, Software, Validation, Writing-original draft.
The author(s) declare that financial support was received for the research, authorship, and/or publication of this article. This work was supported by the Soft Science Project of Gansu Provincial Science and Technology Plan under Grant 24JRZ088, “Research on Net Carbon Emission Accounting and Horizontal Carbon Ecological Compensation in Counties of Gansu Province”.
The authors declare that the research was conducted in the absence of any commercial or financial relationships that could be construed as a potential conflict of interest.
The author(s) declare that no Generative AI was used in the creation of this manuscript.
All claims expressed in this article are solely those of the authors and do not necessarily represent those of their affiliated organizations, or those of the publisher, the editors and the reviewers. Any product that may be evaluated in this article, or claim that may be made by its manufacturer, is not guaranteed or endorsed by the publisher.
The Supplementary Material for this article can be found online at: https://www.frontiersin.org/articles/10.3389/fenvs.2025.1511882/full#supplementary-material
Abrell, J., Kosch, M., and Rausch, S. (2019). “How effective was the UK carbon tax? a machine learning approach to policy evaluation,” in A machine learning approach to policy evaluation (April 15, 2019). CER-ETH–Center of Economic Research at ETH Zurich Working Paper 19:317.
Aryal, K., Maraseni, T., Rana, E., Prasad Subedi, B., Krishna Laudari, H., Ghimire, P. L., et al. (2024). Carbon emission reduction initiatives: lessons from the REDD+ process of the Asia and Pacific region. Land Use Policy 146, 107321. doi:10.1016/j.landusepol.2024.107321
Bai, J., and Ru, H. (2024). Carbon emissions trading and environmental protection: international evidence. Manag. Sci. 70 (7), 4593–4603. doi:10.1287/mnsc.2023.03143
Bajari, P., Nekipelov, D., Ryan, S. P., and Yang, M. (2015). Machine learning methods for demand estimation. Am. Econ. Rev. 105 (5), 481–485. doi:10.1257/aer.p20151021
Carmona, P., Climent, F., and Momparler, A. (2019). Predicting failure in the U.S. banking sector: an extreme gradient boosting approach. Int. Rev. Econ. and Finance 61, 304–323. doi:10.1016/j.iref.2018.03.008
Chan, J.C.-W., and Paelinckx, D. (2008). Evaluation of Random Forest and Adaboost tree-based ensemble classification and spectral band selection for ecotope mapping using airborne hyperspectral imagery. Remote Sens. Environ. 112 (6), 2999–3011. doi:10.1016/j.rse.2008.02.011
Chen, W., Yu, X. H., and Xiong, X. (2018). Evaluation of ecological compensation efficiency in a government-led watershed: a case study of major coastal cities in the Yangtze River Economic Belt. Jianghuai Forum. doi:10.1016/j.ecolind.2022.109535
Chi, C., Shen, J., Gao, X., Hu, P., and Yi, P. (2024). Horizontal ecological compensation standards based on ecosystem services flow. Ecol. Indic. 163, 112081. doi:10.1016/j.ecolind.2024.112081
Chu, H., Huang, Z., Zhang, Z., Yan, X., Qiu, B., and Xu, N. (2024). Integration of carbon emission reduction policies and technologies: research progress on carbon capture, utilization and storage technologies. Sep. Purif. Technol. 343, 127153. doi:10.1016/j.seppur.2024.127153
Cicala, S. (2022). Imperfect markets versus imperfect regulation in US electricity generation. Am. Econ. Rev. 112 (2), 409–441. doi:10.1257/aer.20172034
Deng, W., Zhang, Z., and Guo, B. (2024). Firm-level carbon risk awareness and Green transformation: a research on the motivation and consequences from government regulation and regional development perspective. Int. Rev. Financial Analysis 91, 103026. doi:10.1016/j.irfa.2023.103026
Di, K., Chen, W., Shi, Q., Cai, Q., and Zhang, B. (2024). Digital empowerment and win-win co-operation for green and low-carbon industrial development: analysis of regional differences based on GMM-ANN intelligence models. J. Clean. Prod. 445, 141332. doi:10.1016/j.jclepro.2024.141332
Ding, C., Cao, X. J., and Næss, P. (2018). Applying gradient boosting decision trees to examine non-linear effects of the built environment on driving distance in Oslo. Transp. Res. Part A Policy Pract. 110, 107–117. doi:10.1016/j.tra.2018.02.009
Dong, L. (2024). Spatio-temporal evolution and prediction of carbon balance in the Yellow River Basin and zoning for low-carbon economic development. Sci. Rep. 14 (1), 14385. doi:10.1038/s41598-024-65113-1
Du, H., Zhao, Li, Zhang, P., Li, J., and Yu, S. (2023). Ecological compensation in the Beijing-Tianjin-Hebei region based on ecosystem services flow. J. Environ. Manag. 331, 117230. doi:10.1016/j.jenvman.2023.117230
Dumortier, J., and Elobeid, A. (2021). Effects of a carbon tax in the United States on agricultural markets and carbon emissions from land-use change. Land Use Policy 103, 105320. doi:10.1016/j.landusepol.2021.105320
Feng, H., Tang, B., Hu, Y.-J., Li, C., and Wang, H. (2024). Dynamic optimisation of carbon allowance considering inter-provincial energy resources trade for emissions reduction: case of China southern power grid. J. Clean. Prod. 471, 143318. doi:10.1016/j.jclepro.2024.143318
Gao, X., Shen, J., He, W., Sun, F., Zhang, Z., Guo, W., et al. (2019). An evolutionary game analysis of governments’ decision-making behaviors and factors influencing watershed ecological compensation in China. J. Environ. Manag. 251, 109592. doi:10.1016/j.jenvman.2019.109592
Gao, X., Shen, J., He, W., Zhao, X., Li, Z., Hu, W., et al. (2021). Spatial-temporal analysis of ecosystem services value and research on ecological compensation in Taihu Lake Basin of Jiangsu Province in China from 2005 to 2018. J. Clean. Prod. 317, 128241. doi:10.1016/j.jclepro.2021.128241
Gong, Y., Yang, L., Liu, J., and Sun, Y. (2024). Overcoming public resistance to carbon taxes: a cost-efficient solution built on a pre-existing reward-based climate policy. J. Environ. Manag. 352, 120025. doi:10.1016/j.jenvman.2024.120025
Haenlein, M., and Kaplan, A. (2019). A brief history of artificial intelligence: on the past, present, and future of artificial intelligence. Calif. Manag. Rev. 61 (4), 5–14. doi:10.1177/0008125619864925
Han, X., Gao, X., Ahmad, F., Ali Chandio, A., and Khan, S. (2024). Carbon compensation and carbon neutrality: regional variations based on net carbon transfer of trade in China. Geosci. Front. 15 (4), 101809. doi:10.1016/j.gsf.2024.101809
Hew, K. F., Hu, X., Qiao, C., and Tang, Y. (2020). What predicts student satisfaction with MOOCs: a gradient boosting trees supervised machine learning and sentiment analysis approach. Comput. and Educ. 145, 103724. doi:10.1016/j.compedu.2019.103724
Hindman, M. (2015). Building better models: prediction, replication, and machine learning in the social sciences. Ann. Am. Acad. Political Soc. Sci. 659 (1), 48–62. doi:10.1177/0002716215570279
Hmeidi, I., Hawashin, B., and El-Qawasmeh, E. (2008). Performance of KNN and SVM classifiers on full word Arabic articles. Adv. Eng. Inf. 22 (1), 106–111. doi:10.1016/j.aei.2007.12.001
Hu, H., Tian, G., Wu, Z., and Xia, Q. (2022). A study of ecological compensation from the perspective of land use/cover change in the middle and lower Yellow River, China. Ecol. Indic. 143, 109382. doi:10.1016/j.ecolind.2022.109382
Hu, X. D., and Wang, J. M. (2010). Estimation of livestock greenhouse gases discharge in China. Transactions of the CSAE, 26(10), 247–252. doi:10.3969/j.issn.1002-6819.2010.10.042
James, G., Witten, D., Hastie, T., and Tibshirani, R. (2013). An introduction to statistical learning, 112. Springer.
Jeung, M., Baek, S., Beom, J., Cho, K. H., Her, Y., and Yoon, K. (2019). Evaluation of random forest and regression tree methods for estimation of mass first flush ratio in urban catchments. J. Hydrology 575, 1099–1110. doi:10.1016/j.jhydrol.2019.05.079
Jiang, T., Gradus, J. L., and Rosellini, A. J. (2020). Supervised machine learning: a brief primer. Behav. Ther. 51 (5), 675–687. doi:10.1016/j.beth.2020.05.002
Jin, F. J. (2019). Coordinated promotion strategy of ecological protection and high-quality development in the Yellow River Basin. Reform 11, 33–39. Available online at: https://kns.cnki.net/kcms2/article/abstract?v=4fayqqv3WFdkExOO6qr3pPveKWrZ4uA6w5LIEk8Yd3T2COWDz2EbTOjDO7eXJY1GyX5O4DNb6X4i8Bd2XqP1NEySUcOiEdELM2LOHJxI7KXyzuOGcsV3JbGHShhWLh3AVaMx-SMrhhUrooUpg0zBDLcXkcMZQ-xaKTZI4ktf1zcFppye2mgl_2PqpSl40oyc&uniplatform=NZKP
Jing, S., and Zhang, J. (2021). Trans-provincial basin horizontal ecological compensation and enterprise total factor productivity. J. Finance Econ. 47 (5), 139–152. doi:10.16538/j.cnki.jfe.20210313.201
Jing, S. W., and Zhang, J. (2018). Has the horizontal ecological compensation in the Xin’an River Basin reduced the intensity of water pollution. China Popul. Resour. Environ. 28, 152–159. doi:10.1007/s11356-023-28679-3
Jing, X., Tian, G., Li, M., and Javeed, S. A. (2021). Research on the spatial and temporal differences of China’s provincial carbon emissions and ecological compensation based on land carbon budget accounting. Int. J. Environ. Res. Public Health 18 (24), 12892. doi:10.3390/ijerph182412892
Kontschieder, P., Fiterau, M., Criminisi, A., and Rota Bulo, S. (2015). “Deep neural decision forests,” in Proceedings of the IEEE international conference on computer vision.
Kreif, N., and DiazOrdaz, K. (2019). Machine learning in policy evaluation: new tools for causal inference. arXiv Prepr. arXiv:1903.00402. doi:10.48550/arXiv.1903.00402
Li, P., Liu, D., Liu, C., Li, X., Liu, Z., Zhu, Y., et al. (2024). Blue carbon development in China: realistic foundation, internal demands, and the construction of blue carbon market trading mode. Front. Mar. Sci. 10, 1310261. doi:10.3389/fmars.2023.1310261
Li, X., Xia, K., Wu, T., Wang, S., Tang, H., Xiao, C., et al. (2024). Increased precipitation has not enhanced the carbon sequestration of afforestation in Northwest China. Commun. Earth and Environ. 5 (1), 619. doi:10.1038/s43247-024-01733-9
Li, X., and Xing, H. (2024). Regional carbon emission pathways under central-local coordination: objective constraints and collaborative incentives. Sustain. Prod. Consum. 47, 156–165. doi:10.1016/j.spc.2024.03.029
Lin, B., and Huang, C. (2022). Analysis of emission reduction effects of carbon trading: market mechanism or government intervention? Sustain. Prod. Consum. 33, 28–37. doi:10.1016/j.spc.2022.06.016
Lin, J., Huang, J., Prell, C., and Bryan, B. A. (2021). Changes in supply and demand mediate the effects of land-use change on freshwater ecosystem services flows. Sci. Total Environ. 763, 143012. doi:10.1016/j.scitotenv.2020.143012
Liu, G., Cui, F., and Wang, Y. (2024). Spatial effects of urbanization, ecological construction and their interaction on land use carbon emissions/absorption: evidence from China. Ecol. Indic. 160, 111817. doi:10.1016/j.ecolind.2024.111817
Liu, Z. H., Xu, J. W., and Zhang, C. H. (2021). Evolutionary game analysis of horizontal carbon ecological compensation at the provincial level. Soft. Sci. 35(11), 115–122. doi:10.13956/j.ss.1001-8409.2021.11.18
Liu, Z., Geng., Y., Xue, B., Xi, F., and Jiao, J. (2011). A Calculation method of CO2 emission from Urban energy consumption[J]. Resour. Sci, 33(7), 1325–1330. doi:10.12171/j.1000-1522.20220257
Liu, Y., Jiang, E., Qu, B., Zhu, Y., and Liu, C. (2022). Watershed ecological compensation mechanism for mainstream and branches based on stochastic evolutionary game: a case of the middle Yellow River. Water 14 (24), 4038. doi:10.3390/w14244038
Liu, Y., Qu, B., Jiang, E., Lingang, H., Zhu, Y., and Jing, Y. (2023). Allocating payments for ecosystem services under future multiple scenarios in the Yellow River Basin, China. Ecol. Indic. 157, 111232. doi:10.1016/j.ecolind.2023.111232
Loges, R., Vogeler, I., Kluß, C., Hasler, M., and Taube, F. (2024). Renovation of grasslands with grass and white clover – effects on yield and carbon sequestration. Soil Tillage Res. 240, 106076. doi:10.1016/j.still.2024.106076
Lombardo, L., Cama, M., Conoscenti, C., Märker, M., and Rotigliano, E. (2015). Binary logistic regression versus stochastic gradient boosted decision trees in assessing landslide susceptibility for multiple-occurring landslide events: application to the 2009 storm event in Messina (Sicily, southern Italy). Nat. Hazards 79 (3), 1621–1648. doi:10.1007/s11069-015-1915-3
Lu, H., Cheng, F., Ma, X., and Hu, G. (2020). Short-term prediction of building energy consumption employing an improved extreme gradient boosting model: a case study of an intake tower. Energy 203, 117756. doi:10.1016/j.energy.2020.117756
Mei, W., Dong, H., Qian, L., Yan, J., Hu, Y., and Wang, L. (2024). Effects of anthropogenic disturbances on the carbon sink function of Yangtze River estuary wetlands: a review of performance, process, and mechanism. Ecol. Indic. 159, 111643. doi:10.1016/j.ecolind.2024.111643
Meng, Q., Zheng, Y., Qi, L., Li, B., and Hejie, W. (2023). Analysis of spatiotemporal variation and influencing factors of land-use carbon emissions in nine provinces of the Yellow River Basin based on the LMDI model. Land 12 (2), 437. doi:10.3390/land12020437
Mishra, A., Pandey, A., and Kureethara, J. V. (2024). “Emerging trends in climate change and global economic governance,” in Climate change and finance: navigating the challenges and opportunities in capital markets. Editor N. Naifar (Cham: Springer Nature Switzerland), 163–184.
Morid, M. A., Kawamoto, K., Ault, T., Dorius, J., and Abdelrahman, S. (2017). Supervised learning methods for predicting healthcare costs: systematic literature review and empirical evaluation. AMIA Annu. Symp. Proc. 2017, 1312–1321. doi:10.1093/ndt/gfy140
Mullainathan, S., and Spiess, J. (2017). Machine learning: an applied econometric approach. J. Econ. Perspect. 31 (2), 87–106. doi:10.1257/jep.31.2.87
Niu, H., Chen, S., and Xiao, D. (2024). Multi-Scenario land cover changes and carbon emissions prediction for peak carbon emissions in the Yellow River Basin, China. Ecol. Indic. 168, 112794. doi:10.1016/j.ecolind.2024.112794
Niu, J., Mao, C., and Jia, X. (2024). Based on ecological footprint and ecosystem service value, research on ecological compensation in Anhui Province, China. Ecol. Indic. 158, 111341. doi:10.1016/j.ecolind.2023.111341
Pan, F., Wang, B., Hu, X., and Perrizo, W. (2004). Comprehensive vertical sample-based KNN/LSVM classification for gene expression analysis. J. Biomed. Inf. 37 (4), 240–248. doi:10.1016/j.jbi.2004.07.003
Pan, Y., Birdsey, R. A., Phillips, O. L., Houghton, R. A., Fang, J., Kauppi, P. E., et al. (2024). The enduring world forest carbon sink. Nature 631 (8021), 563–569. doi:10.1038/s41586-024-07602-x
Panov, P., and Džeroski, S. (2007). “Combining bagging and random subspaces to create better ensembles,” in Advances in intelligent data analysis VII. Berlin, Heidelberg.
Peng, Z., Pu, H., Huang, X., Zheng, R., and Lin, Xu (2022). Study on public willingness and incentive mechanism of ecological compensation for inter-basin water transfer in China in the carbon neutral perspective. Ecol. Indic. 143, 109397. doi:10.1016/j.ecolind.2022.109397
Plantinga, A. J., Millage, K., O'Reilly, E., Bieri, T., Holmes, N., Wilson, J., et al. (2024). How to pay for ecosystem services. Front. Ecol. Environ. 22 (1), e2680. doi:10.1002/fee.2680
Porwal, A., Carranza, E. J. M., and Hale, M. (2004). A hybrid Neuro-Fuzzy model for mineral potential mapping. Math. Geol. 36 (7), 803–826. doi:10.1023/B:MATG.0000041180.34176.65
Prasad, A. M., Iverson, L. R., and Liaw, A. (2006). Newer classification and regression tree techniques: bagging and random forests for ecological prediction. Ecosystems 9 (2), 181–199. doi:10.1007/s10021-005-0054-1
Qiao, W., Lu, H., Zhou, G., Azimi, M., Yang, Q., and Tian, W. (2020). A hybrid algorithm for carbon dioxide emissions forecasting based on improved lion swarm optimizer. J. Clean. Prod. 244, 118612. doi:10.1016/j.jclepro.2019.118612
Shamshoddin, S., Khader, J., and Gani, S. (2020). Predicting consumer preferences in electronic market based on IoT and Social Networks using deep learning based collaborative filtering techniques. Electron. Commer. Res. 20 (2), 241–258. doi:10.1007/s10660-019-09377-0
Shang, H., Fan, J., Fan, B., and Su, F. (2022). Economic effects of ecological compensation policy in Shiyang River Basin: empirical research based on DID and RDD models. Sustainability 14 (5), 2999. doi:10.3390/su14052999
Strobl, C., Boulesteix, A.-L., Zeileis, A., and Hothorn, T. (2007). Bias in random forest variable importance measures: Illustrations, sources and a solution. BMC Bioinforma. 8 (1), 25. doi:10.1186/1471-2105-8-25
Sun, J., Wang, Y., Lee, T. M., Nie, X., Wang, T., Liang, E., et al. (2024). Nature-based Solutions can help restore degraded grasslands and increase carbon sequestration in the Tibetan Plateau. Commun. Earth and Environ. 5 (1), 154. doi:10.1038/s43247-024-01330-w
Sutton, C. D. (2005). “11 - classification and regression trees, bagging, and boosting,” in Handbook of statistics. Editors C. R. Rao, E. J. Wegman, and J. L. Solka (Elsevier), 303–329.
Tang, Y., Wang, R., Ci, H., Wei, J., Yang, H., Teng, J., et al. (2024). Analysis of the spatiotemporal evolution of carbon budget and carbon compensation zoning in the core area of the Yangtze River Delta urban agglomeration. Land 13 (6), 747. doi:10.3390/land13060747
Tao, M., Wen, L., Sheng, M. S., Yan, Z. J., and Poletti, S. (2024). Dynamics between energy intensity and carbon emissions: what does the clustering effect of labor and capital play? J. Clean. Prod. 452, 142223. doi:10.1016/j.jclepro.2024.142223
Wang, B., Yang, X., Dou, Y., Wu, Q., Wang, G., Li, Y., et al. (2024). Spatio-Temporal dynamics of economic Density and vegetation cover in the Yellow River Basin: Unraveling Interconnections. Land 13 (4), 475. doi:10.3390/land13040475
Wang, J., and Wang, L. (2023). Study on the efficiency of air pollution control and responsibility allocation in the Yangtze River Delta region in China from the perspective of ecological compensation. J. Clean. Prod. 423, 138700. doi:10.1016/j.jclepro.2023.138700
Wang, G., Zhang, H. B., Xue, F., and Zhen, Y. (2017). Relations between land use carbon budget and economic development at county level in Chengdu city. J. Natu. Resou. 32(7), 1170–1182. doi:10.11849/zrzyxb.20160677
Wang, Q., and Mao, C. (2024). Evolutionary Game analysis of ecological governance strategies in the Yangtze River Delta region, China. Land 13 (2), 212. doi:10.3390/land13020212
Wang, Q., Wang, N., Wang, H., and Yuan, X. (2022). Study on influencing factors and simulation of watershed ecological compensation based on evolutionary Game. Sustainability 14 (6), 3374. doi:10.3390/su14063374
Wang, R., Wen, X., Wang, X., Fu, Y., and Zhang, Y. (2022). Low carbon optimal operation of integrated energy system based on carbon capture technology, LCA carbon emissions and ladder-type carbon trading. Appl. Energy 311, 118664. doi:10.1016/j.apenergy.2022.118664
Wang, T., Li, H., and Accatino, F. (2024). A theoretical framework for value co-creation analysis in carbon sink projects. J. Clean. Prod. 477, 143854. doi:10.1016/j.jclepro.2024.143854
Wang, Z., Wang, F., and Ma, S. (2024). Research on the Coupled and coordinated relationship between ecological environment and economic development in China and its evolution in time and space. Pol. J. Environ. Stud. 34, 3333–3342. doi:10.15244/pjoes/188854
Wu, C., Lu, R., Zhang, P., and Dai, E. (2024). Multilevel ecological compensation policy design based on ecosystem service flow: a case study of carbon sequestration services in the Qinghai-Tibet Plateau. Sci. Total Environ. 921, 171093. doi:10.1016/j.scitotenv.2024.171093
Xing, H., Zhang, Y., Zhu, L., Xu, N., and Lan, X. (2024). MSAVI-enhanced CASA model for estimating the carbon sink in coastal wetland area: a case study of Shandong province. IEEE J. Sel. Top. Appl. Earth Observations Remote Sens. 17, 19698–19712. doi:10.1109/JSTARS.2024.3485642
Xiufan, Z., and Fan, D. (2024). Research on the synergistic emission reduction effect of carbon emission trading and green financial policy. J. Environ. Manag. 367, 121924. doi:10.1016/j.jenvman.2024.121924
Xu, Y., Yang, X., Xing, X., and Lunda, W. (2024). Coupling eco-environmental quality and ecosystem services to delineate priority ecological reserves—a case study in the Yellow River Basin. J. Environ. Manag. 365, 121645. doi:10.1016/j.jenvman.2024.121645
Yang, X. J., and Liu, D. D. (2013). An empirical analysis of carbon accounting for Inner Mongolia Autonomous Region. J. Inner. Mong. Univer. (Natural Science Edition), 44(1), 26–35. doi:10.11702/nmgdxxbzk20130105
Yan, Y., and Cao, Y. (2024). Three-party behavior strategy selection and simulation of monetary compensation for marine environmental damage based on evolutionary game theory. Ocean and Coast. Manag. 250, 107025. doi:10.1016/j.ocecoaman.2024.107025
Yang, D., Zhu, C., Li, J., Li, Y., Zhang, X., Yang, C., et al. (2024). Exploring the supply and demand imbalance of carbon and carbon-related ecosystem services for dual-carbon goal ecological management in the Huaihe River Ecological Economic Belt. Sci. Total Environ. 912, 169169. doi:10.1016/j.scitotenv.2023.169169
Yang, Y, Zhang, Y., Yang, H., and Yang, F. (2022). Horizontal ecological compensation as a tool for sustainable development of urban agglomerations: exploration of the realization mechanism of Guanzhong Plain urban agglomeration in China. Environ. Sci. and Policy 137, 301–313. doi:10.1016/j.envsci.2022.09.004
Yang, Y, Zhu, Y, and Zhao, Y. (2024). Improving farmers’ livelihoods through the eco-compensation of forest carbon sinks. Renew. Sustain. Energy Rev. 198, 114401. doi:10.1016/j.rser.2024.114401
Yuan, L., Qi, Y., He, W., Wu, X., Kong, Y., Ramsey, T. S., et al. (2024). A differential game of water pollution management in the trans-jurisdictional river basin. J. Clean. Prod. 438, 140823. doi:10.1016/j.jclepro.2024.140823
Zeng, P., Liang, L., and Zeng, F. (2024). Differences in carbon sink potential between urban agglomerations are decreasing: evidence from China. Ecol. Indic. 163, 112062. doi:10.1016/j.ecolind.2024.112062
Zhang, H., Peng, J., Wang, R., Zhang, M., Gao, C., and Yang, Yu (2023). Use of random forest based on the effects of urban governance elements to forecast CO2 emissions in Chinese cities. Heliyon 9 (6), e16693. doi:10.1016/j.heliyon.2023.e16693
Zhang, S., Zhong, H., Huang, L., Kong, Z., and Wu, L. (2024). Recovery of soil organic carbon storage driven by microbial communities during long-term natural restoration in wetland ecosystems. Ecol. Eng. 199, 107170. doi:10.1016/j.ecoleng.2023.107170
Zhao, J., Kou, L., Wang, H., He, X., Xiong, Z., Liu, C., et al. (2022). Carbon emission prediction model and analysis in the Yellow River Basin based on a machine learning method. Sustainability 14 (10), 6153. doi:10.3390/su14106153
Zhen, H., He, X., Qiao, Y., Ju, X., Xu, Z., Hashemi, F., et al. (2024). Does organic agriculture need eco-compensation? Evidence from Chinese organic farms using an eco-compensation model. Sustain. Prod. Consum. 49, 72–81. doi:10.1016/j.spc.2024.06.013
Zhu, D., Qian, N., Wang, Y., Peng, S., Lu, X., Zhou, H., et al. (2023). The influence of psychological cognition and policy environment on the basin residents' behavior of ecological compensation under the background of carbon neutrality: a case study in upper Yellow River basin, China. Ecol. Indic. 148, 110031. doi:10.1016/j.ecolind.2023.110031
Zhao, R. Q., and Qin, M. Z. (2007). Tem porospatial variation of partial carbon source/sink of farmland ecosystem in coastal China. J. Ecol. Rura. Environ. 23(2), 1–6. doi:10.3969/j.issn.1673-4831.2007.02.001
Keywords: Yellow River Basin, carbon ecological compensation, evolutionary game theory, machine learning, policy impact
Citation: Lu H and Zhao X (2025) Investigating the horizontal carbon ecological compensation mechanism in the Yellow River Basin: construction, validation, and policy impact. Front. Environ. Sci. 13:1511882. doi: 10.3389/fenvs.2025.1511882
Received: 15 October 2024; Accepted: 25 February 2025;
Published: 21 March 2025.
Edited by:
Mehran Idris Khan, University of International Business and Economics, ChinaReviewed by:
Ying Zhu, Xi’an University of Architecture and Technology, ChinaCopyright © 2025 Lu and Zhao. This is an open-access article distributed under the terms of the Creative Commons Attribution License (CC BY). The use, distribution or reproduction in other forums is permitted, provided the original author(s) and the copyright owner(s) are credited and that the original publication in this journal is cited, in accordance with accepted academic practice. No use, distribution or reproduction is permitted which does not comply with these terms.
*Correspondence: Xiaofei Zhao, MTMyMjA4ODIxODZAMTYzLmNvbQ==
Disclaimer: All claims expressed in this article are solely those of the authors and do not necessarily represent those of their affiliated organizations, or those of the publisher, the editors and the reviewers. Any product that may be evaluated in this article or claim that may be made by its manufacturer is not guaranteed or endorsed by the publisher.
Research integrity at Frontiers
Learn more about the work of our research integrity team to safeguard the quality of each article we publish.