 Lei Li
 Guangxing Ji
 Yulong Guo
 Meng Li
 Genming Li
95% of researchers rate our articles as excellent or good
Learn more about the work of our research integrity team to safeguard the quality of each article we publish.
Find out more
ORIGINAL RESEARCH article
Front. Environ. Sci. , 01 April 2025
Sec. Land Use Dynamics
Volume 13 - 2025 | https://doi.org/10.3389/fenvs.2025.1511629
As the typical megacity in the Central Plains, the simulation and prediction of Zhengzhou’s future land use and ecosystem carbon storage are of great significance for regional green and coordinated development. Based on land use data and CMIP6 data, the study simulated land use types from 2030 to 2050 through plus model. Then the InVEST model is used to estimate its ecosystem carbon storage. The results show that: (1) Arable land is the main type of land use in Zhengzhou from 2000 to 2020. During the period, the conversion between land use type is mainly manifested as the conversion of arable land into construction land. The distribution of the built-up area has changed from one center with multiple scattered dots to one center with a radial spider-web-like pattern. (2) In 2050, arable land in the SSP126 scenario is the only one of the three scenarios to decline, but the area of forest land and so on in this scenario is the largest of the three. The area changes trend of each land use type in the two scenarios of SSP245 and SSP585 are relatively consistent. (3) The areas with high ecosystem carbon storage value are mainly distributed in the forest area in the west of the study area. The regional ecosystem carbon storage value of SSP126 scenario in 2050 is the highest, which is 5.7762 × 10⁷t. The ecosystem carbon storage value of SSP585 scenario decreased the most, with a total reduction of 0.6667 × 10⁷t. (4) The spatiotemporal variation of ecosystem carbon storage in Zhengzhou is the result of natural and social factors, among which the average annual temperature is the strongest explanation. This study provides a theoretical basis for the scientific formulation of land use planning in Zhengzhou, as well as the coordinated development of man and nature.
Massive emissions of greenhouse gases have caused a series of global impacts such as rising global temperatures, frequent extreme weather, and food security (Newman and Noy, 2023; Adesete et al., 2023). CO2 is one of the important representatives of greenhouse gases, and its harm should not be underestimated. How to reduce emissions, increase absorption, and increase ecosystem carbon storage has become a widespread concern today. Terrestrial ecosystems are important carbon sinks, absorbing 31% of anthropogenic CO2 emissions between 2010 and 2019 and playing a key role in maintaining the global carbon balance (Li L. et al., 2022; Zheng et al., 2024). Differences in carbon sequestration capacity by land use type, which means that changes in land use will result in changes in regional ecosystem carbon storage (Zhang et al., 2017). Therefore, it is of great significance to study the response of regional Differences in carbon sequestration capacity by land use type, which means that changes in land use will result in changes in regional ecosystem carbon storage to land use change (Zhao and Miao, 2022).
Traditional ecosystem carbon storage calculation methods, such as biomass method, storage method and field sampling method, have great deficiencies in research scale and visual expression, and these methods are complicated to operate and have high cost (Qi et al., 2024; Sun F. H. et al., 2023). In recent years, the rapid development of GIS has provided a new perspective for the study of ecosystem carbon storage, and ecosystem carbon storage can be obtained by combining various ecosystem service models (Sun Y. F. et al., 2023; Sun X. X. et al., 2023). Among them, the Invest model has the advantages of simple parameters, less required data and high accuracy. The ecosystem carbon storage plate contained in the model has been widely used by scholars (Du et al., 2023; Zheng and Zheng, 2023). Predicting future ecosystem carbon storage changes requires a combination of land use simulation models such as CLUE-S (Zheng and Hu, 2018; Zhang and Lu, 2021), FLUS (Wu et al., 2022; Liu et al., 2021), CA-Markov (Tariq et al., 2022), and others. But these models do not yield the determinants behind land use transition. Liang’s improved PLUS model is able to explore the driving factors behind land use change while providing higher simulation accuracy and more realistic landscape pattern indicators (Liang et al., 2021; Li Q. et al., 2023). Combining InVEST model and PLUS model to study regional ecosystem carbon storage is becoming a hot spot at present, and the domestic research scales involve provinces (Wei et al., 2023; Huang and Liu, 2024), urban agglomerations (Wen et al., 2024; Wang R. Y. et al., 2023), cities (Wang Z et al., 2022; Wang Y. L. et al., 2023), etc. Li et al. predicted the ecosystem carbon storage under different scenarios in Liaoning Province and pointed out that the strict implementation of ecological protection is conducive to the increase of regional ecosystem carbon storage (Li P. C. et al., 2023). Sun et al. established three different scenarios to study the ecosystem carbon storage of southern Jiangsu urban agglomeration in 2050, and concluded that urban encroachment on cultivated land and forest land is the main reason for the reduction of ecosystem carbon storage (Sun F. H. et al., 2023). Zhou et al. studied the ecosystem carbon storage of Hefei City in three scenarios for the year 2035, indicating that implementing a policy of ecological protection and urban development in parallel, adjusting the comprehensive land use pattern, can help improve the city’s carbon loss (Zhi et al., 2024). Meanwhile, there are many relevant studies exist globally. Bwalya Mutal et al. addressed the limitations of previous models such as FLUS by utilizing the PLUS model for the mutual attraction and evolution of lands under different policies in Ndola district (Mutale and Qiang, 2024). Li et al. used the Plus model to simulate land use in the Rwandan region and explored the drivers of land use change (Li et al., 2021). Ahmed Marey et al. simulated land use for different scenarios in Montreal Island, Canada through the model, providing an analysis of the differences between the three different scenarios (Marey et al., 2024).
Traditional Markov chains are based on historical land use data to forecast future demand for different land use types, which cannot fully consider the dynamic factors such as policy changes and economic fluctuations that may occur in the future. And CMIP6 provides future land use demand data generated on the basis of different socio-economic shared development paths, and at the same time, it also indirectly takes into account the impacts of future policies to comprehensively and scientifically consider the impacts of climate change, socio-economic development and other factors on land use. (Hurtt et al., 2020a; Ji et al., 2023). This study takes Zhengzhou, a mega-city, as the research object, and based on the land use data provided by CMIP6 in different scenarios, it analyzes and predicts the current and future spatial and temporal trends of ecosystem carbon storage in the study area.
In 2020, China proposed for the first time that it would strive to reach the carbon peak by 2030 and carbon neutrality by 2060. As one of the pilot cities of the Carbon peak project, Zhengzhou has significant location advantages and an important strategic economic position. In the past two decades, it has developed rapidly, and land use changes have been significant (Liu et al., 2022). Therefore, this study uses PLUS model and InVEST model to conduct multi-scenario simulation of land use from 2030 to 2050, estimate regional ecosystem carbon storage changes, and explore the response of ecosystem carbon storage to land use change, and use geographic detector to explore the drivers of spatial and temporal ecosystem carbon storage divergence. In order to explore the best national spatial planning for maintaining regional ecosystem carbon storage and contribute to achieving the regional “dual carbon” goals.
Zhengzhou City is located in the middle north of Henan Province, the boundary between the middle and lower reaches of the Yellow River, and the total area of the city is 7,567 square kilometers. The general trend of the terrain is high in the southwest and low in the northeast (Figure 1), which belongs to the temperate continental monsoon climate, with an average annual temperature of 15°C and an average annual precipitation of 577.70 ∼ 691.60 mm. There are 124 rivers of various sizes in the territory, spanning the two major river basins of the Yellow River and the Huaihe River (Peng et al., 2019). Zhengzhou is the capital city of Henan Province and the core development area of the Central Plains urban agglomeration. At the same time, it is a national central city in central China and an important hub of transportation in China, as well as an important node city for ecological protection and high-quality development in the Yellow River Basin (Cai et al., 2022a).
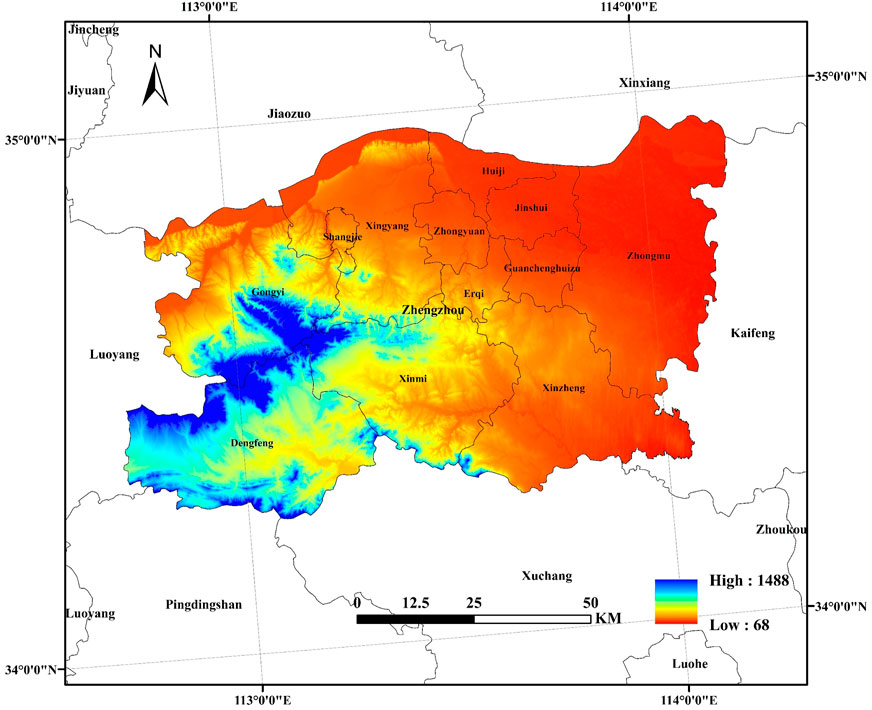
Figure 1. Location of the study area
The land use data from 2000 to 2020, night lights, population density, NDVI and soil type data used in this paper are from the Resource and Environmental Science and Data Center of Chinese Academy of Sciences (https://www.resdc.cn/). Railway, highway and other location data come from the OpenStreetMap (https://openmaptiles.org/). The DEM data come from the Geospatial Data Cloud Platform (https://www.gscloud.cn/), and the slope and slope direction data come from the extraction and analysis of the DEM data. Soil root oxygen content data are from Harmonized World Soil Database (HWSD) (http://webarchive.iiasa.ac.at/Research/LUC/External-World-soil-database/).2030-2050 cmip6 land use data are from Global 0.25° × 0.25° Land-Use Harmonization (LUH2) dataset (https://luh.umd.edu/data.shtml). Precipitation and temperature data are derived from the National Earth System Science Data Center (https://www.geodata.cn/data/) (Table 1).
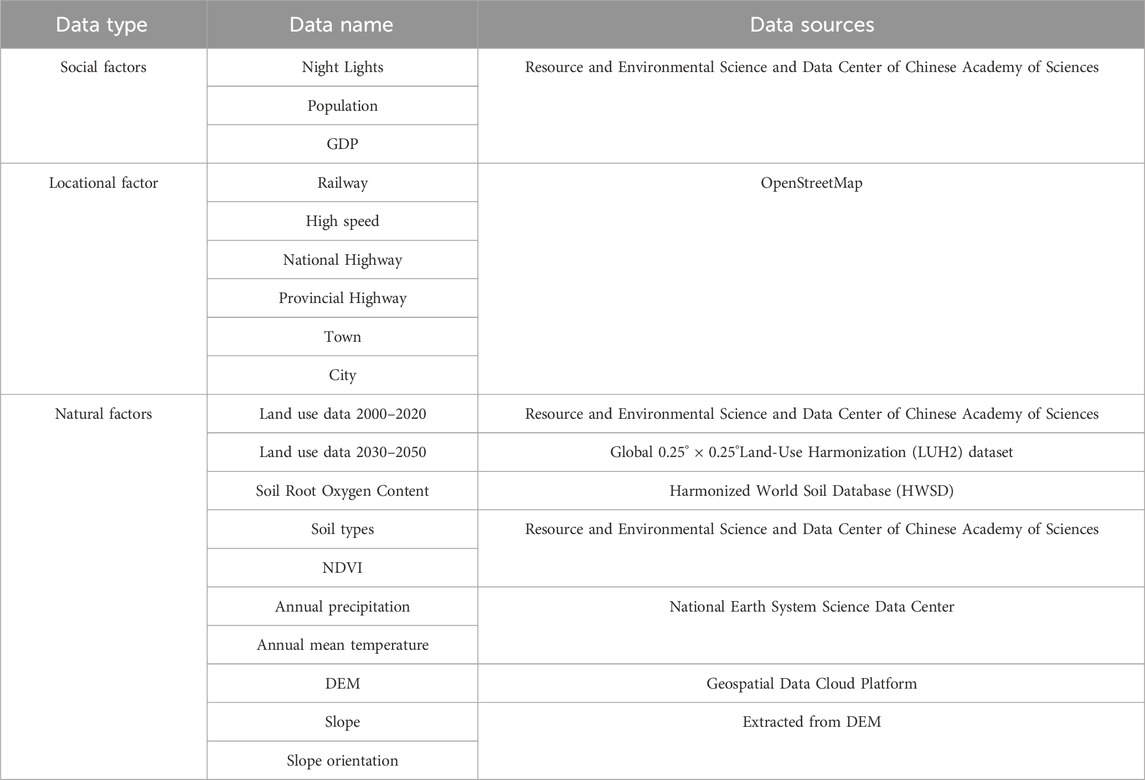
Table 1. Sources of data.
PLUS model is an improved cellular automaton (CA) model, which can study the nonlinear relationship behind land use and land cover change (Li X. et al., 2022). The model integrates a rule mining framework based on the Land Expansion Analysis Strategy (LEAS) and a CA model based on multiple types of random seeds (CARS) (Li et al., 2024). It is able to find out the development probability of various land classes, and it has a higher simulation accuracy compared to previous land use prediction models. It has more advantages in studying land use impact mechanism and simulating land patch change (Lin and Peng, 2022; Nie et al., 2023). In the research, firstly, land use expansion is extracted from the land use data of the two periods, and then the development probability of each land classes is obtained by LEAS module. Finally, the future land use is simulated according to the development probability. In the process, a series of parameters such as neighborhood weight, transfer matrix and land use demand need to be artificially input.
Neighborhood weight is an important indicator of how easy it is to expand between different land use types. The value ranges from 0 to 1, and the larger the weight is, this type of land-use is the easier to spread around (Table 2). The transfer matrix can effectively restrain the unreasonable transformation between different classes and improve the accuracy of the result. 0 indicates that the two land types cannot be converted, and 1 indicates that the two land types can be converted (Table 3). The article finalizes the neighborhood weights and transition matrix by referring to related studies and adjusting the parameters appropriately according to the historical expansion status and model accuracy (Luo et al., 2023; Li L. et al., 2023). The land requirement data used for the study are taken from CMIP6 data, and the raster numbers are corrected to ensure consistency.
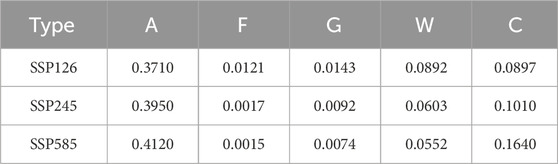
Table 2. Neighborhood weights.
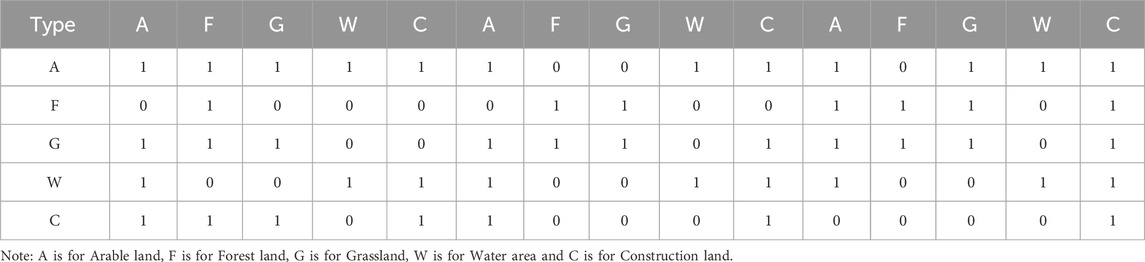
Table 3. Transition matrix.
InVEST model is a model jointly developed by Stanford University, the World-Wide Fund for Nature and the Nature Conservancy, including ecosystem carbon storage, soil and water conservation, habitat quality and other modules (Li Q. et al., 2023; Jia et al., 2023). The ecosystem carbon storage section of the InVEST model is used in this study. Ecosystem carbon storage in terrestrial ecosystems is categorized into four parts: above-ground vegetation ecosystem carbon storage, below-ground vegetation ecosystem carbon storage, soil organic ecosystem carbon storage and dead organic matter ecosystem carbon storage. The calculation formula is:
Where:
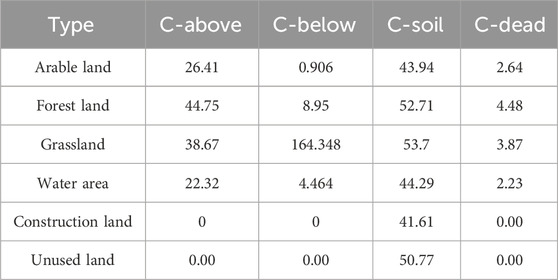
Table 4. Carbon density values in the study area.
The geographic detector is a model that can explain the spatial heterogeneity of geographical phenomena and explain their driving forces. Geographic detectors include single-factor detection and interaction factor detection, and the Q value [0,1] of the factor is obtained by running the geographic detector, the larger the Q value, the stronger the explanatory power (Wang H. et al., 2023). The formula is:
In the formula:
As the capital of Henan Province, Zhengzhou City is the political, economic and cultural center of the whole province. At present and or a long period of time in the future, Zhengzhou City will be the key to accelerate the urbanization, industrialization and agricultural modernization of the surrounding areas. Understanding the current situation of land use, rationally adjusting the layout of land use, and realizing the intensive and efficient use of land are the inevitable choices to meet the development strategy of Zhengzhou and promote the economic development of the whole city and even the whole province.
The types of land use in Zhengzhou are divided into six categories, with the percentage of land use from largest to smallest being arable land, construction land, forest land, grassland, water area, and unused land. In this paper, ArcGIS is used to extract, cut and classify the data to get the land use status map of Zhengzhou. The analysis on land use changes in 2000, 2010 and 2020 gives Figure 2. From the figure, it can be seen that the construction land with the most obvious changes is mainly distributed in the lots centered on Zhongyuan District, Jinshui District, Guancheng Hui Autonomous District. And during this period, the construction land area has been continuously expanding, presenting a remarkable change from a single center with multiple scattered dots in 2000 to a single center with a radial spider-web-like distribution in 2010 and 2020.
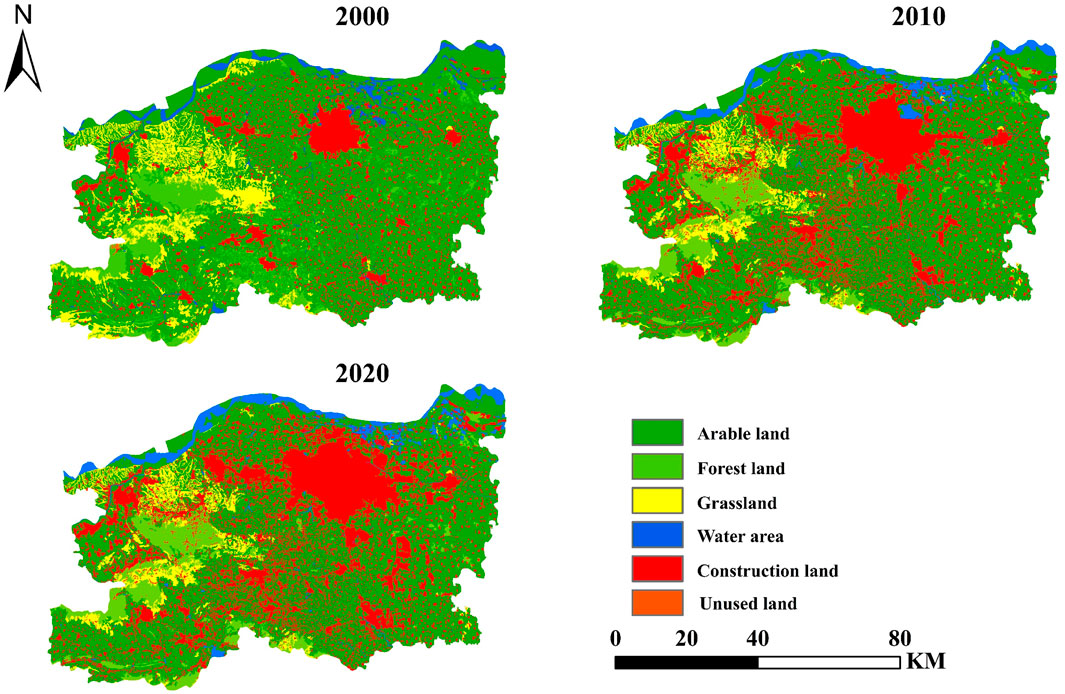
Figure 2. Spatial-temporal evolution of land use from 2000 to 2020.
According to the analysis of Table 5, it can be seen that the proportion of cultivated land in Zhengzhou is the largest, but with the passage of time, the proportion of cultivated land shows a trend of decreasing. From 67.44% accounted for in 2000 to 56.98% in 2020, the area decreased by 791.245 km2 in 20 years. The area of forest land and grassland also showed different degrees of decline during this period, which decreased by 198.949 km2 and 285.746 km2, respectively. Water area and construction land showed an upward trend during this period, in which the construction land area increased by 1165.207 km2, an increase of 2.38 times. From the land use transfer chord diagram (Figure 3), it can be seen that the increase of these two land use categories mainly comes from the transfer of arable land, which is also closely related to the implementation of the policy of returning fields to lakes and prioritizing economic development in Zhengzhou. The area of unutilized land was zeroed out between 2000 and 2010, which is also related to the intensive economic development of Zhengzhou, the increase in land utilization rate and the strengthening of the degree of utilization.
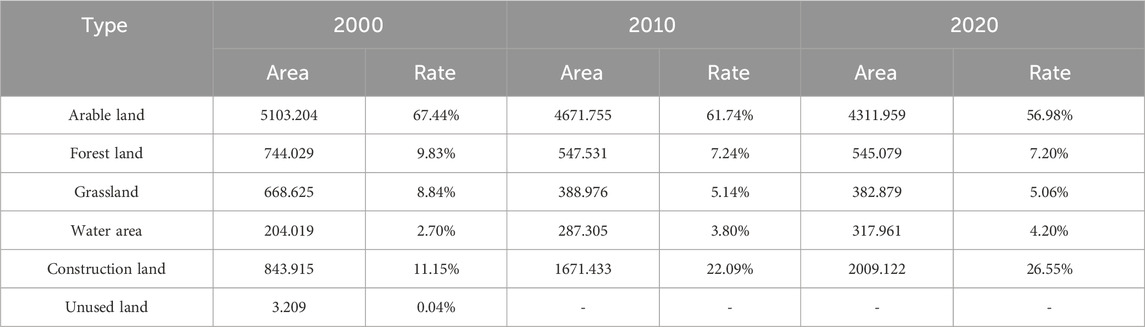
Table 5. Area and proportion of different land use types from 2000 to 2020 (km2).
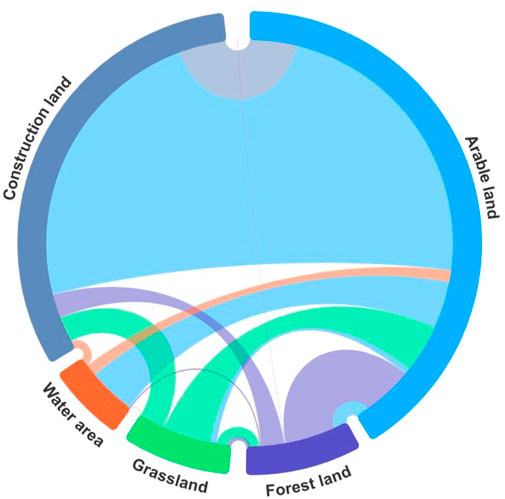
Figure 3. Land use chord map for 2000–2020.
Shared socio-economic pathways (SSP-RCP) are set to include both quantitative elements such as demographic, economic, and technological levels, as well as qualitative elements such as the direction, speed, and level of social development in order to reflect the correlation between radiative forcing and socio-economic development (Jiang et al., 2020; O’Neill et al., 2014). The CMIP emphasizes the impact of different development modalities on future climate change, combining different SSP-CMP scenarios. Based on the actual situation of the research area and considering possible future development models, the study selected three scenarios: SSP126, SSP245, and SSP585. The SSP126 scenario considers the increase of the global forest coverage area in the future, and the carbon emission rate is relatively low, forming the characteristics of low vulnerability and low challenges, and it belongs to the low forcing scenario. The SSP245 scenario belongs to the medium forcing situation, representing a scenario with medium social vulnerability and medium radiative forcing, that is, the middle path, and the greenhouse gas emission level is at a medium level. The SSP585 scenario belongs to the high forcing scenario, in which a large amount of environmental damage is tolerated for the sake of development, namely, savage development, and the carbon emission level is doubled by 2,100 (O’Neill et al., 2014; Hurtt et al., 2020b; Yue et al., 2023). Overall, the SSP126 scenario assumes a more optimistic future socio-economic development, emphasizing sustainable development and green growth. The SSP245 scenario assumes a relatively stable socio-economic development, neither extremely optimistic nor extremely pessimistic, and the SSP585 scenario assumes a more pessimistic future socio-economic development.
Based on the existing research results and the actual situation of the study area, the research selects 13 driving factors from three aspects, among which the social factors include GDP and population density data (Li M et al., 2024; Li Q. et al., 2023). The location factor selects the data of highways, railroads, towns, and so on, and with the help of ArcGIS software, the Euclidean distance tool is used to get the raster map of accessibility analysis of the distance to various types of roads and towns. The natural factors mainly include soil root oxygen content, soil types and so on. The land use expansion from 2010 to 2020 was extracted, and the development probability of each land type was obtained after driving factors were input into the LEAS module. Then combined with the land demand data provided by CMIP6 data to simulate the patch distribution in 2020, and finally compared with the real land use in 2020 to verify the accuracy of the model (Figure 4). The Kappa coefficient is used to measure the agreement between the results of the land use classification and the actual observed data. The FoM coefficient is used to assess the agreement between the location of land use change predicted by the model and the actual location of the change. Through verification, the Kappa coefficient of the model is 0.83, the overall accuracy is 0.90, and the FoM value is 0.11. The Kappa coefficient is greater than 0.81, and the FoM coefficient is between 0.1 and 0.2. The model has relatively high accuracy and can proceed to the next step of simulation (Xiao et al., 2024; Liu et al., 2024).
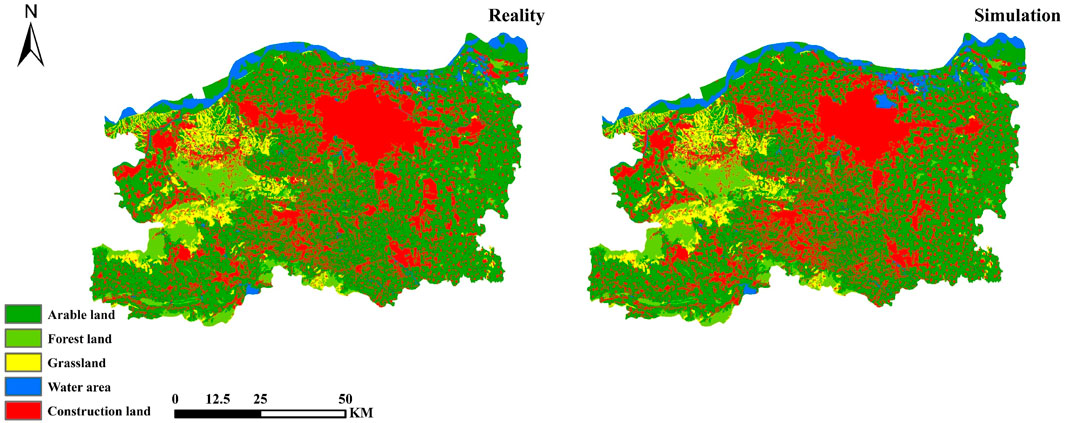
Figure 4. Comparison of 2020 reality and simulation results.
In this paper, SSP126, SSP245 and SSP585 are selected as the simulation scenarios, and after correcting the CMIP6 data to ensure that the total area is consistent and the outliers are eliminated, PLUS is utilized to predict the land use and cover changes in 2030, 2040 and 2050, respectively. On the whole, under the three scenarios, the changes of SSP245 and SSP585 are more consistent, but the amplitude is different. The change of SSP126 scenario is different from the previous two scenarios. And the areas of arable land and forest land change in the opposite direction to the other two scenarios. The grassland under the three scenarios all shows different degrees of reduction, mainly occurring in the western region of Zhengzhou. Among them, under the SSP126 scenario, there is more conversion of grassland to forestland, while under the SSP245 and SSP585 scenarios, there is more conversion to arable land. In addition to the conversion of grassland to cultivated land, in the SSP245 and SSP585 scenarios, there is also more encroachment of cultivated land on forestland in the western region (Figure 5).
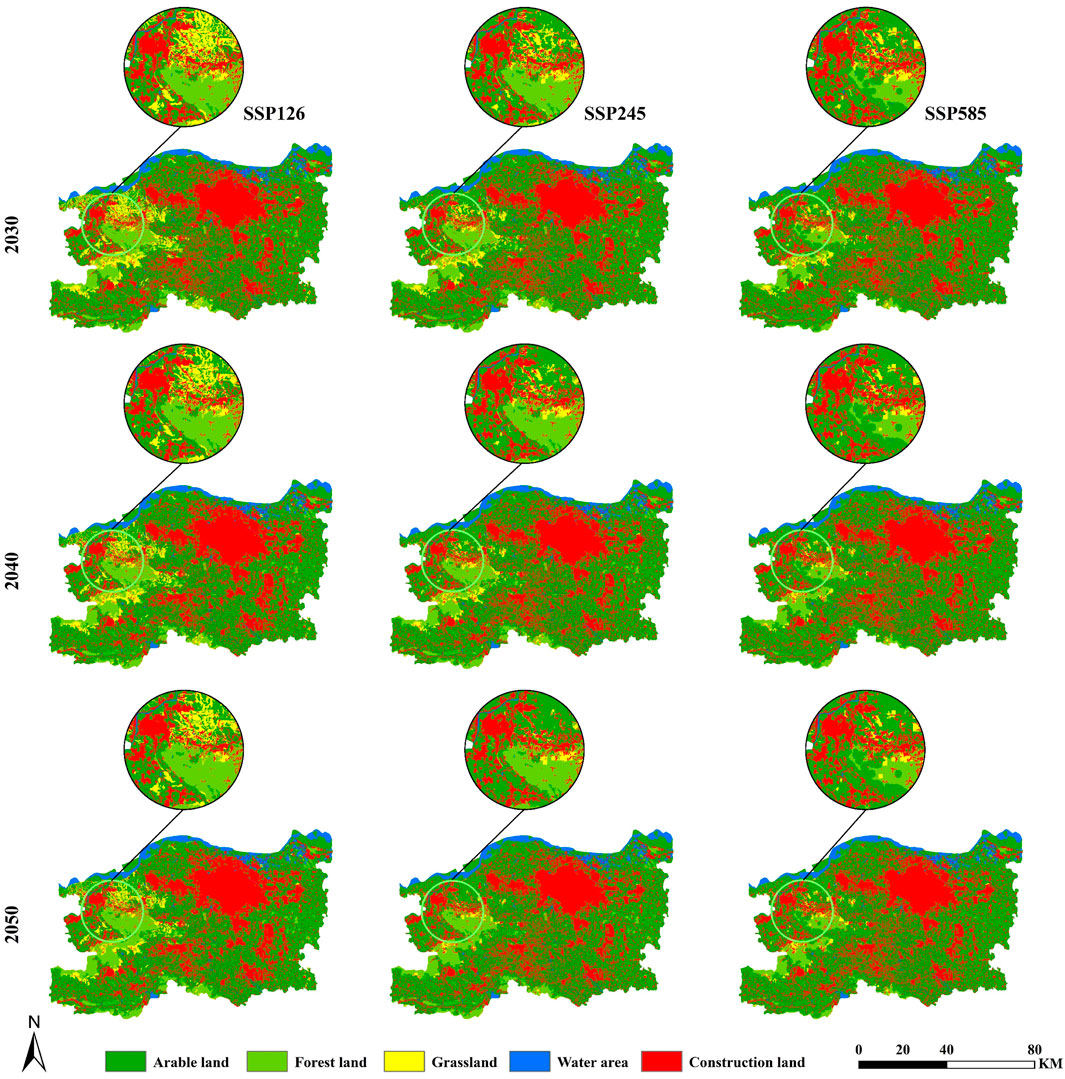
Figure 5. Spatial and temporal evolution of land use types in multiple scenarios from 2030 to 2050.
From the perspective of a single scenario, under the SSP126 scenario, the arable land in Zhengzhou shows an overall decreasing trend firstly decreasing and then increasing, with a total decrease of 60.159 km2 by 2050, which is also the only decreasing scenario among the three scenarios. The forest land showed an overall trend of increasing after the first decrease. By 2050, it will total increase of 75.653 km2, an increase of 13.88% (Figure 6). The grassland area continues to decline, and by 2050 it will be 110.780 km2, only 28.93% of the 2020 level. The construction land shows a trend of continuous increase totaling 256.606 km2 by the year 2050. Among the three scenarios, the arable land area in this scenario is the least, and the woodland and construction land area are the largest. Under the SSP245 scenario, both arable land and construction land show a continuous increasing trend, but the increase of arable land is larger than that of construction land, and the area of both of them reaches 4729.849 km2 and 2059.825 km2 respectively in 2050, which are 417.890 km2 and 50.703 km2 higher than that in 2020, increased 9.69% and 2.52% respectively. Forest land and grassland under this scenario show a continuous decreasing trend, but the decrease of grassland is larger than that of forest land, and the area of both of them will be 389.755 km2 and 69.611 km2 respectively in 2050, with the decreasing rate reaching 28.50% and 81.82% respectively. Arable land under the SSP585 scenario shows a trend of increasing and then decreasing, with an overall increasing trend. From 2020 to 2050, the area of forested land declined considerably in the first decade, and then gradually increased in the following 20 years, and reaching 369.767 km2, with a total decrease of 32.16%. The final grassland area in this scenario is not much different from that in SSP245 scenario, but before 2040, the grassland area in this scenario decreases more greatly. The area of construction land is growing steadily, reaching an area of 2122.443 km2 by 2050, accounting for 28.05% of the total area.
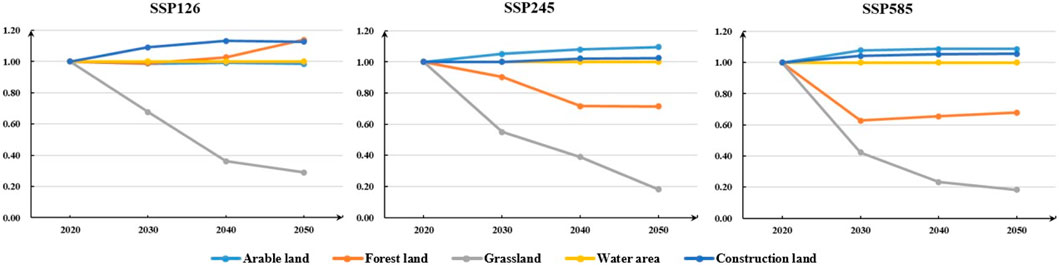
Figure 6. Change trend and change proportion of different types of land use from 2020 to 2050.
From the perspective of space, the high-value area of ecosystem carbon storage in Zhengzhou during 2000–2020 is mainly distributed in the western and southern areas of Zhengzhou, that is, the woodland area, while the high-value area in the eastern area is scattered (Figure 7). The medium ecosystem carbon storage region is evenly distributed throughout the whole area, similar to the distribution of cropland in the region. In the past 20 years, with the increase of construction land, the low-value area of ecosystem carbon storage in the study area has gradually increased. The change is more pronounced in the west during the period, with a large number of high-value areas shifting to areas with relatively low ecosystem carbon storage, which coincides with the transfer of forested land to cropland and construction land over the two decades. The distribution of regional ecosystem carbon storage in 2030–2050 is similar to that in the historical period, the high value area decreases and the low value area increases in the SSP245 and SSP585 scenarios, while the high value area increases in the SSP126 scenario. At each time node, the SSP585 scenario had the least high-value area, which corresponded with the least woodland area in this scenario. This also side by side shows the close relationship between land use type and ecosystem carbon storage, there is a strong consistency between the two, and its changes have a significant effect on the ecosystem carbon storage in the study area (Sun X. X. et al., 2023).
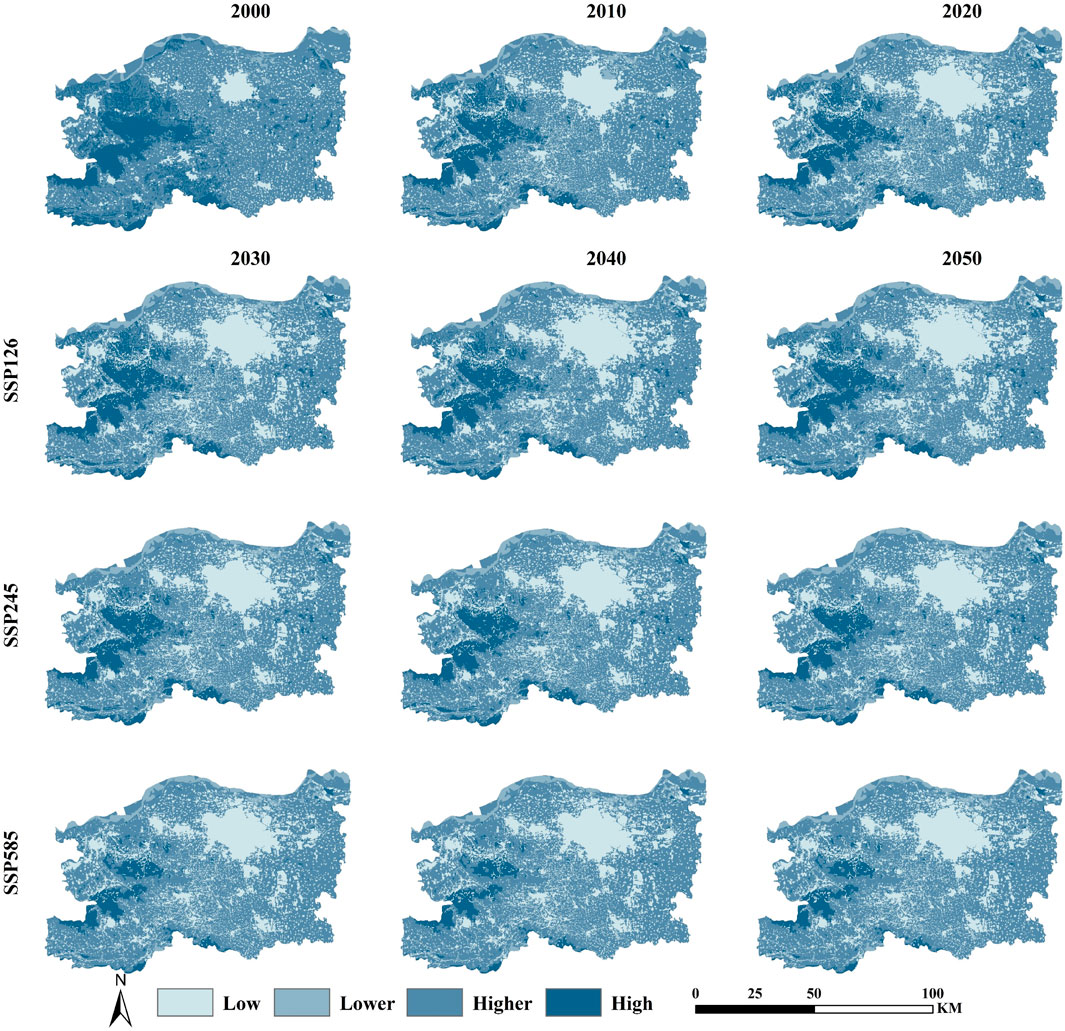
Figure 7. Ecosystem carbon storage distribution in Zhengzhou under multiple scenarios from 2000 to 2050.
From the quantitative point of view, the ecosystem carbon storage in Zhengzhou has decreased by a total of 1.0092 × 10⁷t between 2000 and 2020, and the ecosystem carbon storage in 2020 is 6.0131 × 10⁷t (Figure 8). Under all three scenarios, the ecosystem carbon storage in Zhengzhou in 2050 shows different degrees of decline. Among them, the SSP126 scenario shows the smallest decline, while the SSP585 scenario shows the largest decline, which is 5.7762 × 10⁷t and 5.3464 × 10⁷t, respectively, and decreasing by 0.2369 × 10⁷t and 0.6667 × 10⁷t each from 2020. Looking at the ecosystem carbon storage values, it can be seen that although the SSP126 scenario has the most construction land, it still results in the scenario having the largest ecosystem carbon storage of the three due to the largest increase in its woodland area.
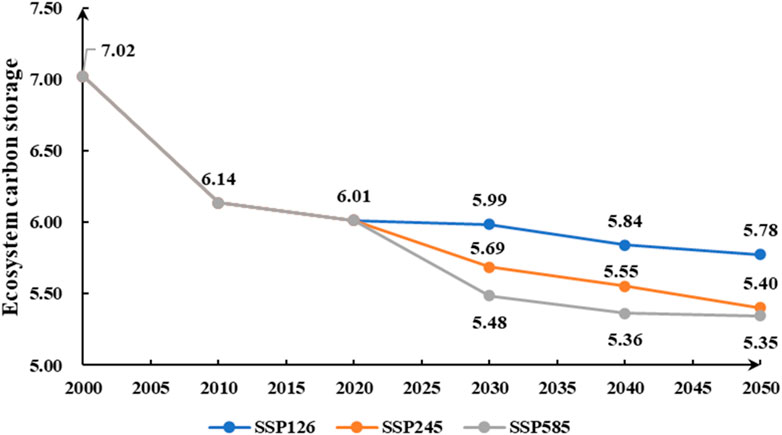
Figure 8. Ecosystem carbon storage in Zhengzhou under multiple scenarios from 2000 to 2050 (107t).
Taking 2020 as the base period and comparing the ecosystem carbon storage at different time nodes from 2030 to 2050 in each scenario relatively, the ecosystem carbon storage increases and decrease map of the research area is obtained. According to Figure 9, it can be seen that the areas of ecosystem carbon storage increase in all three scenarios are around the forest land, and the region of ecosystem carbon storage increase in the SSP126 scenario is the largest among the three. The areas with reduced ecosystem carbon storage are mainly distributed in the western central region of the research area. Due to topographical reasons, this region has a relatively lower level of development compared to the central area of Zhengzhou, and there is more encroachment on it in future development. It is mainly manifested as the erosion of arable land by construction land, and the conversion of forest land to arable land. The areas of decreasing ecosystem carbon storage in the SSP245 and SSP585 scenarios are more concentrated compared to the SSP126 scenario. The areas of increasing and decreasing ecosystem carbon storage in the SSP126 scenario are relatively evenly distributed throughout the study area.
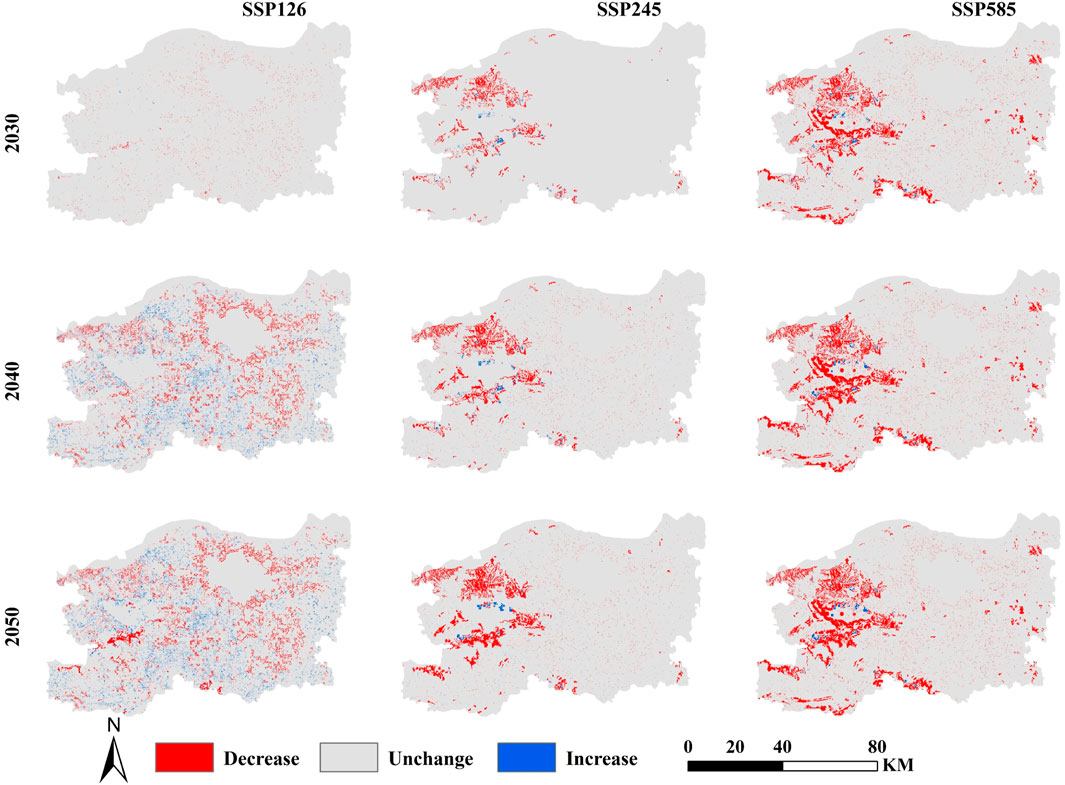
Figure 9. Changes in ecosystem carbon storage in Zhengzhou in the future compared with 2020 under different scenarios.
In order to explore the driving factors of ecosystem carbon storage changes in the region, based on the relevant studies and the actual situation in the study area. The study selected seven influence factors from both natural and social aspects, which are natural factor DEM (X3), annual average temperature (X4), annual precipitation (X5), and NDVI (X6), social factors GDP (X1), population density (X2), night lighting (X7) (Zhang et al., 2024). The ArcGIS software is used to create a fishing net, which is used to extract the influencing factor data, and discretize the data to meet the operational needs of the Geographic detector (Li P. C. et al., 2023). The results of the single-factor analysis of the geographic detector are shown below (Table 6), and the p-values of the seven driving factors are all less than 0.001, which passes the test of significance and is able to accurately explain the changes in ecosystem carbon storage in Zhengzhou City. The degree of influence of the factors on ecosystem carbon storage in the study area in descending order is annual mean temperature (X4), DEM (X3), NDVI (X6), night light (X7), GDP (X1), population density (X2), annual precipitation (X5). Among them, the explanatory power of annual average temperature (X4), DEM (X3) and NDVI (X6) are all greater than 0.2, which is the main reason for the change of ecosystem carbon storage in the study area. Night light (X7), GDP (X1), and population density (X2) have relatively low explanatory power and are minor influencing factors. It can be seen that natural factors play a dominant role in explaining the spatial and temporal distribution of ecosystem carbon storage.

Table 6. Single-factor detection.
Through the analysis of the interactive detection results, we can see that all the interactive factor detection results are double-factor enhancement or nonlinear enhancement, indicating that the distribution of carbon storage is affected by many factors (Figure 10). The interactions between dem (X3) and mean annual temperature (X4) and factors were all greater than 0.29. And the interactive explanatory power between DEM (X3) and annual precipitation (X5) is the largest, which is 0.35736, followed by dem (X3) and NDVI (X6), which is 0.34876. Changes in ecosystem carbon storage are the result of both natural and anthropogenic effects, and the interaction between various factors should be fully considered in the design and planning, taking into account both natural and anthropogenic factors in a comprehensive manner. Different targeted development plans should be formulated for regions with different natural conditions to ensure sustained and coordinated regional development.
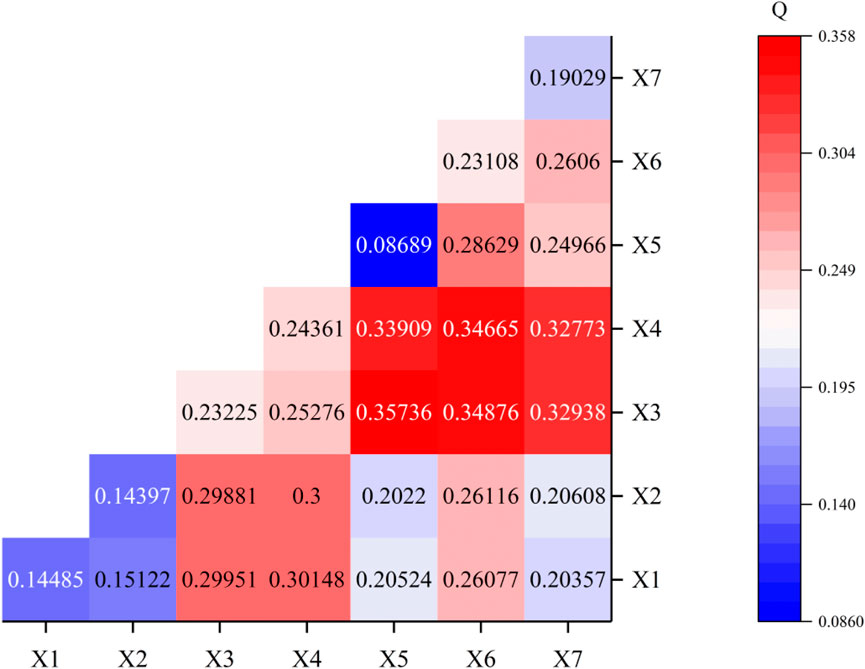
Figure 10. Interactive detection.
By mining the drivers of land use change, it was found that DEM and slope contributed the most to land use change, especially to the distribution of woodland and grassland. Higher elevations and slopes have a relatively lower intensity of human activity, and the lower the level of disturbance to woodlands and grasslands, the more favorable it is for its growth and expansion. In addition, GDP is also a major driver of changes in cropland, forest land and construction land, with the smallest area required to produce a unit of GDP being construction land, presenting the phenomenon of high GDP requiring a high level of building area, which leads to the emergence of the erosion of arable land and other areas by construction land. Population density is also a major potential driver of change in woodland, watersheds, and construction land, with higher population densities increasing demand for housing, workplaces, etc., which in turn leads to an expansion of construction land and a squeeze on woodland and other areas (Figure 11). From the perspective of land use change, from 2000 to 2020, the arable land area of Zhengzhou decreases from 5103.204 km2 to 4311.959 km2, the construction land area increases from 843.915 km2 to 2009.122 km2, and the construction land is constantly expanding outward with the built-up area as the center. Ecosystem carbon storage showed a continuous downward trend from 7.0223 × 10⁷t to 6.0131 × 10⁷t during the two decades, and the conversion of arable land with strong carbon sequestration capacity to construction land with weak carbon sequestration capacity was the main reason. The future increase of construction land area in Zhengzhou is limited and the increase rate tends to slow down, especially in the center of Zhengzhou (Cai et al., 2022b). Future urban additions are more likely to occur in the western part of Zhengzhou, derived from encroachment on arable, grassland, among others.
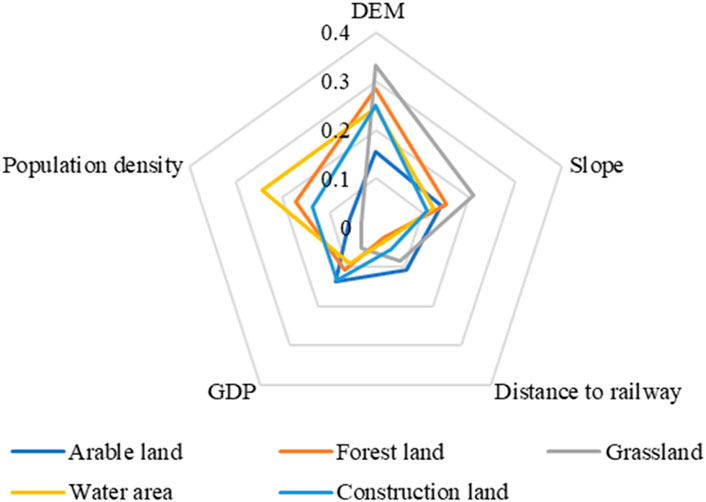
Figure 11. Main drivers of land-use change.
Comparing the ecosystem carbon storage values of Zhengzhou under the three scenarios, it can be seen that in the future, if Zhengzhou city wants to minimize the loss of ecosystem carbon storage while ensuring economic development. It should be based on the SSP126 scenario, the sustainable utilization of natural resources should be strengthened, an ecological restoration planning system should be gradually constructed, and a carbon-sequestration and sink-enhancement mechanism led by the government, with the participation of many parties and local linkages should be established, so as to mitigate and adapt to climate change. Pay attention to the protection of ecological land, wide entry and strict exit. Intensive and economical use of land, delineation of the red line of ecological protection and strict management of urban development boundaries, reduction of the negative impact of man-made activities on regional ecology, implementation of the regulation of mountainous, forested and grassland areas, and giving full play to the agglomeration effect and territorial advantages. Strictly follow the territorial spatial planning scheme, unified implementation of territorial space use control, at the same time should also pay attention to low-carbon oriented land use pattern optimization, strengthen ecological protection, and restoration to actively play the carbon sink function of ecological land (Cao and Zhang, 2025).
The land use simulation and carbon stock prediction in the study area are in agreement with the trend of Li et al. study from the perspective of Henan Province as a whole (Li et al., 2024). The evolution of land-use patterns all show the expansion of construction land and the decrease of ecological land. The regional carbon stocks are all highest in the SSP126 scenario, followed by the SSP245 scenario. Furthermore, the trend of change obtained in the study is also similar to that in the study of Shaanxi Province, which is adjacent to the study area by Cheng et al. (2024). The change trend of ecosystem carbon storage in the future obtained by the study is the same as that of Sun F. H. et al. (2023), but the value of ecosystem carbon storage has some differences. This is mainly due to differences in the methods used to determine future land-use requirements. Sun et al. set two scenarios of natural development and ecological protection, while this paper uses three different scenarios provided by CMIP6 to make predictions. In addition, it is known through the previous studies that the dead organic matter of vegetation in an area is equal to 1/10th of the aboveground carbon pool in that area (Delaney et al., 1998; Fan et al., 2023). The article integrates and complements the carbon density data, and thereby determines the carbon density data for the study area, based on the previous study (Sun Y. F. et al., 2023). These two reasons lead to discrepancy in the ecosystem carbon storage values obtained by the two studies.
The results of the geographic detector show that the average annual temperature, DEM and NDVI have significant effects on the spatial differentiation of ecosystem carbon storage in the study area, and the driving factors such as population density, GDP and NPP have certain effects on the spatial differentiation of ecosystem carbon storage. Suitable temperature is suitable for plant growth, and certain topographic relief can reduce the interference of human activities, and then form a high vegetation cover area. NDVI reflects the extent of vegetation cover. Areas with high vegetation cover (such as woodland, grassland) have better carbon sequestration capacity than other land types (such as construction land). The interaction analysis shows that natural factors and human factors interact together to enhance the influence on the spatial distribution of ecosystem carbon storage, which indicates that the spatial differentiation of ecosystem carbon storage is the product of the interaction of natural environment and human activities. Different factors have different directions of action, and the future development of Zhengzhou city will be governed differently based on the characteristics of the factors, taking into account the actual situation. While comprehensively considering the natural conditions and socio-economic development of the region in order to ensure that the selected model fits the characteristics of the region, it is highly vigilant in preventing unreasonable human interventions from synergizing with other factors and exerting excessive pressure on the regional ecosystems, so as to achieve sustainable land use and ecological conservation (Zhang et al., 2024).
Although the PLUS model used in the article is higher in simulation accuracy than previous models such as Flus model, there exist a number of parameters that need to be determined in conjunction with historical data and expert opinion. In addition, the carbon pool used in the study is supplemented and improved on the basis of previous studies, and there is no field sampling, which may have some differences between the carbon density and the actual study area. Therefore, in the subsequent study, we can try to use fuzzy logic or Bayesian method for reference to quantify the uncertainty of the model (Mutale and Qiang, 2024).
Based on the land use data of the third period from 2000 to 2020, the change trend is extracted, and combined with the CMIP6 data, the land demand and ecosystem carbon storage of Zhengzhou in 2030–2050 are predicted, and the following results are obtained.
(1) Arable land is the main type of land in Zhengzhou from 2000 to 2020. In the past 20 years, the conversion of land use has mainly manifested as the conversion of Arable land into construction land, and the area reached 1165.298 km2. The area of construction land has increased rapidly, and the distribution of the built-up area has changed from a single center with multiple scattered dots to a single center with a radial spider-web-like distribution.
(2) Under the three scenarios in 2050, the SSP126 scenario has the smallest cultivated land area, which is also the only one of the three scenarios with a decline. But the area of woodland, grassland and construction land under this scenario is the largest among the three. The area changes of each land use type under the two scenarios of SSP245 and SSP585 are relatively consistent, but the increase of arable land area is smaller and the increase of construction land is larger in the latter.
(3) The area with high ecosystem carbon storage value is mainly distributed in the west of the study area, that is, the forest area in the west of Zhengzhou. The regional ecosystem carbon storage value of SSP126 scenario in 2050 is the highest, at 5.7762 × 10⁷t. Both forested and construction land areas have shown an increase over the 30-year period, ensuring development while minimizing the loss of ecosystem carbon storage. The ecosystem carbon storage value of SSP585 scenario decreased the most, and the final ecosystem carbon storage value is 5.3464 × 10⁷t.
(4) The spatio-temporal differentiation of ecosystem carbon storage in Zhengzhou City is the result of multiple factors of nature and society. Elevation, mean annual temperature and NDVI are the main influencing factors, among which the mean annual temperature has the strongest explanatory power of 0.243612.
The raw data supporting the conclusions of this article will be made available by the authors, without undue reservation.
LL: Writing–original draft, Writing–review and editing. FL: Writing–original draft. QL: Writing–review and editing. GJ: Writing–review and editing. YG: Writing–review and editing. ML: Writing–original draft. GL: Writing–original draft, Writing–review and editing. WC: Writing–review and editing.
The author(s) declare that financial support was received for the research and/or publication of this article. This research was funded by the National Key R&D Program of China (2021YFD1700900) and Henan Province Natural Science Foundation (252300420849).
The authors declare that the research was conducted in the absence of any commercial or financial relationships that could be construed as a potential conflict of interest.
The authors declare that no Generative AI was used in the creation of this manuscript.
All claims expressed in this article are solely those of the authors and do not necessarily represent those of their affiliated organizations, or those of the publisher, the editors and the reviewers. Any product that may be evaluated in this article, or claim that may be made by its manufacturer, is not guaranteed or endorsed by the publisher.
Adesete, A. A., Olanubi, O. E., and Dauda, R. O. (2023). Climate change and food security in selected Sub-Saharan African Countries. Environ. Dev. Sustain 25, 14623–14641. doi:10.1007/s10668-022-02681-0
Cai, E. X., Bi, Q. S., Lu, J., and Hou, H. P. (2022b). The spatiotemporal characteristics and rationality of emerging megacity urban expansion: a case study of Zhengzhou in Central China. Front. Environ. Sci. 10, 860814. doi:10.3389/fenvs.2022.860814
Cai, E. X., Kou, Z. W., Meng, K., Zhang, Y., and Hou, H. P. (2022a). Spatio-temporal characteristics of urban expansion in Zhengzhou from 1990 to 2020. J. Henan Agric. Univ. 56 (04), 674–684. doi:10.16445/j.cnki.1000-2340.20220706.001
Cao, Z. J., and Zhang, Y. L. (2025). Spatiotemporal evolution of land use and carbon storage in Henan province based on InVEST-PLUS model. Environ. Sci., 1–21. doi:10.13227/j.hjkx.202410091
Cheng, M. Y., Ji, G. X., Huang, J. C., Geng, J. X., Li, L., and Lu, J. (2024). Multi-scenario land cover simulation and carbon stock assessment in Shaanxi province based on the PLUS-InVEST model. Environ. Sci., 1–17. doi:10.13227/j.hjkx.202409068
Delaney, M., Brown, S., Lugo, A. E., Torres-Lezama, A., and Quintero, N. B. (1998). The quantity and turnover of dead wood in permanent forest plots in six life zones of Venezuela. Biotropica 30 (1), 2–11. doi:10.1111/j.1744-7429.1998.tb00364.x
Du, S., Zhou, Z., Huang, D., Zhang, F., Deng, F., and Yang, Y. (2023). The response of carbon stocks to land use/cover change and a vulnerability multi-scenario analysis of the karst region in Southern China based on PLUS-InVEST. Forests 14 (12), 2307. doi:10.3390/f14122307
Fan, L. Y., Cai, T. Y., Wen, Q., Han, J., Wang, S. X., Wang, J. H., et al. (2023). Scenario simulation of land use change and carbon storage response in Henan Province, China: 1990–2050. Ecol. Indic. 154, 110660. doi:10.1016/j.ecolind.2023.110660
Fang, J. Y., and Wang, Z. (2001). Forest biomass estimation at regional and global levels, with special reference to China’s forest biomass. Ecol. Res. 16, 587–592. doi:10.1046/j.1440-1703.2001.00419.x
Huang, T., and Liu, S. H. (2024). Evaluation of land use change and carbon storage in Fujian province based on PLUS-InVEST model. J. Soil Water Conservation 38 (02), 246–257. doi:10.13870/j.cnki.stbcxb.2024.02.013
Hurtt, G. C., Chini, L., Sahajpal, R., Frolking, S., Bodirsky, B. L., Calvin, K., et al. (2020a). Harmonization of global land use change and management for the period 850–2100 (LUH2) for CMIP6. Geosci. Model Dev. 13, 5425–5464. doi:10.5194/gmd-13-5425-2020
Hurtt, G. C., Chini, L., Sahajpal, R., Frolking, S., Bodirsky, B. L., Calvin, K., et al. (2020b). Harmonization of global land use change and management for the period 850–2100 (LUH2) for CMIP6. Geosci. Model Dev. 13, 5425–5464. doi:10.5194/gmd-13-5425-2020
Ji, X. L., Sun, Y. L., Guo, W., Zhao, C. W., and Li, K. (2023). Land use and habitat quality change in the Yellow River Basin: a perspective with different CMIP6-based scenarios and multiple scales. J. Environ. Manag. 345, 118729. doi:10.1016/j.jenvman.2023.118729
Jia, X. L., Zhu, J. Y., Li, Y. Y., Wu, W. B., and Hu, X. Y. (2023). Analysis of the driving role and impact of road construction on carbon stock. Environ. Sci. Pollut. Res. 30, 67131–67149. doi:10.1007/s11356-023-27198-5
Jiang, T., Wang, Y. J., Su, B. D., Zhai, J. Q., Tao, H., Jing, C., et al. (2020). Perspectives of human activities in global climate change: evolution of socio-economic scenarios. J. Nanjing Univ. Inf. Sci. Technol. 12 (01), 68–80. doi:10.13878/j.cnki.jnuist.2020.01.009
Li, C., Yang, M., Li, Z., and Wang, B. (2021). How will Rwandan land use/land cover change under high population pressure and changing climate? Appl. Sci. 11 (12), 5376. doi:10.3390/app11125376
Li, L., Fu, W., and Luo, M. (2022a). Spatial and temporal variation and prediction of ecosystem carbon stocks in Yunnan province based on land use change. Int. J. Environ. Res. Public Health 19 (23), 16059. doi:10.3390/ijerph192316059
Li, L., Ji, G. X., Li, Q. S., Zhang, J. C., Gao, H. S., Jia, M. Y., et al. (2023c). Spatiotemporal evolution and prediction of ecosystem carbon storage in the yiluo River Basin based on the PLUS-InVEST model. Forests 14 (12), 2442. doi:10.3390/f14122442
Li, M., Zhang, J. C., Gao, H. S., Ji, G. X., Li, G. M., Li, L., et al. (2024). Spatiotemporal variation characteristics of ecosystem carbon storage in Henan province and future multi-scenario simulation prediction. Land 13 (2), 185. doi:10.3390/land13020185
Li, P. C., Chen, J. D., Li, Y. X., and Wu, W. (2023b). Using the InVEST-PLUS model to predict and analyze the pattern of ecosystem carbon storage in Liaoning province, China. Remote Sens. 15 (16), 4050. doi:10.3390/rs15164050
Li, Q., Pu, Y., and Gao, W. (2023a). Spatial correlation analysis and prediction of carbon stock of “Production-living-ecological spaces” in the three northeastern provinces, China. Heliyon 9 (8), e18923. doi:10.1016/j.heliyon.2023.e18923
Li, X., Fu, J. Y., Jiang, D., Lin, G., and Cao, C. L. (2022b). Land use optimization in Ningbo City with a coupled GA and PLUS model. J. Clean. Prod. 375, 134004. doi:10.1016/j.jclepro.2022.134004
Liang, X., Guan, Q. F., Clarke, K. C., Liu, S. S., Wang, B. Y., and Yao, Y. (2021). Understanding the drivers of sustainable land expansion using a patch-generating land use simulation (PLUS) model: a case study in Wuhan, China. Comput. Environ. Urban Syst. 85, 101569. doi:10.1016/j.compenvurbsys.2020.101569
Lin, Z. Q., and Peng, S. Y. (2022). Comparison of multimodel simulations of land use and land cover change considering integrated constraints - a case study of the Fuxian Lake basin. Ecol. Indic. 142, 109254. doi:10.1016/j.ecolind.2022.109254
Liu, J. C., Liu, B. Y., Wu, L. J., Miao, H. Y., Jiang, K., Bing, H., et al. (2024). Prediction of land use for the next 30 years using the PLUS model's multi-scenario simulation in Guizhou Province, China. Sci. Rep. 14, 13143. doi:10.1038/s41598-024-64014-7
Liu, L. F., Zhang, C. C., Luo, W., Chen, S. D., Yang, F., and Liu, J. S. (2022). New remote sensing image fusion for exploring spatiotemporal evolution of urban land use and land cover. J. Appl. Remote Sens. 16 (3), 034527. doi:10.1117/1.jrs.16.034527
Liu, P. J., Hu, C. P., and Jia, W. T. (2021). Land use optimization research based on FLUS model and ecosystem services–setting Jinan City as an example. Urban Clim. 40, 100984. doi:10.1016/j.uclim.2021.100984
Liu, X. J., Li, X., Liang, X., Shi, H., and Ou, J. P. (2019). Simulating the change of terrestrial carbon storage in China based on the FLUS-InVEST model. Trop. Geogr. 39 (3), 397–409. doi:10.13284/j.cnki.rddl.003138
Luo, S. Q., Hu, X. M., Sun, Y., Yan, C., and Zhang, X. (2023). Multi-scenario land use change and its impact on carbon storage based on coupled Plus-Invest model. Chin. J. Eco-Agriculture 31 (2), 300–314. doi:10.12357/cjea.20220520
Marey, A., Wang, L., Goubran, S., Gaur, A., Lu, H., Leroyer, S., et al. (2024). Forecasting urban land use dynamics through patch-generating land use simulation and Markov chain integration: a multi-scenario predictive framework. Sustainability 16 (23), 10255. doi:10.3390/su162310255
Mutale, B., and Qiang, F. (2024). Modeling future land use and land cover under different scenarios using patch-generating land use simulation model. A case study of Ndola district. Front. Environ. Sci. 12, 1362666. doi:10.3389/fenvs.2024.1362666
Newman, R., and Noy, I. (2023). The global costs of extreme weather that are attributable to climate change. Nat. Commun. 14, 6103. doi:10.1038/s41467-023-41888-1
Nie, W. B., Xu, B., Yang, F., Shi, Y., Liu, B. T., Wu, R. W., et al. (2023). Simulating future land use by coupling ecological security patterns and multiple scenarios. Sci. Total Environ. 859, 160262. doi:10.1016/j.scitotenv.2022.160262
O’Neill, B. C., Kriegler, E., Riahi, K., Ebi, K. L., Hallegatte, S., Carter, T. R., et al. (2014). A new scenario framework for climate change research: the concept of shared socioeconomic pathways. Clim. Change 122, 387–400. doi:10.1007/s10584-013-0905-2
Peng, S. Z., Ding, Y. X., Liu, W. Z., and Li, Z. (2019). 1 km monthly temperature and precipitation dataset for China from 1901 to 2017. Earth Syst. Sci. Data 11, 1931–1946. doi:10.5194/essd-11-1931-2019
Qi, J. H., Wang, Z., Cressey, E. L., Liang, B. Y., and Wang, J. (2024). Considering the joint impact of carbon density change and land use change is crucial to improving ecosystem carbon stock assessment in North China. Forests 15 (1), 55. doi:10.3390/f15010055
Sun, F. H., Fang, F. M., Hong, W. L., Luo, H., Yu, J., Fang, L., et al. (2023a). Evolution analysis and prediction of carbon storage in Anhui province based on PLUS and InVEST model. J. Soil Water Conservation 37 (01), 151–158. doi:10.13870/j.cnki.stbcxb.2023.01.021
Sun, X. X., Wang, S. G., Xue, J. H., and Dong, L. N. (2023c). Assessment and simulation of ecosystem carbon storage in rapidly urbanizing areas based on land use cover: a case study of the southern Jiangsu urban agglomeration, China. Front. Ecol. Evol. 11, 1197548. doi:10.3389/fevo.2023.1197548
Sun, Y. F., Xu, M. F., and Wang, X. (2023b). Spatial-temporal evolution of carbon storage and spatial autocorrelation analysis in Zhengzhou city based on InVEST-PLUS model. Bull. Soil Water Conservation 43 (05), 374–384. doi:10.13961/j.cnki.stbctb.2023.05.043
Tariq, A., Yan, J. G., and Mumtaz, F. (2022). Land change modeler and CA-Markov chain analysis for land use land cover change using satellite data of Peshawar, Pakistan. Phys. Chem. Earth, Parts A/B/C 128, 103286. doi:10.1016/j.pce.2022.103286
Wang, H., Wan, Q. N., Huang, W., and Niu, J. Q. (2023c). Spatial heterogeneity characteristics and driving mechanism of land use change in Henan Province, China. Geocarto Int. 38 (1). doi:10.1080/10106049.2023.2271442
Wang, R. Y., Cai, H. N., Chen, L. K., and Li, T. H. (2023a). Spatiotemporal evolution and multi-scenario prediction of carbon storage in the GBA based on PLUS–InVEST models. Sustainability 15 (10), 8421. doi:10.3390/su15108421
Wang, Y. L., Liang, D. D., Wang, J., Zhang, Y. J., Chen, F., and Ma, X. Y. (2023b). An analysis of regional carbon stock response under land use structure change and multi-scenario prediction, a case study of Hefei, China. Ecol. Indic. 151, 110293. doi:10.1016/j.ecolind.2023.110293
Wang, Z., Zeng, J., and Chen, W. (2022). Impact of urban expansion on carbon storage under multi-scenario simulations in Wuhan, China. Environ. Sci. Pollut. Res. 29, 45507–45526. doi:10.1007/s11356-022-19146-6
Wei, X. D., Zhang, S. Y., Luo, P. P., Zhang, S. M., Wang, H. Y., Kong, D., et al. (2023). A multi-scenario prediction and spatiotemporal analysis of the land use and carbon storage response in Shaanxi. Remote Sens. 15 (20), 5036. doi:10.3390/rs15205036
Wen, R., Gao, Y. Y., Wu, Z. H., and Qian, H. (2024). Effects of land use change on the temporal and spatial pattern of carbon storage in Guanzhong Plain urban agglomeration. Chin. J. Eco-Agriculture 32 (04), 592–604. doi:10.12357/cjea.20230508
Wu, J. Y., Luo, J. G., Zhang, H., Qin, S., and Yu, M. J. (2022). Projections of land use change and habitat quality assessment by coupling climate change and development patterns. Sci. Total Environ. 847, 157491. doi:10.1016/j.scitotenv.2022.157491
Xiao, J. Y., Dai, J. J., Fang, X. R., Li, L., and Chen, L. G. (2024). Multiple scenario simulation of ecosystem service value in Xuzhou city based on PLUS model. China Land Sci. 38 (04), 125–134. doi:10.11994/zgtdkx.20240320.171338
Xu, L., He, N. P., and Yu, G. R. (2019). A dataset of carbon density in Chinese terrestrial ecosystems (2010s). China Sci. Data 4 (1), 86–92. doi:10.11922/csdata.2018.0026.zh
Yue, S. J., Ji, G. X., Chen, W. Q., Huang, J. C., Guo, Y. L., and Cheng, M. Y. (2023). Spatial and temporal variability characteristics of future carbon stocks in Anhui province under different SSP scenarios based on PLUS and InVEST models. Land 12 (9), 1668. doi:10.3390/land12091668
Zhang, F., Zhan, J., Zhang, Q., Yao, L., and Liu, W. (2017). Impacts of land use/cover change on terrestrial carbon stocks in Uganda. Phys. Chem. Earth, Parts A/B/C 101, 195–203. doi:10.1016/j.pce.2017.03.005
Zhang, R., and Lu, J. (2021). Simulation of land use pattern evolution from a multi-scenario perspective: a case study of Suzhou city in Anhui province, China. Int. J. Environ. Res. Public Health 18 (3), 921. doi:10.3390/ijerph18030921
Zhang, Z., Liu, J. J., Zhang, Q., Chen, C., and Yang, Z. H. (2024). Analysis of spatial-temporal variation and driving forces of carbon storage in Suzhou city based on the PLUS-InVEST-geodector model. Environ. Sci., 1–17. doi:10.13227/j.hjkx.202405077
Zhao, X., and Miao, C. (2022). Spatial-temporal changes and simulation of land use in metropolitan areas: a case of the Zhengzhou metropolitan area, China. Int. J. Environ. Res. Public Health 19 (21), 14089. doi:10.3390/ijerph192114089
Zheng, F., and Hu, Y. (2018). Assessing temporal-spatial land use simulation effects with CLUE-S and Markov-CA models in Beijing. Environ. Sci. Pollut. Res. 25, 32231–32245. doi:10.1007/s11356-018-3189-2
Zheng, H. L., and Zheng, H. F. (2023). Assessment and prediction of carbon storage based on land use/land cover dynamics in the coastal area of Shandong Province. Ecol. Indic. 153, 110474. doi:10.1016/j.ecolind.2023.110474
Zheng, L. S., Li, Y. B., Chen, Y., Wang, R., Yan, S. J., Xia, C. H., et al. (2024). Driving model of land use change on the evolution of carbon stock: a case study of Chongqing, China. Environ. Sci. Pollut. Res. 31, 4238–4255. doi:10.1007/s11356-023-31335-5
Keywords: ecosystem carbon storage, CMIP6, Zhengzhou, plus model, InVEST model
Citation: Li L, Li F, Li Q, Ji G, Guo Y, Li M, Li G and Chen W (2025) Spatiotemporal variation characteristics of ecosystem carbon storage in Zhengzhou and future multi-scenario simulation prediction. Front. Environ. Sci. 13:1511629. doi: 10.3389/fenvs.2025.1511629
Received: 21 October 2024; Accepted: 17 March 2025;
Published: 01 April 2025.
Edited by:
Dafeng Hui, Tennessee State University, United StatesReviewed by:
Voltaire Alvarado Peterson, University of Concepcion, ChileCopyright © 2025 Li, Li, Li, Ji, Guo, Li, Li and Chen. This is an open-access article distributed under the terms of the Creative Commons Attribution License (CC BY). The use, distribution or reproduction in other forums is permitted, provided the original author(s) and the copyright owner(s) are credited and that the original publication in this journal is cited, in accordance with accepted academic practice. No use, distribution or reproduction is permitted which does not comply with these terms.
*Correspondence: Genming Li, MTg5MTk4MzM5MTZAMTYzLmNvbQ==; Weiqiang Chen, Y2h3cWdpc0AxNjMuY29t
Disclaimer: All claims expressed in this article are solely those of the authors and do not necessarily represent those of their affiliated organizations, or those of the publisher, the editors and the reviewers. Any product that may be evaluated in this article or claim that may be made by its manufacturer is not guaranteed or endorsed by the publisher.
Research integrity at Frontiers
Learn more about the work of our research integrity team to safeguard the quality of each article we publish.