 Zhiyuan Xu
 Fuyan Ke*
94% of researchers rate our articles as excellent or good
Learn more about the work of our research integrity team to safeguard the quality of each article we publish.
Find out more
ORIGINAL RESEARCH article
Front. Environ. Sci., 24 March 2025
Sec. Land Use Dynamics
Volume 13 - 2025 | https://doi.org/10.3389/fenvs.2025.1495778
Production-living-ecological function (PLEF) represent the core dimensions of rural systems. However, systematic studies on PLEF in mountainous counties along China’s southeastern coast remain insufficient. Additionally, the dominant factors influencing rural functional evolution require deeper investigation, as these insights are crucial for regional sustainable development. This study focuses on mountainous rural areas in Zhejiang Province, a leading region in China’s rural revitalization. A PLEF evaluation index system was established. Using comprehensive evaluation methods, exploratory spatial data analysis (ESDA), and geographical detector (GeoDetector) models, we measured the PLEF development index of mountainous counties in Zhejiang Province from 2005 to 2020. Spatio-temporal evolution and spatial autocorrelation analyses were conducted, followed by identification of influencing factors. The results show that: (1) The average PLEF development index increased from 0.88 in 2005 to 1.56 in 2020, with growth contributions ranked as: living function (LF) > ecological function (EF) > production function (PF); (2) The developmental stages of PF, LF and EF transitioned from a “low-low-medium” pattern to a “medium-medium-high” configuration; (3) PLEF exhibited spatial agglomeration characteristics; however, the spatial agglomeration weakened and spatial dependency decreased during the study period; (4) Dominant factors shifted across subsystems: PF transitioned from agricultural production functions to non-agricultural production functions; LF shifted from life support functions to social welfare functions; EF remained primarily driven by ecological provisioning functions. These findings offer theoretical foundations for coordinating rural PLEF development and enhancing sustainability.
Achieving human development and wellbeing while preserving ecological environments constitutes one of the most pressing global challenges and represents a core objective of the United Nations Sustainable Development Goals (SDGs) (Wood et al., 2018; Xu et al., 2020). The spatial patterns of PLEF based on rural functions are linked to 16 SDGs (Song et al., 2024), with SDG2 (Zero Hunger) and SDG15 (Life on Land) directly addressing agricultural production and ecological conservation. While improvements in global agricultural productivity have advanced poverty alleviation, malnutrition reduction, and human rights protection, they have concurrently caused ecological degradation and uneven rural development (Fanzo et al., 2021; Tudi et al., 2021). Rural areas not only serve as hubs for agricultural production but also require multifunctional roles encompassing economic, ecological, and cultural dimensions (Holmes, 2006; Wilson, 2008). To enhance rural economic resilience and ecological value, agricultural objectives must integrate sustainability principles, emphasizing coordinated functional development to address practical challenges (Hunter et al., 2017).
China is undergoing a critical phase of urbanization. On one hand, urban expansion has accelerated rural transformation and restructuring, partially constraining production spaces, fragmenting living spaces, and disrupting ecological balances (Cheng, 2021; Duan et al., 2021). On the other hand, the influx of technological, informational, and digital resources into rural areas has intensified challenges in resource utilization and allocation (Ma, 2023). Against this backdrop, the coordination of PLEF has emerged as a central priority for China’s ecological civilization and sustainable development strategies (Yang et al., 2020). Since 2012, China has advocated for “intensive and efficient production spaces, livable and moderate living spaces, and pristine ecological spaces,” marking a policy shift from production-centric approaches to PLEF coordination (Zhu and Qin, 2012). This transition has spurred extensive research on territorial spatial planning (Liao et al., 2022; Tian et al., 2020). In rural development, initiatives such as the New Rural Construction, New Urbanization, Beautiful Countryside, and Rural Revitalization strategies aim to enhance multifunctionality and drive rural transformation (Li et al., 2018; Long et al., 2011; Long et al., 2019). Nevertheless, persistent imbalances and inadequacies in rural PLEF development remain critical challenges requiring urgent resolution (Tu and Long, 2017). Consequently, understanding the evolutionary processes, interactions, and driving factors of rural PLEF is essential for evaluating the coordination and adaptability of China’s rural development under rapid urbanization.
PF, LF, and EF are recognized as the core dimensions of rural systems (Zhou et al., 2024). PLEF research primarily encompasses functional evaluation, spatiotemporal evolution, and dynamic mechanisms (Holmes, 2006; Long et al., 2019; Qu et al., 2017; Liu et al., 2023; Zhao and Zhao, 2023; Zhou et al., 2024). The evaluation of PLEF serves as the foundation for rural functional studies, with existing methodologies predominantly relying on land use classification and index system construction (Li H. et al., 2024; Yu et al., 2024). While land use-based approaches enable fine-scale PLEF identification, they often inadequately address functional complexity and spatial heterogeneity (Ji et al., 2020; Wang J. et al., 2023; Xia et al., 2023). Alternatively, index system methods comprehensively assess PLEF across production, living, and ecological dimensions, utilizing techniques such as entropy weighting and coupling coordination models. Though these methods demonstrate strong specificity and integration, significant variability persists in indicator selection (Yang DR. et al., 2024). Current evaluation frameworks predominantly employ statistical indicators, with limited integration of spatial data, land use data, and multi-source datasets.
Investigating spatio-temporal changes in regional PLEF constitutes a fundamental research task. Established analytical methods include gravity center models (Li XM. et al., 2024), land use transition matrices (Huang JT. et al., 2024), spatial autocorrelation analysis (Aruhan and Liu, 2024), kernel density estimation (Wang X. et al., 2024), standard deviational ellipse (Ke et al., 2025), landscape indices (Gong et al., 2024). While extensive research has focused on urban and territorial spaces, recent studies have expanded to rural and ecologically fragile areas (Ke et al., 2025; Li et al., 2022). Findings reveal significant transformations in China’s rural industrial structures, living services, and ecological environments, accompanied by increasingly pronounced spatial differentiation of PLEF (Liu et al., 2023; Wang J. et al., 2016; Zhou et al., 2020). Temporally, studies predominantly analyze PLEF characteristics during rapid rural transitions (2000–2010), while spatially, investigations span global, national, regional, urban agglomeration, watershed, municipal, and county scales (Li Y. et al., 2024; Ren et al., 2024; Fu et al., 2023). Geographically, research has addressed PLEF in plains, coastal zones, and arid northwestern regions (Wubuli et al., 2024; Yang L. et al., 2024), yet mountainous counties along China’s southeastern coast remain understudied.
The analysis of factors influencing PLEF spatial heterogeneity contributes to functional optimization. Researchers have applied correlation analysis, principal component analysis, grey relational analysis, GeoDetector, and random forest methods to investigate the impacts of natural environments, economic development, socio-cultural factors, policy systems, and technological progress on PLEF (Zhang et al., 2023; Zhang et al., 2022; Huang Y. et al., 2024). Specifically, rural PF is primarily influenced by natural conditions, agricultural productivity, and output value; LF by infrastructure, public services, and income levels; and EF by land use structure, global change, and pollution control (Zhou et al., 2024). However, the interactions among these influencing factors remain insufficiently explored.
Mountainous counties experience intensified PLEF conflicts due to complex terrain and limited development space (Zhu et al., 2024), rendering their PLEF coordination critical for regional sustainable development. China’s Rural Revitalization Strategy has prioritized mountainous areas, with Zhejiang Province implementing progressive policies. In 2015, Zhejiang replaced GDP-based evaluations for mountainous counties with ecological protection and income growth metrics, initiating programs such as the Mountain-Coastal Collaboration Project, the Poverty Alleviation Campaign for Underdeveloped Townships, and the Special Support Policy for Key Underdeveloped Counties. The province further classifies mountainous counties into two categories: 15 designated for leapfrog development and 11 for ecological conservation. Nevertheless, systematic investigations into PLEF patterns and mechanisms in Zhejiang’s mountainous counties remain lacking.
In summary, current PLEF studies exhibit three limitations: insufficient integration of multi-source data in evaluation systems, inadequate mechanistic analysis of spatio-temporal heterogeneity in southeastern coastal China, and limited exploration of factor interactions. This study addresses these gaps by constructing a county-level PLEF evaluation framework for Zhejiang’s mountainous counties. Through spatial autocorrelation analysis and driving factor identification, the findings provide theoretical and empirical support for optimizing rural PLEF coordination and promoting regional sustainable development.
Zhejiang Province is located in the southern Yangtze River Delta along China’s southeastern coast, spanning 27°02′N to 31°11′N latitude and 118°01′E to 123°10′E longitude (Figure 1). Bordered by the East China Sea to the east, it adjoins Shanghai and Jiangsu Province to the north, Anhui and Jiangxi Provinces to the west, and Fujian Province to the south, with a total area of 105,500 km2. As of 2024, the province governs 11 prefecture-level cities and 90 county-level administrative units (including municipal districts and county-level cities), achieving an urbanization rate of 75.5%.
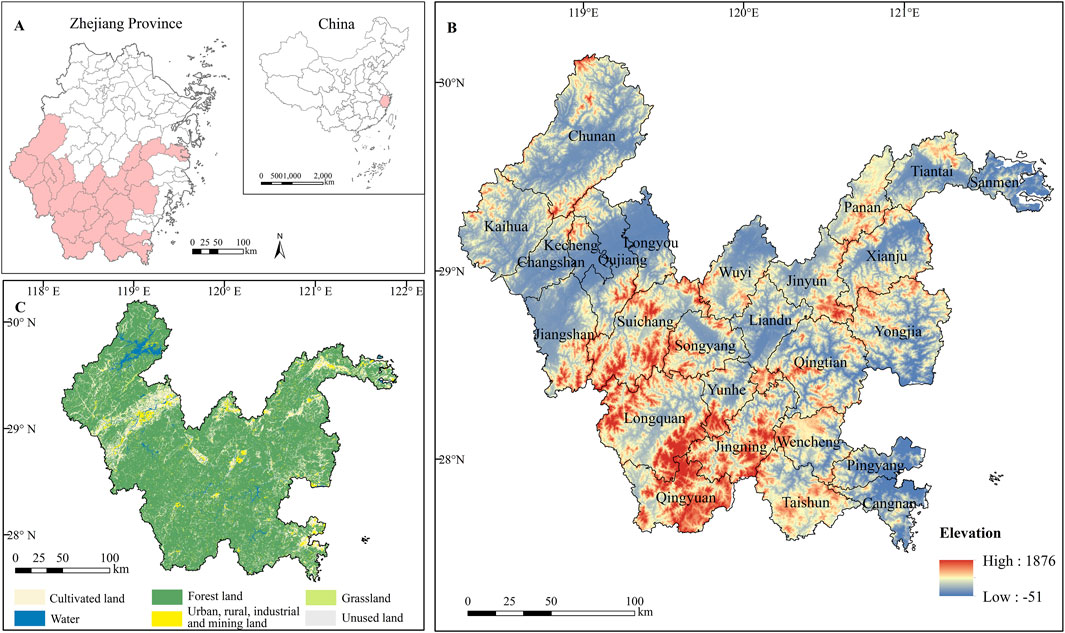
Figure 1. Study area. (A) Location. (B) Elevation of mountainous counties. (C) Land use. Note: The map is based on the standard map of China No. GS (2019)1822 downloaded from the standard map service website of the National Administration of Surveying, Mapping and Geographic Information of China. The base map has not been modified.
Ranked fourth in China by GDP, Zhejiang represents a highly developed provincial economy with robust county-level development, hosting 17 counties listed among China’s Top 100 Counties. It maintains one of the nation’s lowest urban-rural income disparities, recording a ratio of 1.83 in 2024. The province encompasses 26 mountainous counties, including Chunan, Yongjia, Pingyang, Cangnan, Wencheng, Taishun, Wuyi, Panan, Kecheng, Qujiang, Changshan, Kaihua, Longyou, Jiangshan, Sanmen, Tiantai, Xianju, Liandu, Qingtian, Jinyun, Suichang, Songyang, Yunhe, Qingyuan, Jingning, and Longquan. Primarily situated in southwestern Zhejiang’s hilly and mountainous terrain, these counties exhibit comparatively lower socio-economic development levels than non-mountainous regions, serving as focal areas for Zhejiang’s high-quality development and the construction of a common prosperity demonstration zone. Mountainous counties occupy approximately 45% of the province’s land area and account for nearly 24% of its population.
Land use data for Zhejiang Province (2005, 2010, 2015, 2020) with a spatial resolution of 30 m were obtained from the Institute of Geographic Sciences and Natural Resources Research, Chinese Academy of Sciences, demonstrating over 93% accuracy in primary land use classification (Ning et al., 2018). Surface PM2.5 concentration data were sourced from Washington University in St. Louis, featuring a spatial resolution of 0.01° × 0.01 ° (Shen et al., 2024). The NDVI dataset was acquired from the PKU GIMMS NDVI database (spatial resolution: 1/12° × 1/12°; temporal resolution: biweekly; temporal coverage: 1982–2022) (Li et al., 2023). County-level socioeconomic statistics were compiled from provincial statistical yearbooks (Zhejiang Statistical Yearbook), national statistical compilations (China Civil Affairs Statistical Yearbook, China Statistical Yearbook for Regional Economy), municipal yearbooks, and county-level statistical bulletins on national economic and social development. Administrative boundary data were provided by the National Geomatics Center of China (Table 1).
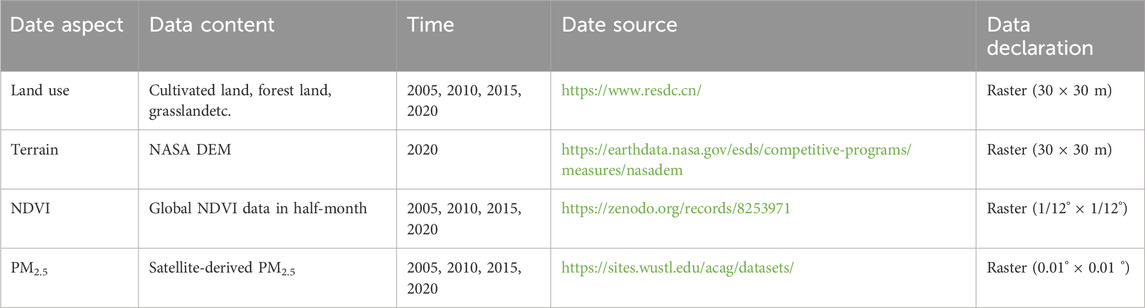
Table 1. Data sources in this study.
Rural systems, as multidimensional complexes, can be categorized into production, living, and ecological spaces, forming the PLEF dominated by PF, LF, and EF (Lu et al., 2024). PF serves as the foundation of rural PLEF. Its scope extends beyond agricultural output to encompass diverse agricultural, industrial, and service activities contributing to local economies and community wellbeing (Achu et al., 2021), specifically comprising agricultural production functions and non-agricultural production functions. Agricultural production functions focus on agricultural product supply capacity, including fundamental capacities like cropland utilization and food security, as well as enhanced capacities through technological advancements such as agricultural efficiency improvements and mechanization. Non-agricultural production functions reflect rural areas’ wealth-generation capabilities beyond agriculture, primarily through supporting service economies and secondary/tertiary industries like rural tourism and handicrafts. LF quantifies rural residents’ living standards through socio-cultural and economic dimensions. It encompasses basic service provision, housing, and infrastructure supporting daily life, along with social welfare systems and safety net implementation (Qin et al., 2024). EF is crucial for maintaining environmental security and sustaining human livelihoods. It involves ecosystem service provision—clean water, air, soil, and biodiversity conservation—enhancing rural climate change resilience and disaster mitigation. Integrating ecological considerations into agricultural practices facilitates production-ecology balance.
PLEF components exhibit mutually reinforcing yet constraining relationships through complex feedback loops. PF provides material foundations for LF while generating ecological negative externalities. LF influences agricultural production patterns and consumes ecological resources. EF underpins agricultural sustainability and community viability. Synergistically, coordinated PLEF development enhances holistic rural sustainability and promotes high-quality development. Thus, rural PLEF emphasizes coordinated symbiosis among functional spaces, advocating scientific development paradigms over environmentally detrimental models. Its objectives include efficient resource utilization, improved resident wellbeing, and ecological conservation through functional harmonization (Figure 2).
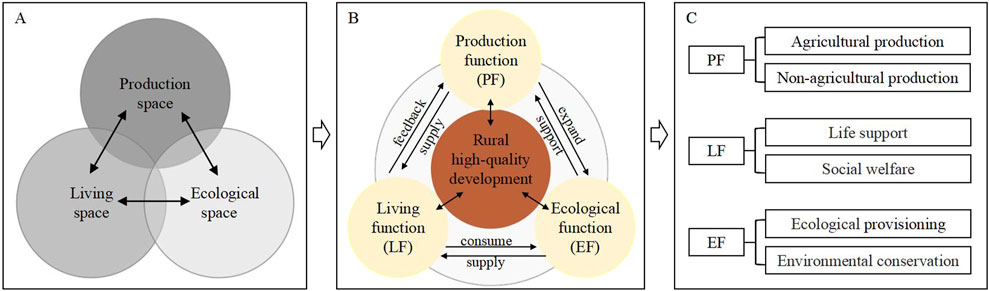
Figure 2. The interaction of rural PLEF. A rural PLE space. (A) Rural production-living-ecological space. (B) Rural PLEF. (C) Rural PLEF subsystem.
The conceptual framework of this study is illustrated in Figure 3. First, the research area was delineated, and multi-source data were collected and preprocessed. Subsequently, a rural PLEF evaluation index system was constructed, with weights determined using a comprehensive evaluation method. This was followed by an analysis of spatial evolution characteristics and spatial autocorrelation patterns of rural PLEF from 2005 to 2020. Finally, the influencing factors of each functional dimension and their interactive effects were systematically investigated.
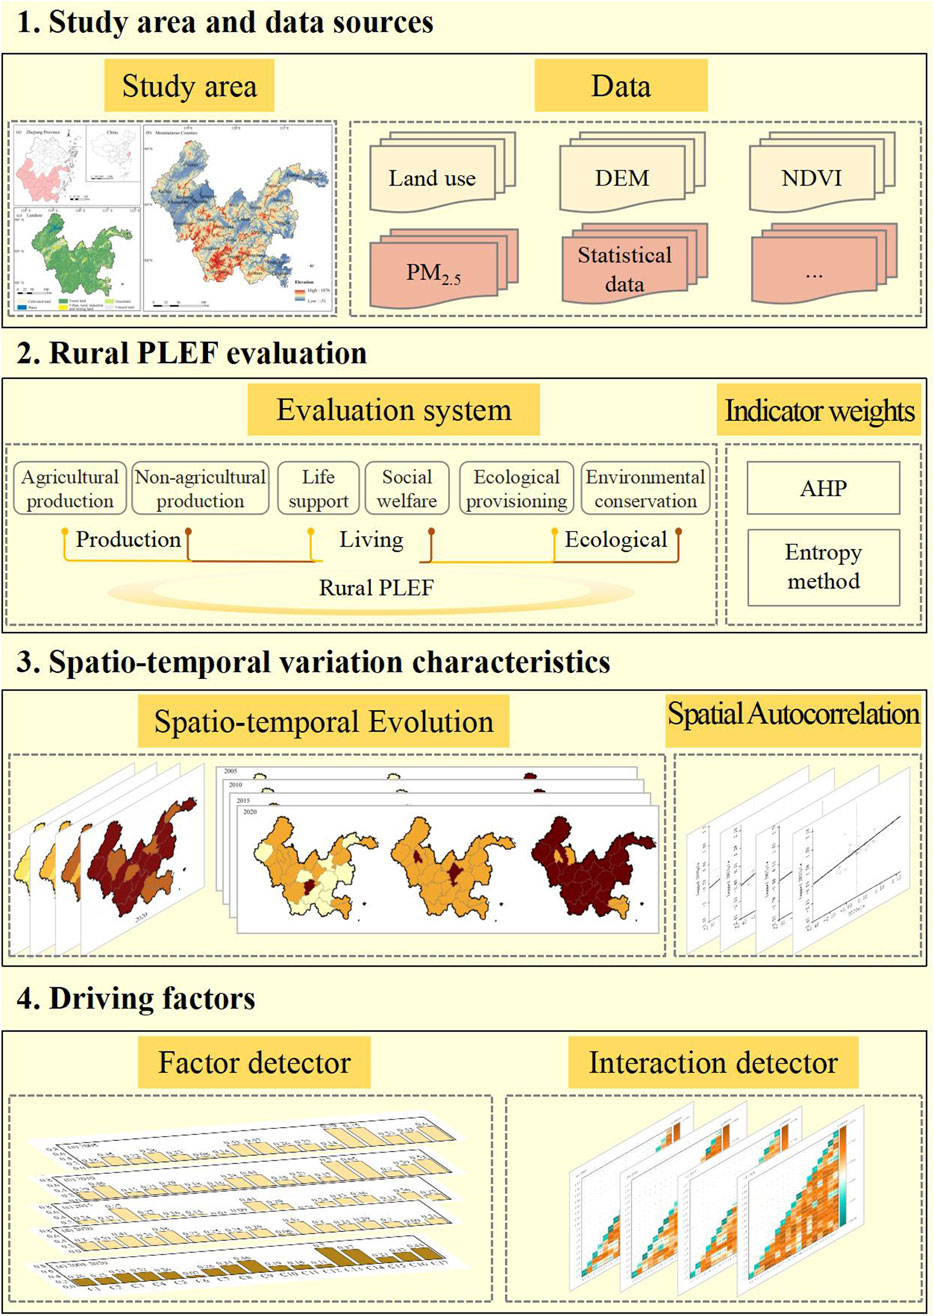
Figure 3. Framework of research concepts.
Building upon the theoretical framework and referencing established methodologies (Wang S. et al., 2023; Yang et al., 2020), this study developed a county-level rural PLEF evaluation index system through comprehensive consideration of indicator stability and county-level data availability. After consulting nine domain experts from the Institute of Geographic Sciences and Natural Resources Research (Chinese Academy of Sciences), The Chinese University of Hong Kong, Zhejiang University, Zhejiang University of Finance and Economics, and Zhejiang Academy of Agricultural Sciences, the final system comprised 17 indicators across three dimensions: PF, LF, and EF (Table 2). For PF, agricultural production functions were assessed through four indicators: rural per capita arable land area (reflecting land resource endowment), rural per capita grain yield (food security), agricultural labor productivity (production efficiency), and agricultural mechanization level. Non-agricultural production functions were evaluated using per capita output value of agriculture-related services and the proportion of rural non-agricultural employment. LF evaluation incorporated two sub-dimensions: life support functions and social welfare functions. Life support metrics included rural per capita housing area (housing security), per capita disposable income of rural residents (income security), per capita electricity consumption of rural residents (living service provision), and the Engel coefficient (consumption structure). Social welfare metrics featured the proportion of rural residents receiving minimum living allowance and number of hospital beds per 10,000 rural residents. EF assessment addressed ecological provisioning and environmental conservation. Ecological provisioning functions utilized forest coverage rate and mean NDVI, while environmental conservation functions employed fertilizer application intensity, pesticide application intensity, and annual average PM2.5 concentration.
Table 2. County-level rural PLEF development index evaluation system.
To ensure indicator comparability, panel data underwent standardized processing. The min-max normalization method (Li et al., 2012) was employed, with distinct formulas applied to positive and negative indicators (Equation 1):
Where xλij denotes the original value of the jth indicator for county i in year λ, and Yλij represents the normalized value.
Weight assignment methods are categorized into subjective and objective approaches. Subjective methods, including Delphi, Analytic Hierarchy Process (AHP), and Analytic Network Process, rely on expert judgment. AHP, the most widely applied technique, establishes hierarchical goal-criteria-subcriteria structures to align weights with theoretical expectations, though results remain expert-dependent (Watson and Hudson, 2015). Objective methods such as factor analysis, principal component analysis, and entropy weighting derive weights mathematically. The entropy method, rooted in thermodynamic principles, eliminates subjective bias but risks data-driven distortions (Hussain et al., 2020). This study combines AHP and entropy weighting to calculate composite weights for the county-level rural PLEF development index, mitigating individual method limitations (Zhou et al., 2024). The procedure involves:
Step 1: AHP method. First, relative importance scores were assigned by nine experts to determine indicator priorities. Second, judgment matrices were constructed to calculate eigenvalues. Finally, consistency checks were performed to validate and finalize factor weights (Suganthi, 2018).
Step 2: Entropy Method. First, normalized processing of indicators was conducted (Equation 2). Second, the information entropy of each indicator was computed (Equation 3). Finally, indicator weights were determined (Equations 4, 5).
Where Pλij represents the normalized value of the indicator, Ej denotes information entropy, Wj is the weight of each indicator, and Zλi(p,l,e) corresponds to the annual county-level evaluation scores for rural PF, LF, EF. t denotes the number of time cross-sections (4 years), n is the number of indicators, and m represents the number of counties.
Step 3: Composite Weight. The final composite weights were derived by averaging the weights obtained from AHP and entropy methods. The development indices for rural PF, LF, and EF were categorized into three tiers: low level (0–0.3), medium level (0.3–0.6), and high level (0.6–1) (Cheng et al., 2019).
ESDA, a widely applied spatial econometric method, is primarily employed to characterize spatial distribution patterns and structural features of data while revealing spatial autocorrelation characteristics (Ma and Pei, 2010). This study utilizes global and local spatial autocorrelation analyses under the ESDA framework to investigate the spatial interdependencies and associations of rural PLEF development index. The formulas are as follows (Equation 6):
Where Ii represents the local spatial autocorrelation index, I is the global spatial autocorrelation index, Xi and Xj are the spatial sequences of counties i and j, Wij is the spatial weight matrix based on geographic distance, dij is the Euclidean distance between the geographic centroids of counties i and j, and n is the number of county-level units. This study employed K-nearest neighbors methodology to construct spatial weight matrices based on Euclidean distance measurements between geographic centroids.
GeoDetector is a spatial statistical method primarily employed to identify spatial heterogeneity of variables and analyze influencing factors and their interactions on geographic element differentiation (Wang Y. et al., 2016). It comprises four sub-detectors: factor detector, risk detector, interaction detector, and ecological detector. This study applied factor detection to assess the explanatory power of influencing factors on spatial heterogeneity of rural PLEF development indices, while interaction detection examined factor interdependencies (Hou et al., 2022). The computational formula is expressed as Equation 7:
where q quantifies the explanatory power of influencing factors on rural PLEF development levels, with values ranging [0, 1]. Higher q values indicate stronger explanatory capacity for spatial heterogeneity of PLEF, and vice versa. The implementation involved two phases:
Step1: Data discretization. Continuous independent variables were discretized using the natural breaks method. A file geodatabase was created in ArcGIS software, followed by importing feature classes. Data classification was performed through attribute-based symbology representation before exporting processed datasets.
Step2: Geographical detection. The GeoDetector software was utilized to import discretized independent variables and dependent variable data. Software execution generated geographical detection results, including q statistics and interaction matrices.
Overall, the average rural PLEF development index of mountainous counties in Zhejiang Province increased from 0.88 in 2005 to 1.56 in 2020, with a total growth of 0.67. The contributions to this growth ranked as follows: LF (46.05%) >EF (32.58%) > PF (21.36%). The average growth of PLEF development index in ecological conservation counties (0.63) was significantly smaller than that in leapfrog development counties (0.72). The spatial distribution of rural PLEF development index evolved toward equilibrium. In 2005, high-value areas were concentrated in five ecological conservation counties; by 2010, high-value zones expanded significantly; in 2015, a “multi-core” spatial pattern emerged; by 2020, the distribution became more balanced, with 16 counties exceeding a PLEF index of 1.5, including nine ecological conservation counties (Figure 4).
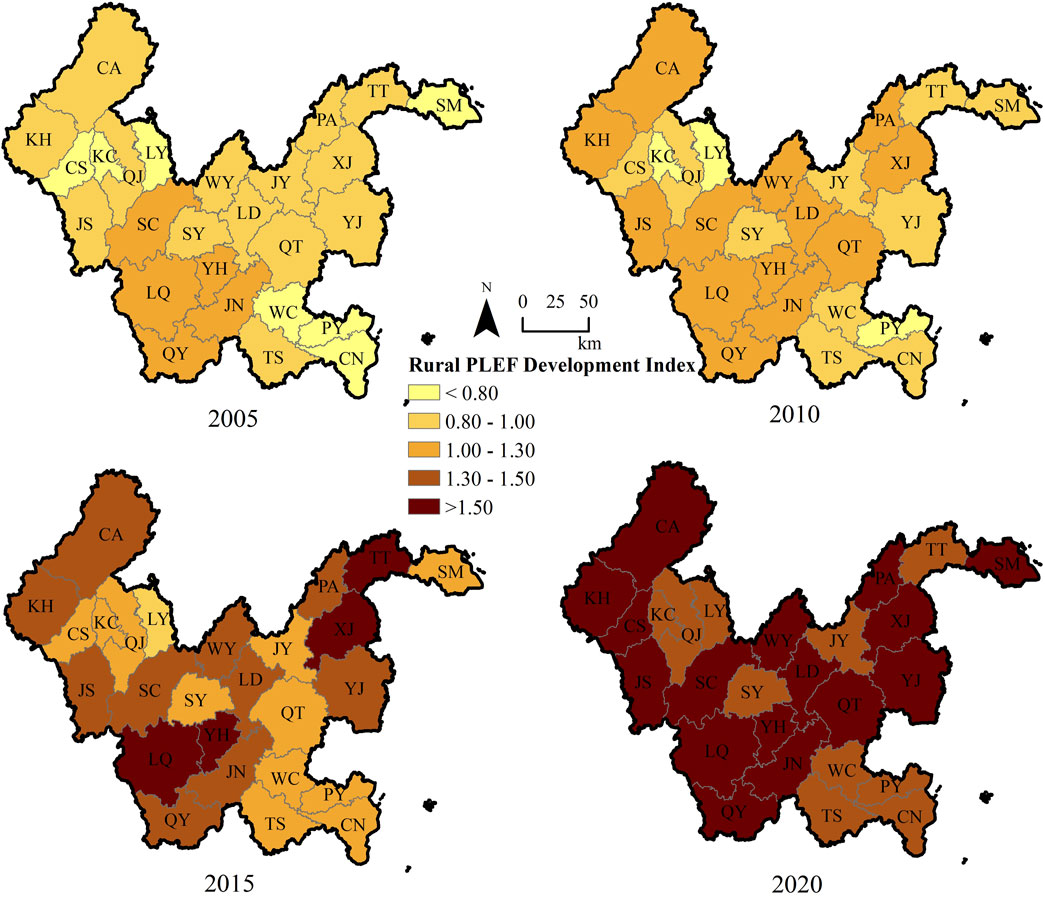
Figure 4. Spatio-temporal evolution of rural PLEF development index in the study area (2005–2020). Note: CA: Chunan, YJ: Yongjia, PY: Pingyang, CN: Cangnan, WC: Wencheng, TS: Taishun, WY: Wuyi, PA: Panan, KC: Kecheng, QJ: Qujiang, CS: Changshan, KH: Kaihua, LY: Longyou, JS: Jiangshan, SM: Sanmen, TT: Tiantai, XJ: Xianju, LD: Liandu, QT: Qingtian, JY: Jinyun, SC: Suichang, SY: Songyang, YH: Yunhe, QY: Qingyuan, JN: Jingning, LQ: Longquan.
The average PF development index increased from 0.19 in 2005 to 0.34 in 2020, transitioning from low to medium levels. Structurally, the score ratio of agricultural production functions to non-agricultural production functions shifted from 57.80:42.20 in 2005 to 48.95:51.05 in 2020, indicating a significant rise in non-agricultural contributions. Spatially, all counties were at low PF levels in 2005; by 2010, five counties reached medium levels; by 2020, 15 counties achieved medium or high PF levels (10 of which were leapfrog development counties), though spatial imbalances remained pronounced.
The average LF development index rose from 0.14 in 2005 to 0.46 in 2020, advancing from low to medium levels. Structurally, the ratio of life support function to social welfare function shifted from 60.26:39.74 in 2005 to 75.14:24.86 in 2020, driven by sustained growth in rural disposable income. Spatially, all counties remained at low LF levels from 2005 to 2010; by 2015, 25 counties reached medium levels; by 2020, two leapfrog development counties attained high LF levels.
The average EF development index improved from 0.54 in 2005 to 0.77 in 2020, progressing from medium to high levels. Structurally, the ratio of ecological provisioning function to environmental conservation function shifted from 44.27:55.73 in 2005 to 37.23:62.77 in 2020, reflecting strengthened environmental protection measures. Spatially, 12 counties had high EF levels in 2005, increasing to 22 counties by 2020, demonstrating continuous ecological improvements (Figure 5).
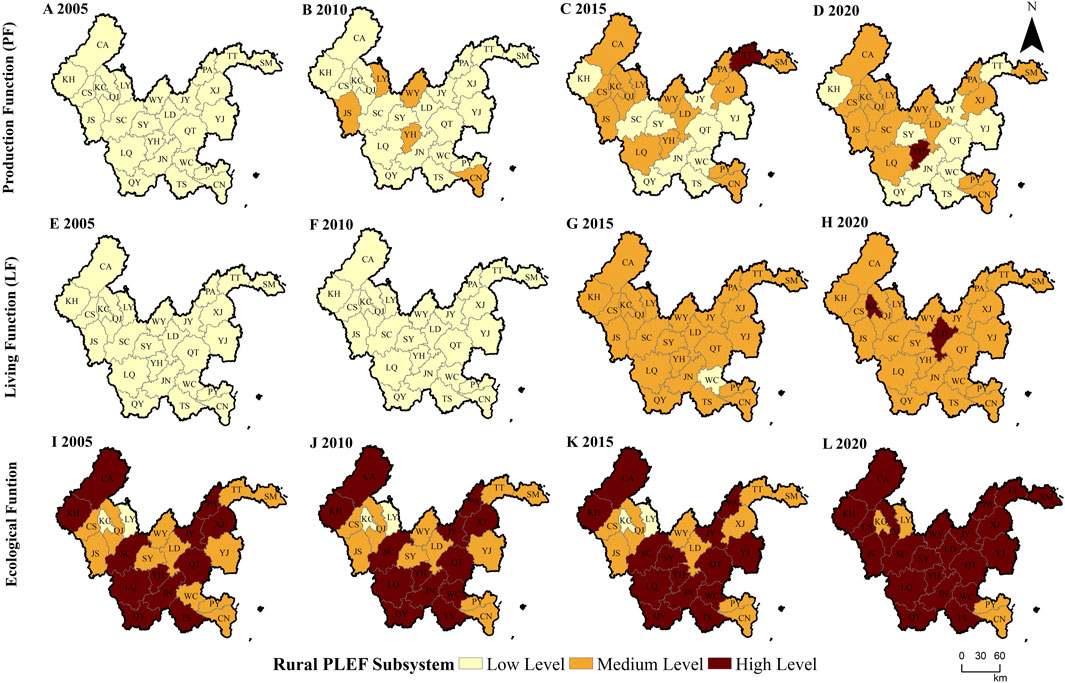
Figure 5. Spatio-temporal evolution of PF (A–D), LF (E–H) and EF (I–L) development index in the study area (2005–2020).
Based on the rural PLEF development index scores in 2005, 2010, 2015, and 2020, the global Moran’s I values were calculated using the spatial autocorrelation analysis tool in GeoDa software, with results shown in Table 3. All global Moran’s I values were positive, with Z-scores significantly exceeding the upper limit of the uniform distribution interval and P-values below 0.05, passing the 5% significance test. These findings indicate significant positive spatial correlation in the rural PLEF development index of Zhejiang’s mountainous counties, demonstrating spatial clustering. The global Moran’s I values declined and stabilized over time, suggesting reduced spatial dependency among mountainous counties and an emerging spatial distribution pattern characterized by “small clusters with broad dispersion”.
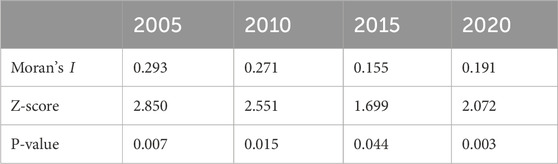
Table 3. Global spatial autocorrelation of rural PLEF development index (2005–2020).
The local spatial autocorrelation analysis was conducted by plotting the rural PLEF development index scores on the horizontal axis against spatial lag values on the vertical axis, generating a scatter plot (Figure 6). Statistically significant points were categorized into four cluster types (Table 4). High-High (HH) clusters, located in the first quadrant, are characterized by both focal and neighboring counties exhibiting high PLEF development index, indicating localized positive spatial correlation. From 2005 to 2020, the number of counties in HH clusters within Zhejiang’s mountainous counties gradually decreased, reflecting weakened spatial agglomeration. Low-High (LH) clusters, situated in the second quadrant, feature focal counties with low PLEF indices surrounded by neighboring counties with high indices, demonstrating spatial negative correlation and functioning as “depression zones” adjacent to high-value areas. SY county consistently remained an LH cluster throughout the study period. Low-Low (LL) clusters, occupying the third quadrant, exhibit low PLEF index in both focal and neighboring counties, representing localized spatial autocorrelation. Between 2005 and 2020, the spatial distribution of LL clusters shifted from western to southeastern regions. High-Low (HL) clusters, located in the fourth quadrant, are defined by focal counties with high PLEF indices adjacent to neighboring counties with low indices, indicating spatial negative correlation. The number of counties in HL clusters decreased over time, reaching zero by 2020.
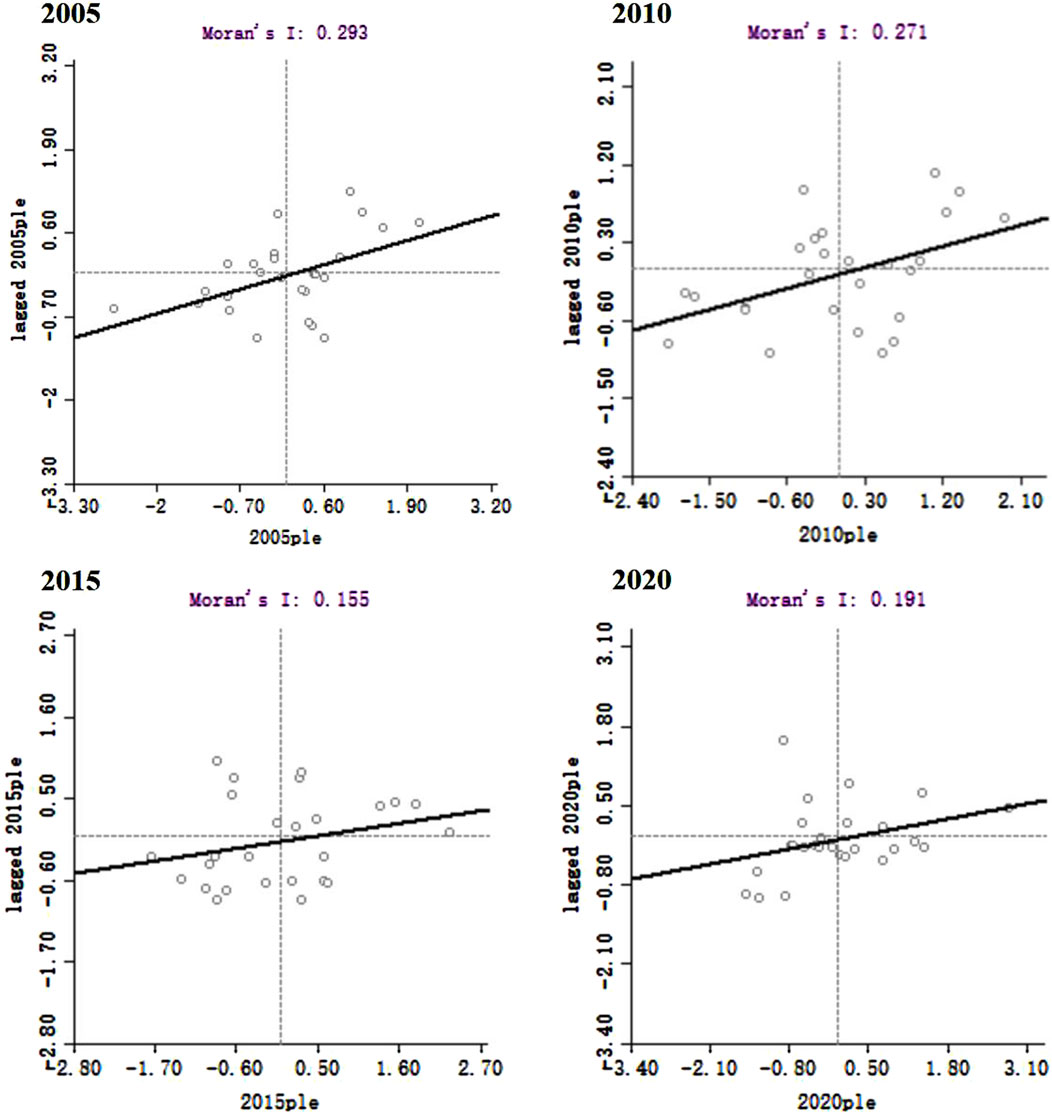
Figure 6. Local Moran’s I scatter plot of Rural PLEF development index in the study area (2005–2020).
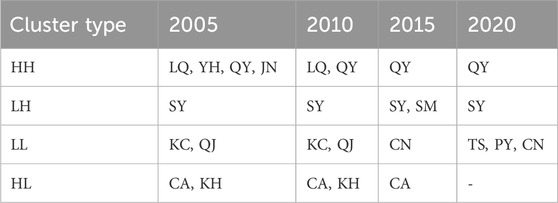
Table 4. Local spatial autocorrelation of rural PLEF development index (2005–2020).
Overall, agricultural labor productivity (C3) and agricultural mechanization level (C4) were the dominant influencing factors for PF, per capita electricity consumption of rural residents (C9) and per capita disposable income of rural residents (C8) for LF, and forest coverage rate (C13) and mean NDVI (C14) for EF. Temporal analysis revealed shifts in dominant drivers across years. For PF in 2005, the primary influencing factor was agricultural mechanization level (C4), which shifted to per capita output value of agriculture-related services (C5) by 2020, indicating a transition from agricultural production focus to non-agricultural production emphasis. For LF, the main factor evolved from per capita electricity consumption of rural residents (C9) to proportion of rural residents receiving minimum living allowance (C11), reflecting a shift from basic life support to social welfare prioritization. For EF, the dominant factor transitioned from forest coverage rate (C13) to mean NDVI (C14), though ecological provisioning remained the core functional driver (Figure 7).
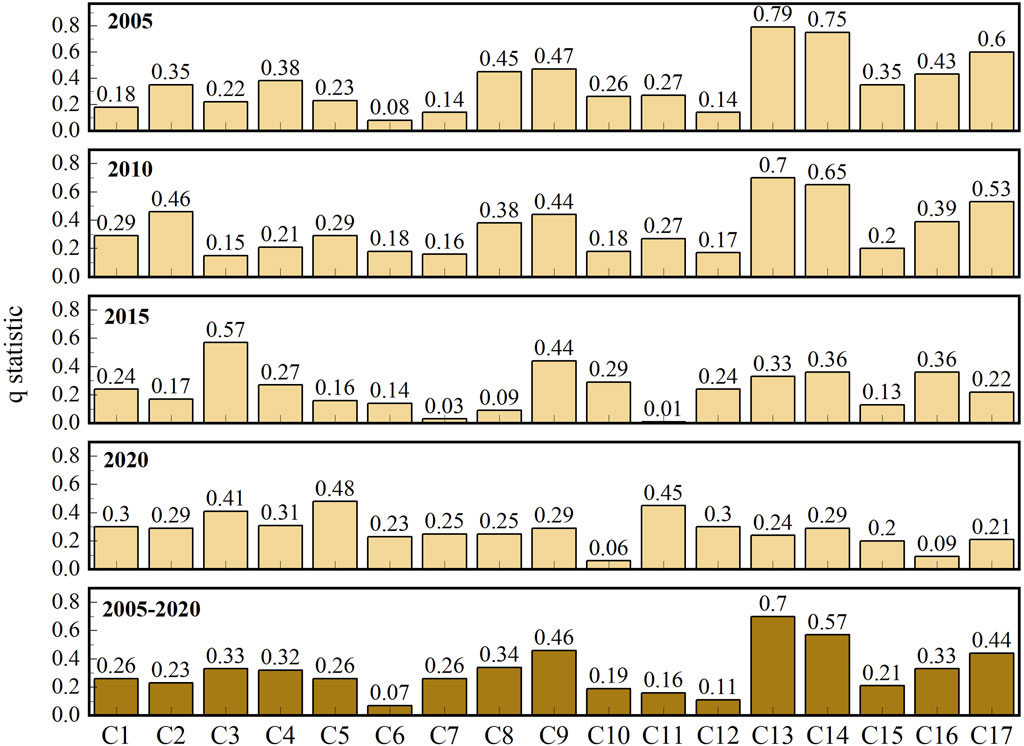
Figure 7. GeoDetector results of influencing factors for rural PLEF development index in the study area (2005–2020).
The interaction detection results revealed nonlinear enhancement and bifactor enhancement effects, indicating that all interactive factors significantly amplified their explanatory power on the spatial heterogeneity of rural PLEF compared to individual factors (Figure 8). This demonstrates that the spatial differentiation of PLEF arises from the synergistic effects of multiple factors. In 2005, interactions involving per capita disposable income of rural residents (C8), forest coverage rate (C13), and mean NDVI (C14) exhibited q-values exceeding 0.7, with the strongest interaction observed between agricultural labor productivity (C2) and forest coverage rate (C13) (q = 0.973). By 2010, interactions linked to forest coverage rate (C13) and mean NDVI (C14) dominated (q > 0.7), peaking in the interaction between forest coverage rate (C13) and fertilizer application intensity (C15) (q = 0.979). In 2015, agricultural labor productivity (C3) emerged as a key interactive factor (q > 0.7), while the interaction between the Proportion of rural residents receiving minimum living allowance (C11) and forest coverage rate (C13) showed the highest explanatory power (q = 0.970). By 2020, the Proportion of rural residents receiving minimum living allowance (C11) became the primary factor influencing spatial heterogeneity, with the strongest interaction observed between rural per capita arable land area (C1) and fertilizer application intensity (C15) (q = 0.931).
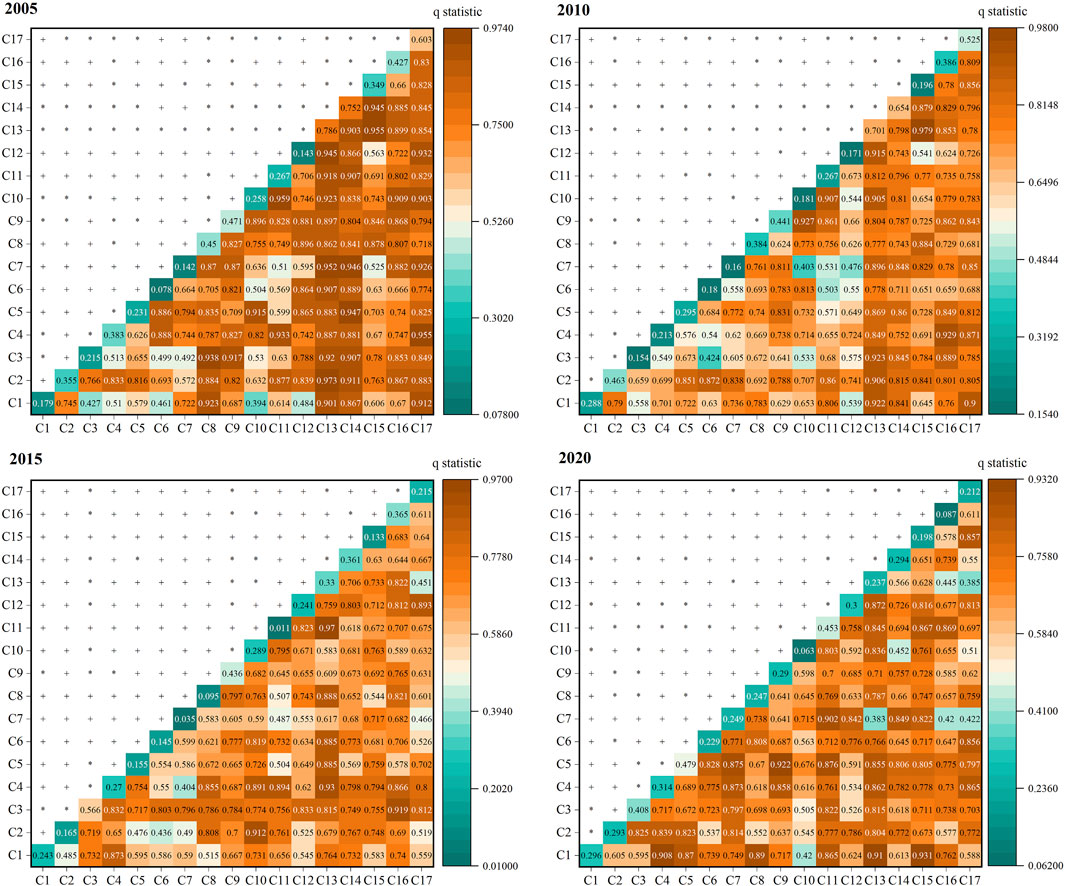
Figure 8. Interaction detection results of influencing factors for Rural PLEF in the study area (2005–2020). Note: “+” denotes nonlinear enhancement, determined by the criterion q (X1∩X2)>q (X1)+q (X2); “*” indicates bifactor enhancement, defined by q (X1∩X2)>Max [q (X1),q (X2)](Wang and Xu, 2017).
This study developed a PLEF evaluation system using multi-source data, establishing a research framework for measuring and analyzing the evolutionary patterns of rural PLEF at the county level. However, due to the inherent complexity of rural functions and limitations in data availability at the county scale, the indicator design does not comprehensively cover all aspects of PLEF. While spatial data such as land use, PM2.5 concentration, and NDVI were incorporated, the majority of indicators remain statistics-based. Although statistical reporting standards are consistent across counties, absolute data accuracy cannot be fully guaranteed. Future research should integrate expanded data sources, including field surveys, POI data, and UAV monitoring, to enhance the evaluation system’s precision and holistically capture the functional evolution of mountainous PLEF.
Mountainous areas, covering over 60% of China’s land area, represent a quintessential geographical feature. Existing studies indicate an overall upward trend in PF and LF, while EF exhibit significant variability, particularly fluctuating in industrialized regions (Wang YF. et al., 2024). Economically developed coastal areas generally demonstrate improvements in EF (Zhang HZ. et al., 2024), aligning with the findings of this study conducted in the southeastern coastal region of China.
Regarding the influence of topographic factors on mountainous rural PLEF, prior research suggests that EF dominate at high elevations, whereas PF and LF are more prevalent in low-gradient areas (Zhang J. et al., 2024). Other studies highlight the adverse effects of topographic complexity on LF (Zhang W. et al., 2024). This study analyzed correlations between topographic factors (elevation and slope) and PLEF subsystem development levels in 2020, revealing no significant correlation between PF and topography, a significant negative correlation between mean elevation and LF, and significant positive correlations between mean elevation/slope and EF (Figure 9).
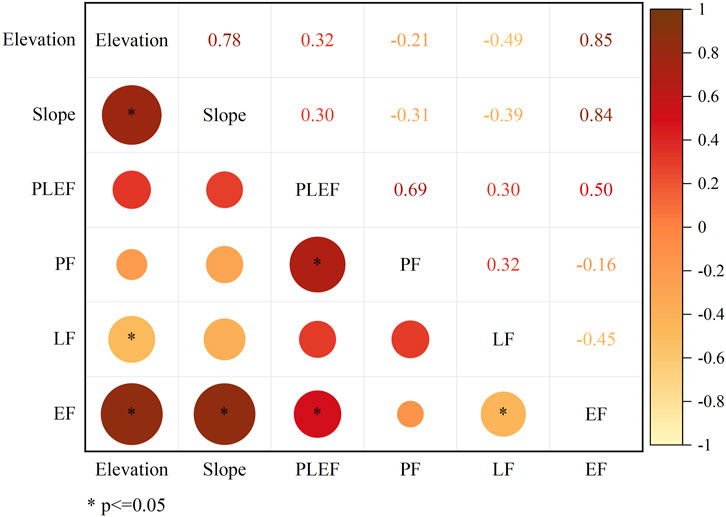
Figure 9. Correlation analysis between terrain and PLEF in the study area.
Regarding driving factors, all 17 factors exhibited either nonlinear enhancement or bifactor enhancement effects on rural PLEF, indicating mutually reinforcing interactions among factors. The driving mechanisms of rural PLEF are illustrated in Figure 10. During the 2005–2010 period, rural PLEF underwent infrastructure development and initial integration. Centered on the “Thousand Villages Demonstration, Ten Thousand Villages Renovation” project (referred to as the “Ten-Thousand Villages Project”), this phase prioritized rural infrastructure construction and environmental remediation. PF was dominated by traditional agriculture, with preliminary planning of grain production functional zones laying the foundation for subsequent modern agricultural development. LF focused on improving basic rural residential conditions, including gradual upgrades to electricity and water supply systems, while EF initially emphasized increasing forest coverage. From 2010 to 2015, rural PLEF transitioned toward ecological transformation and systemic enhancement. Guided by the “Beautiful Countryside Construction” initiative, this stage emphasized integrated development of ecological habitats, economies, environments, and cultures. PF shifted to modern agricultural parks, significantly boosting agricultural labor productivity. LF prioritized equal access to urban-rural public services, further improving rural living conditions. EF strengthened systematic governance and resource recycling, fostering green development trends. The 2015–2020 period marked high-quality development and multi-sectoral synergy. Driven by the Rural Revitalization Strategy, this phase promoted coordinated development of rural PLEF. Agricultural production advanced through digital transformation, while secondary and tertiary industries flourished. LF emphasized narrowing urban-rural disparities, with increased focus on livelihood security for low-income rural populations. EF prioritized holistic governance and resilience enhancement through sustained ecological restoration efforts.
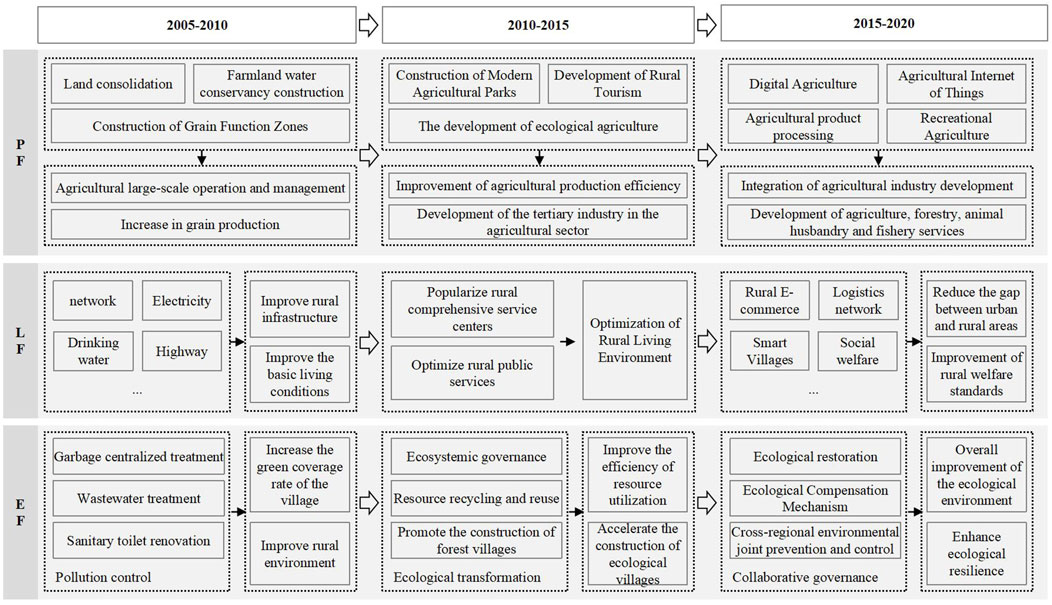
Figure 10. Driving mechanism of the rural PLEF.
This study primarily investigated the evolution and influencing factors of rural PLEF in mountainous counties but did not conduct comparative analyses with non-mountainous counties, which could further elucidate the distinctive characteristics of mountainous PLEF. Future research should strengthen interregional comparisons of PLEF and optimization strategies for rural PLEF. Additionally, while this study focused on the explanatory power of individual indicators within the evaluation system, it did not quantify the contributory weights of factors or explore potential driving effects from other variables. Future studies could systematically investigate multidimensional drivers of rural PLEF development and subsystem performance, including but not limited to policy formulation, population migration, land-use changes, economic development, and technological innovation.
Since 2003, Zhejiang Province has implemented the “Ten-Thousand Villages Project” for over two decades, alongside a series of policies targeting rural construction and urban-rural integration in mountainous counties. These initiatives have significantly improved rural ecological environments and livability (Lin and Hou, 2023; Wang et al., 2019), effectively narrowed regional disparities, and promoted the gradual enhancement of rural PLEF development levels (Zhou et al., 2017). In 2023, Zhejiang’s experience with the “Ten-Thousand Villages Project” was nationally promoted. The 2024 Central No. One Document of China emphasized “learning and applying the development philosophy, methodologies, and implementation mechanisms embedded in the ‘Ten-Thousand Villages Project’.” The evolution of rural PLEF in Zhejiang’s mountainous counties has been synergistically driven by rural development policies, as follows:
First, the “Beautiful Countryside” and common prosperity policies have enhanced rural LF. This study found that LF contributed most significantly to PLEF improvement in Zhejiang, attributable to the “Ten-Thousand Villages Project’s” continuous upgrades to rural infrastructure and public services, alongside common prosperity policies that expanded farmers’ income channels and safeguarded basic welfare. Second, ecological prioritization and green development policies have strengthened rural EF. Guided by the “lucid waters and lush mountains are invaluable assets” philosophy, Zhejiang has advanced ecological restoration, pollution control, and resource recycling. Mountainous counties have adopted the “Ecological County” strategy to accelerate green agricultural development (Zhao et al., 2019). Third, industrial cultivation and targeted assistance policies have boosted PF. Focusing on whole-industry-chain development and technological empowerment, mountainous counties have upgraded PF toward high-value-added and specialized sectors. A classified development strategy categorizes mountainous counties into two types: leapfrog development counties focusing on eco-industries and technological innovation, and ecological conservation counties prioritizing distinctive advantageous industries. The “One County, One Policy” framework promotes high-quality development, while strategies like “Mountainous Zhejiang” and “Mountain-Sea Collaboration” have spatially balanced PLEF development across regions.
However, challenges remain in Zhejiang’s mountainous PLEF development. First, PF require further enhancement. As rural industrial revitalization is the cornerstone of rural revitalization, this study identifies PF as the weakest link in mountainous PLEF. Urgent measures—including technological innovation, institutional reforms, and targeted assistance—are needed to improve agricultural productivity and accelerate modernization (Hu et al., 2023; Zhao and Li, 2022). Second, ecological conservation counties lag behind leapfrog development counties in PLEF performance. Prioritizing the development of ecological conservation counties is critical for Zhejiang’s goal of building a common prosperity demonstration zone.
Based on the theoretical framework, this study constructed a PLEF evaluation system comprising 17 indicators across three dimensions. Taking Zhejiang’s mountainous counties as the study area, the rural PLEF and subsystem development index were calculated for 2005, 2010, 2015, and 2020. Through analyzing the spatio-temporal evolution of PLEF, PF, LF, and EF, this study clarified the spatial heterogeneity of rural PLEF and identified key driving factors across different periods. The main conclusions are as follows:
(1) From 2005 to 2020, the rural PLEF development index in Zhejiang’s mountainous counties increased significantly, with LF contributing the most to PLEF growth (46.05%), followed by EF and PF. The growth rate of PLEF index in ecological conservation counties was notably lower than that in leapfrog development counties. The spatial evolution of rural PLEF exhibited distinct heterogeneity, transitioning from a “single-core” to a “multi-core” spatial pattern and ultimately achieving balanced development.
(2) Disparities existed in the development levels of PLEF subsystems. During the study period, the PF development index transitioned from low-level to medium-level stages, with the proportion of non-agricultural PF rising from 42.20% to 51.05%. The LF development index advanced from low-level to medium-level stages, with a significant overall leap occurring between 2010 and 2015. The EF development index progressed from medium-level to high-level stages.
(3) The rural PLEF development index exhibited positive spatial correlation with clustering characteristics. However, spatial dependency gradually weakened over time, evolving into a “small clusters with broad dispersion” distribution pattern.
(4) The primary influencing factors for rural PF were agricultural labor productivity and agricultural mechanization levels, with the dominant function shifting from agricultural production to non-agricultural production during the study period. For rural LF, the key factors were rural per capita electricity consumption and disposable income, with the dominant function transitioning from life support to social welfare. For rural EF, forest coverage rate and NDVI were the main drivers, with ecological provisioning remaining the dominant function throughout the study period.
The raw data supporting the conclusions of this article will be made available by the authors, without undue reservation.
No human studies are presented in the manuscript. No potentially identifiable images or data are presented in this study.
ZX: Conceptualization, Data curation, Formal Analysis, Investigation, Methodology, Software, Validation, Visualization, Writing–original draft. FK: Funding acquisition, Supervision, Validation, Writing–review and editing. JY: Validation, Writing–review and editing.
The author(s) declare that financial support was received for the research and/or publication of this article. This research was funded by the Soft Science Research Program Project of Zhejiang Province, grant number 2020C35002.
The authors declare that the research was conducted in the absence of any commercial or financial relationships that could be construed as a potential conflict of interest.
All claims expressed in this article are solely those of the authors and do not necessarily represent those of their affiliated organizations, or those of the publisher, the editors and the reviewers. Any product that may be evaluated in this article, or claim that may be made by its manufacturer, is not guaranteed or endorsed by the publisher.
Achu, A. L., Thomas, J., Aju, C. D., Gopinath, G., Kumar, S., and Reghunath, R. (2021). Machine-learning modelling of fire susceptibility in a forest-agriculture mosaic landscape of southern India. Ecol. Inf. 64, 101348. doi:10.1016/j.ecoinf.2021.101348
Aruhan, , and Liu, D. C. (2024). Study on the influencing factors of the evolution of space pattern based on principal component analysis in Duolun County. Sci. Rep. 14, 20567. doi:10.1038/s41598-024-71297-3
Cheng, L. (2021). China's rural transformation under the Link Policy: a case study from Ezhou. Land Use Policy 103, 105319. doi:10.1016/j.landusepol.2021.105319
Cheng, M., Liu, Y., and Jiang, N. (2019). Study on the spatial pattern and mechanism of rural population-land-industry coordinating development in Huang-Huai-Hai Area. Acta Geogr. Sin. 74, 1576–1589. doi:10.11821/dlxb201908007
Duan, Y., Wang, H., Huang, A., Xu, Y., Lu, L., and Ji, Z. (2021). Identification and spatial-temporal evolution of rural “production-living-ecological” space from the perspective of villagers' behavior – a case study of Ertai Town, Zhangjiakou City. Land Use Policy 106, 105457. doi:10.1016/j.landusepol.2021.105457
Fanzo, J., Haddad, L., Schneider, K. R., Béné, C., Covic, N. M., Guarin, A., et al. (2021). Viewpoint: rigorous monitoring is necessary to guide food system transformation in the countdown to the 2030 global goals. Food Policy 104, 102163. doi:10.1016/j.foodpol.2021.102163
Fu, J. Y., Gao, Q., Jiang, D., Li, X., and Lin, G. (2023). Spatial-temporal distribution of global production-living-ecological space during the period 2000-2020. Sci. Data 10, 589. doi:10.1038/s41597-023-02497-1
Gong, S. N., Zhang, L., and Pang, J. (2024). The spatial-temporal evolution of the trade-offs and synergy between the suburban rural landscape's production-living-ecological functions: a case study of jiashan in the Yangtze River Delta eco-green integrated development demonstration zone, China. Sustainability 16, 7439. doi:10.3390/su16177439
Holmes, J. (2006). Impulses towards a multifunctional transition in rural Australia: gaps in the research agenda. J. Rural. Stud. 22, 142–160. doi:10.1016/j.jrurstud.2005.08.006
Hou, M., Deng, Y., and Yao, S. (2022). Coordinated relationship between urbanization and grain production in China: degree measurement, spatial differentiation and its factors detection. J. Clean. Prod. 331, 129957. doi:10.1016/j.jclepro.2021.129957
Hu, Z. H., Song, G. H., Hu, Z. Y., Zhang, B., and Lin, T. (2023). How to promote the balanced development of urban and rural China? Evidences from reallocating idle rural residential land of Zhejiang province, China. Plos One 18, e0287820. doi:10.1371/journal.pone.0287820
Huang, J. T., Zhang, Y. C., Zhang, J. Q., Qi, J., and Liu, P. (2024b). Study on the ecological environment quality and its driving factors of the spatial transformation of production-living-ecological space in Baishan City. Sci. Rep. 14, 18709. doi:10.1038/s41598-024-69428-x
Huang, Y., Lin, J., He, X., Lin, Z., Wu, Z., and Zhang, X. (2024a). Assessing the scale effect of urban vertical patterns on urban waterlogging: an empirical study in Shenzhen. Environ. Impact Assess. Rev. 106, 107486. doi:10.1016/j.eiar.2024.107486
Hunter, M. C., Smith, R. G., Schipanski, M. E., Atwood, L. W., and Mortensen, D. A. (2017). Agriculture in 2050: recalibrating targets for sustainable intensification. Bioscience 67, 386–391. doi:10.1093/biosci/bix010
Hussain, J., Zhou, K., Guo, S., and Khan, A. (2020). Investment risk and natural resource potential in “Belt and Road Initiative” countries: a multi-criteria decision-making approach. Sci. Total Environ. 723, 137981. doi:10.1016/j.scitotenv.2020.137981
Ji, Z., Liu, C., Xu, Y., Huang, A., Lu, L., and Duan, Y. (2020). Identification and optimal regulation of the production-living-ecological space based on quantitative land use functions. Trans. Chin. Soc. Agric. Eng. Trans. Case 36, 222–231. doi:10.11975/j.issn.1002-6819.2020.18.027
Ke, L., Wang, L., Wang, Q., Ren, Z., Lu, Y., Yin, S., et al. (2025). Production-living-ecological functions measurement and spatio-temporal evolution of the coastal zone under the perspective of land-sea coordination: a case study of Liaoning Coastal Economic Belt. Front. Environ. Sci. 12. doi:10.3389/fenvs.2024.1513656
Li, H., Zhang, P. F., Zhang, L., and Yang, J. (2024a). Research on the evolutionary characteristics and mechanism of production-living-ecological space in Shanxi Province, China. Sci. Rep. 14, 31379. doi:10.1038/s41598-024-82906-6
Li, L., Ruifeng, Z., and Siyu, M. (2022). Evolvement characteristics and coupling coordination analysis of “production-living-ecological space” function in the upper reaches of the Yellow River. J. Earth Environ. 13, 449–464. doi:10.7515/JEE222012
Li, M. Y., Cao, S., Zhu, Z. C., Wang, Z., Myneni, R. B., and Piao, S. (2023). Spatiotemporally consistent global dataset of the GIMMS normalized difference vegetation index (PKU GIMMS NDVI) from 1982 to 2022. Earth Syst. Sci. Data 15, 4181–4203. doi:10.5194/essd-15-4181-2023
Li, X. M., Gao, M. K., Li, H., Hou, X., Tian, S., Yang, J., et al. (2024b). Spatio-temporal evolution and obstacle diagnosis of human settlements based on the “production-living-ecological” functions. Sci. Rep. 14, 31022. doi:10.1038/s41598-024-82259-0
Li, Y., Li, Y., Zhou, Y., Shi, Y., and Zhu, X. (2012). Investigation of a coupling model of coordination between urbanization and the environment. J. Environ. Manage 98, 127–133. doi:10.1016/j.jenvman.2011.12.025
Li, Y., Zhang, S., Zhao, J., Zhang, G., Qu, G., Ma, S., et al. (2024c). Spatiotemporal evolution and Sustainably comprehensive zoning optimization of production–living–ecological functions in the Mountain–Flatland areas. Heliyon 10, e23425. doi:10.1016/j.heliyon.2023.e23425
Li, Y. H., Jia, L. R., Wu, W. H., Yan, J., and Liu, Y. (2018). Urbanization for rural sustainability - rethinking China's urbanization strategy. J. Clean. Prod. 178, 580–586. doi:10.1016/j.jclepro.2017.12.273
Liao, G., He, P., Gao, X., Lin, Z., Huang, C., Zhou, W., et al. (2022). Land use optimization of rural production–living–ecological space at different scales based on the BP–ANN and CLUE–S models. Ecol. Indic. 137, 108710. doi:10.1016/j.ecolind.2022.108710
Lin, S. J., and Hou, L. D. (2023). SDGs-oriented evaluation of the sustainability of rural human settlement environment in Zhejiang, China. Heliyon 9, e13492. doi:10.1016/j.heliyon.2023.e13492
Liu, N., Chen, Y., and Su, F. (2023). Research on the spatial differences and influencing factors of integrated urban-rural development in the Yangtze River Delta. Front. Sustain Cities 4. doi:10.3389/frsc.2022.1077653
Long, H., Zou, J., Pykett, J., and Li, Y. (2011). Analysis of rural transformation development in China since the turn of the new millennium. Appl. Geogr. (Sevenoaks) 31, 1094–1105. doi:10.1016/j.apgeog.2011.02.006
Long, H. L., Zhang, Y. N., and Tu, S. S. (2019). Rural vitalization in China: a perspective of land consolidation. J. Geogr. Sci. 29, 517–530. doi:10.1007/s11442-019-1599-9
Lu, Q., Sun, J., Xiao, Y., Zhu, S., Zhu, G., Liu, J., et al. (2024). The progression traits of spatial conflicts within the production–living–ecological space among varying geomorphological types of mountain–basin areas in karst regions, China. Ecol. Indic. 166, 112324. doi:10.1016/j.ecolind.2024.112324
Ma, D. (2023). “Promoting the development of urban–rural integration,” in Rural revitalization in China: a socialist road with Chinese characteristics (Singapore: Springer Nature Singapore).
Ma, X., and Pei, T. (2010). Exploratory spatial data analysis of regional economic disparities in Beijing during 2001-2007. Prog. Geogr. 29, 1555–1561. doi:10.11820/dlkxjz.2010.12.012
Ning, J., Liu, J. Y., Kuang, W. H., Xu, X., Zhang, S., Yan, C., et al. (2018). Spatiotemporal patterns and characteristics of land-use change in China during 2010-2015. J. Geogr. Sci. 28, 547–562. doi:10.1007/s11442-018-1490-0
Qin, Y., Wang, L., Yu, M., Meng, X., Fan, Y., Huang, Z., et al. (2024). The spatio-temporal evolution and transformation mode of human settlement quality from the perspective of production-living-ecological spaces-a case study of Jilin Provinceproduction-living-ecological spaces-a case study of Jilin Province. Habitat Int. 145, 103021. doi:10.1016/j.habitatint.2024.103021
Qu, Y. B., Jiang, G. H., Zhao, Q. L., et al. (2017). Geographic identification, spatial differentiation, and formation mechanism of multifunction of rural settlements: A case study of 804 typical villages in Shandong Province, China. J Clean Prod 166: 1202–15. doi:10.1016/j.jclepro.2017.08.120
Ren, J. T., Dong, Y. Q., He, P. X., and Lu, H. Y. (2024). Spatial-temporal changes of landscape ecological risk in the Liuchong river basin from the perspective of production-life-ecological space. Front. Environ. Sci. 12. doi:10.3389/fenvs.2024.1428058
Shen, S., Li, C., van Donkelaar, A., Jacobs, N., Wang, C., and Martin, R. V. (2024). Enhancing global estimation of fine particulate matter concentrations by including geophysical a priori information in deep learning. Acs Es&T Air 1, 332–345. doi:10.1021/acsestair.3c00054
Song, W., Cao, S. S., Du, M. Y., and He, Z. Y. (2024). Aligning territorial spatial planning with sustainable development goals: a comprehensive analysis of production, living, and ecological spaces in China. Ecol. Indic. 160, 111816. doi:10.1016/j.ecolind.2024.111816
Suganthi, L. (2018). Multi expert and multi criteria evaluation of sectoral investments for sustainable development: an integrated fuzzy AHP, VIKOR/DEA methodology. Sustain Cities Soc. 43, 144–156. doi:10.1016/j.scs.2018.08.022
Tian, F., Li, M., Han, X., Liu, H., and Mo, B. (2020). A production–living–ecological space model for land-use optimisation: a case study of the core tumen river region in China. Ecol. Modell. 437, 109310. doi:10.1016/j.ecolmodel.2020.109310
Tu, S. S., and Long, H. L. (2017). Rural restructuring in China: theory, approaches and research prospect. J. Geogr. Sci. 27, 1169–1184. doi:10.1007/s11442-017-1429-x
Tudi, M., Ruan, H. D., Wang, L., Lyu, J., Sadler, R., Connell, D., et al. (2021). Agriculture development, pesticide application and its impact on the environment. Int. J. Environ. Res. Public Health 18, 1112. doi:10.3390/ijerph18031112
Wang, J., Sun, Q., and Zou, L. (2023a). Spatial-temporal evolution and driving mechanism of rural production-living-ecological space in Pingtan islands, China. Habitat Int. 137, 102833. doi:10.1016/j.habitatint.2023.102833
Wang, J., and Xu, C. (2017). Geodetector: principle and prospective. Acta Geogr. Sin. 72, 116–134. doi:10.11821/dlxb201701010
Wang, J., Zhang, T., and Fu, B. (2016a). A measure of spatial stratified heterogeneity. Ecol. Indic. 67, 250–256. doi:10.1016/j.ecolind.2016.02.052
Wang, S., Tian, J., Namaiti, A., Lu, J., and Song, Y. (2023b). Spatial pattern optimization of rural production-living-ecological function based on coupling coordination degree in shallow mountainous areas of Quyang County, Hebei Province, China. Front. Ecol. Evol. 11. doi:10.3389/fevo.2023.1169007
Wang, X., Li, X. M., Sha, J. M., Zhang, H., Shifaw, E., Guo, X., et al. (2024a). Trade-offs and synergies for urban production-living-ecological spatial patterns-comparison study between fuzhou, China, and saskatoon, Canada. Ecol. Indic. 169, 112816. doi:10.1016/j.ecolind.2024.112816
Wang, Y., Liu, Y., Li, Y., and Li, T. (2016b). The spatio-temporal patterns of urban–rural development transformation in China since 1990. Habitat Int. 53, 178–187. doi:10.1016/j.habitatint.2015.11.011
Wang, Y., Zhu, Y. M., and Yu, M. J. (2019). Evaluation and determinants of satisfaction with rural livability in China's less-developed eastern areas: a case study of Xianju County in Zhejiang Province. Ecol. Indic. 104, 711–722. doi:10.1016/j.ecolind.2019.05.054
Wang, Y. F., Cheng, L. L., Zheng, Y., Wang, J., and Cui, H. (2024b). Evolution of land use functions and their trade-offs/synergies relationship in resource-based cities. Ecol. Indic. 165, 112175. doi:10.1016/j.ecolind.2024.112175
Watson, J. J. W., and Hudson, M. D. (2015). Regional Scale wind farm and solar farm suitability assessment using GIS-assisted multi-criteria evaluation. Landsc. Urban Plan. 138, 20–31. doi:10.1016/j.landurbplan.2015.02.001
Wilson, G. A. (2008). From 'weak' to 'strong' multifunctionality: conceptualising farm-level multifunctional transitional pathways. J. Rural. Stud. 24, 367–383. doi:10.1016/j.jrurstud.2007.12.010
Wood, S., Jones, S. K., Johnson, J. A., Brauman, K. A., Chaplin-Kramer, R., Fremier, A., et al. (2018). Distilling the role of ecosystem services in the sustainable development goals. Ecosyst. Serv. 29, 70–82. doi:10.1016/j.ecoser.2017.10.010
Wubuli, J., Xue, D. Q., Song, Y. Y., and Ma, B. B. (2024). Method for identifying rural PLES and its applications. Ecol. Indic. 166, 112273. doi:10.1016/j.ecolind.2024.112273
Xia, N., Hai, W., Tang, M., Song, J., Quan, W., Zhang, B., et al. (2023). Spatiotemporal evolution law and driving mechanism of production–living–ecological space from 2000 to 2020 in Xinjiang, China. Ecol. Indic. 154, 110807. doi:10.1016/j.ecolind.2023.110807
Xu, Z. C., Chau, S. N., Chen, X. Z., Zhang, J., Li, Y., Dietz, T., et al. (2020). Assessing progress towards sustainable development over space and time. Nature 577, 74–78. doi:10.1038/s41586-019-1846-3
Yang, D. R., Yang, Q., Tong, Z. J., Du, W., and Zhang, J. (2024a). Coupling coordination analysis of production, living, and ecological spaces in wetlands: a case study of Xianghai Wetland nature reserve, China. Ecol. Indic. 158, 111578. doi:10.1016/j.ecolind.2024.111578
Yang, L., Meng, H. H., Wang, J. T., Wu, Y., and Zhao, Z. (2024b). The vulnerability assessment and obstacle factor analysis of urban agglomeration along the Yellow River in China from the perspective of production-living-ecological space. Plos One 19, e0299729. doi:10.1371/journal.pone.0299729
Yang, Y. Y., Bao, W. K., and Liu, Y. S. (2020). Coupling coordination analysis of rural production-living-ecological space in the Beijing-Tianjin-Hebei region. Ecol. Indic. 117, 106512. doi:10.1016/j.ecolind.2020.106512
Yu, T., Huang, X., and Cui, X. (2024). From pixels to Policy: unveiling the interplay of Production, Living, and ecological functions in Nanjing metropolitan area. Ecol. Indic. 166, 112443. doi:10.1016/j.ecolind.2024.112443
Zhang, H. Z., Tang, Q., He, X. B., and Yang, Q. Y. (2024a). Land use function changes and trade-offs/synergies across topographic gradients in the Three Gorges Reservoir Area, China. J. Clean. Prod. 469, 143233. doi:10.1016/j.jclepro.2024.143233
Zhang, J., Guan, C., Zhang, L., Yu, Z., Ye, C., Zhu, C., et al. (2024b). Spatial identification and evaluation of rural vitality from a function-element-flow perspective: evidence of Lin’an district in Hangzhou, China. J. Geogr. Sci. 34, 1228–1250. doi:10.1007/s11442-024-2246-7
Zhang, L., Hu, B., Zhang, Z., and Liang, G. (2023). Research on the spatiotemporal evolution and mechanism of ecosystem service value in the mountain-river-sea transition zone based on “production-living-ecological space” — taking the Karst-Beibu Gulf in Southwest Guangxi, China as an example. Ecol. Indic. 148, 109889. doi:10.1016/j.ecolind.2023.109889
Zhang, R. Y., Li, S. N., Wei, B. J., and Zhou, X. (2022). Characterizing production-living-ecological space evolution and its driving factors: a case study of the chaohu lake basin in China from 2000 to 2020. Isprs Int. J. Geoinf 11, 447. doi:10.3390/ijgi11080447
Zhang, W., Yuan, Q., and Cai, H. (2024c). Unravelling regional development through the production-living-ecological perspective: assessing heterogeneity and expert insights. Urban Clim. 55, 101937. doi:10.1016/j.uclim.2024.101937
Zhao, TZ, Zhao, Y, and Li, MH (2019). Landscape Performance for Coordinated Development of Rural Communities and Small-Towns Based on “Ecological Priority and All-Area Integrated Development”: Six Case Studies in East China’s Zhejiang Province. Sustainability 11. doi:10.3390/su11154096
Zhao, Y. X., and Li, R. Y. (2022). Coupling and coordination analysis of digital rural construction from the perspective of rural revitalization: a case study from Zhejiang province of China. Sustainability 14, 3638. doi:10.3390/su14063638
Zhao, J., and Zhao, Y. (2023). Synergy/trade-offs and differential optimization of production, living, and ecological functions in the Yangtze River economic Belt, China. Ecol Indic 147: 109925. doi:10.1016/j.ecolind.2023.109925
Zhou, D., Xu, J., and Lin, Z. (2017). Conflict or coordination? Assessing land use multi-functionalization using production-living-ecology analysis. Sci. Total Environ. 577, 136–147. doi:10.1016/j.scitotenv.2016.10.143
Zhou, H., Wu, X., Nie, H., Wang, X., and Zang, S. (2024). Coupling coordination analysis and obstacle factors identification of rural living-production-ecological functions in a farming-pastoral ecotone. Ecol. Indic. 158, 111398. doi:10.1016/j.ecolind.2023.111398
Zhou, Y., Li, X., and Liu, Y. (2020). Land use change and driving factors in rural China during the period 1995-2015. Land Use Policy 99, 105048. doi:10.1016/j.landusepol.2020.105048
Zhu, T., and Qin, X. (2012). Urbanization path: the fundamental problem of changes in land use patterns. Sci. Geogr. Sin. 32, 1348–1352. doi:10.13249/j.cnki.sgs.2012.011.1348
Keywords: mountainous county, evaluation system, spatial pattern, influencing factor, production-living-ecological function
Citation: Xu Z, Ke F and Yu J (2025) Spatio-temporal evolution and influencing factors of rural production-living-ecological function: A case study of mountainous counties in Zhejiang Province, China. Front. Environ. Sci. 13:1495778. doi: 10.3389/fenvs.2025.1495778
Received: 16 September 2024; Accepted: 10 March 2025;
Published: 24 March 2025.
Edited by:
Jinyao Lin, Guangzhou University, ChinaCopyright © 2025 Xu, Ke and Yu. This is an open-access article distributed under the terms of the Creative Commons Attribution License (CC BY). The use, distribution or reproduction in other forums is permitted, provided the original author(s) and the copyright owner(s) are credited and that the original publication in this journal is cited, in accordance with accepted academic practice. No use, distribution or reproduction is permitted which does not comply with these terms.
*Correspondence: Fuyan Ke, a2VmeTIwMjBAMTYzLmNvbQ==
Disclaimer: All claims expressed in this article are solely those of the authors and do not necessarily represent those of their affiliated organizations, or those of the publisher, the editors and the reviewers. Any product that may be evaluated in this article or claim that may be made by its manufacturer is not guaranteed or endorsed by the publisher.
Research integrity at Frontiers
Learn more about the work of our research integrity team to safeguard the quality of each article we publish.