 Dawei Wang1,2,3
 Yanbin Ma
 Lili Li
- 1College of Earth Science and Engineering, West Yunnan University of Applied Sciences, Dali, China
- 2College of Geography and Environmental Science, Northwest Normal University, Lanzhou, Gansu, China
- 3College of Geography and Environmental Science, Northwest Normal University, Research Center of Wetland Resources Protection and Industrial Development Engineering of Gansu Province, Lanzhou, China
- 4Grassland Workstation, Wuwei, China
- 5Northwest Institute of Eco-Environment and Resources, Chinese Academy of Sciences, Lanzhou, China
Water use efficiency (WUE), as an important parameter of ecosystem carbon-water cycle, is an important index to assess vulnerability to extreme drought events. However, little was known about the corresponding cumulative and lagged responses of WUE to drought in the dry and hot valleys of Southwest China. This region is covered by alpine-valley landscapes, fragmented topographic features, Foehn Effect, where drought response mechanisms are not yet fully understood. This study analyzed the spatial-temporal variation of WUE from 2000 to 2020 in Binchuan (BC) and Yuanmou (YM) regions and the time-lag and -accumulation effects of 12 monthly self-calibrating Palmer Drought Index (scPDSI) on the WUE. Given the variability of vegetation types, land use/cover change data was used to investigate the variability of WUE between the two areas. Subsequently, the Pearson Correlation coefficient (Pearson, R) analysis, considering the influence of drought on time-lag and -accumulation effects, was used to analyze the response mechanism of water use efficiency to scPDSI in BC and YM comparatively. The results show that (1) From 2001 to 2020, BC’s average annual WUE was 2.59 gC m−2 mm−1, and YM’s was 2.84 gC·m−2·mm−1, with similar spatial distributions. (2) Over the past 2 decades, BC’s WUE increased steadily at a rate of 0.012 gC m-2 mm−1 a−1, while Yuanmou’s WUE grew at 0.0082 gC m-2 mm−1 a−1. (3) The lag response of WUE to drought is minimal in both regions, with BC’s cultivated land showing greater sensitivity to drought than YM. (4) The cumulative effect of drought on WUE across different land uses in both BC and YM is generally small, with the lowest sensitivity in forest land to drought.
1 Introduction
Drought, a complex and pervasive natural disaster (Ukkola et al., 2020; Xu et al., 2024), profoundly impacts vegetation and ecosystems, with severe events potentially altering niche thresholds and carbon-water balances (Zhang et al., 2022; Lili et al., 2023). It is defined as a condition of water scarcity where demand exceeds supply (Bradford et al., 2020; Zhao et al., 2020; Jiao et al., 2021). The scPDSI judged the water surplus and deficit by comparing local water demand with actual precipitation, and analyzing regional water supply variations (Zhao et al., 2023; Sun et al., 2020). China is one of the countries most severely affected by drought, with an average of 21.57 × 10⁴ km2 affected between 1950 and 2008 (Hao et al., 2015; Wei et al., 2020). Southwest China, influenced by South Asian monsoons and the Tibetan Plateau climate, experiences frequent severe droughts (Dong et al., 2014; Xu et al., 2024). Notable drought years include 2005, 2006, 2013, and 2023, along with prolonged spring droughts observed in 2010 and 2023 (Jiang et al., 2022). Global warming is expected to increase the frequency and intensity of droughts, heightening ecosystem vulnerability (Wang et al., 2013). Therefore, an in-depth understanding of the effects of drought on the carbon and water budgets of terrestrial ecosystems in southern China is essential for establishing a comprehensive natural hazard and ecological risk monitoring system.
WUE is an essential indicator for revealing the spatial and temporal variability of carbon and water cycles in terrestrial ecosystems, which is defined as the ratio of carbon sequestration to water consumption (Cristiano et al., 2020; Du et al., 2023; Guo et al., 2023).
Climatic, physiological, and vegetation factors significantly shape the water cycle and carbon assimilation, the spatial and temporal patterns of WUE likely aligning with these influences and climate responses (Jiang et al., 2022; Law et al., 2001; Yang et al., 2019). Water, essential for ecosystem function, drives plant growth and development, and its spatial variability causing distinct patterns in vegetation distribution and productivity (Li LL. et al., 2024). Global warming and drying, alongside increased CO2 concentrations, affect temperature, photosynthesis, and transpiration, impacting carbon and water cycles and altering WUE (Anderegg et al., 2015; Wang et al., 2023). Mild water stress enhances plant WUE by inducing stomatal closure and lowering transpiration (Liu et al., 2017). However, extreme droughts pose significant threats to ecosystem health and stability, leading to a decrease in WUE (Law et al., 2001; Reichstein et al., 2002). In dry and hot valleys, evaporation rates are typically over three times that of precipitation, as a result, vegetation faces drought and heat stress even during the rainy season especially in southwest China (Wang et al., 2022). The analysis of the carbon-water coupling of the scPDSI and vegetation reveals plant adaptation strategies to drought, guides sustainable water resource management, and highlights the ecological impacts of drought in these regions.
In the context of climate and vegetation-driven constraints, time effects become an inescapable phenomenon, including time lags and accumulation (Ma et al., 2022). Climate change can exceed the adaptive capacity of vegetation, leading to delayed vegetation responses to such variations. For instance, drought can have a lingering effect on tree growth, reducing it and causing impacts that can persist for 1–4 years post-drought (Anderegg et al., 2015; Wen et al., 2018). Peng et al. (2019) identified strong cumulative and delayed effects of drought in the Northern Hemisphere on autumn leaf senescence, with more pronounced impacts observed at higher drought intensities. Li et al. (2021) highlighted distinct time-lag effects between NDVI and climate factors among plateau land types, illustrating a complex relationship with environmental conditions. Accurately assessing the consequence of climate change on vegetation is vital for formulating effective, sustainable restoration plans. Yet, the role of extreme climate events, along with the important dynamics of time lags and cumulative impacts on plant life, is often underestimated (Müller and Bahn, 2022; Yuan et al., 2024). Such oversights may skew our understanding of how climate change shapes vegetation patterns (Li L. et al., 2024; Ji et al., 2023). To fully understand how vegetation behaves and responds to climate, it is essential to consider the temporal effects of drought, including time lags and cumulative impacts ((Anderegg et al., 2015; Piao et al., 2020; Li et al., 2021), particularly in the dry-hot valley region of southwest China.
The dry-hot valleys along China’s Jinsha River in the southwest, spanning over 2,000 km2, are significantly impacted by soil erosion and environmental degradation, mainly in Yunnan, Sichuan, and Guizhou provinces (Qiao et al., 2022; Huang et al., 2017). BC and YM are located within the ecologically sensitive dry-hot valley of the Jinsha River, where they are faced with analogous natural and anthropogenic stressors.The water infrastructures of BC and YM are markedly different, while BC completed the “Yin-Bin” irrigation project in 1994, the system in YM remains under development (Zhao et al., 2023). However, the complex mechanisms underlying the carbon-water coupling dynamics of the valley’s vegetation under different irrigation regimes and their responses to drought have not been thoroughly investigated. This is especially significant due to the theoretical insights for agricultural practices in the dry-hot valleys of the southwestern region, where it is essential to understand how vegetation reacts to drought as a result of climate change.
This study addresses this gap by utilizing MODIS products (at a spatial resolution of 500 m)and scPDSI (a spatial resolution of 0.5) to analyze nearly 2 decades of springtime carbon-water coupling fluctuations and their reactions to the spatiotemporal patterns of drought in BC and YM, Yunnan Province. The research aimed to investigate the following questions: (1) What are the temporal and spatial variations in WUE between BC and YM in the Southwest Dry-Hot Valley? (2) What is the lag effect of WUE on drought sensitivity in BC and YM, as indicated by the standardized precipitation index for the scPDSI? (3) How does the cumulative effect of WUE on drought sensitivity vary across different land uses in BC and YM? The results clarify how vegetation WUEreacts to drought in the context of climate change and the water utilization strategies employed in these dry-hot valleys. This study contributes to a better understanding of vulnerability to extreme drought events in the dry and hot valleys of southwest China and provides insights into the differential response mechanisms of WUE to drought between BC and YM, which are critical for global change biology and the development of strategies to mitigate the effects of drought on ecosystems in these regions.
2 Materials and methods
2.1 Study area
The study area for this research includes Binchuan County and Yuanmou County. Binchuan County is located in the Dali Bai Autonomous Prefecture, Yunnan Province (100°16′∼100°59′E, 25°23′∼26°12′N), on the edge of the Yunling mountain range, part of the southwestern Yunnan-Guizhou Plateau along the southern bank of the Jinsha River. The highest altitude point is at the summit of Mu Xiang Ping in the northwest (3,320 m), and the lowest point is where the Yupao River meets the Jinsha River (1,104 m). The mean annual temperature is 17.9°C, with an annual precipitation of 559.4 mm and the annual sunshine duration is 2,719.4 h.Yuanmou County is located in the northern part of the Chuxiong Yi Autonomous Prefecture, Yunnan Province (101°35′∼102°06′E, 25°23'∼26°06′N), in the northern part of the central Yunnan Plateau. The highest altitude point is at the mountain of Da Ying Pan in Jiangbian Township (2,835.9 m), and the lowest point is in the northeast of Heize Village, Jiangyi Township, where the Jinsha River exits (898 m) (Figure 1). The mean annual temperature is 22.6°C, with an annual precipitation of 637.5 mm and the annual sunshine duration is 2,183.8 h. Both regions share a valley terrain, characterized by low precipitation, abundant solar radiation, and external airflows obstructed by mountain ranges. Additionally, due to the relatively enclosed nature of the valleys, heat at the bottom is not easily dissipated, resulting in a “Foehn effect,” ultimately forming a dry and hot valley climate (Yu et al., 2019). In recent years, thanks to the successful completion of the Erhai-to-Binchuan water diversion project, Binchuan County has seen significant improvements over Yuanmou County in areas such as vegetation growth and water quality deterioration.
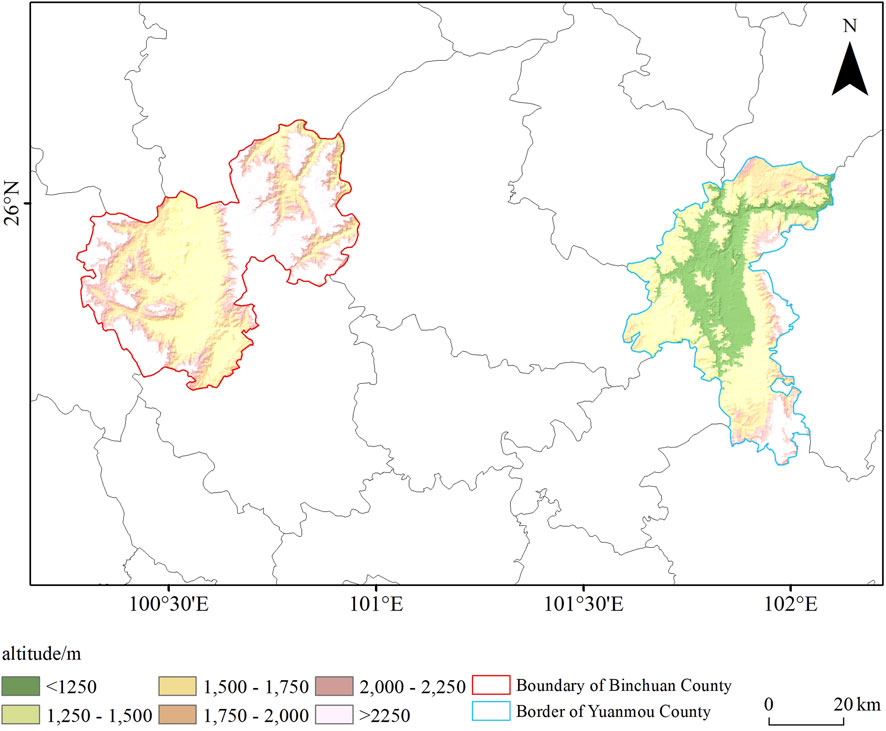
Figure 1. Elevation distribution of BC and YM.
2.2 Data acquisition and processing
2.2.1 Remote sensing data
The GPP and ET data utilized were procured from the MODIS series (MOD17A2, MOD16A2) (https://www.earthdata.nasa.gov/), products released by the (National Aeronautics and Space Administration (NASA), with a spatial resolution of 500 m and a temporal resolution of 8 days, spanning the period from 2001 to 2020.The GPP data were calculated based on the radiation use efficiency algorithm, with the specific calculation details outlined by Running et al. (2004). The ET data were calculated based on the Penman-Monteith equation, which considers three processes comprehensively: soil surface evaporation, evaporation of intercepted precipitation by the canopy, and plant transpiration. Further details may be found in (Mu et al. (2011). All of the aforementioned products were processed using the MRT (Modis Reprojection Tool) software for batch splicing, clipping, and projection transformation of MODIS data. The reprojected data were then synthesized every month basis and clipped to the BC and YM. The MODIS GPP and ET product data have been validated in multiple studies using flux tower site data from various regions around the world, and their accuracy has been confirmed (Zhao et al., 2005; Jia et al., 2012; Chen et al., 2017; Wang et al., 2019).
2.2.2 scPDSI
The scPDSI is derived from the Global Gridded Drought Index dataset, which is provided by the Climatic Research Unit of the University of East Anglia in the Uited Kingdom (https://crudata.uea.ac.uk/). The data has a spatial resolution of 0.5 ° × 0.5 ° and a temporal resolution of monthly, spanning the years 2001–2020. For further details on the scPDSI algorithm (Table 1), please refer to the paper by Liu et al. (2017). To ensure consistency in spatial resolution, elevation information was employed as a covariate, and a variable difference method was used with the Aunsplin4.2 software to obtain monthly scPDSI data for BC and YM that aligned with the pixel size and projection of the MODIS data. It has been demonstrated in previous studies that data interpolated by the Aunsplin software is of high accuracy and reliability.
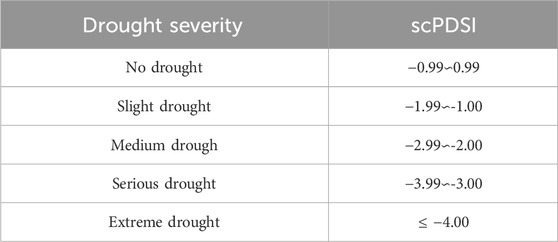
Table 1. scPDSI Drought severity.
Aunsplin model algorithm (Formula 1): Aunsplin adopts the local thin disk smooth spline method, and its theoretical statistical model is expressed as follows (1): where zi is the dependent variable located at point i in space; xi is the independent variable of d-dimensional spline; f is the unknown smooth function to be estimated about xi; yi is the independent covariate of p-dimensional; b is the p-dimensional coefficient of yi; ei is the independent random error with expectation 0 and variance wi; wi is the known local relative variation coefficient as weight, is the error covariance, and is constant at all data points.
2.2.3 Vegetation type data
The vegetation types and the classification scheme were derived from the 2020 Global 30 m Land Cover Product with Fine Classification (CLCFCS30-2020) (Zhang et al., 2021). In ArcGIS, the product was spatially resampled to a 1 km resolution equal latitude-longitude projection data that matched the NDVI using the nearest neighbor method, and adjacent vegetation types were merged (Figure 2). Based on the vegetation classification scheme, the l in the study areas are categorized into six types: forest, cropland, grassland, water body, and artificial surface.
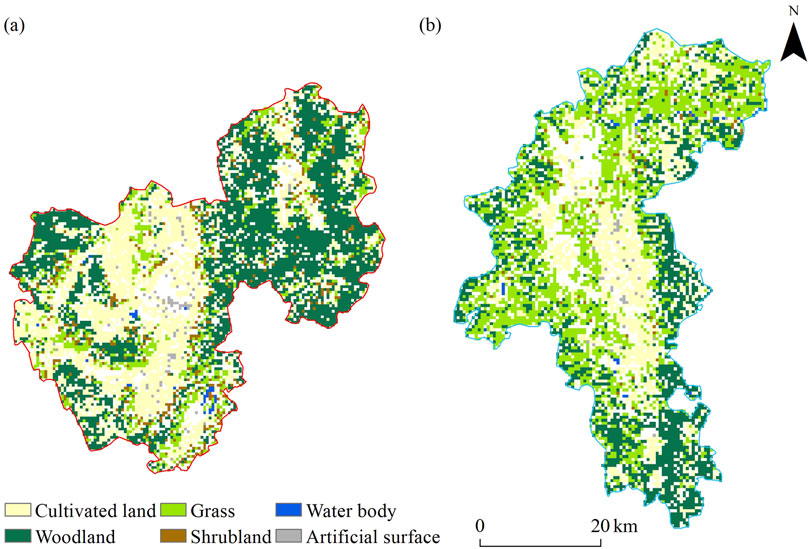
Figure 2. The land use types in BC differ from those in YM. (A) The land use types in BC; (B) The land use types in YM.
2.3 Calculation of WUE
WUE is assessed by calculating the ratio of GPP to ET within an ecosystem (Hu et al., 2009). The calculation formula remains unchanged as follows (Formula 2):
where WUE is the WUE per unit time (g C m−2 mm−1); GPP is the total primary productivity of vegetation ecosystem per unit time (gC m−2); ET is the evapotranspiration of vegetation ecosystem per unit time (mm).
2.4 Methods
2.4.1 Trend analysis
In the entire study region, based on each pixel, used a univariate linear regression analysis to simulate the WUE from 2001 to 2020, obtaining the trend of change for the three, with the calculation formula as follows (Formula 3) (Wang et al., 2023):
where n represents the number of years in the time period (n = 20),
2.4.2 Lag effect of scPDSI on WUE
The Pearson correlation was selected due to its simplicity and effectiveness in measuring linear relationships, which is appropriate for the research context where we expect linear relationships to exist. The Pearson correlation coefficient (R) is employed to investigate the lagged effects of drought on grassland GPP (Lu et al., 2023). The coefficient ranges from -1-1, representing the transition from negative to positive correlations. To ensure comparability, the study utilizes monthly WUE and 1-month scPDSI data for BC and YM from 2001 to 2020. Monthly WUE is combined with scPDSI data from up to 12 previous months (0 ≤ i ≤ 12) to create a series. The R value is then calculated for each pixel at each lag, resulting in 12 correlation coefficients (Formula 4). For instance, a 3-month lag involves correlating monthly WUE data from January to July (2001–2020) with scPDSI data from April to October (2001–2020), and this process is repeated for up to a 12-month lag.
Finally, the maximum correlation coefficient Rmax_lag is selected, and the corresponding lagging month is regarded as the lagging effect size and time scale of the pixel (Formula 5). When the Rmax_lag lagging effect occurs between the monthly WUE and the 1-month scPDSI in April, the WUE lagging response time scale to scPDSI is recorded as 4 months, indicating that the drought conditions 4 months prior have a key impact on the changes in WUE.
where WUE represents the monthly time series from 2001 to 2020 with an i-month lag, scPDSI is the 1-month scPDSI time series with an i-month lag, and R is the Pearson correlation coefficient with an i-month lag.
2.4.3 Accumulation effect of scPDSI on WUE
To quantify the accumulation impact of early drying on grassland WUE, the Pearson correlation coefficient between monthly WUE and accumulation scPDSI was used to obtain the scPDSI time scale corresponding to the maximum correlation (Lu et al., 2023). Unlike the lag effect using only scPDSI, it takes 0–12 months of scPDSI to calculate the accumulation effect. Therefore, the correlation was determined using the scPDSI dataset and WUE pixel values from 1–12 months between 2001 and 2020.
Firstly, correlate the WUE time series with the m-month scale scPDSI time series (0 ≤ m ≤ 12) and calculate R (Formula 6). Then, the accumulation months of scPDSI with the highest correlation with WUE, Rmax_comc, are considered as the time scale of accumulation effects (Formula 7), and Rmax_comc is determined as the accumulation effect quantity. For example, if the correlation between monthly WUE and 3-month scPDSI is the highest, then the time scale of accumulation effects is recorded as 3 months, indicating that the accumulated 3-month drought conditions before the current month have the greatest impact on WUE.
where m is the accumulation time scale of scPDSI, mscPDSI is the scPDSI time series with m accumulation months, and Rm is the Pearson correlation coefficient between WUE and mscPDSI.
3 Results
3.1 Temporal-spatial patterns of WUE
3.1.1 Spatial characteristics of WUE
The spatial distribution and trend of WUE in BC and YM from 2001 to 2020 are shown in Figure 3.Revealed that the average annual WUE values in BC ranged from 1.25 to 3.33 gC m−2 mm−1, while in YM, they ranged from 1.75 to 3.71 gC m−2 mm−1. The spatial distributions in both regions were similar, with WUE exhibiting significant spatial heterogeneity within each region. In BC, high WUE values were predominantly found at altitudes above 2,000 m, where WUE exceeded 2.5 gC m−2 mm−1, accounting for approximately 28.59% of the county’s total vegetated area. Because the vegetation type in the high altitude area of BC is mainly forest land, and the WUE of forest land is high, WUE in high altitude areas is higher than that in low altitude areas (Wang et al., 2023). In contrast, YM exhibited high WUE values primarily in areas below 2,000 m, with WUE exceeding 2.25 gC m−2 mm−1 and accounting for approximately 88.51% of the county’s total vegetated area. This is due to the influence of human activities on the high altitude area of YM (Di et al., 2006), which results in lower WUE compared to flat terrain areas. From 2001 to 2020 the WUE in BC and YM showed an increasing trend, the increasing rate of WUE was 0.012 gC m−2 mm-1 a−1 and 0.008 gC m−2 mm−1 a−1, respectively. YM showed no significant increase trend, accounting for 76.02% of the total vegetation area in YM, but a large area increased significantly in the southeast of YM.
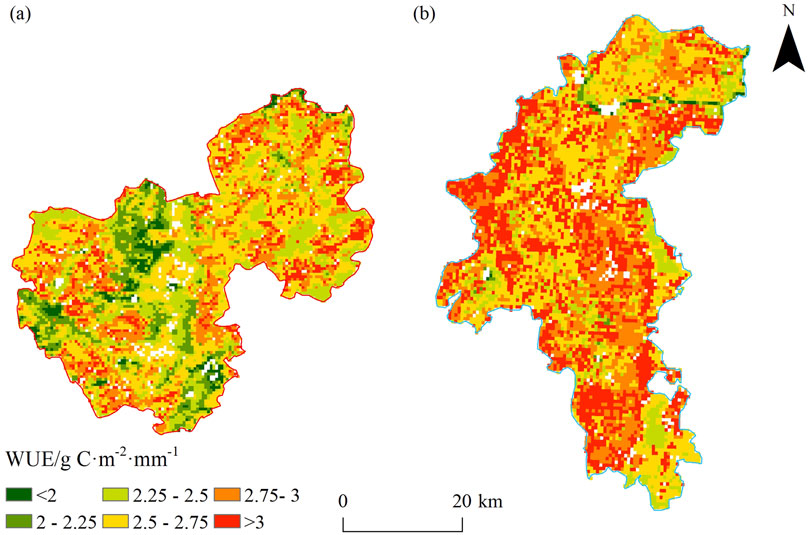
Figure 3. Mean WUE in BC and YM in the past 20 years. (A) Mean WUE in BC; (B) Mean WUE in YM.
Among the four land use types in BC and YM (Tables 2, 3), the average WUE value of forestland in BC is the highest, which is 2.68 gC m−2 mm−1, and the average WUE value of grassland is the lowest, which is 2.57 gC m−2 mm−1; YM is different from BC, and the average WUE value of cropland is the highest, which is 2.89 gC m−2 mm−1, and the average WUE value of shrubland is the lowest, which is 2.75 gC m−2 mm−1. In different land use types, the change rate of vegetation WUE in the two areas has obvious differences, but all show an increasing trend. As shown in Table 3, the highest average WUE growth rate in BC is grassland (0.0148 gC m−2 mm−1 a−1), followed by shrubland (0.0144−gC m-2 mm−1 a−1), and cropland (0.0116 gC m−2 mm−1 a−1), the lowest growth rate of WUE was forestland, the average growth rate was 0.0099 gC m−2·mm−1 a−1. In YM, the land use type with the highest WUE average growth rate was forestland (0.0087−gC m-2 mm−1 a−1), followed by grassland (0.0081 gC m−2 mm−1 a−1), shrubland (0.0070−gC m−2 mm−1 a−1), and cropland (0.0060−ggC m-2 mm−1 a−1). Generally speaking, the growth rate of different land use types in BC is higher than that in YM.

Table 2. WUE of different land use types in BC and YM in the past 20 years.

Table 3. Annual WUE growth rate of different land use types in Binchuan County and Yuanmou County in recent 20 years.
3.1.2 Temporal variation characteristics of WUE
During 2001–2020, the interannual variation of WUE in BC and YM fluctuates obviously, but the overall trend is downward (Figure 4). The annual average WUE value of BC and YM is the largest in 2012, 2.81 gC m−2 mm−1 and 3.08 gC m−2 mm−1 respectively; the annual average WUE value of BC and YM is the smallest in 2016, 2.32 gC m−2 mm−1 and 2.58 gC·m−2 mm−1 respectively; The average WUE values of YM and BC during the past 20 years were 2.84 gC m−2 mm−1 and 2.59 gC m−2 mm−1, respectively. This indicated that the two regions at the same latitude lost 1 mm of water through evapotranspiration at the same time, and the amount of CO2 fixed by vegetation in YM was 0.25 g more than that in BC. In BC, the water stress of vegetation decreased at a rate of 0.012 gC m−2 mm−1, and YM also decreased at a rate of 0.008 gC m−2 mm−1, which was slightly lower than that of BC. This indicated that the water stress of vegetation in BC was obviously improved due to the existence of “introducing Erhu into BC,” which changed the water use strategy of vegetation in BC.
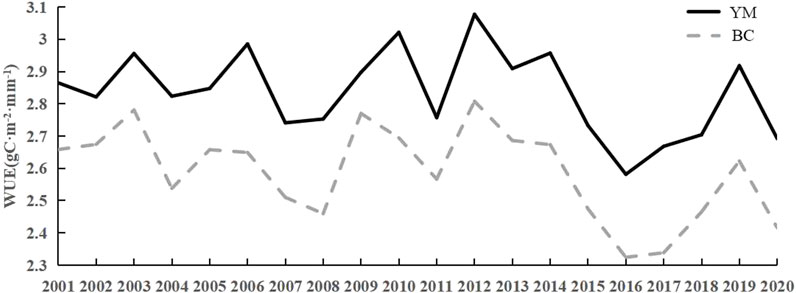
Figure 4. Interannual variations in WUE from 2001 to 2020 in BC and YM.
The WUE of the two places fluctuates and decreases in general within a year, with the average WUE of YM being 2.83 gC m−2 mm−1 and BC being 2.58 gC m−2 mm−1 (Figure 5); during 2001–2020, the WUE of the two places increases from August to April of the next year, and the WUE values of the two places are generally higher due to the influence of water stress from January to April, among which the WUE of BC reaches the annual peak value of 3.15 gC·m−2 mm−1 in April; From August to December, affected by the decrease of precipitation, the vegetation water use strategy changed, among which WUE in YM reached the annual peak value of 4.02 gC m−2 mm−1 in October; From May to July, the precipitation in YM decreased, and July was the peak of precipitation in both places. Under the condition of sufficient water, vegetation growth was no longer restricted by soil water content, and soil ineffective evapotranspiration increased. Therefore, WUE in July was the lowest value of the whole year, among which, YM was 2.23 gC m−2 mm−1, BC was 2.08 gC m−2 mm−1. From the overall mean value of the two places, WUE in YM was generally higher than that in BC.
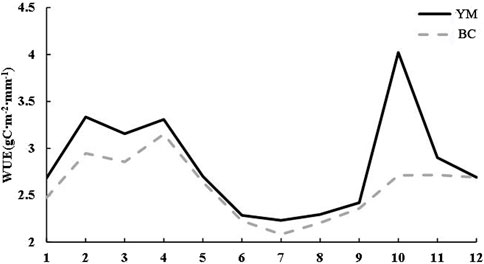
Figure 5. Intra-annual variations in WUE from 2001 to 2020 in BC and YM.
3.2 Lag effects of scPDSI on WUE
In BC and YM, the lag effect of scPDSI on WUE accounts for 13.41% and 13.29% of the positive correlation area, respectively, while the negative correlation area accounts for 86.59% and 86.71% respectively (Figure 6). The lag effect of scPDSI on WUE in BC is negative correlation, but there is a large positive correlation area in the northeast; YM is similar to BC, and also negative correlation, but there is a large positive correlation area in the south of Yangjie Town. By comparing the spatial distribution characteristics of the month with the maximum lag effect in the two regions (Figure 7), it can be found that about 81.58% of the vegetation in BC responds to drought with a time lag of 0–2 months, while about 64.74% of the vegetation in YM shows a time lag response in the same period. These results indicate that vegetation in BC is more sensitive to drought than that in YM.
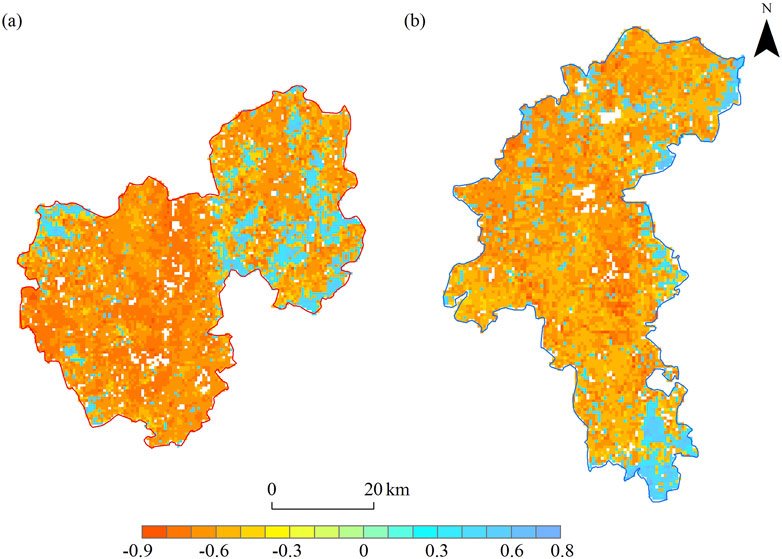
Figure 6. Maximum correlation coefficient of hysteresis effect between BC and YM. (A) Maximum correlation coefficient of hysteresis effect in BC; (B) Maximum correlation coefficient of hysteresis effect in YM.
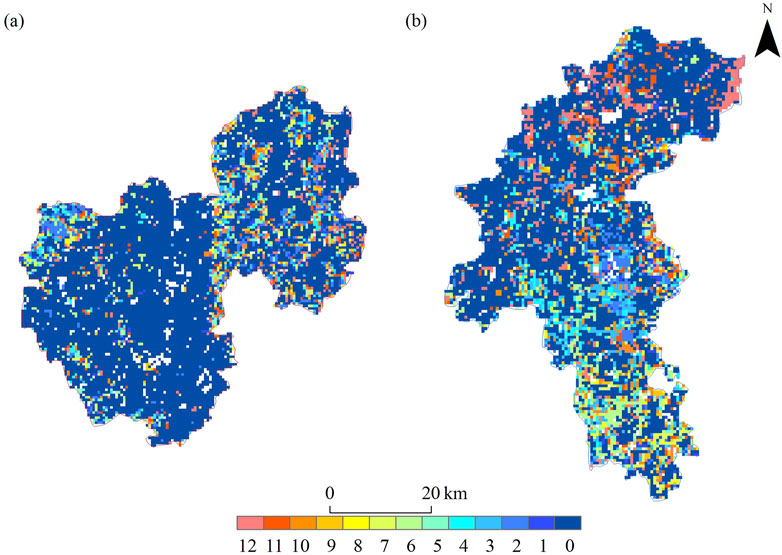
Figure 7. The maximum correlation coefficient of the lag effect in BC and YM corresponds to the number of lag months. (A) The maximum correlation coefficient of the lag effect in BC corresponds to the number of lag months; (B) The maximum correlation coefficient of the lag effect in YM corresponds to the number of lag months.
Further analysis of the vegetation area showing lag effects in the two regions shows that there are significant differences in the lag time scale and lag effect intensity of different vegetation types on drought (Table 4). In BC, the main lag time of WUE affected by drought was 0 months, but in YM, the lag time of WUE affected by drought was 2–4 months. For forestland, the main lag time in BC is 0–2 months, while in YM it is 0 months, but there are also lag times of 6–7 months and 11–12 months. The lag effect intensity of drought on the four land use types in the two regions was mainly negative, but in the forestland of BC and YM, there was a large area of positive effect, of which the positive effect area accounted for 28.59% in BC and 24.09% in YM. Because both areas belong to dry-hot valley climates, vegetation is subjected to long-term water stress and has a strong memory effect on drought, so short-term drought has relatively little effect on vegetation WUE (Keersmaecker et al., 2015).
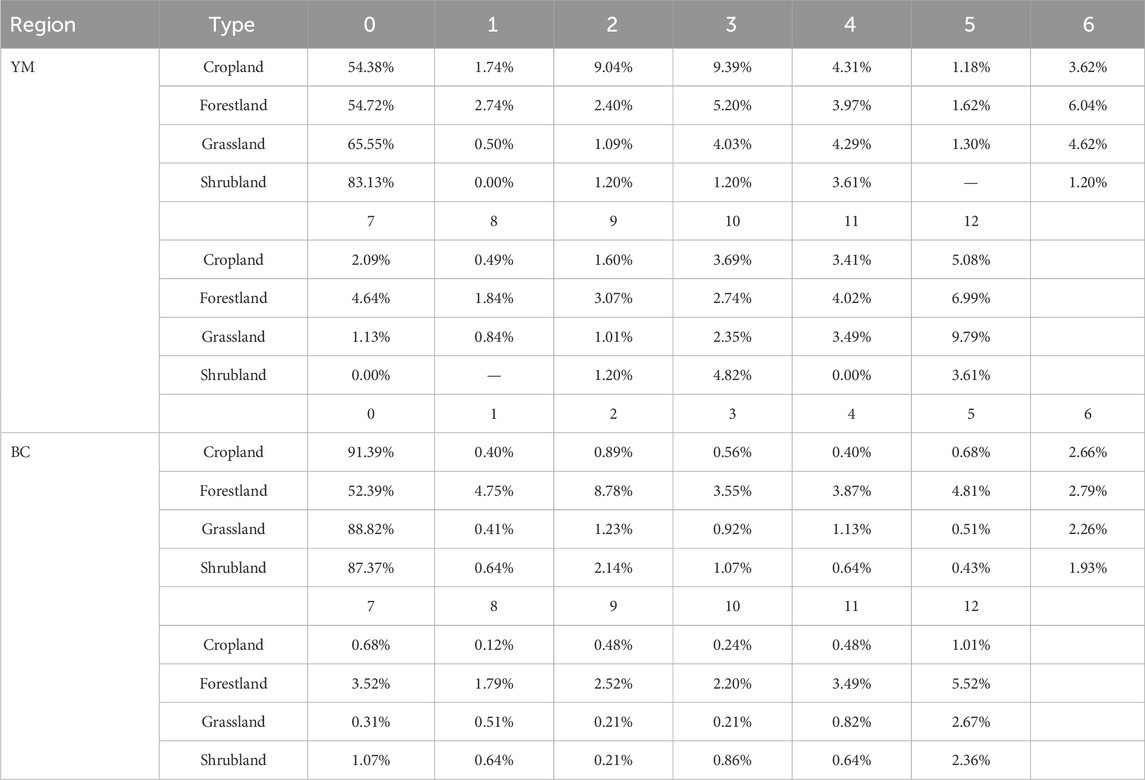
Table 4. Proportion of the area of lagging months for different land use types.
3.3 Accumulation effects of drought on WUE
In BC and YM, the accumulative effect of scPDSI on WUE accounted for 12.38% and 8.03% of the positive correlation area, respectively, while the negative correlation area accounted for 87.62% and 91.97% respectively. On the whole, the high-value areas of Rmax_acc in the BC are mainly concentrated in the northeast of the region, and the high-value areas of Rmax_acc in YM are mainly concentrated in the southeast of the region; the areas with negative correlation distribution are the same in both places, and they are both concentrated in relatively gentle areas (Figure 8). The accumulative effect of scPDSI on WUE was negatively correlated in both regions because of the abundant water resources and the relatively small impact of drought on vegetation. Further analysis of the cumulative effect areas in the two regions (Figure 9) shows that the cumulative effect of 0-month scale is the most significant in both places, accounting for 81.93% in BC and 77.75% in YM; meanwhile, the cumulative effect of 12 months scale in both places also accounts for a large proportion. This indicates that vegetation in the two regions is sensitive to short-term drought, but due to the existence of water replenishment projects, the impact of drought on local vegetation growth needs a long time to accumulate.
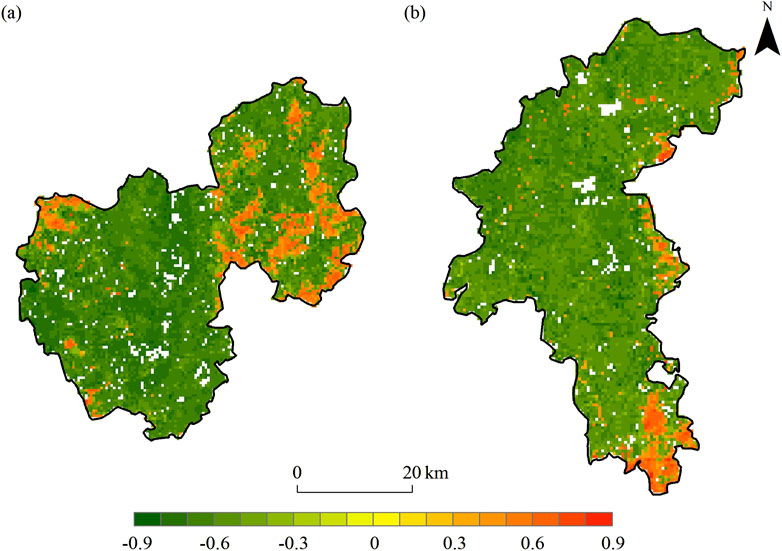
Figure 8. Maximum correlation coefficient of accumulation effects between BC and YM. (A) Maximum correlation coefficient of accumulation effects in BC; (B) Maximum correlation coefficient of accumulation effects in YM.
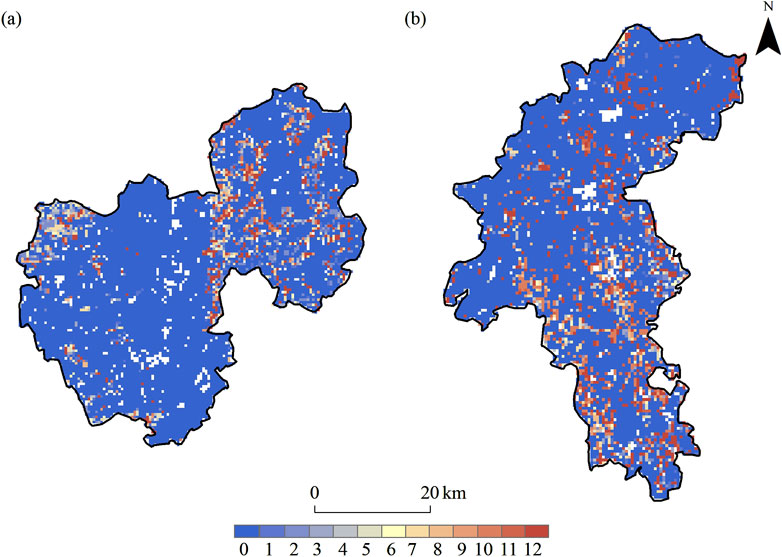
Figure 9. The maximum correlation coefficient of the accumulative effect between BC and YM corresponds to the number of lag months. (A) The maximum correlation coefficient of the accumulative effect in BC corresponds to the number of lag months; (B) The maximum correlation coefficient of the accumulative effect in YM corresponds to the number of lag months.
In BC and YM, there were significant similarities in cumulative time scale and cumulative effect and lag effect of drought among different land use types in the cumulative effect area. The land use types of the two regions generally show cumulative effects of 0 months on different cumulative time scales, and among the four land use types, the cumulative area proportion of 0 months is generally slightly higher than the lag effect of 0 months (Table 5). In BC, the main cumulative time scale of the other three land use types was 0 months except for forestland, which was 0–2 months. In YM, the main cumulative time scale of cropland is 0 months, but there is also a certain distribution in 10–12 months; the main cumulative time scale of forestland is also 0 months, but there is a large area of cumulative effect in 12 months; the cumulative time scale distribution of the remaining two land use types is similar to cropland, mainly 0 months, and a small amount of distribution in 10–12 months. The cumulative effects of drought on the four land use types in the two areas were negative on the whole. However, there were large areas of positive effects in the forestland of BC and YM, among which the positive effect area accounted for 29.12% in BC and 20.57% in YM.
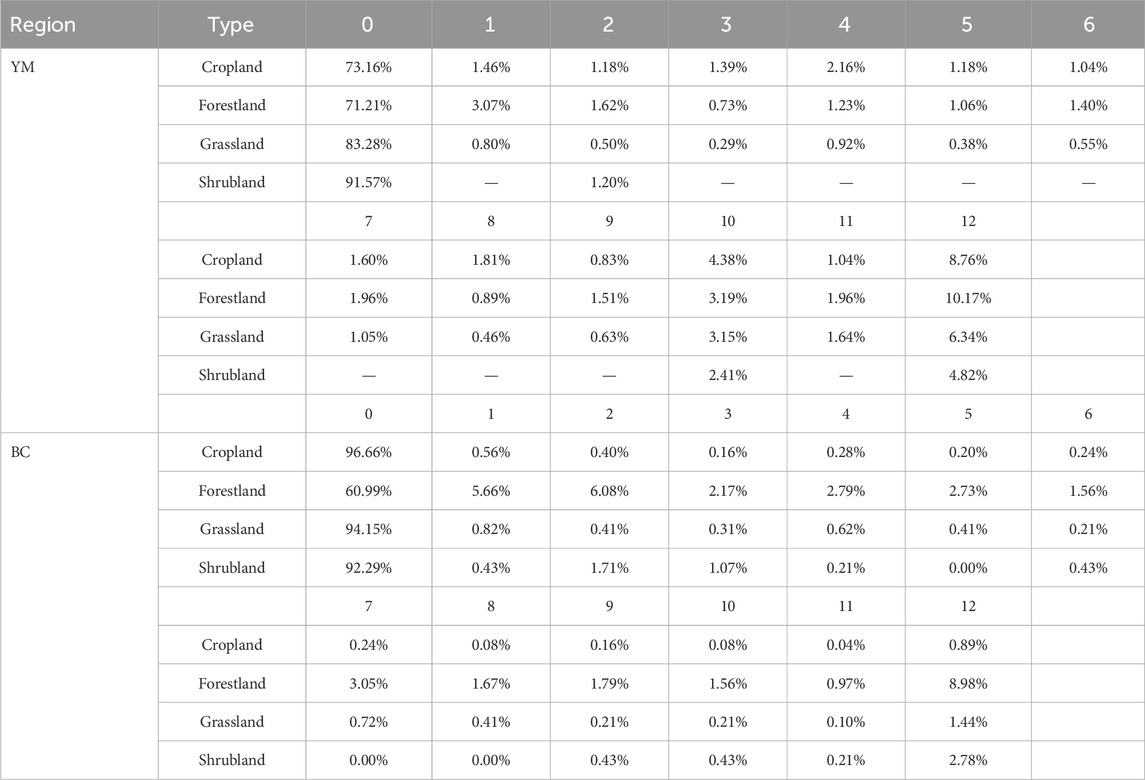
Table 5. The portion of the cumulative monthly area of different land use types.
4 Discussion
4.1 Temporal-spatial characteristics of WUE in BC and YM
BC and YM, located in the dry-hot valley zone of the Jinsha River Basin, exhibit similarities in geomorphology, vegetation, and climate. While WUE (WUE) is increasing in both BC and YM, the rise is not significant. BC water projects have improved soil moisture, increasing ET and reducing stomatal conductance, along with warmer temperatures, which has enhanced vegetation’s carbon sequestration and WUE (Li, 2018). In YM, stable soil moisture from natural watersheds and positive environmental feedback enhance vegetation WUE. Among the four land use types in BC, the highest WUE value is in high-altitude forests and the lowest WUE is in low-altitude grasslands. Forests possess high canopies, low resistance, strong vapor transport, and better interception than grasslands and farmlands (Yu et al., 2024), resulting in higher ET and WUE due to their complex structure, larger leaf area, and robust CO2 fixation. In the YM region, cropland demonstrates the highest WUE, while shrubland shows the lowest. The central area, characterized by flat terrain and stable drainage basins, has good vegetation coverage and ample water sources, predominantly consisting of farmland and grassland. Human activities have expanded the cultivated area in the river valleys, leading to a complex crop structure and enhanced plant carbon fixation capacity. As a result, WUE in this area is higher than in other regions (Yu et al., 2019). The changes emphasize the importance of evaluating the impact of different land use types on WUE during drought mitigation and adaptive management. It is also crucial to apply effective vegetation management and strategies for distributing water resources.
Over the past 20 years,WUE of BC and YM have experienced a general decline, which can be attributed to warming and drying trends in the dry and hot valleys, coupled with inadequate water use regulation by vegetation due to climatic factors. In 2012, with rising temperatures and declining precipitation, WUE reached its maximum levels in BC and YM. However, the feedback mechanisms to drought differed. The “Yin-Bin” irrigation project at BC has significantly improved the water resource conditions, especially for agricultural irrigation, which plays a positive role in regulating the local climate and water cycle. In BC, suitable temperature promoted carbon fixation capacity, low precipitation made vegetation stomata small, and vegetation transpiration weakened, while water conservancy facilities reduced drought impact on the ecological environment, so WUE was still increasing and the value was the largest, including the period after 2012 (Zhang and Shan, 2002). The implementation of the irrigation project may have affected the transpiration and stomatal conductance of vegetation by increasing soil moisture, thereby affecting the WUE. In YM, drought stress aggravated vegetation water stress, water use formed memory and adaptation to drought, vegetation drought tolerance increased, resulting in increased CO2 content fixed by unit water, and WUE was the largest. After 2012, under the combined effect of overall temperature decrease and precipitation increase, drought stress weakened, but due to the memory effect of vegetation on drought, WUE continued to decrease, so the WUE of both regions showed the lowest value in 2016.
The inter-annual variation of WUE highlights the adaptation of vegetation water consumption and productivity to the natural environment and human intervention process, while the pattern of intra-annual variation can more intuitively reflect the adaptation of different vegetation types to seasonal changes (Wang et al., 2023; Li et al., 2003). Yunnan is located at the low latitude plateau, affected by monsoon climate and topography, the unique characteristics of dry valley climate, resulting in droughts high frequency and long duration in BC and YM, mainly concentrated in winter and spring (December to May of the next year). From November to April of the following year, the low ET caused by low precipitation, and relatively stable temperatures in BC and YM led to stable GPP. From May to July, influenced by the summer rainy season, precipitation increased significantly, stomatal conductance increased and transpiration enhanced, while the WUE decreased because of the weak carbon fixation capacity of vegetation at the development stage. From August to November, the influence of summer drought diminished as the warm and humid southwest airflow brought abundant moisture, alleviating drought conditions. Consequently, vegetation WUE in both regions exhibited an increasing trend from August through April of the following year.
4.2 Lagged effect of drought on WUE
After the drought event, the carbon-water coupling mechanism of the ecosystem remains affected by drought, leading to a “memory effect” in vegetation. The effect causes chaotic responses, resulting in multiple response states over an extended period, including lagged and cumulative effects on WUE that persist long after the drought. This memory effect may cause vegetation to exhibit varying adaptability and resilience to subsequent environmental changes, influencing its long-term water-carbon cycle and productivity (Ma et al., 2024; Sun et al., 2020). Pearson correlation analysis was employed to examine the relationship between scPDSI and WUE in BC and YM.
The lag effect of scPDSI on WUE in BC was 0 lag, and the largest cropland (91.39%), which is caused by the single planting structure of cash crops.The main cash crop in Binchuan is grapes, meaning that even small changes in water availability can lead to significant changes in productivity. This sensitivity is partly due to the fixed water consumption patterns and the high water demand during critical growth stages (Liu, et al., 2025). While, the longest lag (12 months) was forestland (5.52%), based on the strong water capacity, it is weaker to drought stress than cropland, grassland and shrubland, and forestland (Müller and Bahn, 2022; Yu et al., 2019).
YM, the land type with 0 hysteresis between scPDSI and WUE, was mainly shrubland (83.13%). The vegetation structure in this area is single, the vertical difference is significant, and the soil loss at high altitudes is serious. Thus, shrublands’ WUE is highly sensitive to drought feedback (Cristiano et al., 2020; Jiang et al., 2022). While, longest lag (12 months) was (9.79%) farmland, which is due to the complex agricultural structure of Yuanmou County, in the process of environmental changes, the vegetation water utilization efficiency is remain stable (Du et al., 2023).
4.3 Accumulation effect of drought on WUE
The response mechanism of WUE to drought was significantly different among different land use types, and the effects of water stress on vegetation growth were persistent and cumulative. Cumulative effect can reflect the continuous influence of drought on vegetation growth from beginning to end, and comprehensively consider the interaction between WUE and drought of different land use types (Liu et al., 2017; Lu et al., 2023; Wen et al., 2019). In BC the most significant cumulative effects of scPDSI on WUE was cropland with 0-accumulation (91.39%),and the forestland with the longest feedback time for cumulative effects is forestland, which is consistent with the lag- effects of scPDSI and WUE in this area (Müller and Bahn, 2022; Yuan et al., 2024). The weakest accumulation effect of scPDSI on WUE in BC is in forest land (5.52%), which was least affected by human activities, regulates its own ecosystems, and is less sensitive to drought than other land use types (Xu et al., 2019). The cumulative effect of scPDSI on WUE in YM was 0 accumulation and the largest area is shrubland (91.57%); the cumulative effect of scPDSI on WUE with 12 accumulation was forestland (10.17%).The cumulative effect of forestland on drought was weaker than that of cropland, which indicated that the cumulative feedback mechanism of cropland ecosystem to drought was less stable than that of forestland ecosystem under the influence of long-term drought. All the above shows that forestland shows low cumulative effects under drought, while the construction of artificial forests has a positive impact on improving soil water conservation and soil erosion, thereby enhancing the WUE stability and drought resistance of regional vegetation (Zhao et al., 2023). These findings have important implications for understanding and coping with drought effects in the biology of global change (Yang, 2007).
5 Conclusion
In this study, the GPP and ET products were based on MODIS, to estimate spatiotemporal variation of WUE in BC and YM from 2001 to 2020. Combined with scPDSI, the lag and accumulation effects of WUE on drought in BC and YM were analyzed. The main conclusions are as follows:
(1) From 2001 to 2020, the average WUE in BC was 2.59 gC m−2 mm−1, and the average WUE in YM was 2.84 gC m−2 mm−1. The spatial distribution of the two regions is similar, and the WUE in the area shows significant spatial heterogeneity.
(2) In the past 20 years, the trend of WUE changes in BC and YM has shown a slow increase, with a growth rate of 0.012 gC m−2 mm−1 a−1 in BC and 0.008 gC m−2 mm−1 a−1 in YM. However, the overall WUE in YM is higher than that in BC.
(3) The lag effect of WUE on drought in different land use types in BC and YM is mainly manifested as 0 lag. Due to the influence of agricultural structure, the sensitivity of cropland WUE to drought in BC is stronger than that in YM.
(4) The accumulation effect of WUE on drought in different land use types in BC and YM is mainly manifested as zero accumulation. The vegetation structure of forest land is stable, and the sensitivity of forest land to drought in both areas is the weakest.
Data availability statement
The original contributions presented in the study are included in the article/Supplementary Material, further inquiries can be directed to the corresponding author.
Author contributions
DW: Conceptualization, Methodology, Writing–review and editing, Writing–original draft. DJ: Data curation, Formal Analysis, Writing–original draft, Writing–review and editing. YZ: Writing–review and editing, Investigation, Methodology, Writing–original draft. XT: Investigation, Project administration, Writing–original draft. FH: Data curation, Formal Analysis, Writing–original draft. YM: Software, Validation, Writing–original draft. YG: Software, Supervision, Writing–original draft. JL: Writing–original draft. LL: Conceptualization, Funding acquisition, Resources, Writing–review and editing.
Funding
The author(s) declare that financial support was received for the research, authorship, and/or publication of this article. This research was jointly supported by the Yunnan Provincial Basic Research (202301AT070084 and 202301AT070085), Western Yunnan University of Applied Sciences Talent Introduction Research Initiation Project ((2023RCKY0001 and 2022RCKY0003).
Conflict of interest
The authors declare that the research was conducted in the absence of any commercial or financial relationships that could be construed as a potential conflict of interest.
Publisher’s note
All claims expressed in this article are solely those of the authors and do not necessarily represent those of their affiliated organizations, or those of the publisher, the editors and the reviewers. Any product that may be evaluated in this article, or claim that may be made by its manufacturer, is not guaranteed or endorsed by the publisher.
Supplementary material
The Supplementary Material for this article can be found online at: https://www.frontiersin.org/articles/10.3389/fenvs.2025.1493668/full#supplementary-material
References
Anderegg, W. R. L., chwalm, C., Biondi, F., Camarero, J. J., Koch, G., Litvak, M., et al. (2015). Pervasive drought legacies in forest ecosystems and their implications for carbon cycle models. Science 349 (624), 528–532. doi:10.1126/science.aab1833
Bradford, J. B., Schlaepfer, D. R., Lauenroth, W. K., and Palmquist, K. A. (2020). Robust ecological drought projections for drylands in the 21st century. Robust Ecol. Drought Proj. Dryl. 21st Century. Glob. Change Biol. 26 (7), 3906–3919. doi:10.1111/gcb.15075
Chen, X., Mo, X., Hu, S., and Liu, S. (2017). Contributions of climate change and human activities to ET and GPP trends over North China Plain from 2000 to 2014. J. Geogr. Sci. 27, 661–680. doi:10.1007/s11442-017-1399-z
Cristiano, P. M., Diaz Villa, M., De, D., Lacoretz, M., Madanes, N., and Goldstein, G. (2020). Carbon assimilation, water consumption and water use efficiency under different land use types in subtropical ecosystems: from native forests to pine plantations. Agric. For. Meteorology 291, 108094. doi:10.1016/j.agrformet.2020.108094
Di, B., Cui, P., Huang, S., and Yu, Y. (2006). Sediment yields and impact factors in xerothermic valley in Jinsha River in the last 50 years: a case study in Yuanmou County, Yunnan Province. oil Water Conserv (04), 20–24.
Dong, Y., Xiong, D., Su, Z., Li, J., Yang, D., Shi, L., et al. (2014). The distribution of and factors influencing the vegetation in a gully in the Dry-hot Valley of southwest China. CATENA 116, 60–67. doi:10.1016/j.catena.2013.12.009
Du, H., Fu, W., Song, T., Zeng, F., Wang, K., Chen, H., et al. (2023). Water-use efficiency in a humid karstic forest in southwestern China: interactive responses to the environmental drivers. J. Hydrology 617, 128973. doi:10.1016/j.jhydrol.2022.128973
Guo, X., Zhang, Y., Zha, T., Shang, G., Jin, C., Wang, Y., et al. (2023). Biophysical controls of dew formation in a typical cropland and its relationship to drought in the North China Plain. J. Hydrology 617, 128945. doi:10.1016/j.jhydrol.2022.128945
Hao, C., Zhang, J. H., and Yao, F. M. (2015). Combination of multi-sensor remote sensing data for drought monitoring over Southwest China. Int. J. Appl. Earth Obs. Geoinf. 35, 270–283. doi:10.1016/j.jag.2014.09.011
Hu, Z. M., Yu, G. R., Wang, Q. F., and Zhao, F. H. (2009). Ecosystem level water use efficiency: a review. Acta Ecol. Sin. 29 (3), 1498–1507.
Huang, L., He, B., Han, L., Liu, J., Wang, H., and Chen, Z. (2017). A global examination of the response of ecosystem water-use efficiency to drought based on MODIS data. Sci. Total Environ. 601-602, 1097–1107. doi:10.1016/j.scitotenv.2017.05.084
Ji, Y., Zeng, S., Tang, Q., Yan, L., Wu, S., Fan, Y., et al. (2023). Spatiotemporal variations and driving factors of China’s ecosystem water use efficiency. Ecol. Indic. 148, 110077. doi:10.1016/j.ecolind.2023.110077
Jia, Z., Liu, S., Xu, Z., Chen, Y., and Zhu, M. (2012). Validation of remotely sensed evapotranspiration over the hai River Basin, China. J. Geophys. Res. Atmos. 117 (D13). doi:10.1029/2011jd017037
Jiang, J., Su, T., Liu, Y., Wu, G., and Yu, W. (2022). Southeast China extreme drought event in August 2019: context of coupling of midlatitude and tropical systems. J. Clim. 35 (22), 7299–7313. doi:10.1175/JCLI-D-22-0138.1
Jiao, W., Wang, L., Smith, W. K., Chang, Q., Wang, H., and D’Odorico, P. (2021). Observed increasing water constraint on vegetation growth over the last three decades. Nat. Commun12 3777, 3777. doi:10.1038/s41467-021-24016-9
Keersmaecker, W. D., Lhermitte, S., Tits, L., Honnay, O., Somers, B., and Coppin, P. (2015). A model quantifying global vegetation resistance and resilience to short-term climate anomalies and their relationship with vegetation cover[J]. Glob. Ecol. Biogeogr. 24 (5), 539–548. doi:10.1111/geb.12279
Law, B. E., Thornton, P. E., Irvine, J., Anthoni, P. M., and Van Tuyl, S. (2001). Carbon storage and fluxes in ponderosa pine forests at different developmental stages. Glob. Change Biol. 7 (7), 755–777. doi:10.1046/j.1354-1013.00439.x
Li, L., Yang, Y., Wang, D., Ma, X., Du, J., Lu, R., et al. (2024b). Spatiotemporal variation of water use efficiency in response to self-calibrating Palmer drought severity index in Yulong Snow Mountain and surrounding areas, China. Chin. J. Ecol. 43 (6), 1841.
Li, L. L., Yang, Y. M., Wang, D. W., et al. (2024a). Spatiotemporal variation of water use efficiency in response to self-calibrating Palmer drought severity index in Yulong Snow Mountain and surrounding areas, China. Chin. J. Ecol. 43 (6), 1841–1850.
Li, P., Wang, J. L., Liu, M. W., Xue, Z., and Bagherzadeh, A. (2021). Spatio-temporal variation characteristics of NDVI and its response to climate on the Loess Plateau from 1985 to 2015. CATENA 203, 105331. doi:10.1016/j.catena.2021.105331
Li, R. S., Xu, H. C., Yin, G. T., Yang, C., and Li, S. Z. (2003). Advances in the water use efficiency of plant. For. Res. 16 (003), 366–371.
Li, Y. (2018). Impact assessment of trans water project in arid area on terrestrial vegetation in water diversion Area──Study case of the yinhajidang project. Northwest University.
Lili, L. I., Jun, D. U., Yahui, L. I., Mingkun, C. H. E. N., Binwen, W. A. N., and Dawei, W. A. N. G. (2023). Changes of vegetation water use efficiency and their responding to scPDSI in frozen ground area of the Qilian Mountains from 2000 to 2020. J. Glaciol. Geocryol. 45 (2), 688–698.
Liu, H., Gao, X., Li, C., Cai, Y., Song, X., and Zhao, X. (2025). Intercropping increases plant water availability and water use efficiency: a synthesis. Agric. Ecosyst. and Environ. 379, 109360. doi:10.1016/j.agee.2024.109360
Liu, Y., Zhu, Y., Ren, L., Singh, V. P., Yang, X., and Yuan, F. (2017). A multiscalar Palmerdrought severity index. Geophys. Res.Lett. 44, 6850–6858. doi:10.1002/2017GL073871
Lu, J. T., Peng, J., Li, G. , Guan, J., Han, W., Liu, L., et al. (2023). Aesessment of time-lag and cumulative elfects of drought on gross prmar productivity of grassland in Central Asia from 1982 to 2018. Acta Ecol. Sin. 43, 9745–9757.
Ma, Y., Guan, Q., Sun, Y., Zhang, J., Yang, L., Yang, E., et al. (2022). Three-dimensional dynamic characteristics of vegetation and its response to climatic factors in the Qilian Mountains. Catena 208, 105694. doi:10.1016/j.catena.2021.105694
Ma, Y., He, Q., Zhang, Y., Shi, Y., Li, J., and Yuan, F. (2024). Influences of climate factors and human activities on vegetation leaf area index dynamics in the Songliao River Basin. Acta Ecol. Sin. 44, 12043–2056.
Mu, Q., Zhao, M., and Running, S. W. (2011). Improvements to a MODIS global terrestrial evapotranspiration algorithm. Remote Sens. Environ. 115 (8), 1781–1800. doi:10.1016/j.rse.2011.02.019
Müller, L. M., and Bahn, M. (2022). Drought legacies and ecosystem responses to subsequent drought. Glob. Change Biol. 28 (17), 5086–5103. doi:10.1111/gcb.16270
Peng, J., Wu, C., Zhang, X., Wang, X., and Gonsamo, A. (2019). Satellite detection of cumulative and lagged effects of drought on autumn leaf senescence over the Northern Hemisphere. Glob. Change Biol. 25, 2174–2188. doi:10.1111/gcb.14627
Piao, S., Wang, X., Park, T., Chen, C., Lian, X., He, Y., et al. (2020). Characteristics, drivers and feedbacks of global greening. Nat. Rev. Earth Environ. 1, 14–27. doi:10.1038/s43017-019-0001-x
Qiao, Y., Liu, J., and Gong, X. (2022). Phylogeography of Himalrandia lichiangensis from the dry-hot valleys in Southwest China. Front. Plant Sci. 13, 1002519. doi:10.3389/fpls.2022.1002519
Reichstein, M., Tenhunen, J., Roupsard, O., Ourcival, J., Rambal, S., Miglietta, F., et al. (2002). Severe drought effects on ecosystem CO2 and H2O fluxes at three Mediterranean evergreen sites: revision of current hypotheses? Glob. Chang. Biol. 8 (10), 999–1017. doi:10.1046/j.1365-2486.2002.00530.x
Running, S. W., Nemani, R. R., Heinsch, F. A., Zhao, M., Reeves, M., and Hashimoto, H. (2004). A continuous satellite-derived measure of global terrestrial primary production. Bioscience 54 (6), 547–560. doi:10.1641/0006-3568(2004)054[0547:acsmog]2.0.co;2
Sun, X., Wang, M., Li, G., Wang, J., and Fan, Z. (2020). Divergent sensitivities of spaceborne solar-induced chlorophyll fluorescence to drought among different seasons and regions. ISPRS Int. J. Geo-Inf. 9, 542. doi:10.3390/ijgi9090542
Ukkola, A. M., De Kauwe, M. G., Roderick, M. L., Abramowitz, G., and Pitman, A. J. (2020). Robust future changes in meteorological drought in CMIP6 projections despite uncertainty in precipitation. Geophys. Res. Lett. 47, e2020GL087820. doi:10.1029/2020gl087820
Wang, D., Zhao, C., Fang, F., Lin, J., Li, L., and Yang, Y. (2023). Spatial-temporal dynamics of water use efficiency and responding to vapor pressure deficit in Shiyang River Basin, northwestern China. Acta Ecol. Sin. 43 (8), 3090–3102. doi:10.5846/stxb202111243322
Wang, X., Ma, M., Huang, G., Veroustraete, F., Zhang, Z., Song, Y., et al. (2019). Vegetation primary production estimation at maize and alpine meadow over the Heihe River Basin, China. China Int. J. Appl. Earth Obs. geoinf. 17, 94–101. doi:10.1016/j.jag.2011.09.009
Wang, Z., He, F., Fang, W., and Liao, Y. (2013). Assessment of physical vulnerability to agricultural drought in China. Nat. Hazards 67, 645–657. doi:10.1007/s11069-013-0594-1
Wang, Z., Liu, X., Zhou, W., Sinclair, F., Shi, L., Xu, J., et al. (2022). Land use intensification in a dry-hot valley reduced the constraints of water content on soil microbial diversity and multifunctionality but increased CO2 production. Sci. Total Environ. 852 (852), 158397. doi:10.1016/j.scitotenv.2022.158397
Wei, W., Pang, S., Wang, X., Zhou, L., Xie, B., Zhou, J., et al. (2020). Temperature vegetation precipitation dryness index (TVPDI)-based dryness-wetness monitoring in China. Remote Sens. Environ. 248 (2), 111957. doi:10.1016/j.rse.2020.111957
Wen, Y., Liu, X., Pei, F., Li, X., and Du, G. (2018). Non–uniform time–lag effects of terrestrial vegetation responses to asymmetric warming. Agric. For. Meteorol. 252, 130–143. doi:10.1016/j.agrformet.2018.01.016
Wen, Y., Liu, X., Xin, Q., Wu, J., Xu, X., Pei, F., et al. (2019). Cumulative effects of climatic factors on terrestrial vegetation growth. J. Geophys.Res. Biogeosci. 124, 789–806. doi:10.1029/2018JG004751
Xu, F., Qu, Y., Bento, V. A., Song, H., Qiu, J., Qi, J., et al. (2024). Understanding climate change impacts on drought in China over the 21st century: a multi-model assessment from CMIP6. npj Clim. Atmos. Sci. 7 (32), 32. doi:10.1038/s41612-024-00578-5
Xu, H. J., Wang, X. P., Zhao, C. Y., and Zhang, X. x. (2019). Responses of ecosystem water use efficiency to meteorological drought under different biomes and drought magnitudes in northern China. Agric. For. Meteorology 278, 107660. doi:10.1016/j.agrformet.2019.107660
Yang, H., Rood, S. B., and Flanagan, L. B. (2019). Controls on ecosystem water-use and water-use efficiency: insights from a comparison between grassland and riparian forest in the northern Great Plains. Agric. For. Meteorology 271, 22–32. doi:10.1016/j.agrformet.2019.02.034
Yu, J. E., Si, H. M., Wu, X. T., Ma, X., Cao, J., Zhang, G. F., et al. (2019). Funcational traits of dodonaea viscosa leaf under eucalyputs platation in dry Hot Valley of Yuanmou county. J. West China For. Sci. 48 (1), 100–105.
Yu, X. X., Wu, Y. X., and Jia, G. D. (2024). Research progress of carbon-water processes and coupling mechanisms of forest vegetation at different scales. J. Soil Water Conservation 38 (1), 1–13.
Yuan, B., Guo, S., Zhang, X., Mu, H., Cao, S., Xia, Z., et al. (2024). Quantifying the drought sensitivity of vegetation types in northern China from 1982 to 2022. Agric. For. Meteorology 359, 110293. doi:10.1016/j.agrformet.2024.110293
Zhang, R. R., Qi, J. Y., Leng, S., and Wang, Q. (2022). Long-term vegetation phenology changes and responses to preseason temperature and precipitation in Northern China. Remote Sens. 14, 1396. doi:10.3390/rs14061396
Zhang, S. Q., and Shan, L. (2002). Research progress on water use efficiency of plant. Agric. Res. Arid Areas 20 (4), 1–5.
Zhang, X., Liu, L., Chen, X., Gao, Y., Xie, S., and Mi, J. (2021). GLC_FCS30: global land-cover product with fine classification system at 30 m using time-series Landsat imagery. Earth Syst. Sci. Data 13 (6), 2753–2776. doi:10.5194/essd-13-2753-2021
Zhao, J., Xu, T., Xiao, J., Liu, S., Mao, K., Song, L., et al. (2020). Responses of water use efficiency to drought in southwest China. Remote Sens. 12 (1), 199. doi:10.3390/rs12010199
Zhao, M., Heinsch, F. A., Nemani, R. R., and Running, S. W. (2005). Improvements of the MODIS terrestrial gross and net primary production global data set. Remote Sens. Environ. 95 (2), 164–176. doi:10.1016/j.rse.2004.12.011
Keywords: dry-hot valley, water use efficiency (wue), self-calibrating palmer drought index (scPDSI), time-lag effect, time-accumulation effect
Citation: Wang D, Jia D, Zhang Y, Tao X, Han F, Ma Y, Guo Y, Li J and Li L (2025) Temporal lags and carbon-water coupling in the dry-hot valleys of southwest China over the past two decades. Front. Environ. Sci. 13:1493668. doi: 10.3389/fenvs.2025.1493668
Received: 09 September 2024; Accepted: 27 January 2025;
Published: 18 February 2025.
Edited by:
Mou Leong Tan, Universiti Sains Malaysia, MalaysiaReviewed by:
Yahui Guo, Central China Normal University, ChinaRicky Anak Kemarau, National University of Malaysia, Malaysia
Copyright © 2025 Wang, Jia, Zhang, Tao, Han, Ma, Guo, Li and Li. This is an open-access article distributed under the terms of the Creative Commons Attribution License (CC BY). The use, distribution or reproduction in other forums is permitted, provided the original author(s) and the copyright owner(s) are credited and that the original publication in this journal is cited, in accordance with accepted academic practice. No use, distribution or reproduction is permitted which does not comply with these terms.
*Correspondence: Lili Li, bmdzX2xpbHkxMTIzQDE2My5jb20=