- 1School of Economics and Business Administration, Yibin University, Yibin, China
- 2Key Laboratory of Urban-Rural Industrial Integration and Intelligent Decision-Making, Sichuan Province for Social Sciences, Chengdu, China
- 3Geography and Resources Science College, Sichuan Normal University, Chengdu, China
Empirical analysis of the relative effectiveness of the Giant Panda National Park (GPNP) system can promote the optimization and improvement of its management level. Normalized Difference Vegetation Index (NDVI) is a key indicator to measure the health of ecosystems, which can effectively quantitatively reveal the spatial and temporal changes of ecological protection effects. This study evaluated the relative effectiveness of Normalized Difference Vegetation Index (NDVI) protection in the Sichuan area of the GPNP from 2000 to 2020 using the propensity score matching model (PSM). It also explored the influencing factors and interactions of each period by combining the Optimal Parameter-based Geographical Detector Model (OPGD). The results showed that: 1) The study area’s Relative Effectiveness Index (REI) was positive, suggesting effective ecological protection. The REI fell from 0.044 in 2000 to 0.031 in 2015 and although it then increased to 0.034 in 2020 to a small extent, the REI showed an overall decreasing trend, and the conservation effect has weakened. 2)The REI change patterns varied in different functional zones of the area, with a general fluctuation and decline, in which the Minshan and Baishuijiang Core Protection Area (MBJ-CPA) as a whole first rise and then fall, and it is the area with the best relative effectiveness of protection. 3) Natural factors such as temperature and elevation are the main factors affecting NDVI, while the influence of policy and economic factors such as the level of protected areas and distance to towns are increasing. The Qionglaishan and Adjacent Areas General Control Area (QLA-GCA) is dominated by the interaction of landscape pattern index with its remaining factors, and the rest of the functional areas are dominated by the interaction of natural factors such as temperature, evapotranspiration with its remaining factors. Therefore, in future development, the Qionglaishan Areas need to pay more attention to the optimization of landscape patterns, while the other areas need to pay more attention to the impact of climate change on the ecosystem. This study can provide a reference for the improvement and management of ecological protection of the GPNP system in the future.
1 Introduction
As a rare national wildlife in China, giant pandas have long been subject to the establishment of a large number of protected zones to try to ensure the originality of their living environment (Ruan et al., 2021). However, despite increased awareness and efforts to promote giant panda conservation (Li and Song, 2022; Yang et al., 2021a), studies have shown that human activities such as resource development, infrastructure construction, and other socio-economic activities in and around protected areas continue to threaten their survival, reducing the vegetation cover of their habitats (He et al., 2014; Li et al., 2021; Luo et al., 2022). Recognizing the significant impact of the geographic location of the giant panda reserves on China’s ecological security and the value of ecosystem services (Song and Li, 2021), China implemented the Pilot Program for the Giant Panda National Park System in December 2016. This program aims to promote habitat connectivity, reduce human encroachment on vegetation cover within the reserves, and ensure the ecological security of China’s vital ecological barrier zones (Ni et al., 2020). The Giant Panda National Park (GPNP) was officially established in October 2021, spanning three provinces of Sichuan, Shaanxi, and Gansu, with an approved area of about 22,000 square kilometers (Shen et al., 2021). The Sichuan area, comprising 74% of the total GPNP system, represents its primary region. Therefore, dynamic monitoring and comparison of vegetation cover inside and outside the boundaries of the Sichuan area in GPNP to assess its relative effectiveness is of great significance for the improvement of the overall ecological quality of the GPNP system.
The geographic location of policies with similar characteristics, such as protected zones, tends to be in remote areas, and even in the absence of formal government protection measures, the pressure on the natural environment is still lower compared to economically developed zones (Joppa and Pfaff, 2009). Counterfactual thinking plays a crucial role in policy evaluation and is the theoretical basis for assessing policy effects. It centers on the construction of an “if. Then.” scenario, i.e., what might have happened in the absence of the policy intervention. This mode of thinking allows us to assess the causal effects of a policy by comparing the actual outcome after the policy was implemented with the possible outcome if the policy had not been implemented. Thus, assessing their effectiveness entails employing counterfactual thinking to compare the phenomena both within and outside the protection boundary, to assess their relative effectiveness. The relative effectiveness of protection refers to the quantitative assessment of the effectiveness of policy implementation in a certain geospatial area by measuring the difference between internal and external observation indicators based on the location of the protection boundary (Geldmann et al., 2019). Two main methods for assessing relative effectiveness: one focuses solely on the interior of the border, excluding the external area, and primarily relies on techniques like questionnaire surveys and expert assessments, while this method only observes the environment inside the border, and the conclusion lacks objectivity (Garces et al., 2013; Harris et al., 2019). An alternative approach involves directly comparing internal and external buffers or unaffected zones, typically by establishing buffers to compare the differences in internal and external indices. The method is not effective in explaining whether the differences in indices inside and outside the protected area are due to the establishment of the protected area or to the geography of the protected area itself (Gaveau et al., 2009; Hellwig et al., 2019; Radeloff et al., 2010). Therefore, some scholars began to use the matching method to overcome the potential problem of sample selection bias that could not be avoided by relying solely on buffers in the early stage (Joppa and Pfaff, 2010). This method primarily relies on combining observed variables, such as temperature and precipitation, with a propensity score matching model to identify the most similar internal and external experimental groups and control groups, and then carry out the assessment of the relative effectiveness of the protection, which has already been proven to be objectively valid by scholars (Geldmann et al., 2019). In terms of the specific evaluation indicators used, the use of indicators such as ecosystem services (Zhang et al., 2023b), habitat quality (Zhang et al., 2023a), and an anthropogenic pressure index coupled with multi-source data (Zhang et al., 2021) have been included to disprove the relative effectiveness of conservation in nature reserves. The NDVI is a typical and commonly used instrumental variable to effectively measure plant growth status and the density of the spatial distribution of vegetation. Previous studies have demonstrated the significant role of NDVI in revealing patterns of surface vegetation cover changes and evaluating the dynamics of regional ecological environments. Consequently, it finds extensive application in the assessment and monitoring of ecological environments (Domingo-Marimon et al., 2024; Yi et al., 2023).
The conservation effectiveness of ecologically protected areas is closely related to natural and socio-economic conditions, such as temperature, topography, population growth, and urban expansion. The analysis of factors affecting the effectiveness of protected areas is the foothold of effective management of protected areas, and it is also of great significance to the improvement of the effectiveness of protected areas. Currently, in the exploration of influencing factors, scholars have already employed various models, including panel regression (Zhang et al., 2021), and random forest analysis (Cao, 2021), to explore the influencing factors of human activity pressure mitigation and relative effectiveness in China’s nature reserves and Qinling National Nature Reserve. Although these models can identify factors affecting relative effectiveness, they tend to ignore the problem of multicollinearity that may be triggered by interactions among independent variables (Fan et al., 2021). In contrast, geographical detector (GD) models exhibit significant advantages in dealing with spatial correlation and assessing the weights of non-normally distributed and non-linear factors (Ye et al., 2023). However, the traditional GD model analyzes the spatial relationships between geographic phenomena and factors based on a grid, and it is easy to neglect the effects of scale and zoning in the study of spatial heterogeneity (Wang et al., 2023). In this regard, Song (Song et al., 2020) proposed an optimal parameters-based geographical detector (OPGD) model, which can identify the optimal combination of spatial scale parameters and spatial data discretization methods, and provide a scientific basis for accurately revealing the correlation between dependent and independent variables. Considering the effectiveness of the OPGD model in exploring the driving factors, it is widely used in quantitatively exploring the driving factors of a variety of spatial heterogeneity problems (Cen et al., 2024; Wang et al., 2024).
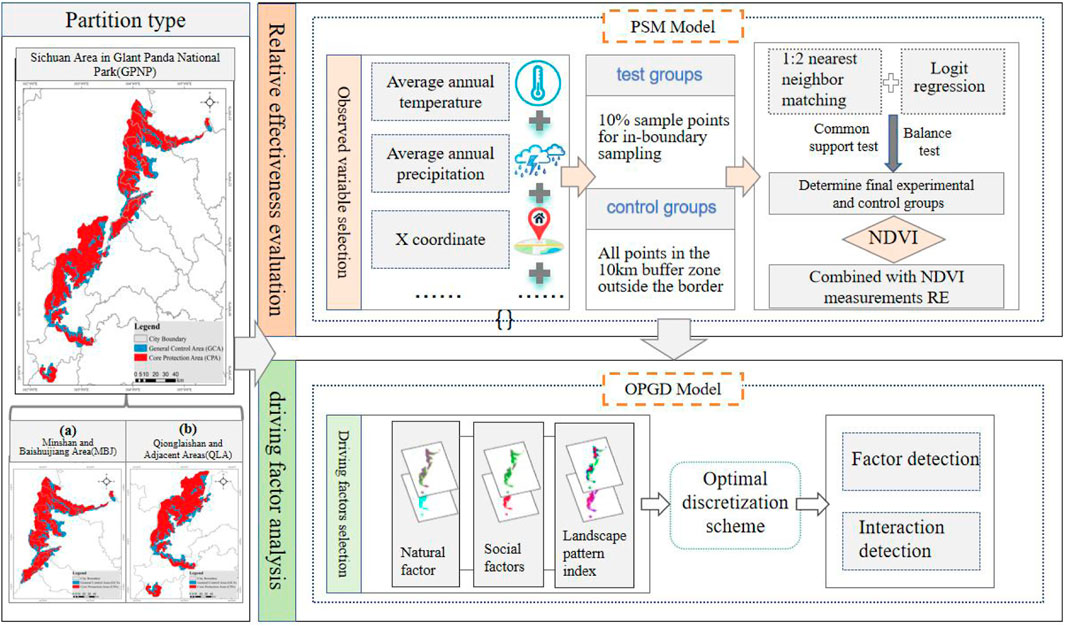
Current research on the relative effectiveness of the GPNP system and the factors influencing it is generally scarce. Existing studies have focused on evaluating the effectiveness of internal nature reserve management (Pu et al., 2022; Qin et al., 2023), analyzing spatial overlap relationships (Xu and Tang, 2024; Zhuang et al., 2020), and the spatial and temporal evolution of ecological security (He et al., 2024). When using the PSM model to evaluate the effectiveness of policy boundary protection, most studies fail to take into account that differences in the spatial distance of the samples produce matching errors, which affects the rationality of the evaluation results. Regarding the exploration of factors influencing the relative effectiveness of conservation, favoring the unidirectional effect of the influencing factors on the results and ignoring the interaction between the factors. This study focuses on the overall Sichuan Areas inGPNP, along with its four functional zoning: the Minshan and Baishuijiang Core Protected Areas (MBJ-CPA), the Minshan and Baishuijiang General Control Area (MBJ-GCA), the Qionglaishan and Adjacent Areas Core Protected Areas (QLA-CPA) and the Qionglaishan and Adjacent Areas General Control Area (QLA-GCA). Leveraging the ArcGIS platform, this study integrates spatial coordinates into the observational variables and employs the PSM model to evaluate the relative effectiveness of the various functional zones within the Sichuan area in GPNP from 2000 to 2020. Additionally, the OPGD Model is utilized to determine the most suitable classification criteria for both factorial and interaction detection across different functional zones in the two internal regions (Figure 1). This study aims to provide important references for the enhancement of the effectiveness of ecological protection and environment improvement of the GPNP system.
2 Materials and methods
2.1 Study area
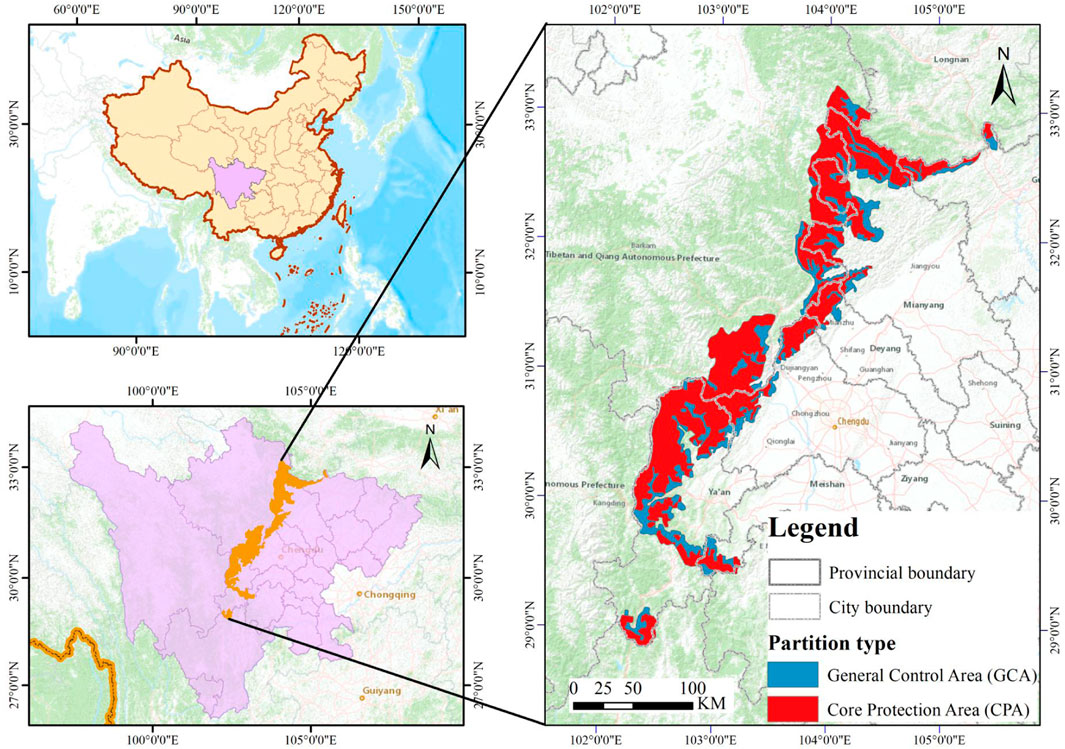
The Sichuan Area in GPNP is situated on the southwestern border of China, spanning coordinates 102°11′∼105°32′E and 28°50′∼33°12′N. It spans a total land area of 20,177 km2, which accounts for approximately 74.36% of the Sichuan Province. It encompasses 7 cities and 20 counties. The region exhibits complex topography, characterized by higher elevations in the north-west and lower elevations in the south-east. Influenced by the topography, the region has a distinct vertical distribution of vegetation with increasing elevation. Precipitation is concentrated in summer with notable spatial variation. The study area is primarily divided into Minshan-Baishuijiang Areas, as well as the Qionglaishan Areas. The area consists of two distinct functional zones, namely the General Control Area (GCA) and the Core Protection Area (CPA), which account for covering 74.20% and 25.78% of the total land area, respectively. (Figure 2).
2.2 Data sources and processing
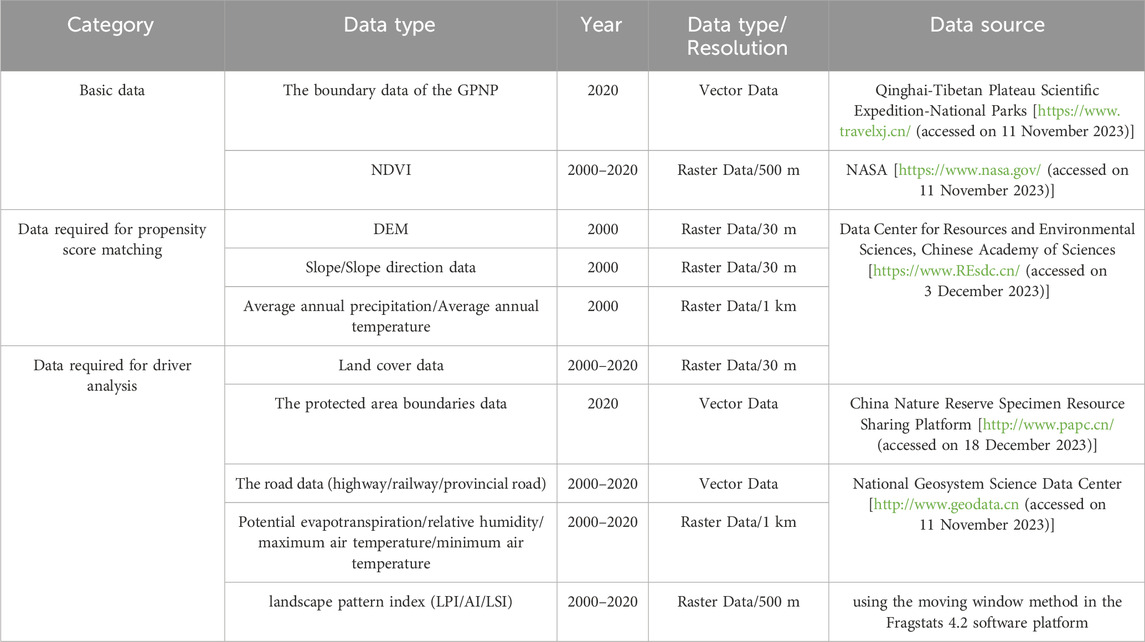
The boundary data of the GPNP was obtained from the Qinghai-Tibetan Plateau Scientific Expedition-National Parks. (https://www.travelxj.cn/). NDVI data from NASA (https://www.nasa.gov/) were originally a 16-day AM product at 500 m resolution, which was batch processed and value normalized to form an annual synthetic maximum product.
Of the initial observational variables required for propensity score matching, the DEM data was obtained from the Data Center for Resources and Environmental Sciences, Chinese Academy of Sciences (https://www.REsdc.cn/). DEM extracted slope and slope direction data in ArcGIS10.2. Average annual precipitation data and average annual temperature data were obtained from the Data Center for Resources and Environmental Sciences, Chinese Academy of Sciences (https://www.REsdc.cn/) and formed by inverse distance-weighted interpolation.
Among the influencing factors, the protected area boundaries data were derived from the China Nature Reserve Specimen Resource Sharing Platform (http://www.papc.cn/). The road data comes from the National Earth System Science Data Center (http://www.geodata.cn). The highway, railway, and provincial road are merged to form the main road, and the Euclidean distance tool is used to calculate the distance to the main road and the distance to the urban construction land. Land cover data is derived from the Data Center for Resources and Environmental Sciences, Chinese Academy of Sciences (https://www.REsdc.cn/) with a unified resolution of 500 m. Potential evapotranspiration data, relative humidity data, maximum air temperature data, and minimum air temperature data were obtained from the National Geosystem Science Data Center (http://www.geodata.cn) They are all monthly data of 1 km. After projection transformation, mean synthesis, and mask extraction, they are resampled into annual data products of 500 m. The landscape pattern index (LPI/AI/LSI) was based on creating a 500 m fishnet grid in the study area, which was measured using the moving window method in the Fragstats 4.2 software platform in combination with the land use data of each period (Table 1).
2.3 Relative effectiveness evaluation
2.3.1 Propensity score matching models
Propensity Score Matching (PSM) refers to the measurement of the probability of occurrence of sample point i within the experimental and control groups based on some influence factor Mi (Rosenbaum and Rubin, 1983) (Formula 1). The method is based on the propensity scores of the experimental and control groups, with the practical application of different rules for matching, to select the experimental and control groups that are the most similar between the two under the constraints of the observed variables, to eliminate the sample selectivity bias (Olmuş et al., 2022).
p(Mi) is the propensity score of sample point i; PAi = 0 is the control group, PAi = 1 is the experimental group; f(Mi) is a linear function, F(x) is a logical function.
Due to the establishment of protected areas within the study area after 2000 and the implementation of the “Tianbao Project,” vegetation protection has been effective to a certain extent. Therefore, in this study, the year 2000 was chosen as the base year. Seven natural geographic factors, including DEM, slope, slope direction, average annual precipitation, average annual temperature, X coordinate, and Y coordinate, were preliminarily selected as the observational variables for the propensity score matching method. The establishment of a 500 m fishnet grid in the study area necessitates sampling treatment due to the large number of total samples and the vast amount of data computation involved. Therefore, this paper draws on the experience of previous researchers (Liu et al., 2024; Zhang et al., 2022), and selects 10% of the sample points from the protected area as the experimental group using ArcGIS’s “Subset” tool. After multiple iterations, slope, X-coordinate, average annual precipitation, and average annual temperature were ultimately determined as the matching observation variables, ensuring maximum similarity between the matched samples. Due to the late formal establishment of the GPNP system, and to effectively represent the reality of the differences in and around the boundary, this study does not take into account the spillover effect of the longer establishment of the boundary when using the PSM. Referring to existing studies (Wu et al., 2022) and combining with several experiments, this paper finally determined that the area within 10 km from the boundary of the protected area would be used as the external buffer zone, from which the control group was collected. The nearest neighbor rule in the caliper was selected for 1:2 propensity score matching, and the final experimental group and control group were determined, which provided the basis for evaluating the relative effectiveness of the GPNP in the Sichuan area.
2.3.2 Relative effectiveness index
The relative effectiveness index (REI) is to refer to the research results of Zhang Han and other scholars (Zhang et al., 2021). It measures the difference between the mean NDVI value within the boundary and those of the final matched control group, to positively argue the relative effectiveness of the protection boundary of the GPNP system in terms of vegetation cover and other ecological environmental protection (Formula 2).
REI refers to the relative effectiveness index comparing the two functional zones in various regions of the GPNP in Sichuan. ∆pixeli represents the aggregate NDVI value of image element i in a certain functional area within a region for the years 2000, 2005, 2010, 2015, and 2020; n1 is the number of image elements in a certain functional area within a region; ∆pointj is the sum of NDVI at sample point j of the matched control group for the years 2000, 2005, 2010, 2015 and 2020; no is the number of sample points in the control group following matching. If REI >0, then NDVI inside the protected area is high, and the ecological protection effectiveness is positive. If REI <0, the ecological protection effectiveness of the protected area is negative.
2.4 Major factors of relative effectiveness indices change
The core of the geodetector is that if the independent variable significantly impacts the dependent variable, the spatial arrangement of the two exhibits similarity, it is a novel statistical method to detect the spatial dissimilarity and reveal the law of the driving factor, including four sub-tools: factor detection, interaction detection, ecological detection, and risk detection (Wang and Xu, 2017). The OPGD model can optimize the spatial data discretization process and spatial scale to determine the best combination of parameters for the geodetector to further extract the geographic feature information of the spatial explanatory variables (Song et al., 2020; Xu et al., 2023).
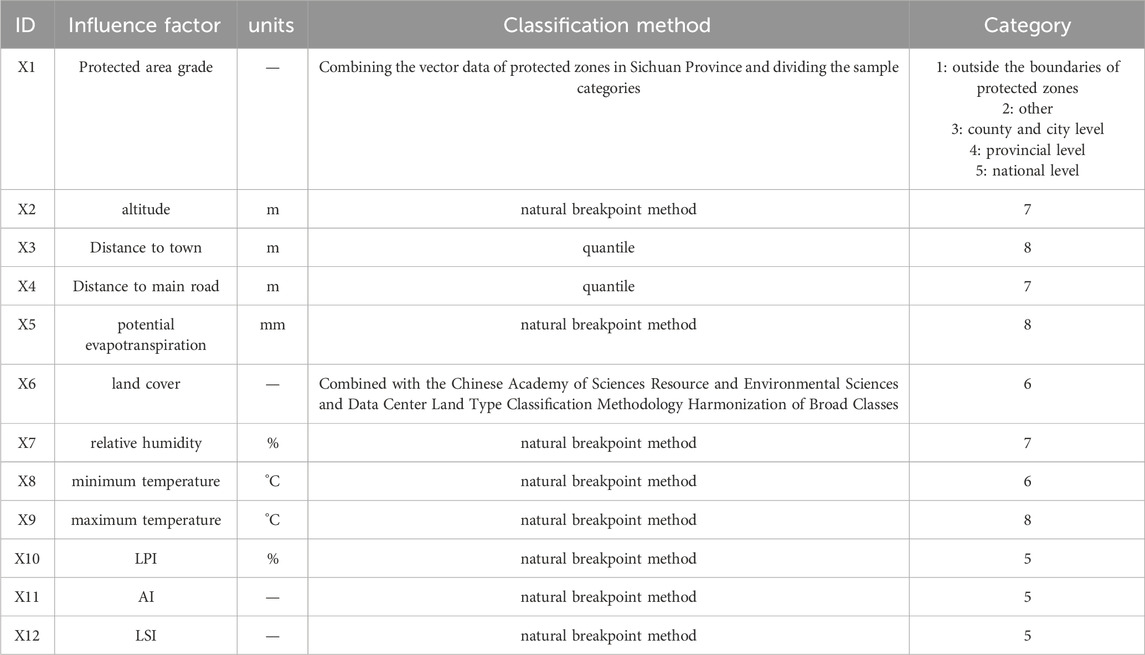
In this study, we mainly used factor detection and interaction detection. The principles of data relevance, usability, and comprehensiveness were comprehensively considered. Factors that may affect the relative effectiveness of protected areas were selected from multiple levels, such as natural, socioeconomic, etc., and the research experience of other scholars was also taken into account (Liao et al., 2024; Liu et al., 2021; Xu et al., 2024). Finally, five natural factors (altitude, minimum temperature, maximum temperature, relative humidity, potential evapotranspiration), four economic policy factors (distance from the main road, land cover, distance from urban construction land, and type of nature reserve), and three landscape pattern indices (largest patch index (LPI), aggregation index (AI) and landscape shape index (LSI)) were used as independent variables. The categorization methods and categories of the different influencing factors are classified according to the rules in Table 2.
Factor detection reveals the magnitude of the extent to which the influence factors explain the spatial dissimilarity of the dependent variable (Formula 3). Interaction detection refers to assessing the difference in the explanatory strength of two combinations of influence factors when they act together versus when they act alone (Li et al., 2022).
q refers to the strength of the influence factor X in explaining the spatial variability of the relative validity index, ranging from [0,1], with larger values indicating a strong X explanation; n = 1,2,3, … ,m, is the number of classifications for factor X; Dn and D is the number of subregion n and total region samples, respectively;
3 Results
3.1 Relative effectiveness analysis
3.1.1 PSM matching results
In this study, 8,679 experimental sites and 70,673 control sites were initially collected after the fishnet grid was created. After slope, X-coordinate, average annual precipitation, and average annual temperature were used as observational variables to match propensity scores, 8,679 and 14,387 experimental and control sites were left, respectively. To verify the accuracy of the model, the matching results are subjected to a common support test and a balance test.
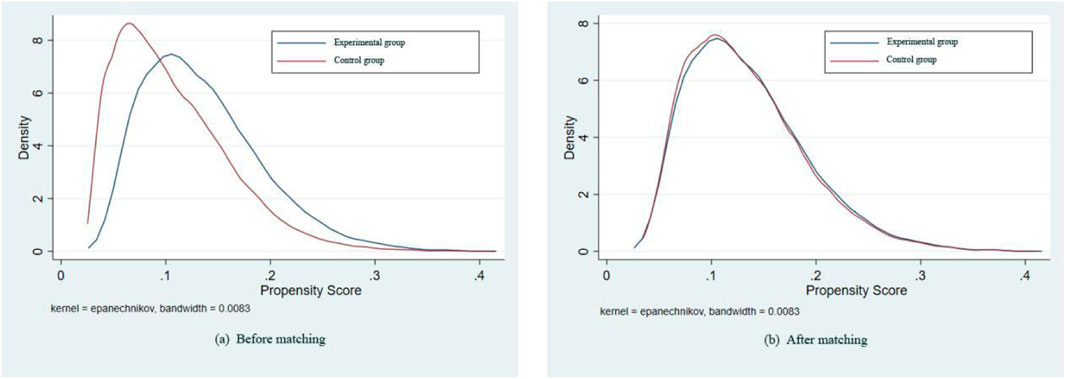
The common support test is to measure the effect of the model by the size of the common value range before and after the propensity score matching. Figure 3 shows that after the initial experimental group and the control group went through the propensity score matching model, the lines nearly overlapped and the common support range became significantly larger, i.e., the propensity score matching model was more effective.
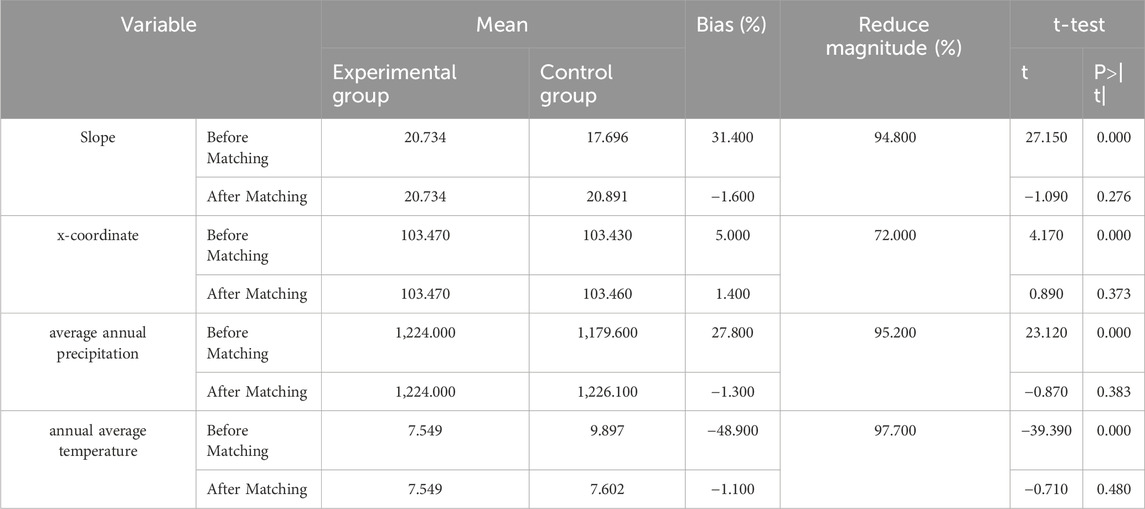
To further verify the changes in each observation variable before and after the propensity score matching, the effect of the model was observed through the balance test. Table 3 shows that after propensity score matching, the absolute value of the standard deviation of slope, X coordinate, annual average precipitation, and annual average temperature is less than 2%, and the absolute value of t statistic is less than 1.96. There is no significant difference in the mean value of each variable between the experimental group and the control group after matching, indicating that the model passes the balance test.
3.1.2 Relative effectiveness evaluation
The experimental and control groups retained by the propensity score matching model were derived, and the temporal change pattern of REI of the Sichuan Area in GPNP from 2000 to 2020 was obtained after the operation according to Equation 2 (Figure 4).
The results showed that the REI of the Sichuan Area in GPNP from 2000 to 2020 was > 0, indicating that the ecological protection effect of the study area from 2000 to 2020 was relatively effective. From the perspective of temporal change, the overall trend of REI is decreasing. From 2000 to 2015, it continued to decline to 0.031, with its relative effectiveness weakening by nearly 29.55% compared to 2005; the REI began to improve after 2015. To further reveal the spatial differentiation patterns of the relative effectiveness of GPNP, the REI of different zones were counted according to functional subdivisions in this study, and the results are as follows:
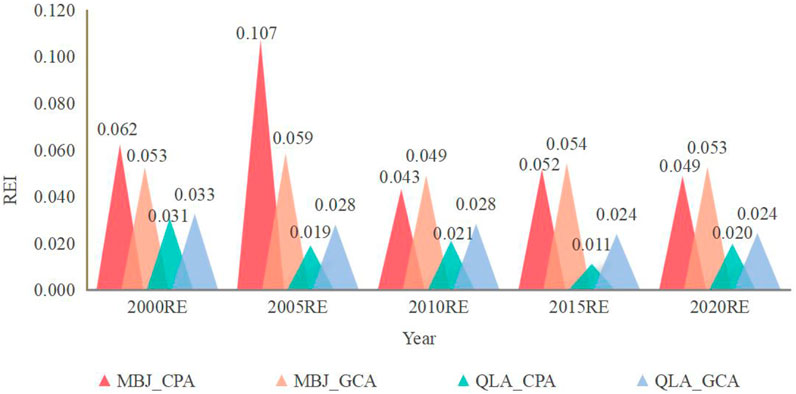
Figure 5 shows that the REI of the MBJ-CPA are both greater than 0 in 2000–2020, but the overall trend is to show a first increase and then decrease, for the best relative effectiveness within the two zones. From 2000 to 2005, the REI gradually increased and reached a high of 0.107 in 2005 for the study period, and then began to decline until it reached its lowest level in 2010, the REI as a whole is still smaller than the 2000 level of relative effectiveness in 2020, although it improves slightly; while its GCA has an overall downward trend over 2000–2020. The pattern of REI change in the GCA is consistent with that of the CPA, with the difference that its REI in 2015 and 2020 is close to the level of relative effectiveness in the early 2000s. The REI of the QLA-CPA showed a fluctuating trend from 2000 to 2020, but the overall decline fell to a minimum of 0.011 in 2015, weakened by nearly 6.45% compared to the base year; The REI in its GCA has overall decline, although REI is higher than that of the CPA in various years during 2000–2020, and the same phenomenon of REI exists in adjacent years at intervals after 2000.
3.2 Analysis of major influencing factors
After classifying the 12 influencing factors such as the level of the protected area into categories according to the classification rules, factor detection was carried out by combining the REI of different regions in each year, and the results are shown below:
From Figures 6A, 7A, it can be seen that maximum temperature (q = 0.101), minimum temperature (q = 0.090), and elevation (q = 0.083) were all greater than 0.080 as the main influencing factors in the MBJ-CPA from 2000 to 2020, and the trends of their changes were consistent, with a decrease after reaching the maximum in 2005 and then an increase in 2010. The effect of protected area level on REI showed a trend of increasing; distance to town, distance to main road, and relative humidity all increased and then decreased, but their q-values still increased at the end of the study period relative to the beginning of the period. LPI, AI, LSI, and potential evapotranspiration show increasing and then decreasing trends. For the MBJ-GCA (Figure 6B), maximum temperature (q = 0.078), potential evapotranspiration (q = 0.068), and distance to the main road (q = 0.064) are the main influencing factors, and the other factors are less than 0.060. According to Figure 7B, the influence of protected area level on REI showed a trend of increasing first and then decreasing. The variations of LPI, AI, and LSI were consistent. The remaining factors increased and then decreased from 2005 to 2010. The land cover is not significant in the Minshan-Baishuijiang Areas as a whole.
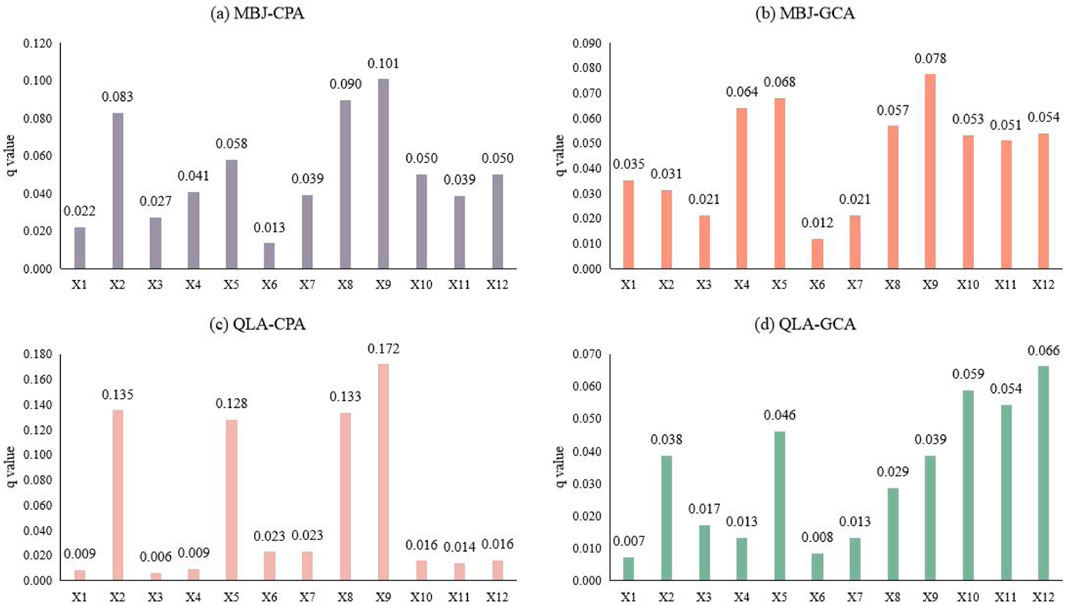
Figure 6. Mean q value of influencing factors in different regions of the Sichuan Area in GPNP. (A) MBJ-CPA (B) MBJ-GCA (C) QLA-CPA (D) QLA-GCA.
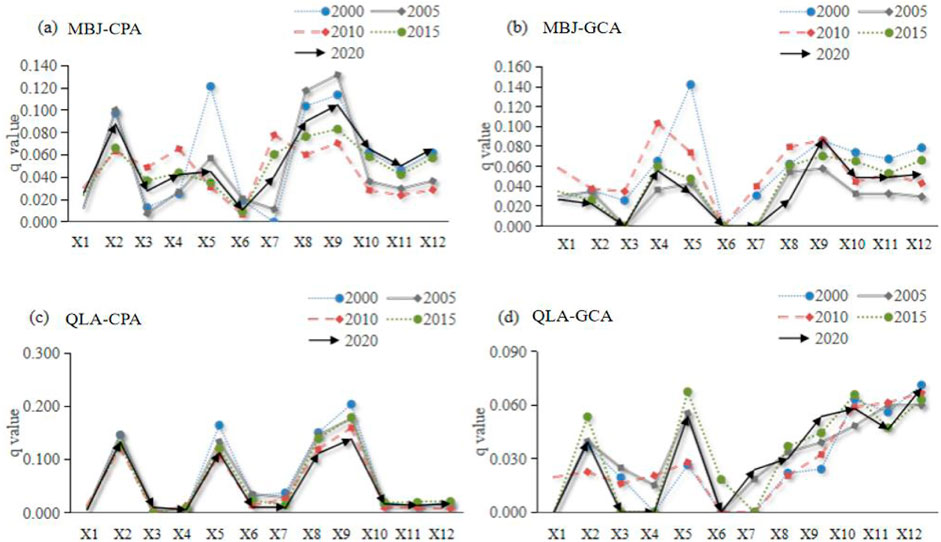
Figure 7. Variation of q-values of influencing factors in different regions of Sichuan Area in GPNP. (A) MBJ-CPA (B) MBJ-GCA (C) QLA-CPA (D) QLA-GCA.
Figure 6C shows that in the QLA-CPA from 2000 to 2020, the q-values of maximum temperature, altitude, minimum temperature, and potential evapotranspiration were 0.172, 0.135, 0.133 and 0.128, respectively, and the remaining factors such as protected area level had a weak overall impact. From the perspective of the change trend (Figure 7C), the force of the protected area level increased as a whole, and then weakened in the last two periods, but overall increased compared with the force at the beginning of the period. The q-values of altitude decreased by 15.75% in 2010 and then increased slightly in the last two periods. Distance to town had the weakest effect and was not significant overall during the study period. The q-values of relative humidity influence were weakened in all five periods. The q-values of LPI, AI, LSI, minimum and maximum temperatures have the same pattern of change, and the five periods have comparable forces on REI; For the QLA-GCA (Figure 6D), the relatively large q-values of LPI(q = 0.059), AI (q = 0.054), and LSI (q = 0.066)are the main drivers, in contrast to the other three functional areas. The minimum temperature showed a fluctuating trend as a whole (Figure 7D), and the highest influence was 0.037 in 2015; The q-values for maximum temperature show an overall increasing trend and reach their maximum in 2020, with an increase of almost 1.25 times compared to 2000. The influence of the remaining factors was weak overall, and even non-significant during the study period.
In general, maximum temperature, minimum temperature, and altitude in the four functional areas have a strong decisive force, indicating that natural factors have a greater impact on the relative effectiveness of ecological protection in the Sichuan area in GPNP than socio-economic factors. Although the socioeconomic factors showed a fluctuating trend in the five periods, compared with the beginning of the study period, the decisive power of socio-economic factors such as distance to town and distance to the main road increased at the end of the period, indicating that the role of socio-economic factors was becoming more and more obvious. The overall weak impact of land cover is related to the low level of human activities and the less obvious change in land types in the protected area.
3.3 Interactive analysis of influencing factors
The interaction detection results of the OPGD model were integrated, and the interaction results of the insignificant factors were eliminated to produce the five-phase heat maps of the different functional zones of the two districts (Figure 8).
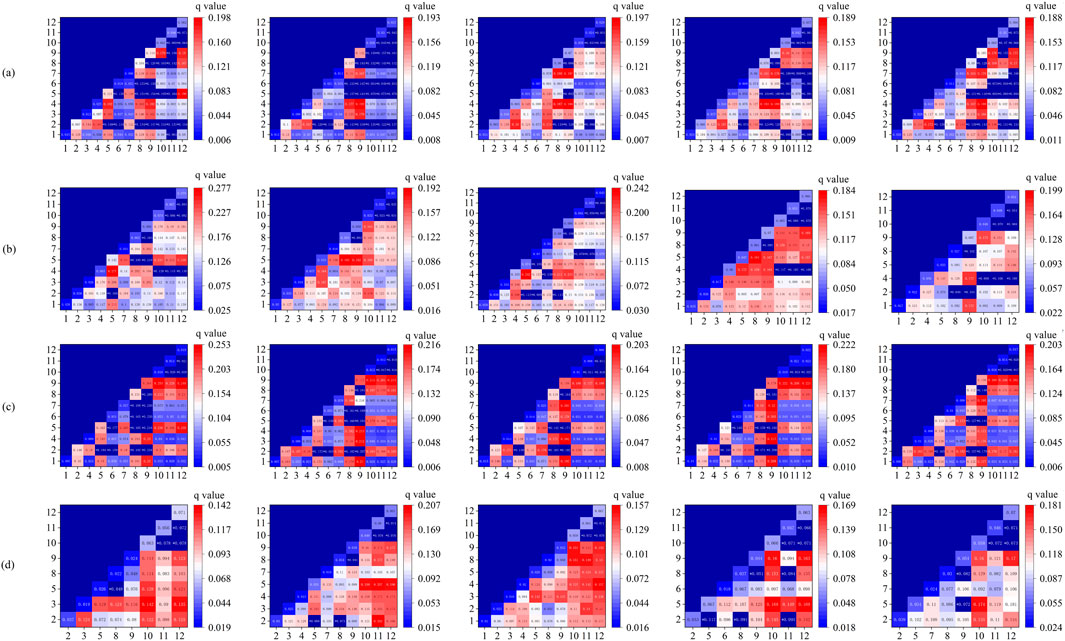
Figure 8. Interaction diagram of influential factors in different regions of GPNP in Sichuan (2000–2020) (A) MBJ-CPA; (B) MBJ-GCA; (C) QLA-CPA; (D) QLA- GCA. Note: Figures are in chronological order from left to right for 2000, 2005, 2010, 2015, and 2020. *Two-factor augmentation, all others are nonlinear augmentation.
Figure 8 shows that the two-factor enhancement relationship in the MBJ-CPA accounted for 26.92%, 34.62%, 10.26%, 23.08%, and 24.36% in the five periods from 2000 to 2020. The overall strong interaction of elevation, minimum temperature, maximum temperature, and the rest of the factors indicates that the influence of these three factors is significantly higher after interacting with the rest of the factors, which is important for the protection of vegetation in the study area. Among them, the potential evapotranspiration ∩ LSI was as high as 0.198 in 2000, with the most significant interaction. The combination of maximum temperature and distance to the main road had the strongest effect from 2005 to 2020, with all interaction q-values greater than 0.188. The MBJ-GCA two-factor augmentation relationship was 15.15%, 6.06%, 14.10%, 12.73%, and 20% in that order, which was slightly lower than that of the core protection area. The interaction between potential evapotranspiration and the rest of the factors within the region was larger in all five periods. The effects of these two combinations of potential evapotranspiration with distance to town and potential evapotranspiration with minimum temperature were the most significant.
The interaction forces of elevation, potential evapotranspiration, minimum air temperature, maximum air temperature, and the rest of the factors in the QLA-CPA were higher in all five periods during the study period, while the influence of the other factors was weaker. The share of two-factor enhanced relationships is concentrated in 2000, up to 22.73%. Specifically, the maximum temperature ∩ LPI is a five-period maximum of 0.253 in 2000. The overall interaction power in 2020 is the weakest in the five periods, with maximum temperature ∩ LPI reaching a maximum of 0.203, whereas the lowest values were concentrated in the two-phase interactions between LPI and AI and LSI. The proportion of the two-factor enhancement relationship of QLA-GCA was the smallest in the four functional zones, with ≤13.9% in all five periods. Overall, the effects appear to be higher for the interaction of LPI, AI, LSI, and the remaining factors, and are most pronounced in 2010.
Overall, the synergistic effect of multiple factors jointly influenced the changes in the relative effectiveness index of the Sichuan Area in GPNP. The economic policy factor’s interaction with other elements was markedly less pronounced compared to the interplay among natural factors. Consequently, during the restoration of protected areas and the development of ecological civilization, it is imperative to consider not only the individual impacts of natural and socioeconomic factors on the conservation’s relative effectiveness but also to orchestrate the amplifying effects that arise from the interplay between diverse factors.
4 Discussion
The primary aim of this study is to assess the influence of regional policies on the efficacy of ecological conservation efforts. Given that a region’s NDVI is highly responsive to natural elements like precipitation and temperature, it can be challenging to attribute changes in NDVI solely to policy impacts. To address this, our research adopts a spatial analysis approach. By comparing the NDVI variations between protected and non-protected areas within the same year, we aim to quantify the protective effects of policies. This method effectively mitigates the potential confounding effects of extreme meteorological fluctuations. Our analysis of vegetation cover discrepancies within and beyond the Sichuan Area in GPNP offers insights into the comparative effectiveness of conservation policies. This study not only contributes a scientific framework for evaluating policy outcomes in protected regions globally but also informs future ecological conservation endeavors. The findings possess a degree of universality, guiding conservation practices in various contexts.
The ecological environment within the impact boundary includes a variety of factors such as precipitation, temperature, transportation accessibility, etc. (Zhao et al., 2019), and it is difficult to distinguish whether it is the introduction of the policy or its own geographic environment that affects it, so it is necessary to clarify whether it is the location difference generated by the designated policy boundary that contributes to the effectiveness of its protection (Zhang et al., 2021). Many studies have been conducted to assess the relative effectiveness of nature reserves using the PSM method, such as using anthropogenic pressures (Cao et al., 2019) or ecosystem services (Dähler et al., 2019) as an indicator of effectiveness. However, most of the existing studies do not fully consider the influence of spatial location factors on assessment results. Especially in smaller study areas, we believe that the inclusion of spatial coordinates as an observational variable in the analytical framework is essential to improve the precision and reliability of the study. Therefore, we incorporated spatial coordinates into the propensity score matching process to minimize sample selection bias. The results showed that the REI of the Sichuan Area in the GPNP Area was positive in all years during 2000–2020, i.e., the NDVI within the boundary was still higher compared with the outside but decreased overall. The reason for this is that since 2000, the government has continuously established additional protected zones within the GPNP, and taken ecological engineering measures such as natural forest protection and returning farmland to forests (grasses), which have contributed to the high vegetation coverage within its boundaries (Yang X. et al., 2021). Although the maintenance of livelihoods in and around the conservancy is within the conservancy’s target setting, there is still a possibility of loss of regional economic development opportunities, which in turn generates illegal entry for access to plant and animal resources in search of alternative livelihoods (Adams et al., 2004), which still has an impact on the overall NDVI of the study area. In addition, in this paper, during the propensity score matching process, due to the microscopic nature of the study area, the inclusion of land use type in the observed variables would lead to poor balance test results and thus affect the accuracy of the model, so this study did not include the use of land use type in the observed variables. The final matched experimental and control groups appeared to match woodland and grassland to each other, with close to 1,693 woodland sites within the boundary matching grassland sites in the buffer, and 1,785 grassland sites matching woodland sites in the buffer, which affected the REI to a certain extent. REI in the study area increased slightly after 2015, with the overall trend changing from a decrease to an increase (Figure 4). The reason for this is that after 2015, the country comprehensively launched the pilot work of the GPNP system and formally established the GPNP in 2021. During this critical development process, the overall ecological quality of the study area has been emphasized as never before (Pu et al., 2022), and the increased protection efforts have contributed to the ability to improve its REI. In terms of different zones, the REI in the Minshan-Baishuijiang Areas was higher than that in the Qionglaishan Areas, which was correlated with the greater number of giant pandas distributed in this area and the higher density of vegetation cover.
This study combines the OPGD model to complement the study of the main influences and interactions affecting the relative effectiveness of the different zones. Overall, the maximum temperature, minimum temperature, potential evapotranspiration, and other natural factors have a stronger impact on the Minshan-Baishuijiang Areas, as well as the QLA-CPA, Which is consistent with the conclusions of the existing studies (Jiao et al., 2021). The QLA-GCA had higher REI than the core conservation zones in all years during 2000–2020, but the difference decreased at the end of the period. This is mainly due to the local government has long adopted a large number of maintenance measures for nature reserves within the CPA, setting up fences or encouraging people to relocate off-site to minimize the disturbance of human activities in or around the nature reserves (Kang and Li, 2018). The CPA for a long time in the protection range, the degree of human interference in the long term controlled is small, while the GCA in the GPNP before the establishment of the boundary policy, the control is not strong enough compared to the CPA. After the region as a whole significantly emphasized economic development and human activity intensity control (Xue et al., 2020), the vegetation was buffered to restore, resulting in the two being closer at the end of the period. The q-values ranking of its main impact factors during the study period was LSI > LPI > AI. The reason for this is that the ecological damage in the study area was severe after the Wenchuan earthquake and the Lushan earthquake (Duan et al., 2021; Wang et al., 2022). The local government accelerated ecological restoration and hazard reduction, reduced the population density in mountainous zones, and weakened human disturbance (Qin et al., 2019). At the same time, along with the native advantage of higher elevation plus high relative humidity, the overall connectivity in the area increased in the late period, and the aggregation of patches was enhanced, which was favorable for vegetation growth and spreading expansion (Huang et al., 2022). In summary, the study area should strictly implement the requirements of different functional partitions. The CPA should strengthen the maintenance of the stability of the natural elements of the region and reduce the possibility of influencing changes in natural factors, the GCA should reduce development activities and control the flow of people in the scenic area, improve the construction of landscape patterns, and increases the connectivity and coverage of vegetation.
In terms of interactions, during 2000–2020, the two-factor enhancement was mainly manifested in the interactions between elevation, potential evapotranspiration, and maximum air temperature, minimum air temperature, and landscape pattern indices, respectively, in the MBJ-CPA, and in the Qionglaishan Areas. Therefore, in the future, while enhancing the connectivity of vegetation landscape, different functional zones should pay attention to the combination of altitude and temperature, and plant vegetation suitable for temperature growth at different altitudes to improve its long-term survival rate. The MBJ-GCA showed a significant two-factor interaction enhancement between distance to major roads and relative humidity and landscape pattern indices, in addition to the two-factor interaction enhancement between natural factors such as temperature and elevation. This is because the GCA is closer to the main road, resulting in vegetation by the outside world of the interference degree is stronger, and close to the main road is mostly low mountainous terrain, its relative humidity is usually lower will affect the vegetation survival (Li et al., 2019). In the future, the relative effectiveness of the protection of the border should be enhanced through the adoption of monitoring measures in zones closer to the road to reduce the possibility of human destruction of vegetation in the immediate vicinity, at the same time, more herbaceous plants will be planted along the line to improve water conservation capacity, thereby improving the relative protection effectiveness of the boundary.
Some samples may be lost when using the moving window method to measure the landscape pattern index in this study, which may have some impact on the exploration of the influencing factors of different functional zones. In addition, the study area is a micro-region, but the influencing factors in this study are mostly selected from macro-remote sensing data, which should be combined with the actual research in the future, and the breakpoint regression model should be used to explore the specific time nodes of the relative effectiveness of the policy. The PSM method is mainly used to solve the endogeneity problem caused by observational variables. However, it is difficult to consider non-observational variables, such as aboveground biomass and soil texture, which may have an impact on NDVI. Since the accuracy of the currently available data is not sufficient for in-depth analyses, future studies should use remote sensing and soil surveys to obtain more accurate data to comprehensively assess the effects of observational and non-observational variables. Finally, the GPNP was formally established relatively late in the year, and with the expansion of the period of the study and the enhancement of the depth of the study, we plan to introduce the double-difference-in-differences (DID) methodology in our future studies to further quantify the effects of policy interventions on the effectiveness of protected area conservation. This will help us assess the specific effects of policy changes more precisely and provide more solid data support for protected area management and policy formulation.
5 Conclusion
In this study, we used NDVI data as instrumental variables, combined with PSM to measure the relative effectiveness of the whole Sichuan Area of GPNP and different sub-zones in 2000, 2005, 2010, 2015, and 2020, and then analyzed the main influencing factors of different functional sub-zones and the interactions among the factors through OPGD model, the results are as follows:
(1) The REI of the Sichuan Area in GPNP was greater than 0 during the period 2000–2020. TheMBJ-CPA rose and then fell over the 2000–2020 period, and were the most relatively effective zones within the two zones, the GCA declined overall during the study period; the QLA-CPA showed a decreasing trend and dropped to a minimum of 0.011 in 2015, weakening by nearly 6.45% compared to the base year. Although RE was higher in the GCA than in the CPA in different years, the difference between the two diminished later. That is, the difference in vegetation cover inside and outside the boundary weakened, but the internal cover remained higher.
(2) The REI of the MBJ-CPA, the MBJ-GCA, and the QLA-CPA are dominated by natural factors such as temperature, elevation, and potential evapotranspiration, and the REI of the QLA-GCA is more influenced by LSI, AI, and LPI. However, the impact of policies and socio-economic factors such as the protected area level and the distance to town on individual functional zones has been increasing in recent years.
(3) The REI of the MBJ-CPA, MBJ-GCA, and the QLA-CPA, are more influenced by the interaction of maximum air temperature, minimum air temperature, and potential evapotranspiration, and the rest of the factors, and the QLA-GCA are dominated by the interactions of LSI, AI, and LPI with their rest of the factors. In future development planning, attention must be paid to the comprehensive consideration of the interaction of natural factors and policy and economic factors. Through multi-dimensional considerations, the challenges in ecological protection can be more accurately identified and responded to, and the scientific and effective nature of the protection measures can be ensured, to better maintain biodiversity and ecological balance.
Data availability statement
The original contributions presented in the study are included in the article/supplementary material, further inquiries can be directed to the corresponding author.
Author contributions
BM: Conceptualization, Formal Analysis, Methodology, Writing–original draft. MW: Data curation, Formal Analysis, Methodology, Writing–original draft. ZZ: Data curation, Investigation, Writing–original draft. HP: Project administration, Supervision, Validation, Writing–review and editing.
Funding
The author(s) declare that financial support was received for the research, authorship, and/or publication of this article. This research was funded by the high-level talent “QiHang” program of Yibin University (grant number 2021QH037); The National Natural Science Foundation of China (grant number 42071222); The Major Research and Development and Achievement Transformation Projects of Qinghai, China (grant number 2022-QY-224); The Humanities and Social Science Fund of Ministry of Education of China (grant number 18XJA630005); The Humanities and Social Science Fund of Ministry of Education of China (grant number 18YJC850004).
Conflict of interest
The authors declare that the research was conducted in the absence of any commercial or financial relationships that could be construed as a potential conflict of interest.
Generative AI statement
The author(s) declare that no Generative AI was used in the creation of this manuscript.
Publisher’s note
All claims expressed in this article are solely those of the authors and do not necessarily represent those of their affiliated organizations, or those of the publisher, the editors and the reviewers. Any product that may be evaluated in this article, or claim that may be made by its manufacturer, is not guaranteed or endorsed by the publisher.
References
Adams, W. M., Aveling, R., Brockington, D., Dickson, B., Elliott, J., Hutton, J., et al. (2004). Biodiversity conservation and the eradication of poverty. Science 306, 1146–1149. doi:10.1126/science.1097920
Cao, M. (2021). Conservation effectiveness assessment and influencing factors analysis of national nature reserves in qinling mountains (Master’s thesis). Beijing, China: Chinese Research Academy of Environmental Sciences. doi:10.27510/d.cnki.gzhky.2021.000032
Cao, W., Huang, L., Xiao, T., and Wu, D. (2019). Effects of human activities on the ecosystems of China’s National Nature Reserves. Acta Ecol. Sin. 39, 1338–1350. doi:10.5846/stxb201808251814
Cen, Q., Zhou, X., and Qiu, H. (2024). Exploration of urban neighborhood blue-green space quality patterns and influencing factors in waterfront cities based on MGWR and OPGD models. Urban Clim. 55, 101942. doi:10.1016/j.uclim.2024.101942
Dähler, N. B., Holderegger, R., Info, flora, and Bergamini, A. (2019). Effectiveness of Swiss protected areas in maintaining populations of rare vascular plants. J. Nat. Conserv. 52, 125749. doi:10.1016/j.jnc.2019.125749
Domingo-Marimon, C., Jenerowicz-Sanikowska, M., Pesquer, L., Ruciński, M., Krupiński, M., Woźniak, E., et al. (2024). Developing an early warning land degradation indicator based on geostatistical analysis of Ecosystem Functional Types dynamics. Ecol. Indic. 169, 112815. doi:10.1016/j.ecolind.2024.112815
Duan, Y., Di, B., Ustin, S. L., Xu, C., Xie, Q., Wu, S., et al. (2021). Changes in ecosystem services in a montane landscape impacted by major earthquakes: a case study in Wenchuan earthquake-affected area, China. Ecol. Indic. 126, 107683. doi:10.1016/j.ecolind.2021.107683
Fan, Z., Duan, J., Lu, Y., Zou, W., and Lan, W. (2021). A geographical detector study on factors influencing urban park use in Nanjing, China. Urban For. Urban Green. 59, 126996. doi:10.1016/j.ufug.2021.126996
Garces, L. R., Pido, M. D., Tupper, M. H., and Silvestre, G. T. (2013). Evaluating the management effectiveness of three marine protected areas in the Calamianes Islands, Palawan Province, Philippines: process, selected results and their implications for planning and management. Ocean. Coast. Manag. 81, 49–57. doi:10.1016/j.ocecoaman.2012.07.014
Gaveau, D. L. A., Epting, J., Lyne, O., Linkie, M., Kumara, I., Kanninen, M., et al. (2009). Evaluating whether protected areas reduce tropical deforestation in Sumatra. J. Biogeogr. 36, 2165–2175. doi:10.1111/j.1365-2699.2009.02147.x
Geldmann, J., Manica, A., Burgess, N. D., Coad, L., and Balmford, A. (2019). A global-level assessment of the effectiveness of protected areas at resisting anthropogenic pressures. Proc. Natl. Acad. Sci. 116, 23209–23215. doi:10.1073/pnas.1908221116
Harris, N. C., Mills, K. L., Harissou, Y., Hema, E. M., Gnoumou, I. T., VanZoeren, J., et al. (2019). First camera survey in Burkina Faso and Niger reveals human pressures on mammal communities within the largest protected area complex in West Africa. Conserv. Lett. 12, e12667. doi:10.1111/conl.12667
He, C., Liu, Z., Tian, J., and Ma, Q. (2014). Urban expansion dynamics and natural habitat loss in China: a multiscale landscape perspective. Glob. Change Biol. 20, 2886–2902. doi:10.1111/gcb.12553
He, H., Yu, X., Yu, H., Ma, Z., Luo, Y., Liu, T., et al. (2024). Suitable habitat evaluation and ecological security pattern optimization for the ecological restoration of Giant Panda habitat based on nonstationary factors and MCR model. Ecol. Model. 494, 110760. doi:10.1016/j.ecolmodel.2024.110760
Hellwig, N., Walz, A., and Markovic, D. (2019). Climatic and socioeconomic effects on land cover changes across Europe: does protected area designation matter? PLOS ONE 14, e0219374. doi:10.1371/journal.pone.0219374
Huang, K., Peng, L., Wang, X., and Chen, T. (2022). Integrating landscape connectivity and natural-anthropogenic interaction to understand karst vegetation restoration: a case study of guizhou province, China. Front. Ecol. Evol. 10, 844437. doi:10.3389/fevo.2022.844437
Jiao, K.-W., Gao, J.-B., Liu, Z.-H., Wu, S.-H., and Fletcher, T. L. (2021). Revealing climatic impacts on the temporal and spatial variation in vegetation activity across China: sensitivity and contribution. Adv. Clim. Change Res. 12, 409–420. doi:10.1016/j.accre.2021.04.006
Joppa, L., and Pfaff, A. (2010). Reassessing the forest impacts of protection the challenge of nonrandom location and a corrective method. Ann. N. Y. Acad. Sci. 1185, 135–149. doi:10.1111/j.1749-6632.2009.05162.x
Joppa, L. N., and Pfaff, A. (2009). High and far: biases in the location of protected areas. PLOS ONE 4, e8273. doi:10.1371/journal.pone.0008273
Kang, D., and Li, J. (2018). Role of nature reserves in giant panda protection. Environ. Sci. Pollut. Res. 25, 4474–4478. doi:10.1007/s11356-017-0831-3
Li, C., Yu, J., Wu, W., Hou, R., Yang, Z., Owens, J. R., et al. (2021). Evaluating the efficacy of zoning designations for national park management. Glob. Ecol. Conserv. 27, e01562. doi:10.1016/j.gecco.2021.e01562
Li, G., Sun, S., Han, J., Yan, J., Liu, W., Wei, Y., et al. (2019). Impacts of Chinese grain for green program and climate change on vegetation in the loess plateau during 1982–2015. Sci. Total Environ. 660, 177–187. doi:10.1016/j.scitotenv.2019.01.028
Li, L., Fan, Z., Feng, W., Yuxin, C., and Keyu, Q. (2022). Coupling coordination degree spatial analysis and driving factor between socio-economic and eco-environment in northern China. Ecol. Indic. 135, 108555. doi:10.1016/j.ecolind.2022.108555
Li, Y., and Song, Z. (2022). Have protected areas in China achieved the ecological and economic “win-win” goals? Evidence from the Giant Panda Reserves of the Min Mont Range. For. POLICY Econ. 144, 102845. doi:10.1016/j.forpol.2022.102845
Liao, Z., Wang, X., Zhang, Y., Qing, H., Li, C., Liu, Q., et al. (2024). An integrated simulation framework for NDVI pattern variations with dual society-nature drives: a case study in Baiyangdian Wetland, North China. Ecol. Indic. 158, 111584. doi:10.1016/j.ecolind.2024.111584
Liu, H., Li, S., and Luo, Q. (2024). Evaluation of effectiveness of nature reserves of the Yangtze River Economic Belt in reducing human disturbance. Acta Ecol. Sin. 44, 3172–3184. doi:10.20103/j.stxb.202308171780
Liu, Y., Tian, J., Liu, R., and Ding, L. (2021). Influences of climate change and human activities on NDVI changes in China. Remote Sens. 13, 4326. doi:10.3390/rs13214326
Luo, C., Yang, H., Luo, P., Liu, S., Wang, J., Wang, X., et al. (2022). Spatial-temporal change for ecological intactness of giant panda national park and its adjacent areas in sichuan province, China. Divers.-BASEL 14, 485. doi:10.3390/d14060485
Ni, J., Wang, S., and Zhang, D. (2020). Discussion on the construction of giant panda national park system pilot area. Int. J. Geoheritage Parks, China’s Natl. Park Syst. 8, 215–219. doi:10.1016/j.ijgeop.2020.11.011
Olmuş, H., Beşpınar, E., and Nazman, E. (2022). Performance evaluation of some propensity score matching methods by using binary logistic regression model. Commun. Stat. - Simul. Comput. 51, 1647–1660. doi:10.1080/03610918.2019.1679181
Pu, M., Zhao, Y., Ni, Z., Huang, Z., Peng, W., Zhou, Y., et al. (2022). Spatial-temporal evolution and driving forces of NDVI in China’s giant panda national park. Int. J. Environ. Res. Public. Health 19, 6722. doi:10.3390/ijerph19116722
Qin, Q., Huang, Y., Liu, J., Chen, D., Zhang, L., Qiu, J., et al. (2019). The landscape patterns of the giant panda protection area in sichuan province and their impact on giant pandas. SUSTAINABILITY 11, 5993. doi:10.3390/su11215993
Qin, Q., Wang, S., Chen, D., Hao, C., and Tan, H. (2023). Evaluation and analysis of the management effectiveness of giant panda protected areas. Landsc. Archit. Acad. J. 40, 31–38.
Radeloff, V. C., Stewart, S. I., Hawbaker, T. J., Gimmi, U., Pidgeon, A. M., Flather, C. H., et al. (2010). Housing growth in and near United States protected areas limits their conservation value. Proc. Natl. Acad. Sci. 107, 940–945. doi:10.1073/pnas.0911131107
Rosenbaum, P. R., and Rubin, D. B. (1983). The central role of the propensity score in observational studies for causal effects. Biometrika 70, 41–55. doi:10.1093/biomet/70.1.41
Ruan, T., Han, H., Wei, W., Qiu, L., Hong, M., Tang, J., et al. (2021). Habitat suitability evaluation for giant panda in liziping national nature reserve, sichuan province. Glob. Ecol. Conserv. 30, e01780. doi:10.1016/j.gecco.2021.e01780
Shen, J., Song, Z., Duan, W., and Zhang, Y. (2021). Exploring local challenges and adaptation strategies in the establishment of National Parks in giant panda habitats. Glob. Ecol. Conserv. 30, e01764. doi:10.1016/j.gecco.2021.e01764
Song, Y., Wang, J., Ge, Y., and Xu, C. (2020). An optimal parameters-based geographical detector model enhances geographic characteristics of explanatory variables for spatial heterogeneity analysis: cases with different types of spatial data. GIScience Remote Sens. 57, 593–610. doi:10.1080/15481603.2020.1760434
Song, Z., and Li, Y. (2021). Quantifying ecological performance of giant panda conservation: evidence from sichuan province. FORESTS 12, 1701. doi:10.3390/f12121701
Wang, G., Peng, W., Zhang, L., and Zhang, J. (2023). Quantifying the impacts of natural and human factors on changes in NPP using an optimal parameters-based geographical detector. Ecol. Indic. 155, 111018. doi:10.1016/j.ecolind.2023.111018
Wang, J., Wang, Z., Cheng, H., Kang, J., and Liu, X. (2022). Land cover changing pattern in pre- and post-earthquake affected area from remote sensing data: a case of lushan county, sichuan province. LAND 11, 1205. doi:10.3390/land11081205
Wang, J., and Xu, C. (2017). Geodetector: principle and prospective. Acta Geogr. Sin. 72, 116–134. doi:10.11821/dlxb201701010
Wang, S., Li, Z., Long, Y., Yang, L., Ding, X., Sun, X., et al. (2024). Impacts of urbanization on the spatiotemporal evolution of ecological resilience in the plateau lake area in central yunnan, China. Ecol. Indic. 160, 111836. doi:10.1016/j.ecolind.2024.111836
Wu, H., Fang, S., Yang, Y., and Cheng, J. (2022). Changes in habitat quality of nature reserves in depopulating areas due to anthropogenic pressure: evidence from Northeast China, 2000–2018. Ecol. Indic. 138, 108844. doi:10.1016/j.ecolind.2022.108844
Xu, H., Sun, H., Zhang, T., Xu, Z., Wu, D., and Wu, L. (2023). Remote sensing study on the coupling relationship between regional ecological environment and human activities: a case study of qilian mountain national nature reserve. SUSTAINABILITY 15, 11177. doi:10.3390/su151411177
Xu, Y., Dai, Q.-Y., Lu, Y.-G., Zhao, C., Huang, W.-T., Xu, M., et al. (2024). Identification of ecologically sensitive zones affected by climate change and anthropogenic activities in Southwest China through a NDVI-based spatial-temporal model. Ecol. Indic. 158, 111482. doi:10.1016/j.ecolind.2023.111482
Xu, Y., and Tang, J. (2024). Examining the rationality of Giant Panda National Park’s zoning designations and management measures for habitat conservation: insights from interpretable machine learning methods. Sci. Total Environ. 920, 170955. doi:10.1016/j.scitotenv.2024.170955
Xue, C., Shao, C., and Gao, J. (2020). Ecological compensation strategy for SDG-based basin-type national Parks: a case study of the baoxing giant panda national park. Int. J. Environ. Res. Public. Health 17, 3908. doi:10.3390/ijerph17113908
Yang, H., Huang, Q., Zhang, J., Songer, M., and Liu, J. (2021a). Range-wide assessment of the impact of China’s nature reserves on giant panda habitat quality. Sci. TOTAL Environ. 769, 145081. doi:10.1016/j.scitotenv.2021.145081
Yang, X., Meng, F., Fu, P., Zhang, Y., and Liu, Y. (2021b). Spatiotemporal change and driving factors of the eco-environment quality in the yangtze river basin from 2001 to 2019. Ecol. Indic. 131, 108214. doi:10.1016/j.ecolind.2021.108214
Ye, D., Yang, L., and Zhou, M. (2023). Spatiotemporal variation in ecosystem health and its driving factors in guizhou province. Land 12, 1439. doi:10.3390/land12071439
Yi, F., Yang, Q., Wang, Z., Li, Y., Cheng, L., Yao, B., et al. (2023). Changes in land use and ecosystem service values of dunhuang oasis from 1990 to 2030. Remote Sens. 15, 564. doi:10.3390/rs15030564
Zhang, H., Li, X., Shi, H., and Liu, X. (2021). An assessment of the effectiveness of China’s nature reserves for mitigating anthropogenic pressures based on propensity score matching. Acta Geogr. Sin. 76, 680–693. doi:10.11821/dlxb202103013
Zhang, X., Liao, L., Huang, Y., Fang, Q., Lan, S., and Chi, M. (2023a). Conservation outcome assessment of Wuyishan protected areas based on InVEST and propensity score matching. Glob. Ecol. Conserv. 45, e02516. doi:10.1016/j.gecco.2023.e02516
Zhang, X., Zhong, L., and Zhang, H. (2023b). Using propensity score matching models to assess the protection effectiveness in Pudacuo national Park, China. Ecol. Indic. 150, 110222. doi:10.1016/j.ecolind.2023.110222
Zhang, Z., Tang, Y., Pan, H., Yao, C., and Zhang, T. (2022). Assessment of the ecological protection effectiveness of protected areas using propensity score matching: a case study in sichuan, China. Int. J. Environ. Res. Public. Health 19, 4920. doi:10.3390/ijerph19084920
Zhao, Y., Chen, Y., Ellison, A. M., Liu, W., and Chen, D. (2019). Establish an environmentally sustainable giant panda national park in the qinling mountains. Sci. TOTAL Environ. 668, 979–987. doi:10.1016/j.scitotenv.2019.03.070
Keywords: NDVI, propensity score matching (PSM), ecological protection effectiveness, driving factor, OPGD model
Citation: Meng B, Wang M, Zhang Z and Pan H (2025) Evaluation and driving force analysis of relative effectiveness in the giant panda national park in Sichuan, China. Front. Environ. Sci. 12:1512640. doi: 10.3389/fenvs.2024.1512640
Received: 18 October 2024; Accepted: 19 December 2024;
Published: 07 January 2025.
Edited by:
Sawaid Abbas, University of the Punjab, PakistanReviewed by:
Yuheng Li, Chinese Academy of Sciences (CAS), ChinaShicheng Li, China University of Geosciences Wuhan, China
Copyright © 2025 Meng, Wang, Zhang and Pan. This is an open-access article distributed under the terms of the Creative Commons Attribution License (CC BY). The use, distribution or reproduction in other forums is permitted, provided the original author(s) and the copyright owner(s) are credited and that the original publication in this journal is cited, in accordance with accepted academic practice. No use, distribution or reproduction is permitted which does not comply with these terms.
*Correspondence: Hongyi Pan, cGFuaG9uZ3lpODBAc2ljbnUuZWR1LmNu
 Bao Meng
 Mengchao Wang3
 Zhifeng Zhang