- 1Faculty of Geography, Yunnan Normal University, Kunming, China
- 2Yunnan Surverying and Mapping Institute Co. Ltd., Kunming, China
Altitude differentiation has a substantial effect on the synergistic control of PM2.5 and O3 pollution. This study targets the Fenwei Plain, which is affected by mountain range blockage, divided into different altitude scales, and employs the methods of correlation analysis and geographical detector to explore the spatiotemporal heterogeneity of PM2.5 and O3 between different altitude zones and to identify the key controlling factors of pollutants between different altitude areas. The results showed that PM2.5 showed a significant decreasing trend from 2014 to 2023, whereas O3 exhibited an opposite trend. The concentrations of both pollutants decreased with increasing altitude, particularly for PM2.5, which showed significant altitudinal differentiation under the influence of topography. PM2.5 was negatively correlated with gross domestic product (GDP) and precipitation, and positively correlated with SO2. In contrast, the correlation of O3 with these factors was opposite to that of PM2.5. For spatial differentiation, NO2 and SO2 were the main factors influencing the spatial differentiation of PM2.5 and O3 at different altitudes. The explanatory power of the spatial divergence of PM2.5 and O3 was greatly increased by the interactions between the two precursors and between the precursors and meteorological factors. Furthermore, the explanatory power of the PM2.5 dominant factor increased with elevation, while the explanatory power of the O3 dominant factor was relatively high across low, middle, and high altitudes. This study serves as a guide for reducing air pollution in the Fenwei Plain and offers a novel perspective for the study of PM2.5 and O3 influenced by terrain.
1 Introduction
Atmospheric pollution is currently the greatest barrier to the development of a global ecological civilization and a focal point for environmental studies (Zhang et al., 2021; Ioannis et al., 2020). In 2021, the Chinese government issued documents specifically to provide crucial directives for the management of air pollution. These directives mandate that amid the fight against O3 pollution, achieve the synergistic control of fine particles and O3 (Sun and Huang, 2021). In 2023, the Action Plan for Continuous Improvement of Air Quality similarly emphasizes the need to reduce PM2.5 concentrations as the main line of action, with synergistic emission reductions of nitrogen oxides (NOx) and volatile organic compounds (VOCs), and sets the target of significantly reducing pollutant concentrations in key regions such as the Beijing-Tianjin-Hebei region, the Yangtze River Delta and the Fenwei Plain by 2025 (CPsGotPsRo, 2023). PM2.5 and O3, as typical air pollutants, have pollution areas that are both overlapped and differentiated pollution areas. At the same time that PM2.5 continues to decline, it is essential to effectively halt the rise in O3. The top priority for air pollution prevention is to achieve synergistic management of the two types of pollutants (Liu and Liao, 2021; Ji, 2021). Consequently, scientific understanding of the features of the spatiotemporal variation and influencing factors of PM2.5 and O3 has evolved into a crucial scientific foundation for the coordinated management of air pollution (Zhang et al., 2021; Wang et al., 2022a; Hui et al., 2021).
Scholars from both domestic and foreign countries have conducted multiple studies on PM2.5 and O3, focusing on the spatiotemporal characteristics of pollutants, the causes, health and ecological risks of environmental exposure, and influencing variables of air pollution (Yan et al., 2016; Bai et al., 2018; Chen et al., 2019; Huang C. et al., 2021; Lu et al., 2017; Xu et al., 2021a). For the spatiotemporal characteristics of air pollution, mathematical statistics, spatial autocorrelation analysis, spatial interpolation, hotspot analysis, and trend analysis were primarily employed to reflect the spatial-temporal features of pollutants (Bai et al., 2018; Huang C. et al., 2021; Lei et al., 2022; Wu et al., 2023; Ali-Taleshi et al., 2022). Research indicates that air pollution, including PM2.5, O3 and aerosol optical depth (AOD), is highly heterogeneous in space and time in different areas (Huang et al., 2024; Su et al., 2024; Dong et al., 2019). For the analysis of the causes of air pollution, backward trajectory analysis, potential source contribution function (PSCF) analysis, physical and chemical models, concentration weight matrices, and other techniques have been extensively used (Xiao et al., 2022; Ma et al., 2021; Fang et al., 2021; Masiol et al., 2017; Xu et al., 2021b). For the health and ecological risks of environmental exposure to pollutants, health risks and ecological risks due to pollutants are mainly assessed using methods such as environmental exposure risk modelling, ecological risk assessment and health exposure response functions (Xu et al., 2018; Zou et al., 2019; Zhao et al., 2022; Wang L. et al., 2022). For the influencing factors of air pollution, geographically weighted regression models, multiple linear regression models, geographical detectors, and other models and methods were primarily used to investigate the primary influencing factors of pollutants. The geographic detector, which is not constrained by conditions such as linearity and non-linearity and is extensively utilized to identify the spatial distinction between terrestrial objects and the underlying driving factors (Liu and Liao, 2021; Chen L. et al., 2020; He et al., 2022; Wei et al., 2019; Shen et al., 2022; Wang et al., 2022c). Additionally, several studies have shown that the primary contributors to PM2.5 and O3 pollution include precursor pollutants, societal and economic factors, and meteorological conditions. Meteorological factors impact PM2.5 and O3 through pollutant transport, diffusion, chemical transformations, and wet and dry deposition (Chen Z. et al., 2020). Temperature and precipitation play a significant role, but their influence on PM2.5 and O3 varies spatially (Xia et al., 2022). In addition, socio-economic factors such as economic development, urbanization, and population expansion impact PM2.5 and O3. Precursor pollutants like SO2 and NOx, primarily from burning fuels like industrial coal, are also essential for preventing and controlling air pollution as they directly contribute to the development of PM2.5 and O3 (Liu, 2021; Dai et al., 2021; Duan et al., 2021; Dan et al., 2019; Wu et al., 2021; Bo et al., 2020; Xiaoyuan et al., 2010).
During the 14th Five-Year Plan period, China optimized and modified the key areas for air pollution avoidance and governance, focusing particularly on the three regions of the Fenwei Plain, Yangtze River Delta, and Beijing-Tanjin-Hebei (Liu and Liao, 2021; Ji, 2021; Qin et al., 2020; Dai et al., 2022). Numerous studies on air pollution have been conducted in the latter two economically developed regions, whereas research on the Fenwei Plain is relatively limited. Fenwei Plain is the most developed area of industrial and agricultural agriculture in Shaanxi Province, where transportation is primarily dependent on roads and the industrial structure is dominated by chemical industries. The region is primarily characterized by heavy industries, with coal accounting for more than 90% of energy consumption and coke production accounting for approximately 15% of the nation (Huang et al., 2019). The Fenhe Plain and the Weihe Plain, which are connected by the Fenhe River and the Weihe River, converge in the valley of the Yellow River, creating the distinctive basin terrain of the Fenwei Plain. This geographical feature hinders the spread of pollutants, making this area vital for air pollution control and management in China (Xu D. et al., 2021). In addition, prior research has demonstrated that topography resulted in notable geographic differences in PM2.5 and O3 pollution (Zhao et al., 2020; Huang X. et al., 2021). Various altitudinal regions may have distinct pollution characteristics and influencing factors. Existing research on PM2.5 and O3 pollution has mainly focused on a single scale or pollutant, neglecting spatial variations in elevation and the interactions between PM2.5 and O3. Additionally, these studies failed to adequately explore the connection between altitudes and pollutants under the special topography such as the Fenwei Plain.
In light of this, this study thoroughly examined the impact of topography on PM2.5 and O3 by focusing on the Fenwei Plain. The area was categorized into three altitude regions (low, middle, and high) based on digital elevation model (DEM) data. Firstly, we showed the spatial and temporal characteristics of PM2.5 and O3, along with elevation differences from 2014 to 2023. Secondly, the relationship between pollutants (PM2.5 and O3) and influencing factors was explored by combining meteorological (temperature and precipitation), socioeconomic (night light index, population, and GDP), and precursor factors (NO2 and SO2). Finally, the primary driving elements and interactions of PM2.5 and O3 at different altitudes were detected using the geographical detector. This study also compared the similarities and differences between the influencing variables of the two pollutants. The study’s findings are significant for the coordinated management of PM2.5 and O3 in the Fenwei Plain and offer a fresh outlook on regional PM2.5 and O3 pollution in comparable basin topographies. They also serve as a crucial foundation for creating tailored air pollution management strategies at varying altitudes.
2 Materials and methods
2.1 Data sources and processing
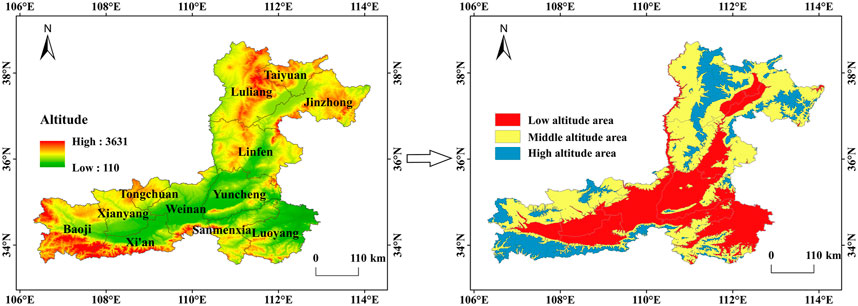
The following four segments make up the majority of the study’s data: (1): ChinaHighAirPollutants dataset (CHAP). The data is sourced from https://weijing-rs.github.io/product.html. It is a high-coverage, high-precision, and near-surface air pollutant dataset created by combining extensive data from ground-based observations, atmospheric reanalysis, emission inventories, and model simulations (Wei et al., 2022; Wei et al., 2023a). It considers the spatial and temporal heterogeneity of atmospheric pollution and was developed using artificial intelligence methods by Wei et al. (2020). The cross-validation coefficient of determination (CV-R2) is 0.92, and the root mean square error (RMSE) is 10.76 μg/m3, indicating great accuracy and suitability for this study (Wei et al., 2023b). This study obtained the annual average data for PM2.5 and O3 in the Fenwei Plain from the CHAP dataset for the period from 2014 to 2023, as well as the annual average raster data for NO2 and SO2 from 2014 to 2020. The spatial resolution was 1 km for the PM2.5 dataset and 10 km for the O3, NO2, and SO2 datasets. (2) Meteorological data. It primarily consists of temperature and precipitation raster data from the CRU TS website (https://crudata.uea.ac.uk/cru/data/hrg/) to provide monthly data covering the land surface with a spatial resolution of 0.5° for 2014–2020. The dataset was interpolated to a 1 km spatial resolution using the inverse distance weighted (IDW) method and processed as annual data in the study. (3) Socioeconomic data. It is primarily comprised of population, GDP, and night light data (NLI), which can reflect the economic situation. The Chinese GDP spatial distribution km grid dataset is maintained by the Chinese Academy of Sciences’ Institute of Geographic Sciences and Resources. Demographic data can represent the region’s population agglomeration degree. The University of Southampton initiated, developed, and generated the Open High Resolution Geospatial Dataset (https://hub.worldpop.org/) on population distribution, demographics, and dynamic data. The night light data, which can characterize the vitality of cities, was a raster dataset that calculated the average value of the grid using the NPP/VIIRS remote sensing light data set of 2014–2020. (4) DEM data. The information originates from the Resource Environmental Science and Data Centre (http://www.resdc.cn/). In order to find out the differences in spatiotemporal features and impact factors of PM2.5 and O3 between various altitudes, the Fenwei Plain was divided into low altitude area (110 km–815 km), middle altitude area (815 km–1,379 km), and high altitude area (1,379 km–3631 km) by using the natural breakpoint method in this study. The DEM map and division results are shown in Figure 1. All the above data were resampled to 1 km and cropped to the study area and different elevation scales for analysis. However, due to the limitations of the impact factor data, the multi-year average of the 2014–2020 data was used for the impact factor analyses in both the correlation analyses and geographical detector in this study.
2.2 Methods
2.2.1 Theil-Sen Median and Mann-Kendall
Theil-Sen media trend analysis and Mann-Kendall significance test are two non-parametric tests. The method does not require the data to satisfy normal distribution, and is also capable of eliminating the interference of outliers and reflecting the overall trend of the time series (Li et al., 2023). In this study, Theil-Sen median trend analysis and Mann-Kendall test were used to analyze the trends of PM2.5 and O3. The formula is shown in Equation 1 (Chen and Zhang, 2024):
where
The Mann-Kendall (MK) significance test used to detect the significance of data under long time series. The formulas for its calculation are shown as Equations 2–5:
where
2.2.2 Spatial autocorrelation analysis
Spatial autocorrelation is a method for determining whether spatially constant variables are dependent on one another within the same distribution. This study used the global Moran’s I to calculate whether pollutants have noticeable spatial agglomeration features. The formula is shown in Equation 6 (Li et al., 2022):
where n represents the total amount of grids;
Additionally, this study employed the local Moran’s I to assess the clustering of pollutants’ local regions, thereby revealing the similarity or difference between spatial objects and their surrounding space. The formula is shown in Equation 7 (Yuan et al., 2022):
where
2.2.3 Pearson correlation analysis
Pearson correlation analysis reflects the correlation between the two variables. The correlations between pollutants and influencing factors were depicted in this study using Pearson correlation analysis (Yang et al., 2019). The formula is shown in Equation 8:
where
2.2.4 Geographical detector
Geographical detector can explain the spatial differentiation of geographical phenomena and elucidate their underlying causes. The fundamental idea is that the spatial distributions of X and Y should tend to be similar if X, the independent variable, significantly influences Y, the dependent variable (Cao et al., 2013). Utilizing the factor detector and interaction detector in the geographical detector, the primary influencing variables and interactions of the spatial distribution of pollutants were examined in this paper.
Factor detector involves the detection of the space difference of Y, the dependent variable, and exploring the extent to which a factor X explains the spatial differentiation of Y, measured by the value of
where
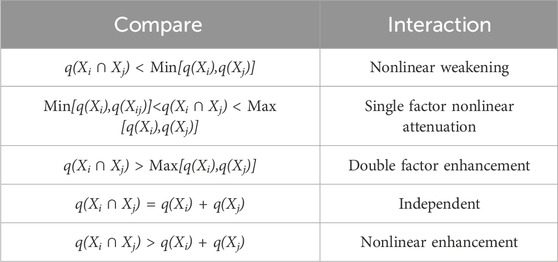
Interaction detector is the process of finding interactions between various risk variables, i.e., determining whether Xi and Xj together will increase or decrease the explaining ability of the dependent variable Y or whether X is not dependent on Y (Lin et al., 2021). The interaction results are presented in Table 1.
3 Results
3.1 The temporal variation characteristics of PM2.5 and O3
Figure 2 depicts the annual variation of PM2.5 and O3 concentrations in Fenwei Plain from 2014 to 2023. The mean PM2.5 in Fenwei Plain was 41.66 μg/m3, which exceeded the national secondary concentration limit of 35 μg/m3. The mean O3 was 98.67 μg/m3, which was lower than the national primary concentration limit of 100 μg/m3. Figure 2A shows the overall downward trend of PM2.5 in Fenwei Plains (decline coefficient: 1.4347 μg/m3/a), but it begins to show a slight increasing trend in 2021. In contrast to the tendency for PM2.5 to change over time, O3 showed an upward trend (upper coefficient: 3.5459 μg/m3/a), peaking in 2023 after a brief decrease in 2021. Figure 2B demonstrates that the concentration change trend of the two pollutants at different altitudes was essentially consistent with the annual change of the entire region, with an upward trend for O3 and a downward trend for PM2.5. The concentration level decreased from high to low as follows: low altitude area > middle altitude area > high altitude area. The PM2.5 in low altitude areas was decreasing the most, with a concentration difference of 10–20 μg/m3. Compared to PM2.5, the difference in O3 between different altitudes is smaller. However, after 2016, the differences began to gradually increase, especially at middle and high altitudes.
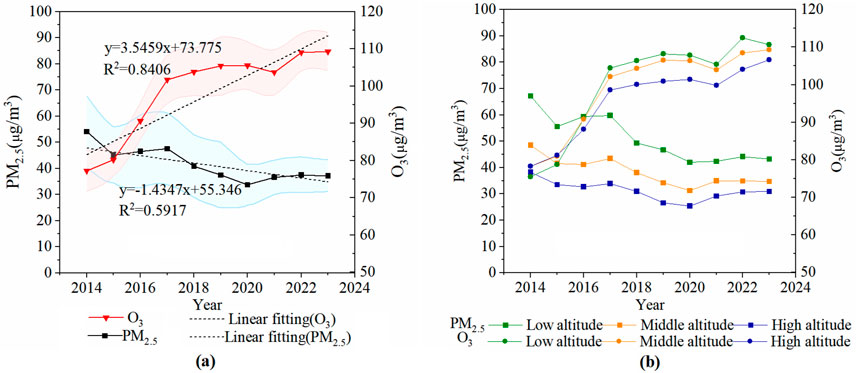
Figure 2. Annual change of PM2.5 and O3 in Fenwei Plain from 2014 to 2023 [The red area in (A) is the PM2.5 error band; the blue area is the O3 error band]. (A) The entire area, (B) The different altitudes.
3.2 The spatial variation characteristics of PM2.5 and O3
3.2.1 Spatial variation characteristic of PM2.5
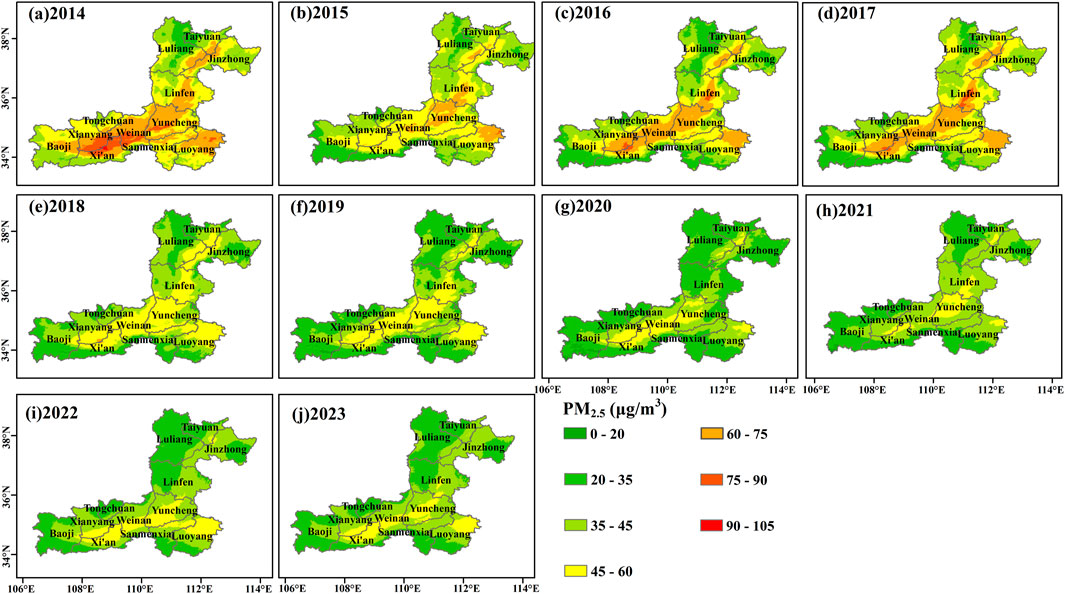
Figure 3 depicts the spatial variation of PM2.5 in Fenwei Plain from 2014 to 2023. From 2014 to 2017, concentrations were greater than 75 μg/m3 at most low to middle altitudes areas. Over time, the extent of the high pollution zone is gradually reduced, with concentrations below 75 μg/m3 throughout the Fenwei Plain by 2020. It is evident that the Fen Wei Plain’s PM2.5 pollution is steadily getting better. Notably, PM2.5 exhibited a spatial pattern of high concentration in the middle areas and low concentration in the surrounding areas. The high pollution areas are mainly found in the low altitude areas such as Yuncheng, Xianyang, Weinan, and Linfen, while the PM2.5 concentration in the high altitude and other marginal areas is low. This phenomenon may be attributed to topographical factors; specifically, the terrain of the Fenwei Plain is relatively low in its center while rising on all sides, which hampers pollutant dispersion and contributes to significant PM2.5 pollution within the Fenwei Plain Basin.
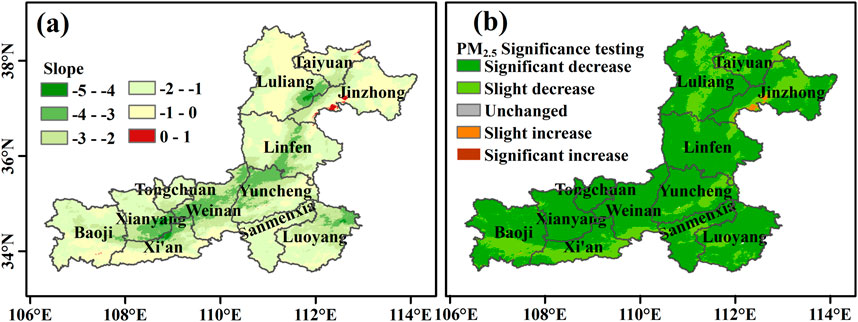
To further reflect the trend of PM2.5, this study used Theil-Sen trend analysis and Mann-Kendall significance to explore the trend of PM2.5 from 2014 to 2023. The results are displayed in Figure 4. In the majority of areas, the PM2.5 slope was smaller than 0, suggesting a general downward trend in PM2.5. The type of declining trend is dominated by significant declines, with a few areas of slight declines concentrated in high altitude areas of the Fenwei Plain. Moreover, in contrast to the spatial distribution pattern of PM2.5, the slope of PM2.5 overall decreased as elevation decreased, and the more significant the declining tendency, the lower the height. Even if the PM2.5 concentrations were higher at lower elevations, it was evident that these areas have been remarkably treated, particularly in Xianyang, Yuncheng, and Weinan.
3.2.2 Spatial variation characteristic of O3
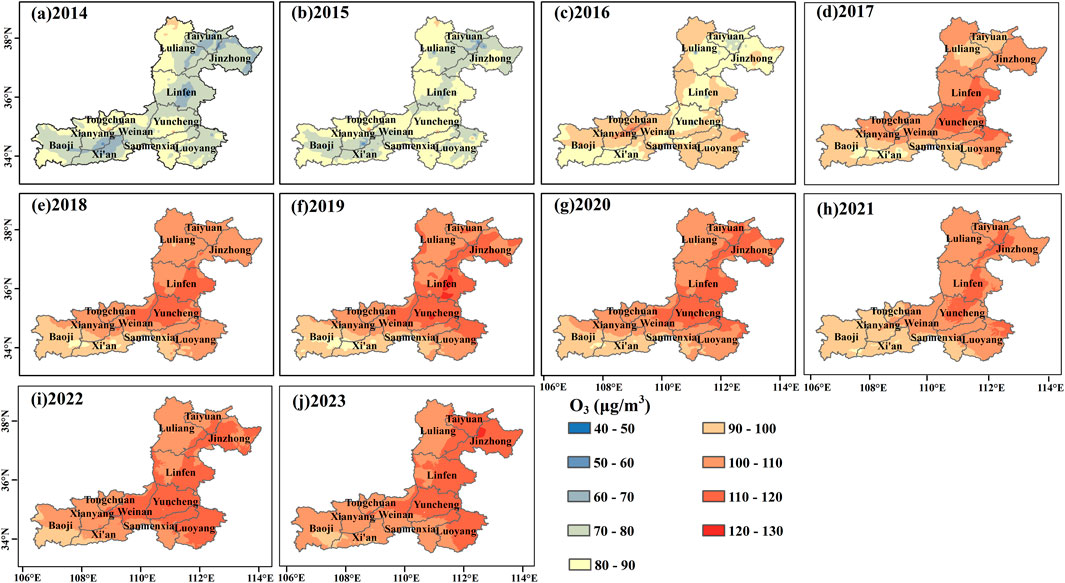
Figure 5 depicts the O3 spatial variation from 2014 to 2023. From 2014 to 2016, O3 in the majority of the Fenwei Plain was below the national concentration limit of 100 μg/m3. In 2017, O3 in the Fenwei Plain increased significantly, with the most notable increases in Yuncheng and Linfen. Between 2017 and 2023, O3 pollution progressively spread from the central to the eastern regions, leading to an overall distribution of O3 that was east-high and west-low. By 2023, O3 level in the Fenwei Plain exceeded 110 μg/m3 in the east and 100 μg/m3 in the west. By 2023, the concentration of O3 in the eastern region of the Fenwei Plain was higher than 110 μg/m3, and the concentration in the western region was also more than 100 μg/m3.
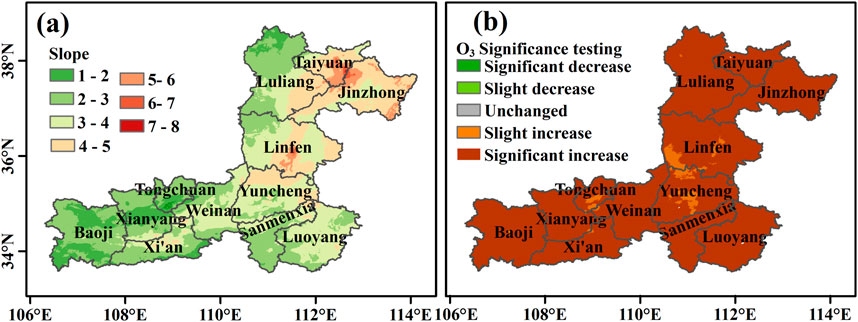
The O3 trend analysis and significance test findings from 2014 to 2023 are shown in Figure 6. Over the whole region, the O3 slope were more than 0. The O3 concentration exhibited a noteworthy increase in the majority of the regions, particularly in the central regions of Jinzhong, Linfen, and Taiyuan, where the upward trend was particularly considerable and the slopes were greater. Moreover, although it was less noticeable than that of PM2.5, the trend of O3 also displayed an altitude differentiation feature.
3.2.3 Spatial distribution characteristics of PM2.5 and O3 at different altitudes
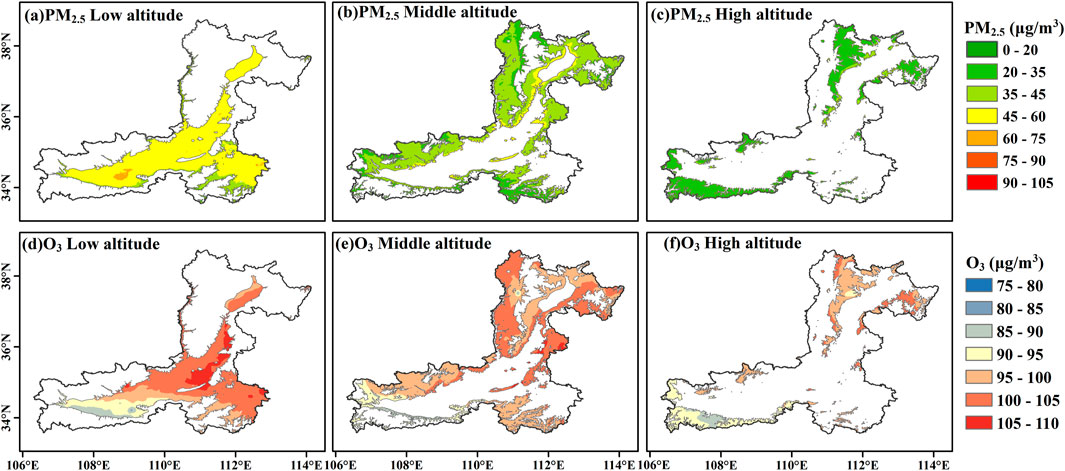
Figure 7 depicts the multi-year average values of PM2.5 and O3 at different altitudes. The PM2.5 concentrations varied significantly at low, middle, and high altitudes, followed by: low altitude area 50.97 μg/m3 > middle altitude area 38.28 μg/m3 > high altitude area 31.22 μg/m3. The concentration difference of O3 is not obvious, followed by: low altitude area 100.07 μg/m3 > middle altitude area 99.11 μg/m3 > high altitude area 95.92 μg/m3. In low altitude area, PM2.5 was greater than 45 μg/m3, whereas the concentration in the majority of regions was between 45–60 μg/m3. The highest concentration of O3 was in the central region, while the concentration was substantially higher in the northern region than the southern region. In the middle altitude area, the range of PM2.5 in most areas was 20–60 μg/m3, and the range of O3 was 90–100 μg/m3. In high altitude area, the PM2.5 range was 0–35 μg/m3, and the O3 range was 80–95 μg/m3. Combining the spatiotemporal distribution of PM2.5 and O3 at different altitudes revealed that the two pollutants had similar changes as a result of the terrain, as concentrations for both were as follows: low altitude area > middle altitude area > high altitude area. This phenomenon may be attributable to the influence of social and economic factors such as vehicles, factories, and other pollutants in low-altitude regions, which result in high pollutant concentrations, while less artificial pollution in high-altitude regions results in low concentrations. In addition, compared to the change in O3, the elevation gradient of PM2.5 was significantly greater, indicating that terrain significantly affected PM2.5 but had a smaller impact on O3.
3.2.4 Spatial clustering characteristics of PM2.5 and O3
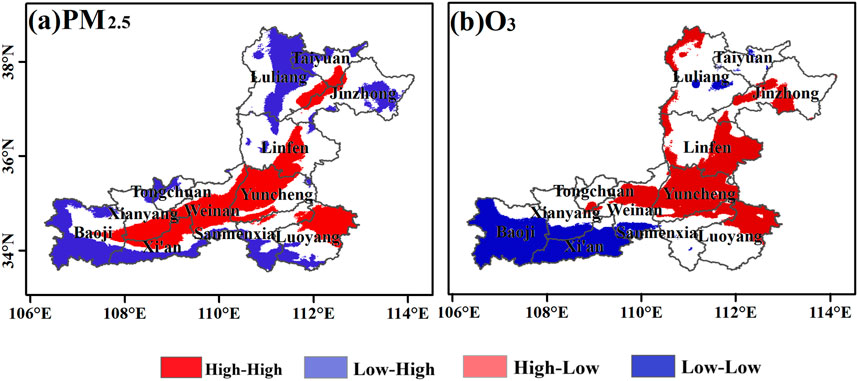
The analysis of the global spatial autocorrelation of PM2.5 and O3 in Fenwei Plain revealed that the global Moran’s I of PM2.5 and O3 was greater than 0.9, indicating significant spatial autocorrelation and spatial agglomeration. Figure 8A shows that the ‘High-High’ clustering of PM2.5 was primarily found in low altitude areas of Linfen, Yuncheng, Xianyang, Luoyang, Weinan, and Xi’an, as well as at the junction of Lvliang, Taiyuan, and Jinzhong. These areas and their surroundings exhibited high levels of PM2.5 pollution, making them the regions with significant PM2.5 pollution in Fenwei Plain. The “low-low” clustering of PM2.5 was primarily found in high altitude areas like the west side of Taiyuan, the central part of Lvliang, the southeastern part of Jinzhong, and the southern edge of the Fenwei Plain. This suggests that these areas and their surroundings have generally low levels of PM2.5 and are less polluted. As shown in Figure 8B, the clustering of high levels of O3 was predominantly found in middle and low altitude areas, such as Yuncheng, Weinan, the northern part of Luoyang, the estern part of Linfen, northern part of Jinzhong, and the northwestern fringe region. This suggests that O3 levels are generally elevated in these areas and their vicinity. The “low-low” clustering of O3 was seen in the middle and high altitude areas of Xi’an, and Baoji, suggesting that O3 is low in these areas and their surroundings. PM2.5 and O3 exhibited spatial concentration overlap. Overall, the overlapping areas of PM2.5 and O3 high pollution centers were mostly found in the low altitude areas of Yuncheng, Weinan, Linfen, and Luoyang. The low pollution overlap areas were mainly found in the middle and high altitude areas, such as Baoji, and Xi’an. PM2.5 and O3 exhibited local spatial synergies, indicating a necessity for coordinated treatment of both pollutants.
3.3 Analysis of influencing factors on PM2.5 and O3
3.3.1 Correlation analysis
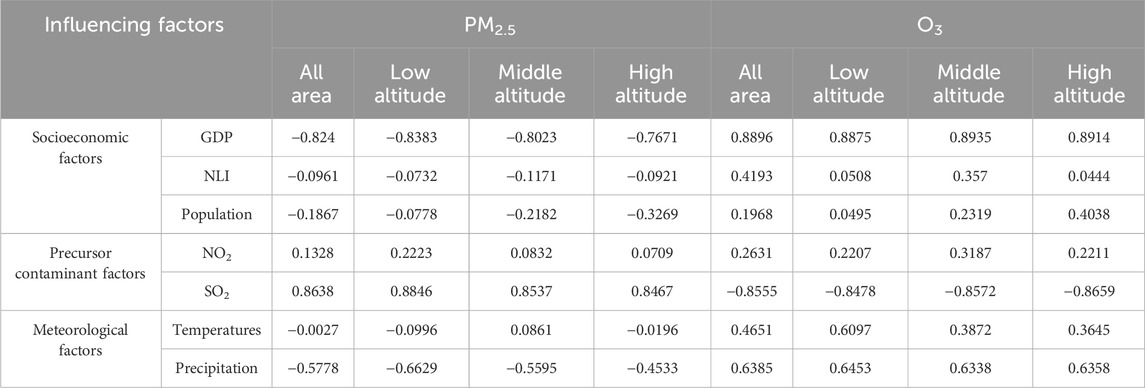
This study uses Pearson correlation analysis to study the linear relationship between PM2.5, O3, and three types of influential factors. Table 2 shows the results of the correlation analysis of PM2.5 and O3 with the three categories of influencing factors at various altitude scales. For the entire Fenwei Plain, the correlated coefficients between the main influential factors and PM2.5 were as follows: SO2 (0.8638) > GDP (−0.824) > precipitation (−0.5779), and for O3, GDP (0.8896) > SO2 (−0.8555) > precipitation (0.6385). The two pollutants had comparable primary influence factors, but their coefficients were opposite. This could be a significant inverse correlation between PM2.5 and O3. For the low, middle, and high altitude areas, the relevant PM2.5 and O3 coefficients were extremely similar throughout the entire region. The correlated coefficients between PM2.5 and the three main influence factors (precipitation, GDP, and SO2) decreased progressively with increasing altitude, whereas the correlation coefficient between O3 and the three most influential factors was not significantly correlated with altitude.
3.3.2 Analysis of the drivers of PM2.5 and O3 spatial divergence
Correlation analysis does not imply causation. PM2.5 and O3 spatial pollution characteristics are the result of numerous complex factors, such as meteorology, social economy, and precursor pollutants, and are not only a single linear relationship or influenced by a single pollutant. Therefore, this paper further identified the driving factors of PM2.5 and O3 spatial differentiation at low, middle, and high altitudes in the Fenwei Plain by using the detector and interaction detector of the geographic detector.
3.3.2.1 Analysis of driving factors in low altitude area
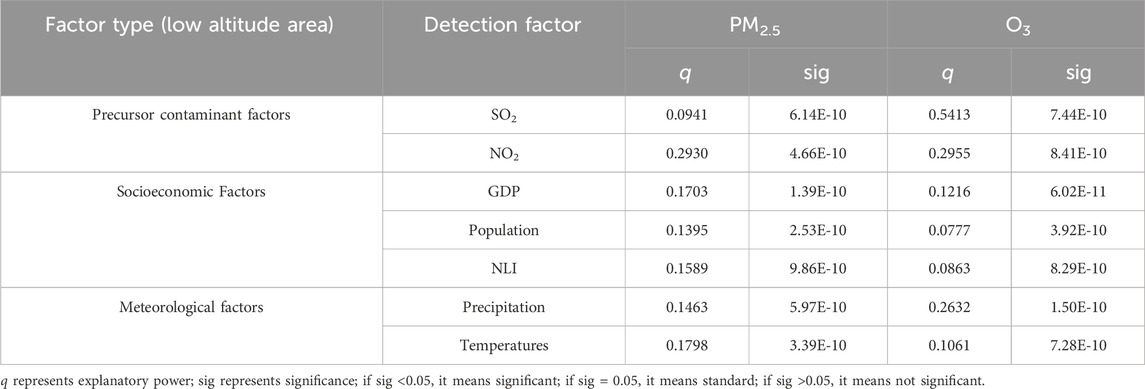
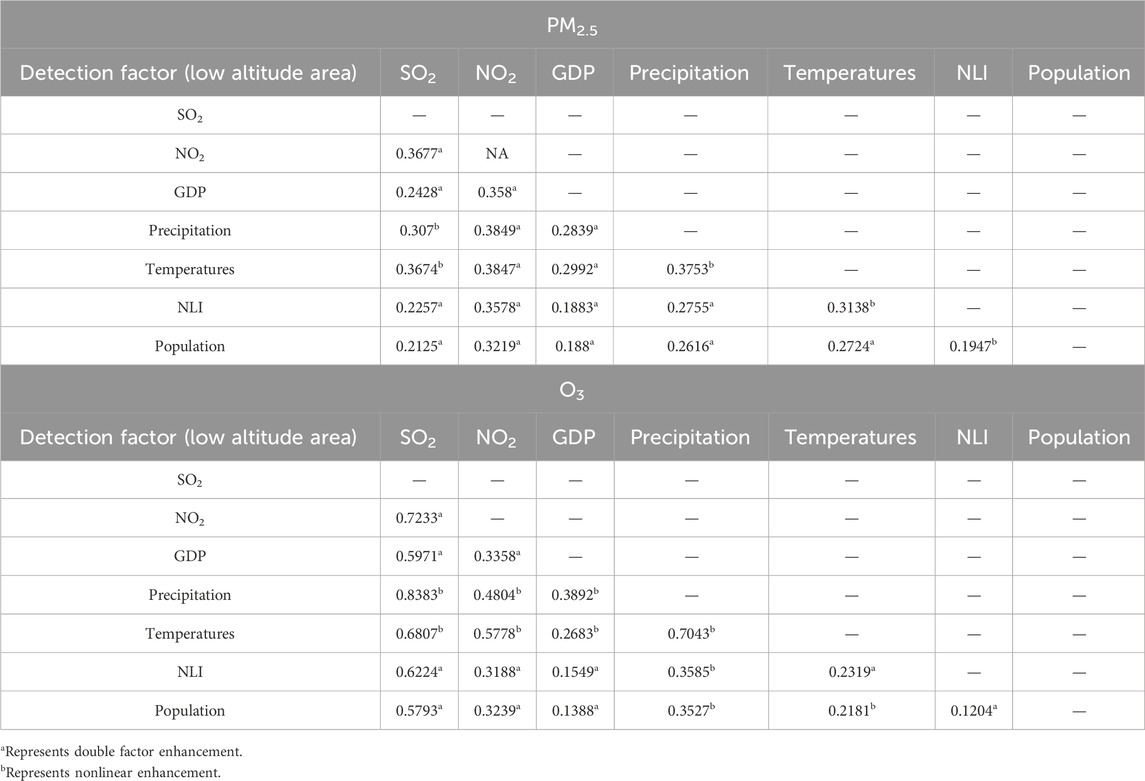
Tables 3, 4 demonstrate the results of factor detection and interaction detection of PM2.5 and O3 in low altitude area of the Fenwei Plain. Table 3 shows that the sig for all the influences was less than 0.05, indicating that all passed the test of significance. NO2 (0.2930) and SO2 (0.5413) were the main drivers of PM2.5 and O3, respectively. Table 4 shows that the results of the interaction detection of the two pollutants are double factor enhancement and non-linearly enhanced. NO2 and precipitation (0.3849) and NO2 and temperature (0.387) were the predominant interaction factors of PM2.5. Nevertheless, the explanatory power of the interaction of the remaining influencing factors on the spatial differentiation of PM2.5 differed less from that of the dominant factors. This may be due to the fact that the mechanisms affecting PM2.5 at low altitudes are more complex and susceptible to a combination of meteorological, precursor and socio-economic factors. The q values between SO2 and other influencing factors were all greater than 0.5793, which was the most important interaction center. It can be seen in Table 4 that the interaction increased the two pollutants’ spatial differentiation’s explanatory power. NO2 and precipitation (0.3849) and NO2 and temperature (0.387) were the predominant interaction factors of PM2.5, but each factor’s ability to explain the spatial difference of PM2.5 was still modest. The dominant interaction factors of O3 were SO2 and precipitation (0.8383), SO2 and NO2 (0.7233), and precipitation and temperature (0.7043), all of which have high explanatory power. It indicates that O3 in low altitude area was primarily influenced by the interaction of precursor contaminants and meteorological factors. And the spatial differentiation of PM2.5 and O3 in low altitude area was formed by a variety of influencing factors. Furthermore, precipitation and temperature (0.7043), and NO2 and temperature (0.5778) also had high explanatory power for O3.
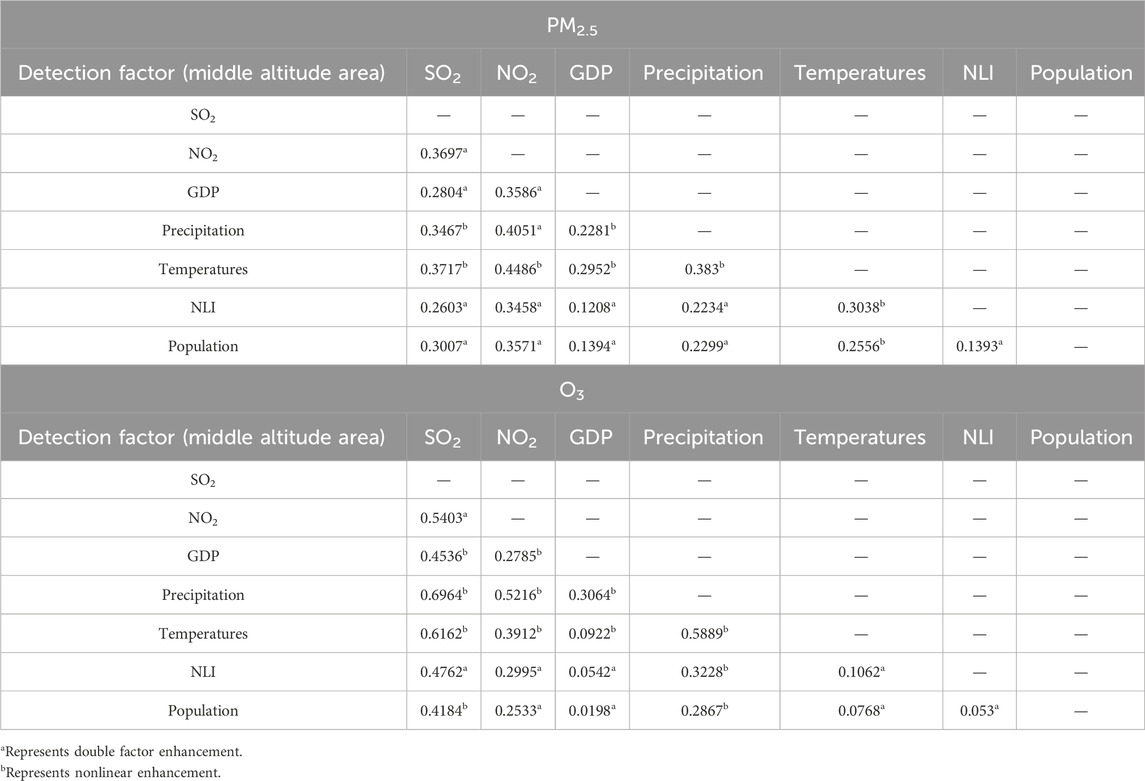
3.3.2.2 Analysis of driving factors in middle altitude area
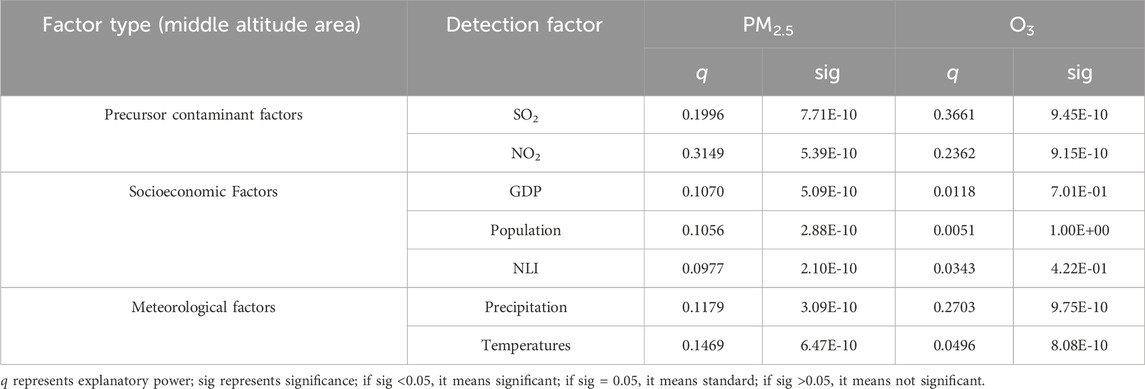
Tables 5, 6 demonstrate the results of factor detection and interaction detection of PM2.5 and O3 in the middle altitude area of the Fenwei Plain. According to Table 5, NO2 (0.3149) and SO2 (0.3661) were, respectively, the primary drivers of PM2.5 and O3 levels. As can be seen from Table 5, the results of the two pollutant interaction detectors at mid-altitude remain of two types: two-factor enhancement and non-linear enhancement. Table 6 demonstrated that there are still two types of outcomes from the two pollutant interaction detectors at mid-altitude: non-linear enhancement and two-factor enhancement. NO2 and temperature (0.4486), NO2 and precipitation (0.4051), SO2 and temperature (0.03717), NO2 and people (0.3571) were the primary interaction factors for PM2.5. For O3, SO2 remained the most significant interactive center, with q values between SO2 and other influencing factors all having exceeded 0.4184. Notably, the q values for the interactions between SO2 and precipitation, as well as between SO2 and temperature, were both greater than 0.6. In addition, NO2 and precipitation (0.5216) also had high explanatory power for O3. The dominant interaction factors had a high degree of consistency in low and middle altitude areas. Among these, the interpretation of the main driving factors and interactor factors for PM2.5 had improved, whereas the interpreting power for O3 had been slightly diminished.
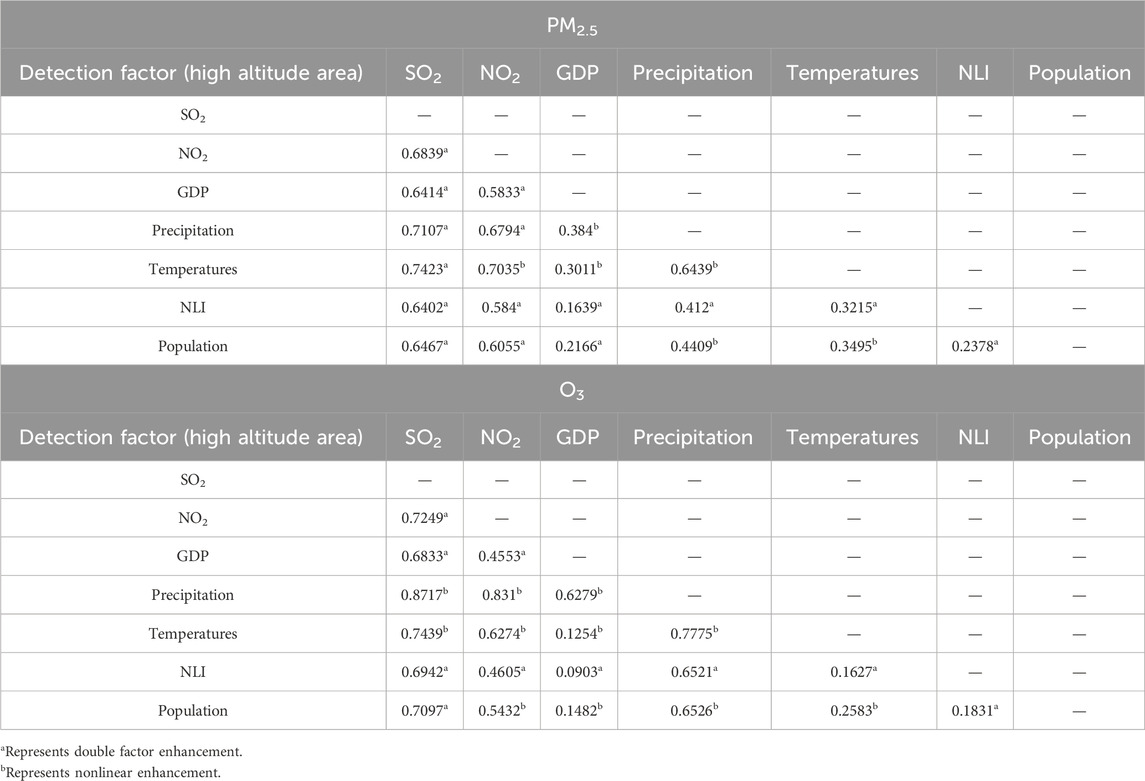
3.3.2.3 Analysis of driving factors in high altitude area
Tables 7, 8 demonstrate the results of factor detection and interaction detection of PM2.5 and O3 in high altitude area of the Fenwei Plain. According to Table 7, the factors with the highest explanatory power for PM2.5 in this region were SO2 (0.6151) and NO2 (0.5571), whereas the factors with the highest explanatory power for O3 were SO2 (0.6616) and precipitation (0.6081). Table 8 shows that for PM2.5, the q values of the interactions between NO2 and SO2 and the other influences were all higher than 0.5833, particularly for SO2 and temperature (0.7423), SO2 and precipitation (0.7107), and NO2 and temperature (0.7035). These interactions had a very significant explanatory power for the spatial differentiation of PM2.5. For O3, SO2 and NO2 were also at the center of the interaction, with SO2 and precipitation (0.8717) and NO2 and precipitation (0.831) having the highest explanatory power for O3. However, the explanatory power of NO2 interacting with the rest of the influences on the spatial differentiation of O3 decreased compared to the q value of PM2.5. Compared to low and middle altitudes, the explanatory power of the dominant interaction factors for both pollutants was significantly higher, particularly for the socio-economic factors.
4 Discussion
4.1 Spatial heterogeneity of PM2.5 and O3 and their causes
This study revealed the spatial heterogeneity and influencing factors of PM2.5 and O3 in the Fenwei Plain from the perspective of the impact of altitude on air pollutants. From 2014 to 2023, an overall decrease in PM2.5 was observed in the Fenwei Plain. This reduction is primarily attributed to the Chinese government’s strategic air pollution prevention initiatives, including the promotion of clean heating solutions and stringent regulation of coal consumption. Notably, the enforcement of the ‘Three-Year Action Plan to Win the Blue Sky Defense War’ in 2018, along with the ‘Autumn and Winter Action Plan for Comprehensive Air Pollution Control in the Fenwei Plain for 2018–2019,’ led to a marked decrease in PM2.5. Concurrently, these measures also effectively mitigated the escalating trend in O3 (Zhou et al., 2023). The distribution of PM2.5 and O3 in the area was greatly influenced by topography, resulting in the formation of pollution concentration areas in topography characterized by a “trumpet mouth” and basin, featuring low elevation surrounded by mountains, as well as in some plain areas. This pattern aligns well with research on comparable topographical features (Shu et al., 2023). This phenomenon occurred because the topography in the low-altitude areas of the Fenwei Plain results in low average yearly wind speeds, leading to stagnant airflow zones that hinder the spread of pollutants (Shu et al., 2022). However, the terrain had a varying effect on PM2.5 and O3. PM2.5 pollution was more influenced by terrain compared to O3. It exhibited a notable elevation pattern, particularly in the northwest to southeast high pollution area, which aligns with the terrain. This is mainly due to the fact that O3 was mostly influenced by regional air transport, had a wide pollution diffusion range, was less affected by terrain, and showed slight variations in concentration at different elevations (Shu et al., 2024). Therefore, PM2.5 and O3 showed a notable difference in distribution between middle and high altitude areas in the Fenwei Plain due to its unique topography. However, their pollution levels exhibited homology in low-altitude regions, forming a coordinated control zone that included Yuncheng, Linfen, Weinan, Luoyang, and other low-altitude and border areas.
PM2.5 and O3 are formed in complicated atmospheric processes that are impacted by a range of causes, both anthropogenic and natural, under the influence of topography (Zhang et al., 2019; Gong et al., 2022). This study also revealed the correlation between PM2.5 and O3 and their influencing factors. We found that SO2, a precursor of PM2.5, undergoes gas-phase reactions in the atmosphere with a significant positive correlation with PM2.5 (Xue et al., 2023). In addition, GDP and PM2.5 had a negative relationship due to the fact that, with air pollution abatement policies, which realized a parallel between GDP growth and PM2.5 abatement, making it possible to control PM2.5 pollution at the same time as economic growth, and economic development is no longer dependent on air pollution. Precipitation can efficiently eliminate PM2.5 particles by scouring them, effectively reducing PM2.5 pollution. This results in a negative relationship between rainfall and PM2.5 (Chen Z. et al., 2020). In addition, precipitation, SO2, and GDP also had significant effects on O3, but in the opposite direction to PM2.5. This could be because PM2.5 emission reduction primarily depends on sulfur and one-time PM2.5 but NOx and VOC emissions are still very high. When NOx and VOCs are in a certain ratio, O3 is produced through a chemical reaction, which causes O3 pollution to continue to intensify while PM2.5 pollution is under control (Committee CSfESOPC, 2020). Ultimately, this leads to a negative correlation between the two pollutants and opposite correlation coefficients for the influencing factors. Correlations can only reflect linear relationships between pollutants and influencing factors, and geographic detector results provide a good probe for the reasons for the spatial divergence of PM2.5 and O3. The geographical detector results showed that PM2.5 and O3 at various altitudes were primarily affected by the combined impact of meteorological and precursor factors, with minimal influence from socio-economic factors. The correlation between PM2.5 and O3 was due to their partial homology and interconnectedness, resulting in their influencing factors being in high agreement at various altitude scales (Sun et al., 2023). We also discovered that differences in the explanatory power of primary effects within the same altitude range were minimal, but significant disparities existed between altitudes, further confirming the significant impact of elevation. The correlation between PM2.5 and O3 was due to their partial homology and interconnectedness, resulting in their influencing factors being in high agreement at various altitude scales. This may be due to complex humanitarian factors such as population, industry, and altitude in the low and middle altitude regions, whereas the influence of the high altitude area was more singular, resulting in a greater overall interpretation of the driving factors in this area.
4.2 Recommendations to control PM2.5 and O3 pollution
Based on these findings, this study proposes the following recommendations for PM2.5 and O3 pollution in the Fenwei Plain and similar places with basin topography and “trumpet mouth” topography: (Zhang et al., 2021): The topography laid down the basic spatial pattern of PM2.5 and O3 pollution, making them homogenous, consistent, and related. In this context, synergistic PM2.5 and O3 management zones should be delineated by taking topographical factors into account, so as to manage PM2.5 and O3 from their sources. In particular, it is crucial to enhance cooperation between regional administrations and encourage synergistic management in extremely polluted low-altitude areas near the border of the two counties. In addition, it is essential to deal with the issue of spatial aggregation of PM2.5 and O3 resulting from an irrational industrial structure and energy layout. This can be achieved by accelerating industrial upgrading, transformation, and restructuring the industrial sector. (Ioannis et al., 2020). Meteorological and predecessor variables influenced the regional heterogeneity of PM2.5 and O3 distributions. On the basis of regional coordination, non-topographic factors should be comprehensively considered to ensure accurate governance in these regions. Meteorological influences are unpredictable and challenging to control accurately, but focusing on the underlying socioeconomic causes of precursors is crucial. Thus, enhancing regulation of industrial pollutant discharges, advancing high-quality projects for ultra-low carbon emissions in the steel, cement, and coking sectors, focusing on industrial transformation in the Fenwei Plain and innovative city development, implement clean heating, and address air pollution from PM2.5 and O3 at its core.
4.3 Research limitations and future prospects
This study offers insights for implementing targeted strategies to minimize air pollution. However, it does have certain constraints. The study picked a limited range of data on pollutants, socio-economic characteristics, and meteorological factors, despite the numerous influencing factors of PM2.5 and O3 and the interconnections between pollutants. This study did not consider the intricate relationship between air pollutant transport and topography, namely, the transport characteristics of air pollutant movement. In future studies, we will utilize more accurate and relevant data and methodologies to enhance the analysis of factors influencing PM2.5 and O3 pollution. This will involve integrating distinct viewpoints and environmental elements and thoroughly examining the interaction between topography and air pollutant dispersion to more precisely identify the transfer and synergistic mechanisms of PM2.5 and O3 under the influence of complex topography.
5 Conclusion
(1) Based on the characteristics of temporal change, PM2.5 in the Fenwei Plain decreased from 2014 to 2023, with a decrease coefficient of −2.9318 μg/m3/a; O3 increased, with an increase coefficient of 5.2922 μg/m3/a. PM2.5 and O3 at all altitudes aligned with the general trend. From 2014 to 2023, PM2.5 and O3 decreased as altitude increased, with low altitude having the highest levels and high altitude having the lowest levels. The difference of PM2.5 between various altitude areas ranged from 10 to 20 μg/m3, but the variance of O3 at different elevations was minimal.
(2) For the characteristics of spatial change, the range of high PM2.5 pollution gradually decreased from 2014 to 2023, mainly concentrated in low altitude areas. However, O3 pollution gradually spreaded from the central region to the east in the Fenwei Plain.
(3) According to the results of the correlation analysis, PM2.5 and O3 showed strong correlations with GDP, SO2, and precipitation across the whole Fenwei Plain, as well as at different altitudes. Specifically, PM2.5 was negatively associated with GDP and precipitation, and positively related to SO2; O3 was positively related to GDP, and precipitation was negatively related to SO2. Owing to the opposite trends of PM2.5 and O3, the correlations between these two pollutants and their main influencing factors were contradictory.
(4) The geographical detector findings reveal that NO2 and SO2 were the primary influencers of PM2.5 and O3 across various altitudes. The spatial variations of PM2.5 and O3 within the Fenwei Plain stemmed from a complex interplay of factors, with precursor pollutants at the epicenter of these interactions. The hierarchy of significance was as follows: interactions among precursor pollutants, interactions between precursor pollutants and meteorological factors, and interactions between precursor pollutants and socio-economic factors. The explanatory power of the interaction factors for O3 was notably high across low, middle, and high altitude regions. Furthermore, the explanatory power of these interactions for spatial differentiation of PM2.5 increased significantly with rising altitude.
Data availability statement
The original contributions presented in the study are included in the article/supplementary material, further inquiries can be directed to the corresponding author.
Author contributions
ZY: Conceptualization, Data curation, Formal Analysis, Methodology, Software, Validation, Visualization, Writing–original draft, Writing–review and editing. LY: Conceptualization, Funding acquisition, Resources, Supervision, Writing–review and editing. YY: Data curation, Supervision, Writing–review and editing. XW: Funding acquisition, Project administration, Writing–review and editing. ZC: Formal Analysis, Visualization, Writing–review and editing. HL: Formal Analysis, Visualization, Writing–review and editing.
Funding
The author(s) declare that financial support was received for the research, authorship, and/or publication of this article. This research was funded by the Science Research Foundation of Yunnan Education Bureau 2020 (2020J0098); and the Yunnan Normal University Graduate Research Innovation Fund (YJSJJ23-B100).
Conflict of interest
Author XW was employed by Yunnan Surverying and Mapping Institute Co. Ltd.
The remaining authors declare that the research was conducted in the absence of any commercial or financial relationships that could be construed as a potential conflict of interest.
Generative AI statement
The author(s) declare that no Generative AI was used in the creation of this manuscript.
Publisher’s note
All claims expressed in this article are solely those of the authors and do not necessarily represent those of their affiliated organizations, or those of the publisher, the editors and the reviewers. Any product that may be evaluated in this article, or claim that may be made by its manufacturer, is not guaranteed or endorsed by the publisher.
References
Ali-Taleshi, M. S., Bakhtiari, A. R., and Hopke, P. K. (2022). Particulate and gaseous pollutants in Tehran, Iran during 2015-2021: factors governing their variability. Sustain. Cities Soc. 87, 104183. doi:10.1016/j.scs.2022.104183
Bai, L., Jiang, L., Zhou, H., and Chen, Z. (2018). Spatio-temporal characteristics of air quality index and its driving factors in the Yangtze River Economic Belt: an empirical study based on bayesian spatial econometric model. Sci. Geogr. Sin. 38 (12), 2100–2108. doi:10.13249/j.cnki.sgs.2018.12.019
Bo, L., XiaoFei, S., YuPing, L., Lu, L., GuoLiang, W., Samit, T., et al. (2020). Long-term characteristics of criteria air pollutants in megacities of Harbin-Changchun megalopolis, Northeast China: spatiotemporal variations, source analysis, and meteorological effects. Environ. Pollut. 267, 115441. doi:10.1016/j.envpol.2020.115441
Cao, F., Ge, Y., and Wang, J. F. (2013). Optimal discretization for geographical detectors-based risk assessment. GISci Remote Sens. 50 (1), 78–92. doi:10.1080/15481603.2013.778562
Chen, J., Shen, H., Li, T., Peng, X., Cheng, H., and Ma, C. (2019). Temporal and spatial features of the correlation between PM2.5 and O3 concentrations in China. Int. J. Environ. Res. Public Health 16 (23), 4824. doi:10.3390/ijerph16234824
Chen, L., Zhu, J., Liao, H., Yang, Y., and Yue, X. (2020a). Meteorological influences on PM2.5 and O3 trends and associated health burden since China's clean air actions. Sci. Total Environ. 744, 140837. doi:10.1016/j.scitotenv.2020.140837
Chen, Z., Chen, D., Zhao, C., Kwan, M., Cai, J., Zhuang, Y., et al. (2020b). Influence of meteorological conditions on PM2.5 concentrations across China: a review of methodology and mechanism. Environ. Int. 139, 105558. doi:10.1016/j.envint.2020.105558
Chen, Z., and Zhang, Z. (2024). Analysis of spatiotemporal variation and relationship to land use – landscape pattern of PM2.5 and O3 in typical arid zone. Sustain. Cities Soc. 113, 105689. doi:10.1016/j.scs.2024.105689
CPsGotPsRo (2023). Action plan for the continuous improvement of air quality. Available at: https://www.gov.cn/zhengce/content/202312/content_6919000.htm (Accessed November 22, 2024).
Committee CSfESOPC (2020). Blue book on the prevention and control of O3 pollution in China. Beijing: China Environmental Science Press. 64.
Dai, H., Zhu, J., Liao, H., Li, J., Liang, M., Yang, Y., et al. (2021). Co-occurrence of ozone and PM2.5 pollution in the Yangtze River Delta over 2013–2019: spatiotemporal distribution and meteorological conditions. Atmos. Res. 249, 105363. doi:10.1016/j.atmosres.2020.105363
Dai, X. L., Zhang, B., Jiang, X. Q., Liu, L. Y., Fang, D. Y., and Long, Z. H. (2022). Has the Three-Year Action Plan improved the air quality in the Fenwei Plain of China? Assessment based on a machine learning technique. Atmos. Environ. 286, 119204. doi:10.1016/j.atmosenv.2022.119204
Dan, L., Yunqi, W., Yujie, W., and Chao, M. (2019). National air pollution distribution in China and related geographic, gaseous pollutant, and socio-economic factors. Environ. Pollut. 250, 998–1009. doi:10.1016/j.envpol.2019.03.075
Dong, F., Zhang, S. N., Long, R. Y., Zhang, X. Y., and Sun, Z. Y. (2019). Determinants of haze pollution: an analysis from the perspective of spatiotemporal heterogeneity. J. Clean. Prod. 222, 768–783. doi:10.1016/j.jclepro.2019.03.105
Duan, W., Wang, X., Cheng, S., Wang, R., and Zhu, J. (2021). Influencing factors of PM2.5 and O3 from 2016 to 2020 based on DLNM and WRF-CMAQ. Environ. Pollut. 285, 117512. doi:10.1016/j.envpol.2021.117512
Fang, C., Gao, H., Li, Z., and Wang, J. (2021). Regional air pollutant characteristics and health risk assessment of large cities in Northeast China. Atmosphere 12 (11), 1519. doi:10.3390/atmos12111519
Gong, S., Zhang, L., Liu, C., Lu, S., Pan, W., and Zhang, Y. (2022). Multi-scale analysis of the impacts of meteorology and emissions on PM2.5 and O3 trends at various regions in China from 2013 to 2020 2. Key weather elements and emissions. Sci. Total Environ. 824, 153847. doi:10.1016/j.scitotenv.2022.153847
He, Z., Liu, P., Zhao, X., He, X., Liu, J., and Mu, Y. (2022). Responses of surface O3 and PM2.5 trends to changes of anthropogenic emissions in summer over Beijing during 2014-2019: a study based on multiple linear regression and WRF-Chem. Sci. Total Environ. 807, 150792. doi:10.1016/j.scitotenv.2021.150792
Huang, C., Liu, K., and Zhou, L. (2021a). Spatio-temporal trends and influencing factors of PM2.5 concentrations in urban agglomerations in China between 2000 and 2016. Environ. Sci. Pollut. Res. 28 (9), 10988–11000. doi:10.1007/s11356-020-11357-z
Huang, G., Su, X., Wang, L., Wang, Y., Cao, M., Wang, L., et al. (2024). Evaluation and analysis of long-term MODIS MAIAC aerosol products in China. Sci. Total Environ. 948, 174983. doi:10.1016/j.scitotenv.2024.174983
Huang, X., Shao, T., Zhao, J., Cao, J., and song, Y. (2019). Influence factors and spillover effect of PM2.5 concentration on Fen-wei Plain. China Environ. Sci. 39 (08), 3539–3548. doi:10.19674/j.cnki.issn1000-6923.2019.0420
Huang, X., Zhao, J., Sun, C., Tang, H., and Liang, X. (2021b). Orographic influences on the spatial distribution of PM2.5 on the fen-wei plain. Environ. Sci. 42 (10), 4582–4592. doi:10.13227/j.hjkx.202102024
Hui, Z., Kaiyu, C., Zhen, L., Yuxin, Z., Tian, S., and Hongliang, Z. (2021). Coordinated control of PM2.5 and O3 is urgently needed in China after implementation of the “Air pollution prevention and control action plan”. Chemosphere 270, 129441. doi:10.1016/j.chemosphere.2020.129441
Ioannis, M., Elisavet, S., Agathangelos, S., and Eugenia, B. (2020). Environmental and health impacts of air pollution: a review. Front. Public Health 8, 14. doi:10.3389/fpubh.2020.00014
Ji, Y. (2021). A study on the characteristics of air pollution in the Fenwei Plain. [master’s thesis]. Nanjing: Nanjing University of Information Science and Technology.
Lei, R., Nie, D., Zhang, S., Yu, W., Ge, X., and Song, N. (2022). Spatial and temporal characteristics of air pollutants and their health effects in China during 2019-2020. J. Environ. Manage 317, 115460. doi:10.1016/j.jenvman.2022.115460
Li, K., Li, C., Hu, Y., Xiong, Z., and Wang, Y. (2023). Quantitative estimation of the PM2.5 removal capacity and influencing factors of urban green infrastructure. Sci. Total Environ. 867, 161476. doi:10.1016/j.scitotenv.2023.161476
Li, L., Mi, Y., Lei, Y., Wu, S., Li, L., Hua, E., et al. (2022). The spatial differences of the synergy between CO2 and air pollutant emissions in China's 296 cities. Sci. Total Environ. 846, 157323. doi:10.1016/j.scitotenv.2022.157323
Lin, Q., Ou, G., Wang, R., Li, Y., Zhao, Y., and Dong, Z. (2021). The spatiotemporal characteristics and climatic factors of COVID-19 in wuhan, China. Sustainability 13 (14), 8112. doi:10.3390/su13148112
Liu, F., and Liao, J. (2021). Spatial-temporal distribution characteristics and influencing factors of air quality in urban cluster along middle reach of Yangtze River. Environ. Sci. Technol. 44 (10), 172–186. doi:10.19672/j.cnki.1003-6504.1016.21.338
Liu, X. (2021). Spatiotemporal characteristics and drivers of PM2.5 pollution in the Yangtze River economic belt. [master’s thesis]. Lanzhou: Lanzhou University.
Lu, D., Xu, J., Yang, D., and Zhao, J. (2017). Spatio-temporal variation and influence factors of PM2.5 concentrations in China from 1998 to 2014. Atmos. Pollut. Res. 8 (6), 1151–1159. doi:10.1016/j.apr.2017.05.005
Ma, Y., Wang, M., Wang, S., Wang, Y., Feng, L., and Wu, K. (2021). Air pollutant emission characteristics and HYSPLIT model analysis during heating period in Shenyang, China. Environ. Monit. Assess. 193 (1), 9. doi:10.1007/s10661-020-08767-4
Masiol, M., Hopke, P. K., Felton, H. D., Frank, B. P., Rattigan, O. V., Wurth, M. J., et al. (2017). Source apportionment of PM2.5 chemically speciated mass and particle number concentrations in New York City. Atmos. Environ. 148, 215–229. doi:10.1016/j.atmosenv.2016.10.044
Qin, J., Wang, S., Guo, L., and Xu, J. (2020). Spatial association pattern of air pollution and influencing factors in the beijing-tianjin-hebei air pollution transmission channel: a case study in henan Province. Int. J. Environ. Res. Public Health 17 (5), 1598. doi:10.3390/ijerph17051598
Shen, Y., de Hoogh, K., Schmitz, O., Clinton, N., Tuxen-Bettman, K., Brandt, J., et al. (2022). Europe-wide air pollution modeling from 2000 to 2019 using geographically weighted regression. Environ. Int. 168, 107485. doi:10.1016/j.envint.2022.107485
Shu, L., Wang, T., Li, M., Xie, M., and Liu, J. (2024). Optimizing emission control strategies for mitigating PM2.5 and O3 pollution: a case study in the Yangtze River Delta region of eastern China. Atmos. Environ. 319, 120288. doi:10.1016/j.atmosenv.2023.120288
Shu, Z., Zhao, T., Chen, Y., Liu, Y., Yang, F., Jiang, Y., et al. (2023). Terrain effect on atmospheric process in seasonal ozone variation over the Sichuan Basin, Southwest China. Environ. Pollut. 338, 122622. doi:10.1016/j.envpol.2023.122622
Shu, Z., Zhao, T., Liu, Y., Zhang, L., Ma, X., Kuang, X., et al. (2022). Impact of deep basin terrain on PM2.5 distribution and its seasonality over the Sichuan Basin, Southwest China. Environ. Pollut. 300, 118944. doi:10.1016/j.envpol.2022.118944
Su, X., Huang, G., Wang, L., Wei, Y. F., Ma, X. Y., Wang, L. C., et al. (2024). Validation and comparison of long-term accuracy and stability of global reanalysis and satellite retrieval AOD. Remote Sens. 16 (17), 3304. doi:10.3390/rs16173304
Sun, J., and Huang, R. (2021). Follow the ecological civilization philosophy of Xi Jinping Strong fight against pollution. People’s Daily 013. doi:10.28655/n.cnki.nrmrb.2021.012851
Sun, Y., Xu, L., Yang, T., Zhang, P., and Cui, Y. (2023). Correlation characterization of PM2.5 and O3 pollution in a typical city inBeijing-tianjin-hebei region. Res. Environ. Sci. 36 (08), 1467–1476. doi:10.13198/j.issn.1001-6929.2023.06.02
Wang, J., Li, Y., Li, Y., and Li, Q. (2022c). Research on the influence of manufacturing agglomeration in Beijing-Tianjin-Hebei Region on PM2.5 concentration based on Geographic Detector. Think Tank:Theory and Pract. 7 (02), 141–153. doi:10.19318/j.cnki.issn.2096-1634.2022.02.15
Wang, J., and Xu, C. (2017). Geodetector: principle and prospective. Acta Geogr. Sin. 72 (01), 116–134. doi:10.11821/dlxb201701010
Wang, J., Yang, Y., Jiang, X., Wang, D., Zhong, J., and Wang, Y. (2022a). Observational study of the PM2.5 and O3 superposition-composite pollution event during spring 2020 in Beijing associated with the water vapor conveyor belt in the northern hemisphere. Atmos. Environ. 272, 118966. doi:10.1016/j.atmosenv.2022.118966
Wang, L., Li, Q., Qiu, Q., Hou, L., Ouyang, J., Zeng, R., et al. (2022b). Assessing the ecological risk induced by PM2.5 pollution in a fast developing urban agglomeration of southeastern China. J. Environ. Manage 324, 116284. doi:10.1016/j.jenvman.2022.116284
Wei, J., Li, Z., Cribb, M., Huang, W., Xue, W., Sun, L., et al. (2020). Improved 1 km resolution PM2.5 estimates across China using enhanced space–time extremely randomized trees. Atmos. Chem. Phys. 20 (6), 3273–3289. doi:10.5194/acp-20-3273-2020
Wei, J., Li, Z., Li, K., Dickerson, R. R., Pinker, R. T., Wang, J., et al. (2022). Full-coverage mapping and spatiotemporal variations of ground-level ozone (O3) pollution from 2013 to 2020 across China. Remote Sens. Environ. 270, 112775. doi:10.1016/j.rse.2021.112775
Wei, J., Li, Z., Lyapustin, A., Wang, J., Dubovik, O., Schwartz, J., et al. (2023a). First close insight into global daily gapless 1 km PM2.5 pollution, variability, and health impact. Nat. Commun. 14 (8349), 8349. doi:10.1038/s41467-023-43862-3
Wei, J., Li, Z., Wang, J., Li, C., Gupta, P., and Cribb, M. (2023b). Ground-level gaseous pollutants (NO2, SO2, and CO) in China: daily seamless mapping and spatiotemporal variations. Atmos. Chem. Phys. 23 (2), 1511–1532. doi:10.5194/acp-23-1511-2023
Wei, Q., Zhang, L., Duan, W., and Zhen, Z. (2019). Global and geographically and temporally weighted regression models for modeling PM2.5 in Heilongjiang, China from 2015 to 2018. Int. J. Environ. Res. Public Health 16 (24), 5107. doi:10.3390/ijerph16245107
Wu, J., Wang, Y., Liang, J., and Yao, F. (2021). Exploring common factors influencing PM2.5 and O3 concentrations in the Pearl River Delta: tradeoffs and synergies. Environ. Pollut. 285, 117138. doi:10.1016/j.envpol.2021.117138
Wu, M., Hu, X., Wang, Z., and Zeng, X. (2023). Lockdown effects of the COVID-19 on the spatio-temporal distribution of air pollution in Beijing, China. Ecol. Indic. 146, 109862. doi:10.1016/j.ecolind.2023.109862
Xia, S., Liu, X., Liu, Q., Zhou, Y., and Yang, Y. (2022). Heterogeneity and the determinants of PM2.5 in the Yangtze River economic belt. Sci. Rep. 12 (1), 4189. doi:10.1038/s41598-022-08086-3
Xiao, Z., Xu, H., Gao, J., Cai, Z., Bi, W., Li, P., et al. (2022). Characteristics and sources of PM2.5-O3 compound pollution in tianjin. Environ. Sci. 43 (03), 1140–1150. doi:10.13227/j.hjkx.202108164
Xu, D., Wang, J., Yuan, Z., Huang, J., Zhao, K., and Zhao, Y. (2010). Observation and analysis of air pollution in Tangshan during summer and autumn time. Environ. Sci. 31 (4), 877–885. doi:10.13227/j.hjkx.2010.04.011
Xu, D., Wang, J., Yuan, Z., Huang, J, Zhao, K., Zhao, Y., et al. (2021c). Temporal-spatial variations, source apportionment, and formation mechanisms of PM2.5 pollution over Fenwei Plain, China. Acta Sci. Circumstantiab 41 (04), 1184–1198. doi:10.13671/j.hjkxxb.2020.0553
Xu, X., Zhang, W., Zhu, C., Li, J., Wang, J., Li, P., et al. (2021a). Health risk and external costs assessment of PM2.5 in Beijing during the “five-year clean air action plan”. Atmos. Pollut. Res. 12 (6), 101089. doi:10.1016/j.apr.2021.101089
Xu, X., Zhang, W., Zhu, C., Li, J., Yuan, W., and Lv, J. (2021b). Regional sources and the economic cost assessment of PM2.5 in Ji'nan, eastern China. Atmos. Pollut. Res. 12 (2), 386–394. doi:10.1016/j.apr.2020.11.019
Xu, X. M., Zhang, H. F., Chen, J. M., Li, Q., Wang, X. F., Wang, W. X., et al. (2018). Six sources mainly contributing to the haze episodes and health risk assessment of PM2.5 at Beijing suburb in winter 2016. Ecotoxicol. Environ. Saf. 166, 146–156. doi:10.1016/j.ecoenv.2018.09.069
Xue, Z., Xiaolu, Z., Yanan, W., Wei, C., and Qiao, L. (2023). Spatio-temporal variations and socio-economic drivers of air pollution: evidence from 332 Chinese prefecture-level cities. Atmos. Pollut. Res. 14 (6), 101782. doi:10.1016/j.apr.2023.101782
Yan, S., Cao, H., Chen, Y., Wu, C., Hong, T., and Fan, H. (2016). Spatial and temporal characteristics of air quality and air pollutants in 2013 in Beijing. Environ. Sci. Pollut. Res. 23 (14), 13996–14007. doi:10.1007/s11356-016-6518-3
Yang, Q., Yuan, Q., Yue, L., Li, T., Shen, H., and Zhang, L. (2019). The relationships between PM2.5 and aerosol optical depth (AOD) in mainland China: about and behind the spatio-temporal variations. Environ. Pollut. 248, 526–535. doi:10.1016/j.envpol.2019.02.071
Yuan, L., Chen, G., and Zhao, J. (2022). Layout optimization and division of plateau mountain arable land-based on cultivated land quality evaluation and local spatial autocorrelation. Management 7, 10. doi:10.15244/pjoes/150667
Zhang, M., Shi, L., Ma, X., Zhao, Y., and Gao, L. (2021). Study on Comprehensive assessment of environmental impact of air pollution. Sustainability 13 (2), 476. doi:10.3390/su13020476
Zhang, Y., Shuai, C., Bian, J., Chen, X., Wu, Y., and Shen, L. (2019). Socioeconomic factors of PM2.5 concentrations in 152 Chinese cities: decomposition analysis using LMDI. J. Clean. Prod. 218, 96–107. doi:10.1016/j.jclepro.2019.01.322
Zhao, H., Wang, L., Zhang, Z., Qi, Q., and Zhang, H. (2022). Quantifying ecological and health risks of ground-level O3 across China during the implementation of the “three-year action plan for cleaner air”. Sci. Total Environ. 817, 153011. doi:10.1016/j.scitotenv.2022.153011
Zhao, S., Yin, D., Yu, Y., Kang, S., Qin, D., and Dong, L. (2020). PM2.5 and O3 pollution during 2015-2019 over 367 Chinese cities: spatiotemporal variations, meteorological and topographical impacts. Environ. Pollut. 264, 114694. doi:10.1016/j.envpol.2020.114694
Zhou, T., Zhou, Q., Zhang, Y., Wu, Y., and Sun, J. (2023). Characteristics of PM2.5-O3 compound pollution and meteorological impact in Fenwei Plain. Meteorol. Mon. 49 (11), 1359–1370. doi:10.7519/j.issn.1000-0526.2023.052401
Keywords: PM2.5, O3, atmospheric pollution, geographic detector, spatiotemporal characteristics, influencing factors
Citation: Yin Z, Yuan L, Yang Y, Wu X, Chen Z and Long H (2025) Exploring the altitude differentiation and influencing factors of PM2.5 and O3: a case study of the Fenwei Plain, China. Front. Environ. Sci. 12:1509460. doi: 10.3389/fenvs.2024.1509460
Received: 14 October 2024; Accepted: 13 December 2024;
Published: 06 January 2025.
Edited by:
Honglei Wang, Nanjing University of Information Science and Technology, ChinaReviewed by:
Xianmang Xu, Qilu University of Technology, ChinaXin Su, China University of Geosciences Wuhan, China
Copyright © 2025 Yin, Yuan, Yang, Wu, Chen and Long. This is an open-access article distributed under the terms of the Creative Commons Attribution License (CC BY). The use, distribution or reproduction in other forums is permitted, provided the original author(s) and the copyright owner(s) are credited and that the original publication in this journal is cited, in accordance with accepted academic practice. No use, distribution or reproduction is permitted which does not comply with these terms.
*Correspondence: Lei Yuan, bGVpeXVhbnludUAxNjMuY29t
 Zhenglin Yin
 Lei Yuan
 Yulian Yang1