 Fei Chen
 Liling Zhu
94% of researchers rate our articles as excellent or good
Learn more about the work of our research integrity team to safeguard the quality of each article we publish.
Find out more
ORIGINAL RESEARCH article
Front. Environ. Sci. , 18 December 2024
Sec. Environmental Economics and Management
Volume 12 - 2024 | https://doi.org/10.3389/fenvs.2024.1508785
Achieving sustainable development that harmonizes environmental protection with economic growth in the Yangtze River Economic Belt (YREB) remains a critical area of research. Examining green total factor productivity (GTFP) aids in pinpointing the key factors and pathways essential for fostering green economic development. On the basis of 108 prefecture-level cities in the YREB, a three-stage SBM-ML index model was constructed to measure the GTFP level from 2009 to 2022. ArcGIS software was used to analyze the spatiotemporal evolution of GTFP dynamically. Finally, the multidimensional factors affecting GTFP were systematically analyzed via the Tobit model. The study revealed that (1) GTFP exhibits notable spatial disparities among the upper, middle, and lower reaches of the YREB, with the downstream areas showing higher levels than the upstream and midstream areas do. (2) After excluding environmental factors and random errors, the true GTFP level significantly decreases, indicating a notable environmental masking effect, with a masking effect of up to 63.9%. (3) The spatial distribution of GTFP overall shows a “low-high-low-high” pattern from west to east, forming an “N”-shaped spatial pattern. (4) The Tobit model regression results show that government governance enhances GTFP, while economic growth and intergovernmental fiscal decentralization hinder real GTFP. Although urbanization was initially insignificant, it significantly boosted real GTFP post-COVID-19. Finally, policy recommendations to promote green development in river basins are proposed.
The rapid growth of the global economy has intensified environmental pollution, making the balance between economic development and ecological protection a pressing challenge. Extensive research has demonstrated that pollution significantly affects various health and socioeconomic indicators, such as mortality (Greenstone and Hanna, 2014), life expectancy (Ebenstein et al., 2015), happiness (Ahumada and Iturra, 2021), labor productivity (He et al., 2019), housing prices (Chay and Greenstone, 2005), and income levels (Wan and Zhang, 2023). The United Nations Environment Programme (UNEP) warns that without swift action, environmental degradation will deepen global socioeconomic crises. Transitioning to a green economy has thus become an urgent necessity, requiring policies that effectively balance economic growth with ecological sustainability. Accurate development indicators are essential for designing and implementing such policies, as measures such as ecological redline delineation rely on them. Thus, precisely calculating green development indices is crucial.
As one of the largest developing countries, China, like other nations, faces significant challenges from environmental pressures and green transition demands. However, these challenges are particularly severe because of China’s unique development stage and resource constraints. Since the global financial crisis and the enactment of the Circular Economy Promotion Law (2009), China has pursued policies to balance economic and ecological development. However, with economic growth slowing, particularly after the COVID-19 pandemic, economic vitality gradually weakened, making green transformation even more challenging. This is particularly evident in the Yangtze River Economic Belt (YREB), as depicted in Figure 1, which contributes 46.5% of GDP but accounts for more than 40% of industrial pollution emissions (YREB Development Report 2023), underscoring the acute tension between economic development and ecological sustainability. Achieving a balance in this region is vital for sustainable growth. The incorporation of energy and environmental factors into traditional economic models while addressing both desirable and undesirable outputs provides a precise measure of green economic efficiency. The green total factor productivity (GTFP) index has become a critical benchmark for evaluating regional economic development quality (Xia and Xu, 2020; Zheng et al., 2023; Wang et al., 2018).
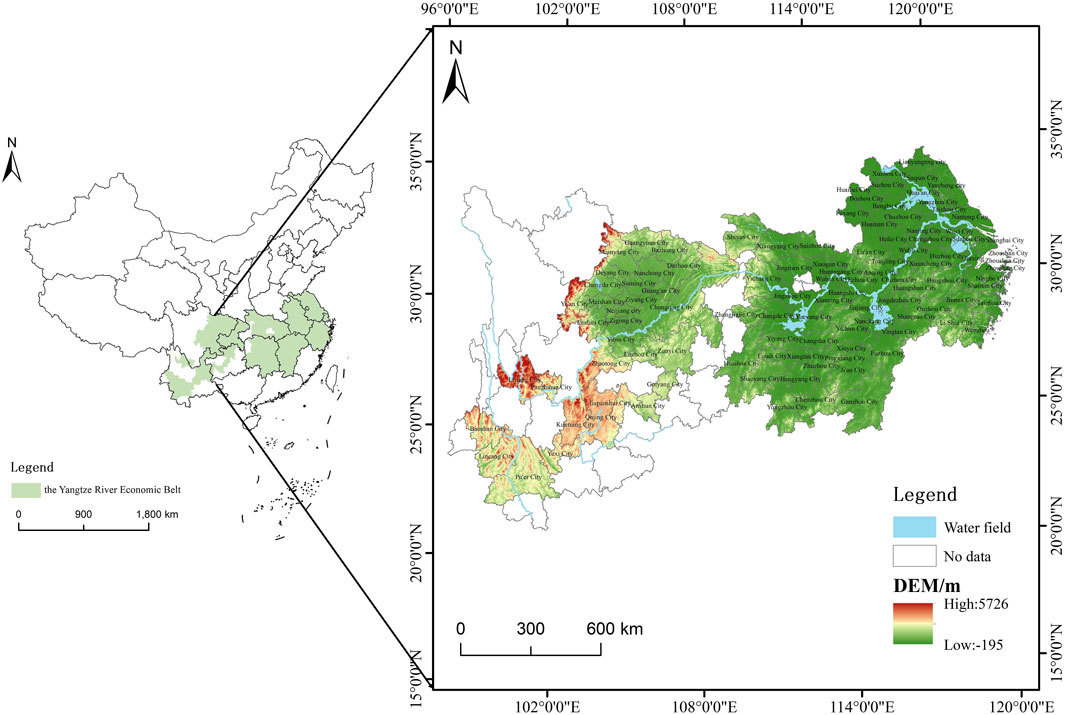
Figure 1. Study Area.
Research on GTFP is well established, with a broad consensus that, amid growing resource and environmental pressures, economies of scale alone can no longer sustain urban economic development (Li and Cheng, 2022). Most studies approach this from a multi-input, multi-output perspective, considering both desirable and undesirable outputs (Li and Cheng, 2022). However, in GTFP measurement, many scholars include only labor and capital as input variables (Liu and Xin, 2019; Xia and Xu, 2020; Du et al., 2024; Wang and Tao, 2021), often overlooking energy, a key element in modern economies that plays a critical role in industrialization, low-carbon transition, and sustainable development (Yuan et al., 2024; Jing et al., 2024; Cheng and Kong, 2022). Additionally, the selection of desirable and undesirable outputs has limitations. For example, some scholars have used average nighttime light intensity to represent desirable outputs (Yuan et al., 2024), whereas undesirable outputs include carbon emission intensity and PM2.5 (Yuan et al., 2024), industrial SO2 and PM2.5 (Zhou et al., 2024), industrial SO2 and CO2 (Cheng and Kong, 2022), and industrial wastewater and PM2.5 (Zhao et al., 2022). Although SO2 and COD emissions have long been used as indicators of pollution, they are increasingly inaccurate because of policy adjustments and changes in pollutant types with economic development. Therefore, more recent analyses favor industrial waste as a more comprehensive and objective measure of undesirable output, offering a clearer assessment of regional pollution (Xia and Xu, 2020; Wang et al., 2021).
Most scholars agree that GTFP measurement results reflect the key drivers of coordinating high-quality economic development with ecological protection, aiming to maximize economic growth while minimizing pollution (Song et al., 2018; Zhao et al., 2022; Wu et al., 2020; Ma and Zhu, 2022). However, various environmental factors can distort these results, making accurate assessment of regional development levels difficult. More importantly, if governments use these measurements as benchmarks for policy implementation—such as ecological red lines or regulatory standards—significant discrepancies may undermine policy effectiveness or even have negative effects. In this context, developing scientifically sound policies to drive core economic growth has become a critical issue. To fill this gap, this study uses a three-stage DEA model to eliminate influencing factors and random disturbances, providing a precise measurement of the true levels and dynamic trends of GTFP in cities along the YREB. It also examines spatiotemporal variations and key influences on GTFP, offering valuable academic and practical insights for green low-carbon development and sustainable regional economic growth.
The contributions of this study are as follows: First, a three-stage DEA model is used to eliminate environmental factors and random disturbances, accurately measuring the YREB-GTFP, which is then decomposed into technological progress change (TC) and efficiency change (EC). A comparison of the dynamic changes in GTFP, TC, and EC in the first and third stages enriches the understanding of true YREB-GTFP. Second, the Tobit model is applied to analyze the key factors driving YREB-GTFP changes on the basis of the true GTFP after random disturbances are removed, revealing the main influences on its variation.
With rapid global economic growth and escalating environmental issues, traditional growth models face challenges, and the sustainability of resources and the environment has become central to sustainable development (Jing et al., 2024). In response, the concept of GTFP was introduced to address the limitations of total factor productivity (TFP) by incorporating environmental costs. GTFP, defined as the input‒output efficiency of undesirable outputs, has become a key indicator for measuring green economic development (Xia and Xu, 2020; Zhou et al., 2008). A review of the literature reveals that GTFP research has focused primarily on measurement methods and influencing factors.
First, GTFP measurement methods are primarily divided into parametric and non-parametric approaches. Scholars often use the parametric method, particularly stochastic frontier analysis (SFA), Specifically, they incorporate pollution emissions and energy consumption as input factors into the SFA framework to estimate GTFP. However, the treatment of undesirable outputs as inputs is often considered unreasonable. Some scholars have applied SFA to estimate regional GTFP and suggest policy recommendations (Gong, 2020), but its reliance on idealized production function assumptions overlooks environmental heterogeneity and dynamic changes, limiting the reliability of the results. In contrast, non-parametric methods, such as data envelopment analysis (DEA), are widely favored because they do not require assumptions about the form of the production function. While the traditional DEA model, first proposed by Färe et al. (1994), improves measurement accuracy, it struggles to account for external environmental factors and random errors, which affects the assessment of actual efficiency. To address this, Fried et al. (2002) introduced the three-stage DEA model, which eliminates environmental interference and provides a more accurate measure of managerial efficiency. In recent years, the three-stage DEA model has been widely applied in the efficiency analysis of areas such as innovation (Li et al., 2019), healthcare services (Liu H. et al., 2022), water pollution control (Chen et al., 2022), and banking systems (Zhou et al., 2019). Some studies have also applied the three-stage DEA-ML model to GTFP analysis, including agricultural GTFP (Liu S. et al., 2022), urban GTFP (Liu and Zhu, 2022; Huang and Chen, 2024), and provincial-level GTFP (Tang and Qin, 2022; Wang et al., 2024; Jing et al., 2024).
Second, research on the factors influencing YREB-GTFP remains limited, though several studies have examined it from environmental, economic, and technological perspectives. From an environmental perspective, Pan et al. (2022), utilizing the three-stage DEA model, emphasized the significant impact of environmental factors on GTFP. Government interventions through environmental regulations are also highlighted as pivotal for improving GTFP performance (Zheng et al., 2024; Luo et al., 2024; Liu et al., 2024). Economically, studies underscore the roles of economic development, foreign direct investment (FDI), and green finance in shaping GTFP (Lee and Lee, 2022). High concentrations of FDI have been shown to enhance GTFP through technology spillovers, facilitating upgrades in both local and neighboring cities (Yu et al., 2021). Meanwhile, green finance has emerged as a critical driver of GTFP, especially in regions with advanced economies but significant environmental challenges. By fostering low-energy, low-pollution industries and restricting high-emission activities, green finance optimizes energy structures and promotes environmental performance through technological innovation (Meng et al., 2024; Sun et al., 2023). Technological progress is another key factor, with innovation driving green development as economies grow (Ding et al., 2024). However, some researchers caution that technological advancements can increase energy and resource consumption, potentially undermining environmental quality (Herring and Roy, 2007; Fan et al., 2023). Additionally, human capital significantly affects GTFP, but its heterogeneous impacts and mechanisms for sustainable development require further exploration (Xiao and You, 2021). These findings collectively highlight the diverse factors influencing GTFP in the YREB region.
Some scholars have used the Tobit model to explore the factors influencing GTFP, revealing impact mechanisms and regional differences. For example, Sun et al. (2023) reported that economic growth targets suppress GTFP, particularly in provinces with high incentives and strict constraints where goals are met. Liu Y. et al. (2022) reported that the digital economy significantly boosts China’s GTFP, with the effect becoming more pronounced as GTFP levels rise. Debbarma et al. (2022) reported that product innovation improved the GTFP of export firms (by 0.61%) and enhanced the human capital quality of non-export firms (by 0.57%). However, a key limitation of these studies is their focus on first-stage GTFP, which often overlooks the analysis of true GTFP after removing environmental factors and random errors. Given that true GTFP is a core driver of sustainable urban development, analyzing its influencing factors is crucial. An in-depth analysis of the factors influencing true GTFP enhances our understanding of its driving factors and provides crucial theoretical support for promoting urban green and sustainable development.
In summary, this study identifies the following research gaps. First, existing GTFP measurements suffer from biases in input and output indicators, leading to discrepancies in capturing the true level of GTFP. Second, most studies focus on GTFP without accounting for environmental factors and random errors, and a systematic analysis of the dynamic characteristics and spatiotemporal evolution of true GTFP and its components (EC and TC) is lacking. Third, there is limited research on the factors influencing true GTFP, with existing studies failing to explore regional differences and underlying mechanisms in depth. These gaps highlight the need for further exploration of the dynamic changes and driving factors of true GTFP.
This study makes three key innovations. First, using data from 2009 to 2022, a three-stage DEA model is applied to eliminate environmental factors and random errors, providing an accurate measurement of the YREB’s true GTFP, which is then decomposed into TC and EC indices to reveal its dynamic characteristics and spatiotemporal evolution. Second, by comparing GTFP, TC, and EC in the first and third stages, the first-stage results significantly overestimate GTFP, TC, and EC, emphasizing the importance of removing disturbances for precise measurement. Third, the Tobit model is used to analyze the factors driving true GTFP, uncovering the key mechanisms behind YREB-GTFP changes and offering theoretical support and policy recommendations for green sustainable development.
The three-stage DEA-Malmquist‒Luenberger (DEA-ML) model is an innovative approach built on the traditional three-stage DEA method by Fried et al. (2002), combined with the theoretical contributions of Chung et al. (1997) and Tone (2003). This new approach incorporates environmental variables and corrects for random errors, offering a more comprehensive assessment than traditional models do. Unlike conventional models, the three-stage SBM-ML model not only accounts for desirable and undesirable outputs but also integrates TC and EC. This allows for a more dynamic and holistic evaluation of the true level of GTFP. The calculation process is illustrated in Figure 2.
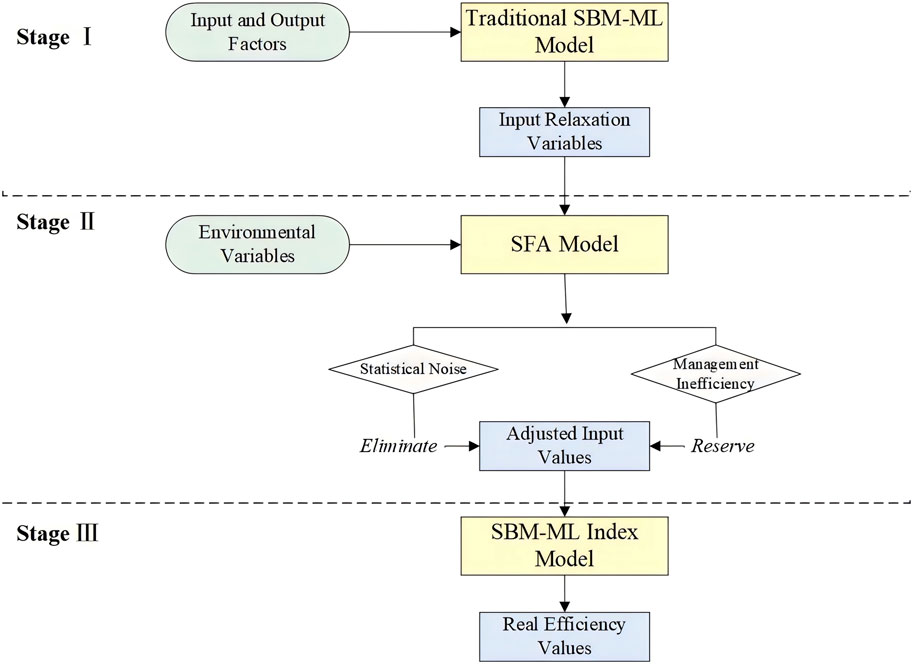
Figure 2. Diagram of the Three-Stage DEA Model.
In the first stage, the undesired SBM model, which is based on the research of Tone et al., is used to handle input redundancy and nonradial data envelopment analysis (DEA). This model defines a production possibility set (PS) that includes both desirable and undesirable outputs. Each city is considered a decision-making unit (DMU), and an optimal production technology frontier is established to evaluate efficiency. The PS can be expressed as shown in Equation 1:
where x represents the input vector, indicating the amount of resources used; y is the desirable output vector, reflecting favorable production outcomes; and b represents the undesirable output vector, indicating unfavorable results such as environmental pollution. Assuming that there are n decision-making units (DMUs), each with m inputs, s desirable outputs, and q undesirable outputs, the production possibility set P(x) represents all achievable combinations of these outputs given the input x.
Below are the objective function and constraints of the Un-SBM-VRS (variable returns to scale) model:
In Equation 2, ρ represents the efficiency value of the decision-making unit, whereas sx, sz, and sy denote the slack variables for inputs, undesirable outputs, and desirable outputs, respectively.
The ML productivity index evaluates productivity changes by considering the combined effects of TC and EC. The strength of the ML index is its capacity to account for changes in both desirable and undesirable outputs, offering a more comprehensive dynamic measurement of GTFP. This index measures changes in the production efficiency of DMUs over time and highlights the contributions of technological progress and efficiency improvements to productivity. The formula for the ML productivity index is shown as in Equation 3.
The detailed decomposition formulas are presented as in Equations 4, 5.
Efficiency change (EC) reflects improvements in technical efficiency, whereas technological progress change (TC) captures shifts in the production frontier. ML > 1 indicates increased productivity, ML < 1 signifies a decline, and ML = 1 suggests no change in productivity.
In the second stage, the SFA model decomposes the slack variables from the first stage into managerial inefficiency, environmental factors, and random disturbances. The model is as shown in Equation 6.
where
Furthermore, by separating the random disturbance term from managerial inefficiency, this study draws on relevant research to calculate managerial inefficiency via Equation 7 (Zhou et al., 2010; Zhang et al., 2004):
where ε represents the composite disturbance term. The formulas for the random disturbance term and input adjustment are as shown in Equations 8, 9.
The term
The adjusted input variables and the original output data are used to recalculate the SBM-ML index model to obtain a more accurate efficiency value. In this way, environmental factors and random interference items can be eliminated to ensure the authenticity and reliability of the efficiency measurement results.
GTFP integrates production inputs, economic development, and environmental pollution to assess regional performance. Capital and labor, as traditional factors, drive industrialization and efficiency through accumulation and innovation, whereas energy, a modern economic cornerstone, propels industrialization, low-carbon transitions, and sustainability. Desirable output, measured by economic development, reflects improved societal wellbeing, whereas undesirable output, assessed through pollutant emissions, highlights environmental stress, with lower emissions benefiting both ecological balance and human health. This paper selects relevant indicator variables that reflect the GTFP of the YREB on the basis of the approaches of Zhou et al. (2010) and Cheng et al. (2022).
This study uses three key input variables: (1) Capital input, measured by capital stock, which is estimated via the perpetual inventory method based on Zhang et al. (2004), with 2006 as the base year. (2) Labor input, represented by the number of employees at the end of the period. (3) Energy input, which is estimated on the basis of the well-established linear correlation between nighttime light data and energy consumption (Shi and Li, 2020). Following this approach, this correlation is first calculated at the provincial level and then applied to city-level data to estimate energy consumption on the basis of nighttime light intensity.
The desirable output is quantified via real GDP. In this paper, the actual GDP level is calculated using 2000 as the base year. The undesirable output is calculated via regional data on industrial wastewater, sulfur dioxide (SO₂) and industrial smoke and dust emissions (Song et al., 2020).
On the basis of the literature review and relevant studies, seven environmental variables are selected: (1) Foreign capital dependence reflects the impact of foreign capital inflows across Chinese regions and is quantified by the ratio of foreign direct investment to GDP (Hawkins, 2010). (2) Industrial structure: measured by the ratio of added value in the secondary industry to that in the tertiary industry, reflecting the focus of regional economic activities and structural development (Ma and Zhu, 2022). (3) Government intervention: represents the economic intervention capacity of municipal governments, typically measured by the ratio of fiscal expenditure to GDP (Yuan et al., 2024). (4) Fiscal autonomy is measured by the ratio of budgetary revenue to budgetary expenditure at the prefecture level, indicating the extent to which local governments rely on local revenues to support their expenditures, reflecting their financial independence. (5) Human capital refers to talent reserves, represented by the proportion of students enrolled in higher education relative to the total population. (6) Technology expenditure: measured by its proportion of regional GDP, reflecting investment intensity in technology. (7) Green finance index: This index is calculated via the entropy method and includes green credit, investment, insurance, bonds, support, funds, and equity, reflecting the financial system’s role in enhancing resource efficiency, advancing environmental objectives, and redirecting resources from high-pollution, high-energy sectors to clean technology industries.
This study analyzes data from 108 cities within the YREB from 2009 to 2022. The starting year, 2009, was chosen because of data availability and its alignment with key historical events: it followed the 2008 financial crisis, which spurred China’s implementation of the Circular Economy Promotion Law (2009), signaling a strategic shift toward resource efficiency and environmental protection, particularly in the YREB. Data were sourced from the China City Statistical Yearbook, China Environment Statistical Yearbook, China Science and Technology Statistical Yearbook, and local statistical bulletins. Missing values were imputed via linear interpolation. Descriptive statistics are provided in Table 1.
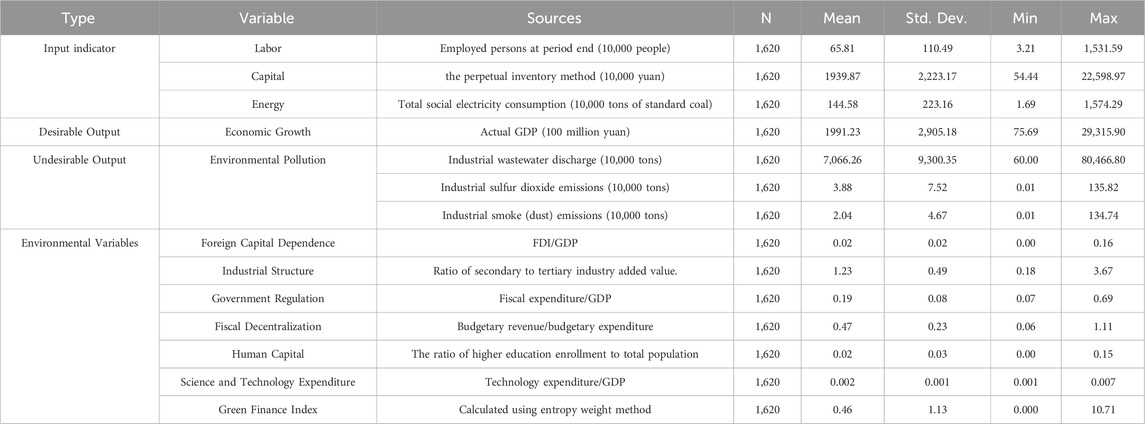
Table 1. Descriptive statistics of the variables.
This study calculates GTFP levels via input‒output data from the YREB region, employing the undesirable output SBM-ML index model. The first-stage results, shown in Table 2, reveal significant fluctuations in GTFP with marked regional differences. The overall average GTFP is 1.7676, indicating generally good green development, especially in the downstream regions, where the average GTFP is 1.9834, reflecting higher levels of green development. However, the COVID-19 pandemic severely impacted economic and environmental indicators in 2020, causing a sharp decline in GTFP. Despite this, the YREB region demonstrated strong economic resilience and adaptability, with rapid recovery from 2021 to 2022.
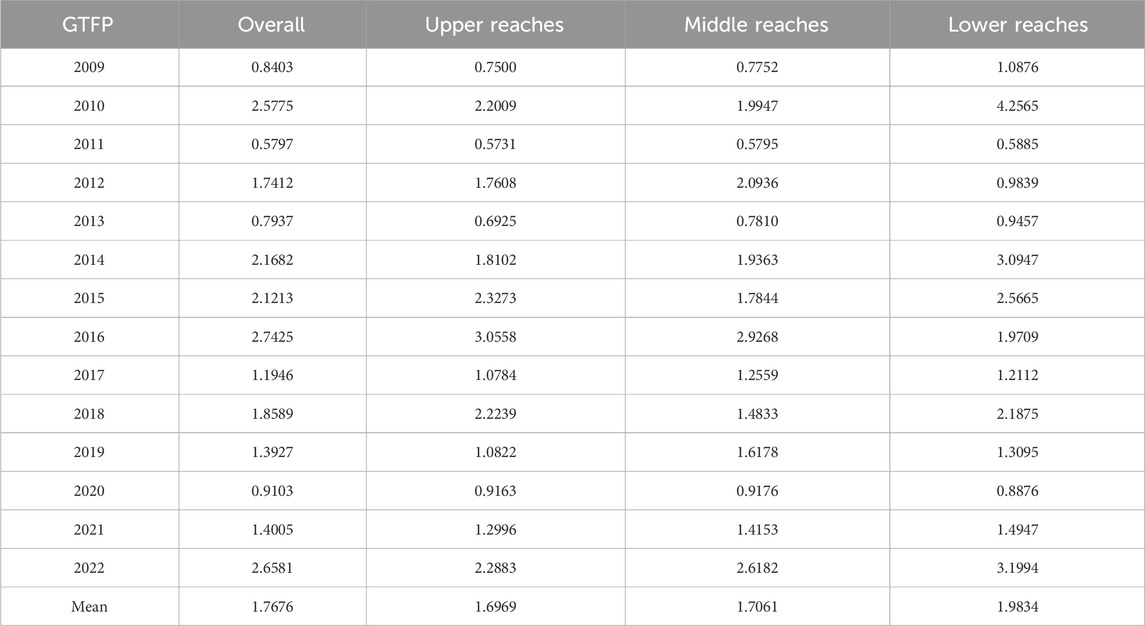
Table 2. GTFP values of the first stage.
GTFP fluctuations are driven primarily by changes in TC and EC, as presented in Table 3, which shows the TC and EC values from the first stage. For instance, the implementation of innovation pilot cities in 2010 significantly boosted technological progress, leading to a substantial rise in GTFP. Specifically, TC surged from 0.3293 in 2009 to 2.4692 in 2010, with the downstream region reaching 2.7840, highlighting the crucial role of technological progress in driving green production. Furthermore, EC also played an important role in specific years. Between 2018 and 2019, while TC remained relatively stable, EC declined in the upstream, downstream, and overall regions, but increased in the midstream region. Consequently, GTFP decreased in all regions except the midstream.
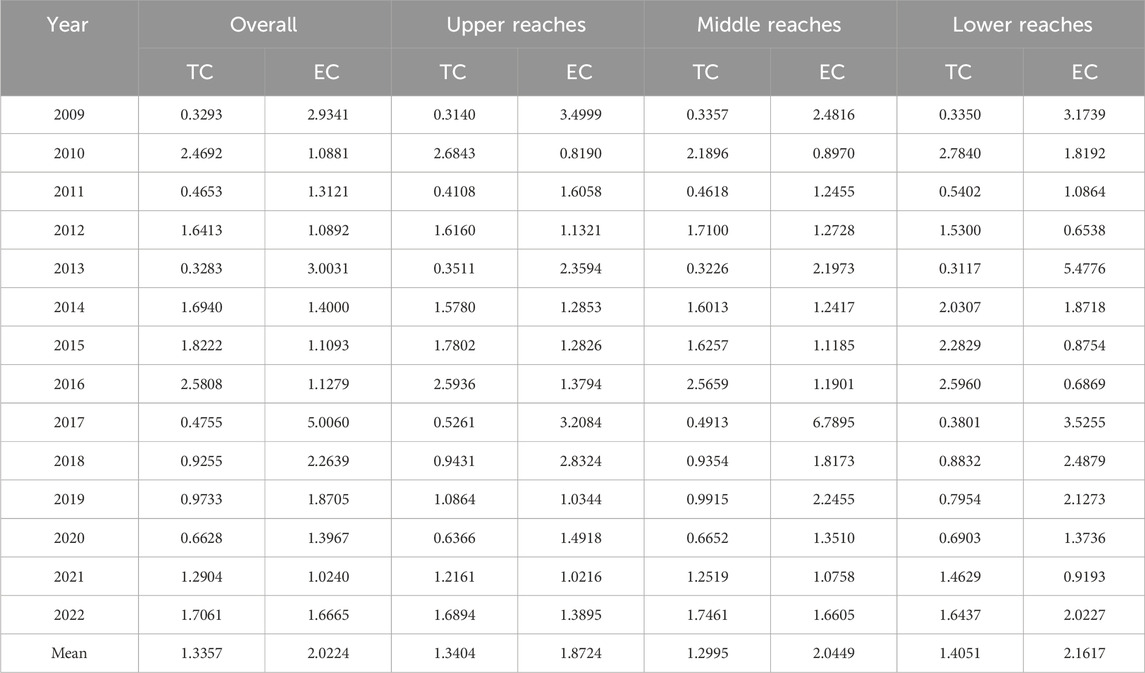
Table 3. First-stage TC and EC values.
The data highlight the complex relationship between EC and TC. According to the 2019 Energy Efficiency Report, the increase in industrial production scale and efficiency led to an improvement in EC, reaching 5.006 in 2017. Despite this, GTFP declined due to TC being only 0.4755, indicating that without sufficient technological progress, improvements in technical efficiency alone cannot effectively drive green productivity. Similarly, in 2013, although the overall EC increased to 3.0031, the TC decreased to 0.3283, causing the GTFP to decrease to 0.7937. While EC partially offset the decline in TC, only the downstream region, with an EC of 5.4776, was able to compensate for the lack of TC and prevent a major decrease in GTFP. In other regions, EC could not fully offset the TC decline, leading to a GTFP reduction. This finding reinforces that technological efficiency cannot replace technological progress, highlighting the essential role of TC in driving GTFP growth.
Overall, the YREB-GTFP fluctuations reflect the dynamic interplay between TC and EC. High EC often accompanies low TC, suggesting that while firms focus on improving efficiency, they may neglect technological progress, leading to stagnation or decline in innovation and limiting green productivity growth. In contrast, when TC is high and EC remains moderate, it indicates a balanced approach that drives both technological progress and efficiency. Thus, sustained GTFP growth depends on advancing technological progress, with efficiency improvements providing essential support.
The findings in Table 4 show that the coefficients of the environmental variables on the input slack variables have significant impacts. Both γ and the LR one-sided test are significant at the 1% level, confirming the reliability of the results.
(1) Foreign capital dependence. The coefficients for foreign capital dependence on capital and energy slack are negative and statistically significant at the 5% level, whereas the coefficient on labor slack is negative but not significant. This finding suggests that foreign enterprises with advanced technology and management expertise help optimize resource allocation, improve capital efficiency, and reduce capital and energy demand (Lei et al., 2024; Jing et al., 2024). These enterprises also use energy more efficiently, leading to lower consumption per unit of output. Although the impact on labor slack is not significantly negative, it suggests a possible improvement in labor productivity, indirectly reducing labor input slack. Overall, a higher degree of foreign capital dependence can enhance the efficiency of capital and energy use, improving overall resource utilization and fostering economic resilience (Mahmood et al., 2024).
(2) Industrial structure. The industrial structure negatively affects capital slack and positively affects labor slack, although neither is statistically significant. However, its effect on energy slack is significant at the 5% level. A higher secondary industry share indicates greater reliance on capital-intensive inputs, improving capital efficiency and reducing capital slack, whereas increased labor demand increases labor slack. Despite the high energy demand in industrial production, adopting efficient technologies can notably reduce energy slack (Lin et al., 2024).
(3) Government intervention: Government intervention significantly reduces capital, labor, and energy slack at the 1% level, indicating improved input efficiency. This highlights the effectiveness of government intervention in optimizing resource allocation, reducing waste, and fostering sustainable growth, ultimately enhancing overall efficiency and driving higher-quality economic outcomes (Yan et al., 2024).
(4) Fiscal autonomy: Fiscal autonomy positively affects capital, labor, and energy slack, significantly increasing capital slack (1% level) and energy slack (10% level), which reduces capital and energy efficiency. This may result from local government competition, leading to market segmentation, local protectionism, increased costs, redundant construction, and resource waste. Additionally, local protectionism may hinder advanced technology adoption, maintaining outdated practices and reducing economic efficiency. The positive but insignificant effect on labor slack suggests that fiscal autonomy-driven public investment does not always improve labor efficiency, causing some labor waste.
(5) Human capital. Human capital, as a talent reserve, also enhances citizens’ skills and work capabilities. The results show that human capital significantly reduces capital, labor, and energy slack at the 1% level. This is likely because high-quality human capital possesses greater skills and efficiency in resource management and utilization. Specifically, skilled human capital can make more informed investment decisions and manage capital better, reducing waste and redundancy. In terms of labor, a higher-quality workforce increases productivity and minimizes labor waste. For energy, human capital can adopt advanced technologies and optimized management practices, reducing energy waste and enhancing efficiency (Goldin, 2024).
(6) Technology expenditure. At the 1% significance level, technology expenditure has a positive effect on the redundancy of capital, labor, and energy, indicating that increased technology spending effectively reduces the usage of input endowments. As technology expenditure increases, production technology improves, enhancing productivity. This improvement means that more output is generated per unit of input, while social demand has not kept pace, leading to an increase in surplus capital, labor, and energy (Takayabu et al., 2019). Additionally, the rapid application of artificial intelligence has increased the demand for skilled labor, but a large portion of low-skilled labor is underutilized (Xu et al., 2024).
(7) Green finance index. The Green Finance Index has varying impacts on resource slack. While its effects on capital (−22.36) and labor slack (1.98) are not significant, it notably reduces energy slack (−3.25) at the 5% level, showing that green finance enhances energy efficiency and reduces redundancy (Sun et al., 2024). By promoting green technologies and optimizing energy consumption through credit, investment, insurance, bonds, and policy support, green finance plays a vital role (Zhang et al., 2024). Although its short-term impact on capital and labor is limited, green finance is expected to gradually improve resource allocation in the long term by fostering green industry development, thus promoting sustainable economic growth (Zhao et al., 2024).
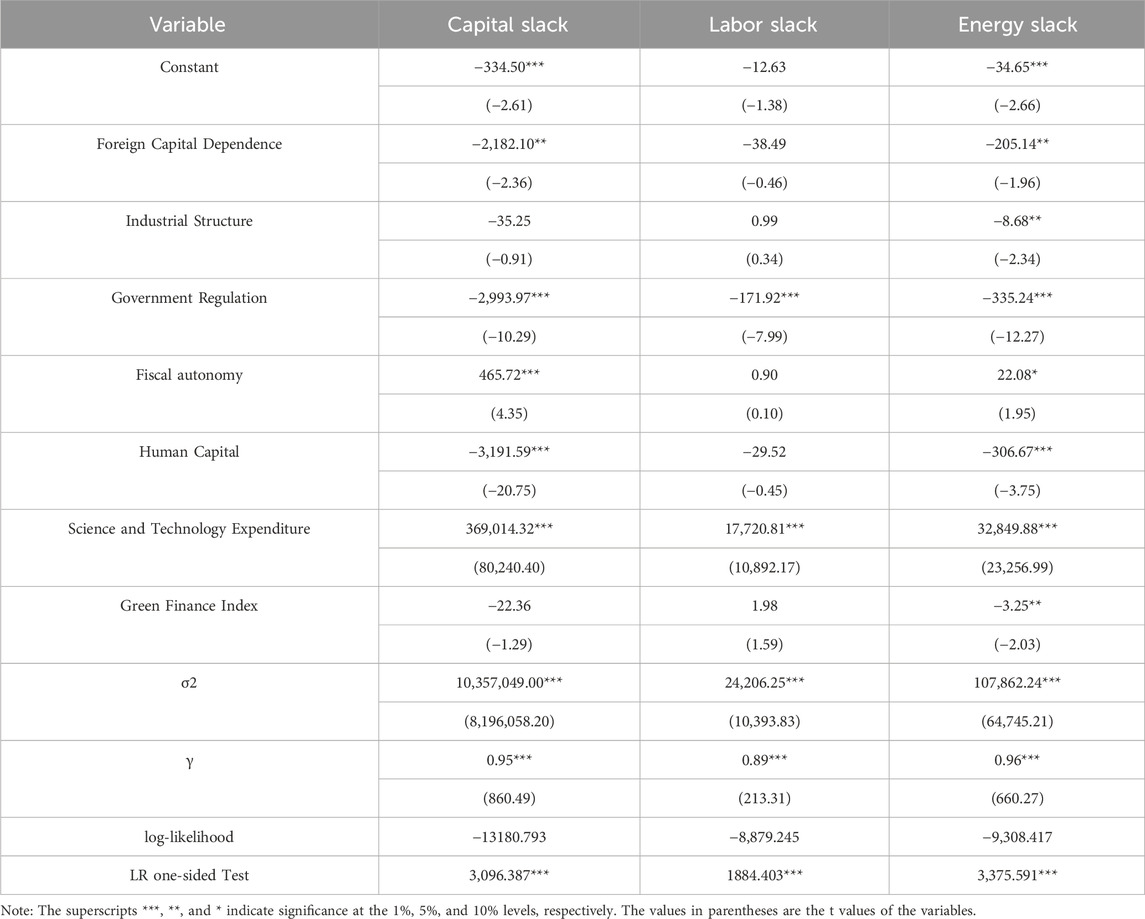
Table 4. Results of the second-stage SFA.
Table 5 presents the adjusted real GTFP levels for the YREB. Specifically, (1) overall, real GTFP fluctuates with economic development. Compared with those in the first stage, the GTFP values significantly decreased by 63.9%, with reductions of 70.3%, 65.8%, and 53.7% in the upstream, midstream, and downstream regions, respectively. This indicates a substantial overestimation of GTFP in the first stage, with environmental factors having a significant masking effect on GTFP. (2) Over time, the enactment of the 2009 Circular Economy Promotion Law facilitated structural adjustments and promoted the coordinated development of the economy and ecology, but the effects were delayed. From 2009 to 2010, influenced by the GDP-only policy, rapid GDP growth and the expansion of high-pollution industries increased GTFP values. From 2011 to 2013, the effects of economic‒eco-ecological coordination began to emerge as the economy entered a structural adjustment phase, leading to a significant decline in GTFP. Between 2014 and 2019, as the economy gradually transformed, the GTFP slowly grew (Long et al., 2023). However, from 2020 to 2022, GTFP continued to decline slowly due to the impact of COVID-19. (3) From a regional perspective, the average real GTFP in the downstream region is 0.919, which is significantly greater than 0.584 in the midstream region and 0.504 in the upstream region, highlighting significant regional disparities in green development levels.
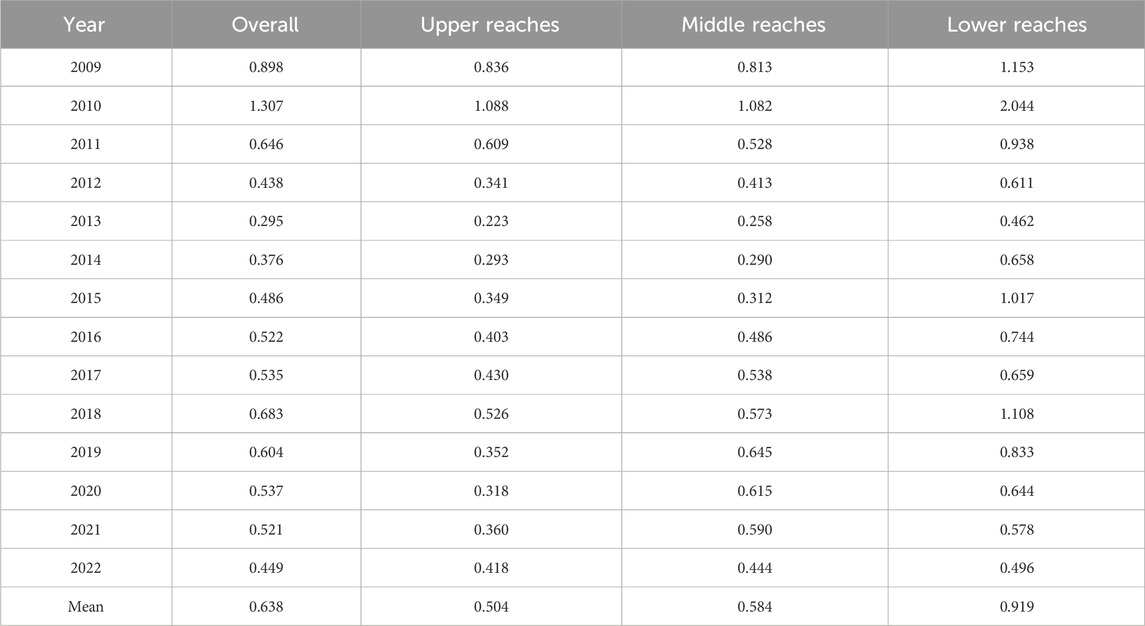
Table 5. Real GTFP values.
Table 6 presents the TC and EC results for the YREB regions, showing overall small differences. First, compared with those in the first stage, both TC and EC in the third stage are more stable but significantly lower, indicating the substantial impact of environmental factors on technological progress and efficiency change. In most years, the EC remains above 1, suggesting that efficiency generally remains at a normal level. However, the TC exhibited significant fluctuations, with notable technological setbacks occurring in 2009, 2011, and 2013. Second, from 2009 to 2022, TC and real GTFP moved in the same direction (Long et al., 2023; Chen et al., 2021), whereas no clear correlation was found between EC and real GTFP. Despite the continued decline in GTFP from 2020 to 2022, the fluctuations in TC and EC were minimal, indicating that YREB cities demonstrated strong resilience to the economic shocks caused by the COVID-19 pandemic.
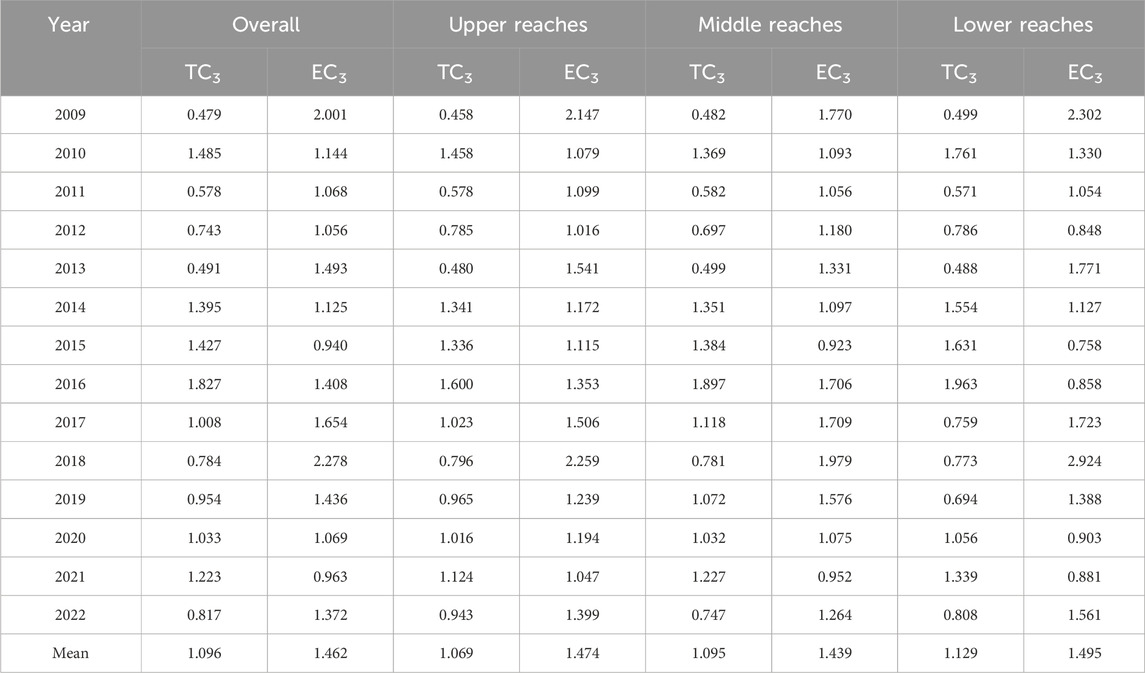
Table 6. TC and EC values.
To highlight spatial and temporal GTFP variations, this study uses ArcGIS to visualize changes in the YREB from 2009 to 2022, as shown in Figure 3.
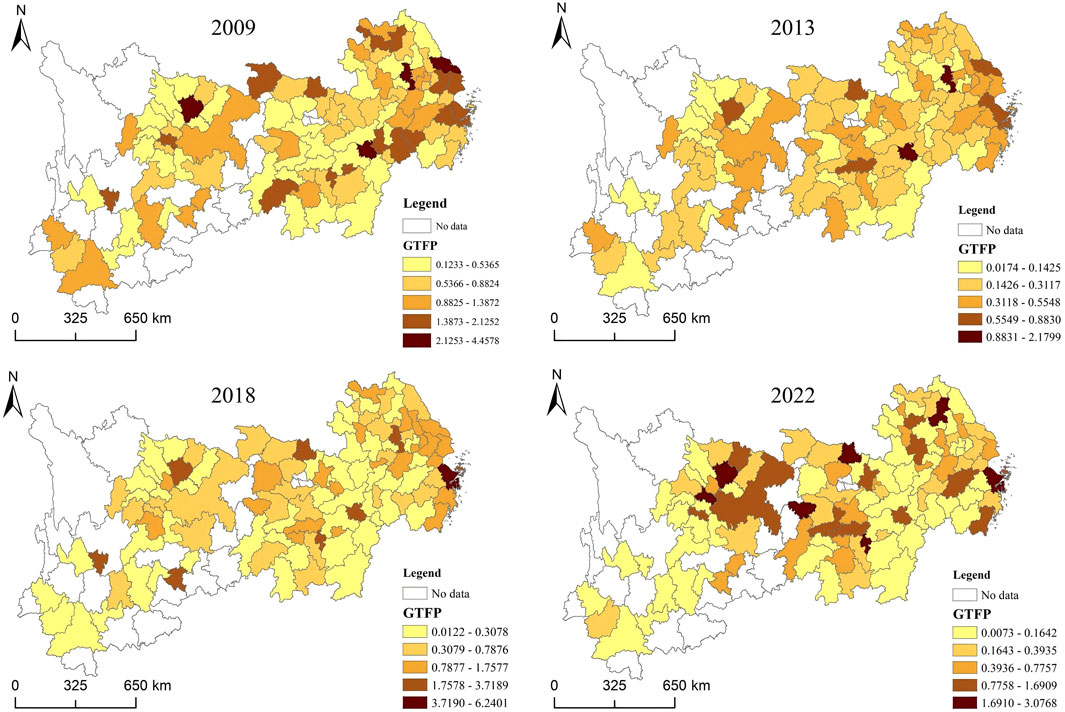
Figure 3. Changes in GTFP in the First Stage.
Figures 3–5 show the following: (1) Overall trends: Over the past 14 years, the real GTFP levels of the YREB have exhibited cyclical fluctuations and significant spatial differences. These fluctuations may be attributed to the shift from a “GDP-only” approach to green development from 2013 to 2014, as well as external shocks such as the economic slowdown from the COVID-19 pandemic in 2019. (2) Regional differences in green development are evident among the upper, middle, and lower reaches of the Yangtze River. The downstream regions, including Shanghai, Jiangsu, and Zhejiang, presented relatively high GTFP levels, with cities such as Shanghai, Ningbo, Suizhou, Nanchang, Nanjing, and Zhoushan averaging above 1.3. In contrast, cities in the middle and upper reaches, such as Ma’anshan and Mianyang, have much lower GTFP levels, 0.07 and 0.10, respectively. This indicates an imbalance in green development across the Yangtze River Basin, possibly due to the better infrastructure, advanced environmental technologies, and stricter environmental regulations of upstream regions, whereas the middle reaches face challenges in terms of industrial pollution control, resource efficiency, and green technology promotion. (3) Fastest-growing cities, such as Yueyang, Changsha, Ningbo, Huai’an, and Hefei, have shown the fastest increases in real GTFP, with growth rates exceeding 2. These cities, mostly positioned in key and port areas of the Yangtze River Basin, benefit from greater environmental protection investments, green technology adoption, and industrial upgrades. Additionally, the development of green logistics and clean energy driven by port economies has shown significant growth potential and adaptability in the context of a green economic transition. (4) Spatial distribution: The overall spatial distribution of real GTFP levels shows a “low-high-low-high” pattern from west to east, forming an “N-shaped” spatial structure. High-value areas cluster in the core regions of the Yangtze River Basin, forming a ring around major cities and provincial capitals. This emphasizes their leading roles in green development, particularly in policy formulation, technological innovation, and financial investment.
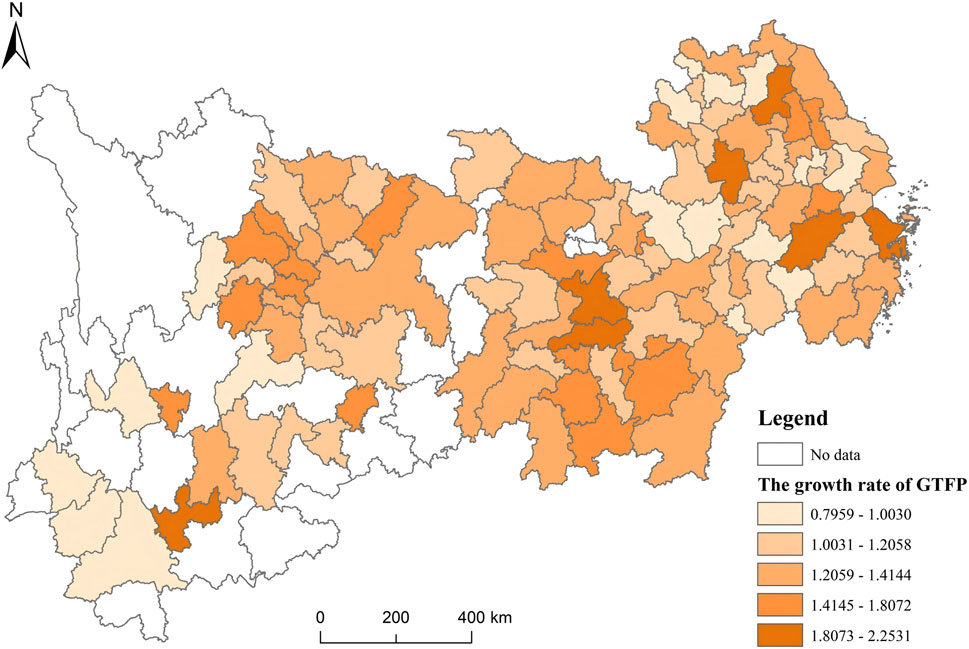
Figure 4. The Growth Rate of the First Stage GTFP.
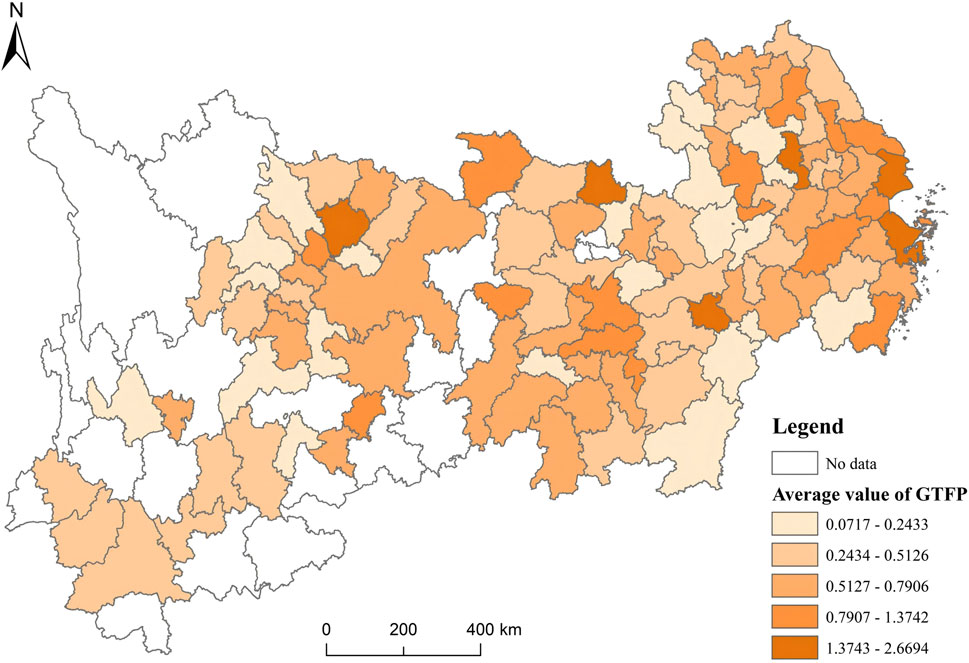
Figure 5. The Growth Rate of the First Stage GTFP.
To explore the factors influencing green economy levels, this paper examines prefecture-level city characteristics and selects six key indicators: (1) economic development level (Pgdp), measured by GDP per capital; (2) capital‒labor ratio (Fest), calculated as the ratio of invested capital to labor; (3) urbanization level (Civz), measured primarily by the proportion of the permanent urban population to the total population and, in some areas, by the year-end proportion of the non-agricultural population to the total population; (4) government governance intensity (Gore), measured by the amount of investment in environmental pollution control (100 million yuan); (5) entrepreneurial activity (Enac), quantified by the number of new businesses per 100 people; and (6) intergovernmental expenditure decentralization (Iede), defined as the ratio of prefecture-level expenditure to the total expenditure across city, provincial, and central governments, used to investigate structural changes in government spending systems. Because the Tobit model can address the problem of truncated dependent variables, it is suitable for continuous data with boundary effects (Shuai and Fan, 2020; Jiang et al., 2024). Therefore, we construct the Tobit model as shown in Equation 10.
where
Table 7 presents the Tobit model results, showing the impact of various variables on GTFP. The analysis reveals that (1) urbanization (Civz) has a significant positive effect at the 5% level, indicating that it increases GTFP by driving population agglomeration, improving resource efficiency, and accelerating infrastructure optimization and green industrial transformation. (2) Government governance intensity (Gore) has a significant positive effect at the 10% level, indicating that government actions, such as environmental expenditures, directly drive the green transformation of enterprises, promote cleaner technologies, enhance resource efficiency, reduce emissions, and support sustainable economic growth. (3) The negative effect of intergovernmental expenditure decentralization (Iede) on GTFP suggests that increased fiscal autonomy in prefecture-level cities can lead to the neglect of green development goals in favor of short-term political gains, adversely affecting GTFP. (4) The negative significance of per capital gross product (Pgdp) indicates that despite the progress of economic restructuring and green transformation, the dependence on high-polluting industries has not been eliminated, and the pressure on resources and the environment is still high, resulting in a continuous decline in GTFP, which highlights the need to pay attention to green transformation in economic growth. (5) The impact of the capital‒labor ratio (Fest) and entrepreneurial activity (Enac) on GTFP is not significant, which may be attributed to the relatively limited direct impact of capital and labor inputs and new enterprise founding activities on GTFP at the current stage, which fails to effectively improve resource utilization efficiency or environmental performance.
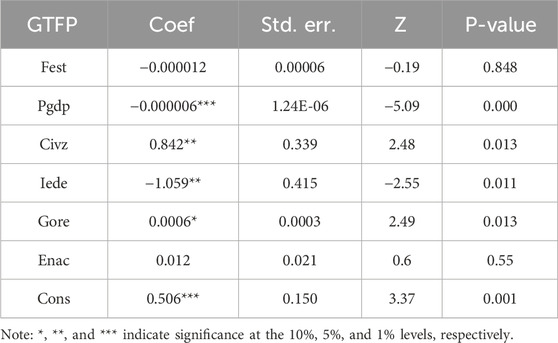
Table 7. Tobit regression results.
Owing to the COVID-19 pandemic, China has significantly scaled down economic activities. A Tobit regression excluding the 2020–2022 data, shown in Table 8, reveals that urbanization is no longer significant. This is likely due to lock-downs restricting mobility, weakening population agglomeration, and slowing infrastructure optimization and green industrial transformation. The short-term shocks reduced the impact of urbanization on green total factor productivity, whereas the other results remain consistent with those in Table 7.
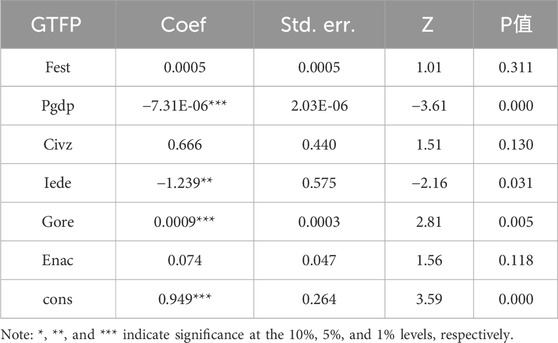
Table 8. Tobit robust regression results were obtained.
Green development is a crucial indicator of China’s shift from a speed-driven economy to a quality-focused economy, directly influencing sustainable growth and environmental protection. GTFP serves as a key index for assessing regional resource efficiency and environmental effects. Accurately measuring GTFP levels helps reveal hidden environmental costs, prevent an overemphasis on economic growth, pinpoint green development challenges, and aid in achieving “dual carbon” and ecological civilization goals. This study employs a three-stage SBM-ML index to assess true GTFP levels in the YREB from 2009 to 2022 and explores spatial and temporal patterns of green development via ArcGIS. The Tobit model is applied to examine the factors influencing GTFP. The main conclusions are as follows:
(1) The first-stage GTFP values for the upper, middle, and lower reaches all exceed 1, indicating rapid green development across the YREB. While regional differences are minimal, the downstream region shows a slight advantage in terms of green development. Moreover, the continued growth of GTFP is driven primarily by technological progress, with efficiency also contributing to its enhancement to some extent.
(2) Compared with the first-stage GTFP, the mean real GTFP for the YREB, which is calculated after excluding environmental factors and random errors, is less than 1, with the real GTFP being overestimated by 63.9%. Notably, the real GTFP is still significantly higher in the downstream regions than in the middle and upper reaches. Furthermore, while TC fluctuates significantly, EC remains relatively stable, with the real GTFP closely following the trend of TC and showing no significant correlation with EC.
(3) Over the past 14 years, the real GTFP levels of the YREB have exhibited cyclical fluctuations and significant spatial disparities. The downstream regions (e.g., Shanghai, Jiangsu, Zhejiang) show greater green development, whereas the middle and upper reaches (e.g., Ma’anshan, Mianyang) lag behind. Cities such as Yueyang, Changsha, Ningbo, Huai’an, and Hefei have the fastest GTFP growth, with rates exceeding 2, and are mainly concentrated in core and port areas. Overall, real GTFP follows a “low-high-low-high” N-shaped pattern from west to east, with high-value areas clustered around core regions and major cities.
(4) The Tobit model regression results reveal the complex influence of multidimensional factors on real GTFP. Positive factors such as urbanization and government environmental expenditure highlight agglomeration effects, infrastructure enhancement, and policy-driven increases in GTFP. In contrast, negative factors such as per capita GDP and intergovernmental expenditure decentralization underscore economic growth’s reliance on high-pollution, high-energy consumption pathways and potential distortions in green incentives under fiscal decentralization. The nonsignificance of the capital‒labor ratio and entrepreneurial activity suggests limited marginal gains from traditional factor allocation and initial innovation efforts.
On the basis of these conclusions, the recommended actions are as follows:
(1) To achieve sustained green development, policies should prioritize technological progress, supported by efficiency improvements, to optimize GTFP. First, increasing investment in technological innovation, particularly high-tech and environmental technologies, ensures that technology drives green development. Simultaneously, this can enhance resource efficiency, optimize industrial structures, reduce energy consumption and pollution, and increase overall productivity. Second, successful downstream practices in infrastructure and environmental technology should be extended to the middle and upper reaches to reduce regional disparities and promote balanced green development across the YREB. Finally, policies should be tailored to each region’s economic and resource conditions to achieve comprehensive green development goals.
(2) Green development should also be evaluated via real GTFP to avoid superficial overestimations. In the middle and upper reaches, real GTFP can be enhanced by promoting technological progress through R&D investment, green technology incentives, and infrastructure improvements, with a focus on ecological restoration and industrial optimization. In the economically advanced downstream region, high-tech industry advancement through innovation subsidies, industry-academia collaboration, and green technology incubators should be prioritized to reduce reliance on energy-intensive sectors and foster low-carbon growth.
(3) To sustain and enhance real GTFP growth in rapidly developing cities, policies should prioritize technological innovation and green practices. Increase R&D investment in clean technologies and production efficiency. Foster green industry clusters to create synergies and economies of scale. The infrastructure for green logistics and clean energy adoption should be strengthened. These cities are designed as pilot zones for innovative policies, enabling them to lead and drive growth in other cities across the YREB by testing and scaling successful approaches to ensure broader sustained development and resilience.
(4) To drive sustainable development, start by strengthening foreign capital management and green financial support, prioritizing green-aligned foreign enterprises. Next, enhance green finance and invest in green projects to accelerate enterprise transformation. Establish special green funds to promote clean technology adoption, reduce pollution, and improve efficiency. Finally, ensure robust policy implementation by reinforcing incentive systems, maintaining accountability, and incentivizing green innovation with targeted rewards and penalties, creating a cohesive and impactful transition to green development.
This study has several limitations that point to promising avenues for future research. First, its analysis is limited to the YREB and could be expanded to include cities across the country, enabling a more comprehensive and comparative perspective. Second, the dataset used in this study covers the period from 2009 to 2022; updating the data to include the most recent years would provide a more current and relevant understanding of GTFP trends and their driving factors.
The original contributions presented in the study are included in the article/Supplementary Material, further inquiries can be directed to the corresponding author.
FC: Conceptualization, Data curation, Methodology, Software, Writing–original draft. LZ: Conceptualization, Funding acquisition, Resources, Software, Validation, Writing–original draft, Writing–review and editing. YL: Funding acquisition, Resources, Writing–review and editing.
The author(s) declare that financial support was received for the research, authorship, and/or publication of this article. This research was funded by the Ministry of Education Humanities and Social Sciences Research Planning Fund Project (grant number: 20YJA790041) and the Hunan Province Graduate Research Innovation Project (grant number: CX20231198).
Thanks to the editors and reviewers for their constructive comments and suggestions.
The authors declare that the research was conducted in the absence of any commercial or financial relationships that could be construed as a potential conflict of interest.
The author(s) declare that no Generative AI was used in the creation of this manuscript.
All claims expressed in this article are solely those of the authors and do not necessarily represent those of their affiliated organizations, or those of the publisher, the editors and the reviewers. Any product that may be evaluated in this article, or claim that may be made by its manufacturer, is not guaranteed or endorsed by the publisher.
The Supplementary Material for this article can be found online at: https://www.frontiersin.org/articles/10.3389/fenvs.2024.1508785/full#supplementary-material
Ahumada, G., and Iturra, V. (2021). If the air was cleaner, would we be happier? An economic assessment of the effects of air pollution on individual subjective well-being in Chile. J. Clean. Prod. 289, 125152. doi:10.1016/j.jclepro.2020.125152
Chay, K. Y., and Greenstone, M. (2005). Does air quality matter? Evidence from the housing market. J. Polit. Econ. 113 (2), 376–424. doi:10.1086/427462
Chen, Y., Li, C., Li, X., Zhang, X., and Tan, Q. (2022). Efficiency of water pollution control based on a three-stage SBM-DEA model. Water 14 (9), 1453. doi:10.3390/w14091453
Chen, Y., Miao, J., and Zhu, Z. (2021). Measuring green total factor productivity of China's agricultural sector: a three-stage SBM-DEA model with non-point source pollution and CO2 emissions. J. Clean. Prod. 318, 128543. doi:10.1016/j.jclepro.2021.128543
Cheng, Z., and Kong, S. (2022). The effect of environmental regulation on green total-factor productivity in China's industry. Environ. Impact Assess. Rev. 94, 106757. doi:10.1016/j.eiar.2022.106757
Cheng, Z., Yu, X., Hu, H., Su, Z., and Zhang, S. (2022). Measurement of China’s green total factor productivity introducing human capital composition[J]. Int. J. Environ. Res. Public Health 19 (20), 13563.
Chung, Y. H., Färe, R., and Grosskopf, S. (1997). Productivity and undesirable outputs: a directional distance function approach. J. Environ. Manage. 51, 229–240. doi:10.1006/jema.1997.0146
Debbarma, J., Choi, Y., Yang, F., and Lee, H. (2022). Exports as a new paradigm to connect business and information technology for sustainable development. J. Innov. Knowl. 7 (4), 100233. doi:10.1016/j.jik.2022.100233
Ding, R., Sun, F., and Zhong, T. (2024). Does technological innovation promote green development in the Yangtze River Economic Belt? Based on the spatial econometric analysis. Environ. Dev. Sustain., 1–35. doi:10.1007/s10668-024-04768-2
Du, J., Zhong, Z., Shi, Q., Wang, L., Liu, Y., and Ying, N. (2024). Does government environmental attention drive green total factor productivity? Evidence from China. J. Environ. Manage. 366, 121766. doi:10.1016/j.jenvman.2024.121766
Ebenstein, A., Fan, M., Greenstone, M., He, G., Yin, P., and Zhou, M. (2015). Growth, pollution, and life expectancy: China from 1991–2012. Am. Econ. Rev. 105 (5), 226–231. doi:10.1257/aer.p20151094
Fan, F., Zhang, K., Dai, S., and Wang, X. (2023). Decoupling analysis and rebound effect between China’s urban innovation capability and resource consumption. Technol. Anal. Strateg. Manag. 35 (4), 478–492. doi:10.1080/09537325.2021.1979204
Färe, R., Grosskopf, S., and Norris, M. (1994). Productivity growth, technical progress, and efficiency change in industrialized countries. Am. Econ. Rev. 66-83.
Fried, H. O., Lovell, C. A. K., Schmidt, S. S., and Yaisawarng, S. (2002). Accounting for environmental effects and statistical noise in data envelopment analysis. J. Prod. Anal. 17, 157–174. doi:10.1023/a:1013548723393
Goldin, C. (2024). “Human capital,” in Handbook of cliometrics (Cham: Springer International Publishing), 353–383.
Gong, B. (2020). Agricultural productivity convergence in China. China Econ. Rev. 60, 101423. doi:10.1016/j.chieco.2020.101423
Greenstone, M., and Hanna, R. (2014). Environmental regulations, air and water pollution, and infant mortality in India. Am. Econ. Rev. 104 (10), 3038–3072. doi:10.1257/aer.104.10.3038
Hawkins, C. V. (2010). Competition and cooperation: local government joint ventures for economic development. J. Urban Aff. 32, 253–275. doi:10.1111/j.1467-9906.2009.00492.x
He, J., Liu, H., and Salvo, A. (2019). Severe air pollution and labor productivity: evidence from industrial towns in China. Am. Econ. J. Appl. Econ. 11 (1), 173–201. doi:10.1257/app.20170286
Herring, H., and Roy, R. (2007). Technological innovation, energy efficient design and the rebound effect. Technovation 27 (4), 194–203. doi:10.1016/j.technovation.2006.11.004
Huang, P., and Chen, X. (2024). The impact of data factor-driven industry on the green total factor productivity: evidence from the China. Sci. Rep. 14 (1), 25377. doi:10.1038/s41598-024-77189-w
Jiang, Y., Liu, X., Yang, L., Hu, T., Pan, H., Luo, H., et al. (2024). Moving towards sustainable development in China's rural counties: ecological efficiency evaluation based on DEA-Malmquist-Tobit model. J. Clean. Prod. 442, 141093. doi:10.1016/j.jclepro.2024.141093
Jing, Z., Liu, Z., Wang, T., and Zhang, X. (2024). The impact of environmental regulation on green TFP: a quasi-natural experiment based on China's carbon emissions trading pilot policy. Energy 306, 132357. doi:10.1016/j.energy.2024.132357
Lee, C. C., and Lee, C. C. (2022). How does green finance affect green total factor productivity? Evidence from China. Energy Econ. 107, 105863. doi:10.1016/j.eneco.2022.105863
Lei, X., Chen, X., and Zhang, B. (2024). Unleashing the spillover potential: exploring the role of technology-seeking investment in driving green innovation of host countries. Technol. Forecast. Soc. Change 200, 123200. doi:10.1016/j.techfore.2023.123200
Li, H., He, H., Shan, J., and Cai, J. (2019). Innovation efficiency of semiconductor industry in China: a new framework based on generalized three-stage DEA analysis. Socio-Econ. Plan. Sci. 66, 136–148. doi:10.1016/j.seps.2018.07.007
Li, S. E., and Cheng, K. M. (2022). Do large cities have a productivity advantage in China? From the perspective of green total factor productivity growth. J. Clean. Prod. 379, 134801. doi:10.1016/j.jclepro.2022.134801
Lin, S., Zhou, Z., Hu, X., Chen, S., and Huang, J. (2024). How can urban economic complexity promote green economic growth in China? The perspective of green technology innovation and industrial structure upgrading. J. Clean. Prod. 450, 141807. doi:10.1016/j.jclepro.2024.141807
Liu, H., Wu, W., and Yao, P. (2022). A study on the efficiency of pediatric healthcare services and its influencing factors in China: estimation of a three-stage DEA model based on provincial-level data. Socio-Econ. Plan. Sci. 84, 101315. doi:10.1016/j.seps.2022.101315
Liu, M., Zhu, Y., and Zhang, J. (2024). Can environmental regulation enhance green total factor productivity? Evidence from 107 cities in the Yangtze River Economic Belt. Sustainability 16 (12), 5243. doi:10.3390/su16125243
Liu, P., and Zhu, B. (2022). Temporal-spatial evolution of green total factor productivity in China's coastal cities under carbon emission constraints. Sustain. Cities Soc. 87, 104231. doi:10.1016/j.scs.2022.104231
Liu, S., Lei, P., Li, X., and Li, Y. (2022). A nonseparable undesirable output modified three-stage data envelopment analysis application for evaluation of agricultural green total factor productivity in China. Sci. Total Environ. 838, 155947. doi:10.1016/j.scitotenv.2022.155947
Liu, Z., and Xin, L. (2019). Has China's Belt and Road Initiative promoted its green total factor productivity? Evidence from primary provinces along the route. Energy Policy 129, 360–369. doi:10.1016/j.enpol.2019.02.045
Liu Y., Y., Yang, Y., Li, H., and Zhong, K. (2022). Digital economy development, industrial structure upgrading and green total factor productivity: empirical evidence from China’s cities. Int. J. Environ. Res. Public Health 19 (4), 2414. doi:10.3390/ijerph19042414
Long, Y., Liu, L., and Yang, B. (2023). Different types of environmental concerns and heterogeneous influence on green total factor productivity: evidence from Chinese provincial data. J. Clean. Prod. 428, 139295. doi:10.1016/j.jclepro.2023.139295
Luo, Z., Chen, Y., Tang, Z., and Yang, J. (2024). Environmental governance’s effect on green total factor productivity in the Yangtze River Economic Belt, China. Environ. Dev. Sustain. 1-27. doi:10.1007/s10668-024-05247-4
Ma, D., and Zhu, Q. (2022). Innovation in emerging economies: research on the digital economy driving high-quality green development. J. Bus. Res. 145, 801–813. doi:10.1016/j.jbusres.2022.03.041
Mahmood, S., Misra, P., Sun, H., Luqman, A., and Papa, A. (2024). Sustainable infrastructure, energy projects, and economic growth: mediating role of sustainable supply chain management. Ann. Oper. Res., 1–32. doi:10.1007/s10479-023-05777-6
Meng, Y., Yu, J., Yu, Y., and Ren, Y. (2024). Impact of green finance on green total factor productivity: new evidence from improved synthetic control methods. J. Environ. Manage. 372, 123394. doi:10.1016/j.jenvman.2024.123394
Pan, Z., Tang, D., Kong, H., and He, J. (2022). An analysis of agricultural production efficiency of Yangtze River Economic Belt based on a three-stage DEA Malmquist model. Int. J. Environ. Res. Public Health 19 (2), 958. doi:10.3390/ijerph19020958
Shi, D., and Li, S. L. (2020). Emissions trading system and energy use efficiency: measurements and empirical evidence for cities at and above the prefecture level. China Ind. Econ. 09, 5–23. doi:10.19581/j.cnki.ciejournal.2020.09.001
Shuai, S., and Fan, Z. (2020). Modeling the role of environmental regulations in regional green economy efficiency of China: empirical evidence from super efficiency DEA-Tobit model. J. Environ. Manage. 261, 110227. doi:10.1016/j.jenvman.2020.110227
Song, K., Bian, Y., Zhu, C., and Nan, Y. (2020). Impacts of dual decentralization on green total factor productivity: evidence from China’s economic transition. Environ. Sci. Pollut. Res. 27, 14070–14084. doi:10.1007/s11356-020-07953-8
Song, M., Du, J., and Tan, K. H. (2018). Impact of fiscal decentralization on green total factor productivity. Int. J. Prod. Econ. 205, 359–367. doi:10.1016/j.ijpe.2018.09.019
Sun, H., Chen, T., and Wang, C. N. (2024). Spatial impact of digital finance on carbon productivity. Geosci. Front. 15, 101674, doi:10.1016/j.gsf.2023.101674
Sun, Y., Tang, Y., and Li, G. (2023). Economic growth targets and green total factor productivity: evidence from China. J. Environ. Plan. Manag. 66 (10), 2090–2106. doi:10.1080/09640568.2022.2061335
Takayabu, H., Kagawa, S., Fujii, H., Managi, S., and Eguchi, S. (2019). Impacts of productive efficiency improvement in the global metal industry on CO2 emissions. J. Environ. Manage. 248, 109261. doi:10.1016/j.jenvman.2019.109261
Tang, J., and Qin, F. (2022). Analyzing the impact of local government competition on green total factor productivity from the factor market distortion perspective: based on the three-stage DEA model. Environ. Dev. Sustain. 24, 14298–14326. doi:10.1007/s10668-021-02032-5
Tone, K. (2003). Dealing with undesirable outputs in DEA: a slack-based measure (SBM) approach. GRIPS Res. Rep. Ser. I.
Wan, L., and Zhang, N. (2023). Earning reduction caused by air pollution: evidence from China. China Econ. Rev. 79, 101984. doi:10.1016/j.chieco.2023.101984
Wang, M., Wu, Y., Zhang, X., and Lei, L. (2024). How does industrial agglomeration affect internal structures of green economy in China? An analysis based on a three-hierarchy meta-frontier DEA and systematic GMM approach. Technol. Forecast. Soc. Change 206, 123560. doi:10.1016/j.techfore.2024.123560
Wang, M., Xu, M., and Ma, S. (2021). The effect of the spatial heterogeneity of human capital structure on regional green total factor productivity. Struct. Change Econ. Dyn. 59, 427–441. doi:10.1016/j.strueco.2021.09.018
Wang, X., Sun, C., Wang, S., Zhang, Z., and Zou, W. (2018). Going green or going away? A spatial empirical examination of the relationship between environmental regulations, biased technological progress, and green total factor productivity. Int. J. Environ. Res. Public Health 15 (9), 1917. doi:10.3390/ijerph15091917
Wang, Y., and Tao, W. (2021). Influence and effect of China’s pilot low-carbon city initiative on urban green total factor productivity growth. China Popul. Resour. Environ. 31, 78–89.
Wu, H., Ren, S., Yan, G., and Hao, Y. (2020). Does China's outward direct investment improve green total factor productivity in the “Belt and Road” countries? Evidence from dynamic threshold panel model analysis. J. Environ. Manage. 275, 111295. doi:10.1016/j.jenvman.2020.111295
Xia, F., and Xu, J. (2020). Green total factor productivity: a re-examination of quality of growth for provinces in China. China Econ. Rev. 62, 101454. doi:10.1016/j.chieco.2020.101454
Xiao, H., and You, J. (2021). The heterogeneous impacts of human capital on green total factor productivity: regional diversity perspective. Front. Environ. Sci. 9, 713562. doi:10.3389/fenvs.2021.713562
Xu, G., Qiu, Y., and Qi, J. (2024). Artificial intelligence and labor demand: an empirical analysis of Chinese small and micro enterprises. Heliyon 10 (13), e33893. doi:10.1016/j.heliyon.2024.e33893
Yan, Z., Yu, Y., Du, K., and Zhang, N. (2024). How does environmental regulation promote green technology innovation? Evidence from China's total emission control policy. Ecol. Econ. 219, 108137. doi:10.1016/j.ecolecon.2024.108137
Yu, D., Li, X., Yu, J., and Li, H. (2021). The impact of the spatial agglomeration of foreign direct investment on green total factor productivity of Chinese cities. J. Environ. Manage. 290, 112666. doi:10.1016/j.jenvman.2021.112666
Yuan, C., Shang, M., Han, Z., and Wang, J. (2024). Research on the impact of the national ecological demonstration zone on green total factor productivity: evidence from China. J. Environ. Manage. 356, 120421. doi:10.1016/j.jenvman.2024.120421
Zhang, J., Wu, G., and Zhang, J. P. (2004). The estimation of China's provincial capital stock: 1952-2000. Econ. Res. J. 10, 35–44.
Zhang, L., Sun, H., Pu, T., and Chen, Z. (2024). Do green finance and hi-tech innovation facilitate sustainable development? Evidence from the Yangtze River Economic Belt. Econ. Anal. Policy. 81, 1430–1442. doi:10.1016/j.eap.2024.02.005
Zhao, X., Nakonieczny, J., Jabeen, F., Shahzad, U., and Jia, W. (2022). Does green innovation induce green total factor productivity? Novel findings from Chinese city-level data. Technol. Forecast. Soc. Change 185, 122021. doi:10.1016/j.techfore.2022.122021
Zhao, X., Zeng, B., Zhao, X., Zeng, S., and Jiang, S. (2024). Impact of green finance on green energy efficiency: a pathway to sustainable development in China. J. Clean. Prod. 450, 141943. doi:10.1016/j.jclepro.2024.141943
Zheng, H., Wu, S., Zhang, Y., and He, Y. (2023). Environmental regulation effect on green total factor productivity in the Yangtze River Economic Belt. J. Environ. Manage. 325, 116465. doi:10.1016/j.jenvman.2022.116465
Zheng, Y., Zhou, Z., and Zhou, F. (2024). The non-linear effect of dual environmental regulation on urban green total factor productivity: evidence from 284 cities in China[J]. Sustainability 16 (12), 4894.
Zhou, L., Fan, J., Hu, M., and Yu, X. (2024). Clean air policy and green total factor productivity: evidence from Chinese prefecture-level cities. Energy Econ. 133, 107512. doi:10.1016/j.eneco.2024.107512
Zhou, P., Ang, B. W., and Han, J. Y. (2010). Total factor carbon emission performance: a Malmquist index analysis. Energy Econ. 32, 194–201. doi:10.1016/j.eneco.2009.10.003
Zhou, P., Ang, B. W., and Poh, K. L. (2008). A survey of data envelopment analysis in energy and environmental studies. Eur. J. Oper. Res. 189 (1), 1–18. doi:10.1016/j.ejor.2007.04.042
Keywords: green total factor productivity, three-stage SBM, masking effect, tobit model, dynamic evolution
Citation: Chen F, Zhu L and Li Y (2024) Dynamic evolution and influencing factors of green total factor productivity in the Yangtze River Economic Belt: a study based on the three-stage SBM-ML index model. Front. Environ. Sci. 12:1508785. doi: 10.3389/fenvs.2024.1508785
Received: 09 October 2024; Accepted: 03 December 2024;
Published: 18 December 2024.
Edited by:
Huaping Sun, Jiangsu University, ChinaReviewed by:
Zhonghua Cheng, Nanjing University of Information Science and Technology, ChinaCopyright © 2024 Chen, Zhu and Li. This is an open-access article distributed under the terms of the Creative Commons Attribution License (CC BY). The use, distribution or reproduction in other forums is permitted, provided the original author(s) and the copyright owner(s) are credited and that the original publication in this journal is cited, in accordance with accepted academic practice. No use, distribution or reproduction is permitted which does not comply with these terms.
*Correspondence: Yi Li, MTIwMTMwMzRAaG5pc3QuZWR1LmNu
Disclaimer: All claims expressed in this article are solely those of the authors and do not necessarily represent those of their affiliated organizations, or those of the publisher, the editors and the reviewers. Any product that may be evaluated in this article or claim that may be made by its manufacturer is not guaranteed or endorsed by the publisher.
Research integrity at Frontiers
Learn more about the work of our research integrity team to safeguard the quality of each article we publish.