- 1School of Economics, Guangzhou City University of Technology, Guangzhou, China
- 2Research Base of Carbon Neutral Finance for Guangdong-Hong Kong-Macao, Guangzhou, China
- 3School of Economics, Jinan University, Guangzhou, China
Amidst global climate challenges, carbon emission trading has become the most important market-based environmental policy tool, attracting widespread attention for mitigating price volatility caused by extreme risks. This study applies the multivariate multi-quantile conditional autoregressive value-at-risk (MVMQ-CAVIaRX) model to measure extreme market risk and modifies the Diebold Yilmaz (DY) spillover index calculated using the time-varying parameter vector autoregressive model with exogenous variables (TVP-VARX) to examine the extreme risk structures and its time-varying characteristics of the European carbon emissions trading market. The relevant results are threefold. (1) Significant extreme risk spillover effects exist between the carbon market and the stock, commodity, exchange rate, and interest rate markets, influenced by economic risks and geopolitical risks. (2) In the average extreme risk structure of the carbon market, aside from itself, geopolitical risks contribute the most, followed by the stock and commodity markets, while the contributions of the exchange rate and interest rate are relatively small, with economic risks exerting a slow and steadily increasing influence on extreme risks in the carbon market over the forecast period. (3) The extreme risk structure of the carbon market exhibits significant time-varying characteristics, with contributions from related extreme market risks, geopolitical risks, and economic risks showing significant variations during important periods such as the COVID-19 pandemic and the Russia–Ukraine war. These findings have implications for carbon market policymakers to manage extreme risks.
1 Introduction
Over the past decade, the global carbon emissions trading market has significantly expanded in size, coverage, and market vitality, becoming a crucial environmental policy tool widely adopted by countries to control greenhouse gas emissions and address climate change. As of 2024, 36 carbon emissions trading systems (ETS) are operating worldwide, covering 9.9 billion tons of CO2 equivalent greenhouse gas emissions, accounting for over 18% of total global greenhouse gas emissions. The European Union’s ETS, the earliest and largest in terms of trading volume and value, has experienced a continuous rise in allowance prices since 2020, remaining above $70 from 2022 to 2023 and exhibiting significant price fluctuations amid global economic and political instability1. The scarcity, liquidity, and storability of carbon emission rights make them a special environmental asset with both commodity and financial attributes, and they are an effective channel for investment and risk diversification (Zhang and Wei, 2010; Subramaniam et al., 2015).
The participants in the carbon and related markets such as the stock market and commodity market do not conform to the rational investor hypothesis of classical financial theory, but rather exhibit irrational behaviors under asymmetric information conditions, such as herding and convergence. These irrational behaviors can easily emerge in one market and then influence other markets through capital flow and expectations, especially in the context of market integration, where this transmission effect is even closer (Zhang et al., 2010). As a result, there is a varying degree of risk transmission or spillover effect between markets. The carbon market and related markets commonly have heterogeneous investors, and information will not be transmitted among investors homogeneously and instantaneously, making the diffusion of information a non-stationary and non-uniform process, exhibiting time-varying characteristics of information or risk spillover (Boisot, 2013). At the same time, the carbon market, along with the stock market and commodity market, constitutes a complex system with time-varying risk spillovers. The impact of macroeconomic fundamentals and major crisis events, particularly geopolitical risks, cannot be ignored. Macroeconomic fundamentals can affect the complex system by influencing trade, finance, and industry, whereas geopolitical risks influence inter-market risk spillover and its time-varying structure within the system through investor expectations, investor sentiment, and adjustments in investment strategies (Zeng et al., 2017). Therefore, identifying the effects of political and economic risk factors, as well as related markets, on carbon market risks and studying the risk structure of the carbon market and its time-varying characteristics are of significant theoretical value and practical significance for maintaining the price stability of carbon assets and pretending and resolving risks in a timely manner. Previous studies have provided empirical evidence for the contemporaneous interdependence of markets and extensively discussed the intensity and direction of spillover effects due to lagged influences. However, the research on the risk spillover effects between carbon and other related markets still has certain limitations. First, existing research lacks further exploration of the extreme risk time-varying structure of carbon markets within the risk spillover framework. Second, in the construction of spillover networks, a strict distinction between bidirectional spillovers among endogenous variables within the system and unidirectional transmission from exogenous variables is lacking, resulting in a model setup that does not align with reality. Finally, the measurement of extreme risks still mainly relies on higher moments or quantiles of the single variable, without incorporating the dependent structure between different markets into the model.
This study primarily focuses on the structure of extreme risk and its time-varying problems in the carbon market, is further research of the risk spillover problem in the carbon market. First, an MVMQ-CAViaRX model with exogenous variables is constructed to measure extreme risks in the carbon and related markets, and the dependence on extreme risks between markets is tested. Second, based on the TVP-VARX-DY model, and assuming that the exogenous variables follow an ARMA (1, 1) – GARCH (1, 1) process, the contributions of each market and exogenous shocks to extreme risks in the carbon market are separated, and both the average and time-varying structures of extreme risks in the carbon market are examined.
The marginal contributions of this study are as follows. First, from a theoretical perspective, this study is the first to examine the extreme risk structure and time-varying problems in the carbon market from the risk spillover perspective, measuring the contributions of various risk factors, especially exogenous political and economic risks. Second, from a methodological perspective, this study is the first attempt to derive a modified DY spillover index that considers the effects of exogenous variables within the TVP-VARX model framework based on the specific data-generating process (DGP) followed by exogenous variables, enriching the literature on research methodologies.
The remainder of this paper is organized as follows. Section 2 provides the literature review and research framework. Section 3 introduces the data sources and research methods. Section 4 presents the empirical estimations, including the results of extreme risk measurement, dependence test, extreme risk structure measurement, robustness test, and discussions Section 5 provides the conclusions and policy implications.
2 Literature review and research framework
2.1 Literature review
Research on risk spillover in the carbon and related markets is extensive, concentrated on: (1) returns and volatility (lower-order moments) spillover; (2) higher-order moments spillover and tail risk dependence between markets, specifically extreme risk spillover.
2.1.1 Returns and volatility spillover effects between carbon and related markets
With the development of financial markets, traders’ investment and speculative behaviors have become primary drivers in forming complex spillover and risk transmission networks across the stock, energy, and carbon markets. Tao et al. (2024) integrated the carbon, stock, and energy markets into a unified framework, utilizing dynamic time-varying autoregressive models to investigate the spillover effects of returns and volatility in the New Zealand carbon, stock, and energy markets. Their findings indicate that the volatility spillover between the stock and energy markets is predominantly influenced by the ETS, with long-term effects constituting the largest portion of cross-market spillover. Liu and Yan (2024) analyzed the spillover effects and heterogeneity of total, short-term, and long-term volatility in the EU carbon, energy, and stock markets using the GJR-GARCH(1,1)-MIDAS model, and assessed the impact of policy economic uncertainty on these spillover effects. Ren et al. (2023) examined the third phase of the EU ETS, employing causality-in-quantiles test and quantile impulse response analysis to explore the spillover effects and information transmission between the carbon, crude oil, and stock markets. They discovered a unidirectional spillover effect from the crude oil market to the carbon market, with variability under bull and bear market conditions.
The industrial chain creates a special transmission channel linking the commodity market and the carbon market. Energy, chemical products, etc., are at the front of the industrial chain, whereas carbon emissions are at the end. Through this indirect mechanism of industrial chain transmission, risk in the commodity market can affect the supply and demand of carbon emission rights for the carbon market’s reduction entities, thereby transferring price risk to the carbon market (Lin and Li, 2023). Chen et al. (2022a) employed a quantile connectedness approach to analyze the dynamic relationships between energy, metal commodity markets and the carbon market. Their findings indicate that the dynamic connectivity among these markets differs significantly during extreme upward and downward market conditions, i.e., displaying asymmetry. Tian et al. (2022) focused on emerging economies and investigated the correlation mechanism of the “carbon-commodity-finance” system using vector autoregression and spillover index models. They identified that the relationships between the carbon, commodity markets (including silver, copper, and gold commodities), and financial markets are heterogeneous and are influenced by the foreign exchange market.
Moreover, interest rates and exchange rates can influence the pricing and settlement of assets such as stocks, carbon, and commodities. Commodity prices can further impact monetary policy through inflation. The inflow and outflow of hot money create shocks to exchange rates and interest rates, forming risk linkages (Chai and Zhou, 2019). Huang et al. (2024) employed time-varying parameter vector autoregression (TVP-VAR) to examine the dynamic nonlinear risk spillover effects between exchange rates and the Chinese carbon market. They found that carbon prices and the EUR/CNY exchange rate primarily act as risk contributors, with significant correlations observed between different exchange rates. Wang (2020) analyzed the frequency dynamics of volatility spillover effects between crude oil and international stock markets using the implied volatility index, finding that low interest rates are the main driver of volatility spillovers.
2.1.2 Extreme risk spillover effects between carbon and related markets
Considering the enormous destruction caused by extreme risks in financial markets, existing research has made great progress in the field of high-order moment risk spillovers and the measurement of tail risk dependencies between markets. First, in terms of high-order moment risk spillovers, relevant literature has confirmed the spillover effects of skewness and kurtosis risk between the carbon and related markets from different perspectives. Liu et al. (2023) examined the high-order moment risk spillover effect between China’s carbon market and industry stocks based on the GARCH-S model, time-varying spillover index model, and quantile regression, reporting that these spillover effects are bidirectional and analyzing their influencing factors. Dai et al. (2021) studied the multi-scale interaction of higher-order moments spillovers (skewness and kurtosis) between the carbon and the energy market. They found that the bidirectional higher-order moments spillover effects are weaker at the short-run timescales, while the long-run effect is greatly enhanced. Second, in terms of tail risk dependence, some studies have revealed tail dependence between different markets through methods such as the Copula framework and quantile regression. Su et al. (2023) studied the spillover effects between fossil fuels, renewable energy, and the carbon markets based on the quantile VAR network, finding that the impact of the extreme market conditions on the connectedness network proves to be more pronounced compared to the standard conditions. Zhao and Xu (2023), combining extreme value theory, copula functions, and conditional value at risk (CoVaR), studied the tail risk spillover effects of the Chinese carbon and stock markets, showing a significant positive correlation of extreme risk between markets.
Extreme risks can be transmitted between markets, forming a network of extreme risk connections, and are also more sensitive to exogenous shocks such as geopolitical events. Cao and Xie (2024) developed a quantile vector autoregression with the extended joint connectedness method to study the spillover effects of extreme risks between the carbon, fossil energy and clean energy markets. Their findings indicate that extreme events strengthen market connections. Naeem and Arfaoui (2023) employed the conditional autoregressive value at risk (CAViaR) and TVP-VAR models to examine the dependence and impact of exogenous shocks on extreme downside risks in energy and carbon markets, revealing significant effects on risk contagion during periods of external turmoil, such as the global economic crisis, shale oil revolution, COVID-19 outbreak, and Russia-Ukraine war. Chen et al. (2022b) investigated the correlations between the Shenzhen carbon, energy, commodity, and financial markets in China from the perspective of tail risk transmission based on quantile spillovers, discovering that the COVID-19 significantly increased the tail risk transmissions.
2.2 Research framework
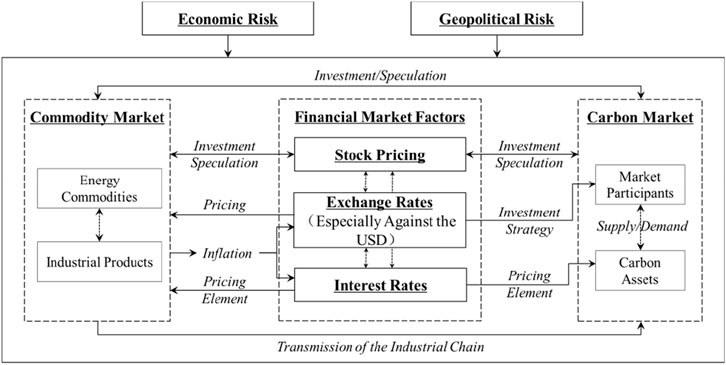
Based on the comprehensive literature review, risk spillover behaviors are present between the carbon market and financial market factors (e.g., stock prices, exchange rates, and interest rates, hereinafter referred to as the stock market, exchange rate market, and interest rate market), as well as the commodity market, which also includes extreme risk spillover, is time-variant and is influenced by exogenous shocks from economic and geopolitical risks. Therefore, sources of extreme risk in the carbon market can be divided into three categories: endogenous risk sources, risk sources from spillover or transmission from different markets, and exogenous risk sources. Endogenous risk sources mainly originate from the carbon market itself, such as the supply and demand of carbon assets, market liquidity, carbon trading policies, and emission-reduction constraints. The risk source spillovers from different markets include extreme risk spillover effects from the stock, commodity, exchange rate, and interest rate markets on the carbon market. The exogenous risk sources are primarily economic and geopolitical risks. The research framework is shown in Figure 1.
3 Data sources and research methods
3.1 Data sources
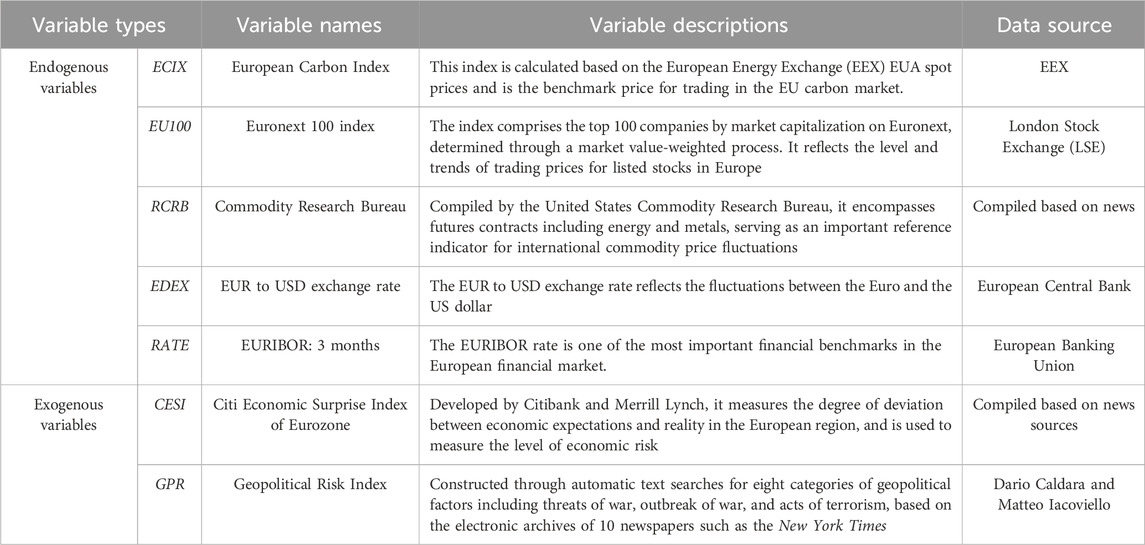
Based on the research design, the data selected for this study is mainly divided into two categories: endogenous and exogenous variables. The study period spans from 2 January 2019, to 16 October 2023, with a sample size of 1,224. All data were obtained from the Wind database, and Table 1 provides descriptions of the variables.
The variables ECIX, EU100, RCRB, and EDEX have been transformed into returns through a log-differential and multiplied by 100 (i.e.,
The descriptive statistics of the variables (Table 2) indicate that all variables exhibit significant “leptokurtic and heavy-tailed” characteristics and the lagged sixth-order ARCH-LM tests are significant at the 1% level, suggesting that all variables have significant conditional heteroscedasticity. All series except the
3.2 Research methods
3.2.1 Extreme risk measurement and dependence test in the carbon market
Among the various extreme risk measurement models, the MVMQ-CAViaR model proposed by White et al. (2015) has many advantages. First, it is an extension of CAViaR model to multivariate and multiple-quantile scenarios and can measure extreme risks under the condition of dependence among multiple markets. Second, this model is a semiparametric technique that imposes minimal distributional assumptions on the DGP and has excellent robustness (Meng et al., 2023). This study considers the bidirectional spillover effects between the carbon, stock, commodity, foreign exchange, and interest rate markets, as well as the effects of exogenous factors, such as geopolitical and economic risks, on the system. Based on the MVMQ-CAViaR model, we propose the MVMQ-CAViaRX model, which retains the original model’s basic structure, where the quantile of each endogenous variable is determined by its lagged endogenous variables and lagged quantiles. By introducing exogenous variables into each equation, we examine the effects of exogenous variables on extreme risks in each market. The selected MVMQ-CAViaRX2 model is as follows:
where
In Equation 2, the main diagonal and off-diagonal elements of coefficient matrix
Based on the estimated results of the MVMQ-CAViaRX model, further joint significance tests need to be conducted on the tail risk dependence between variables. Following the construction approach of the asymptotic distribution of the MVMQ-CAViaRX model’s QMLE and Wald statistic, we construct Equation 3:
where
3.2.2 Time-varying structure measurement of extreme risks in the carbon market
We take the extreme risk measured by the MVMQ-CAViaRX as the endogenous variable, with the exogenous variables remaining unchanged; the lag order is set to be consistent with the MVMQ-CAViaRX model, which is lagged by one order. Referring to Primiceri (2005), Antonakakis et al. (2020), and Liu et al. (2023), the TVP-VARX model adopts non-recursive identification as follows:
In Equation 4,
Considering the effects of exogenous variables on the system and assuming that the exogenous variables follow an ARMA (1, 1) - GARCH (1, 1) process, we refer to the generalized error decomposition method of Koop, Pesaran, and Potter (1996) and Pesaran and Shin (1998) and modify the generalized error decomposition method for exogenous variables. After the modification, the contribution (i.e., the cross-variance share) of endogenous variable j to the forecast mean square error (MSE) of variable i is as follows:
The contribution of the exogenous variable k to the forecast MSE of the endogenous variable i is:
where (10),
Following the methodology proposed by Diebold and Yilmaz (2012) to construct a spillover index model, the cross-variance shares for each endogenous variable need to be normalized to ensure that all variables explain 100% of the forecasted MSE of these endogenous variables. Thus, the pairwise directional spillover effect of endogenous variable j on endogenous variable i is as follows:
Similarly, the pairwise directional spillover effect of exogenous variable k on endogenous variable i is as follows:
Considering the specific meaning of the spillover index, if i represents the extreme risk of the carbon market, then
4 Empirical estimations
4.1 Extreme risk measurements and dependence testing
4.1.1 Estimation results of the MVMQ-CAVIaRX model
The MVMQ-CAViaRX model is constructed using CESI and GPR as exogenous shocks and
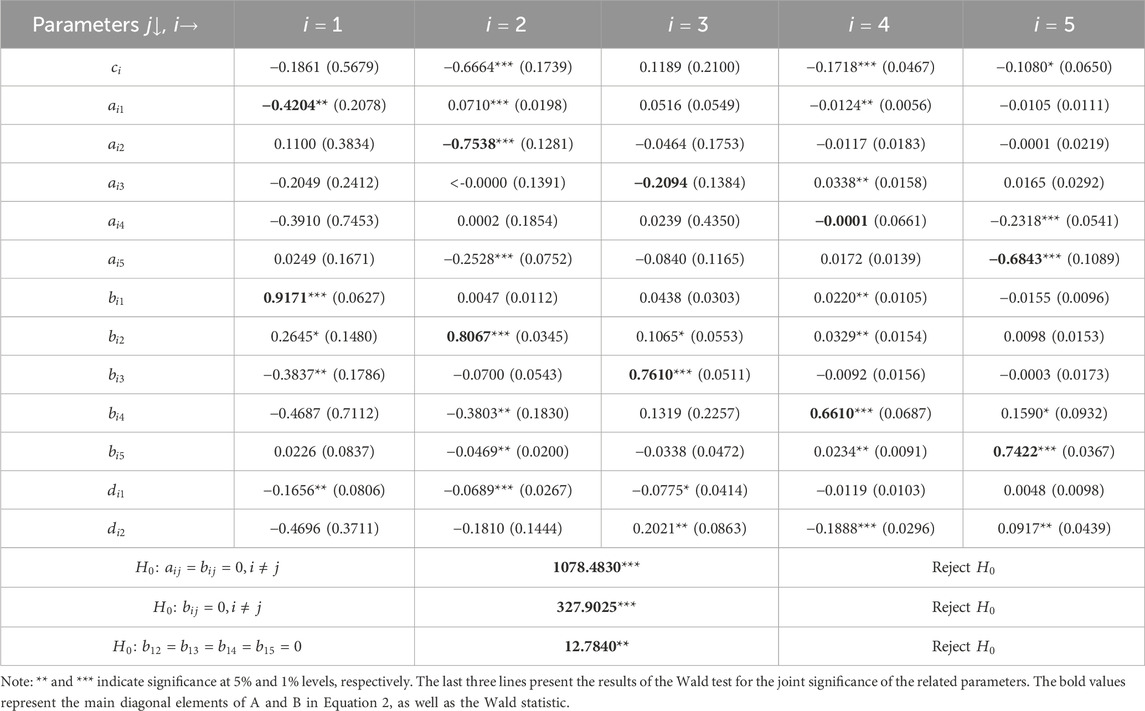
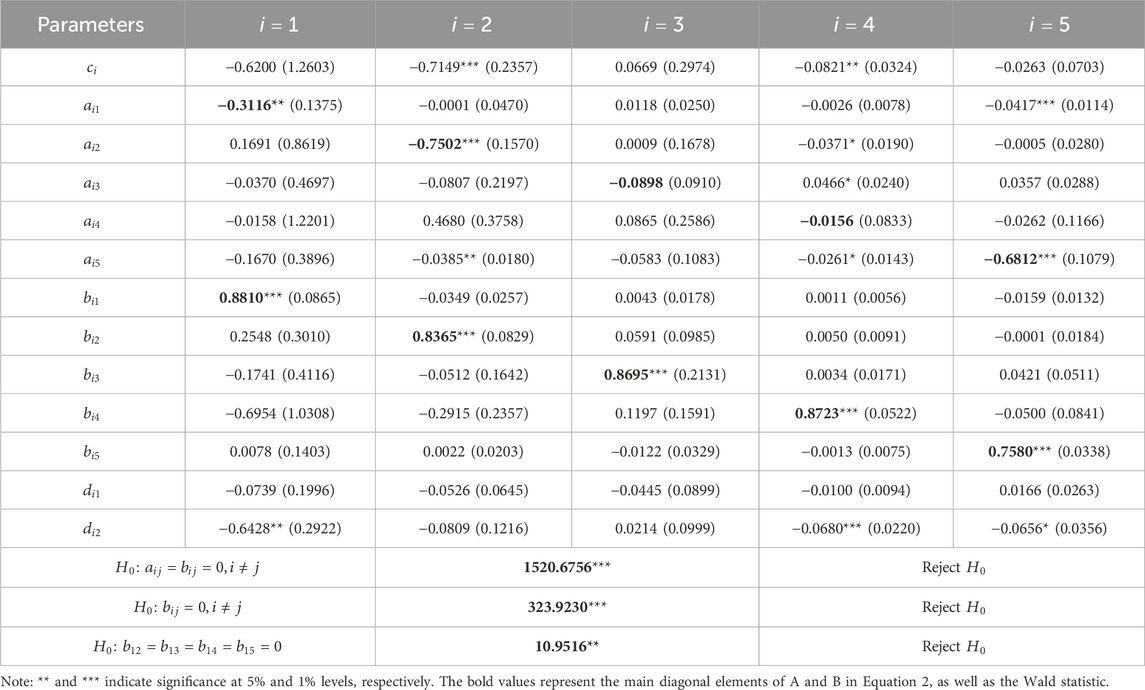
Table 3 shows a complex correlation between the extreme risks of the carbon market and the stock, commodity, exchange rate, and interest rate markets, and is subject to exogenous shocks from economic surprises and geopolitical risks. When
4.1.2 Extreme risks in the carbon market
The measurement results for the 1% quantile of the carbon market
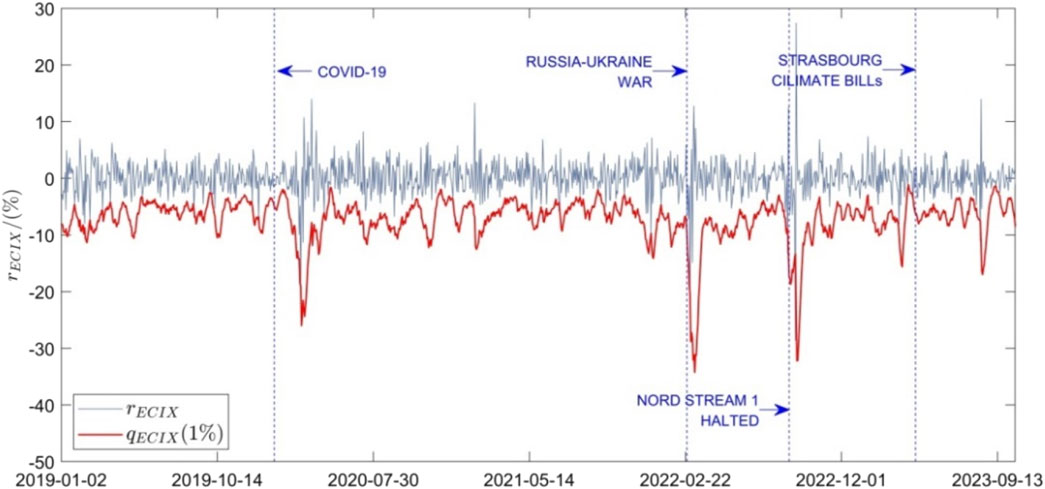
Figure 2. Risk measurement results of European carbon index returns. (Note: the COVID-19 time point is 30 January 2020, and WHO declared it a global emergency; the Russia–Ukraine war time point is 24 February 2022, when Russia launched a “special military action” against Ukraine; Nord Stream 1 halted time point is the end of August 2022, when Russia suspended “Nord Stream 1” service; the Strasbourg Climate Bill time point is 18 April 2023, when the EU passed the climate bills).
4.2 Analysis and results of the time-varying structure measurement of extreme risks in the carbon market
4.2.1 Estimation results of TVP-VARX parameters
In this study, when using MCMC to estimate the parameters of the TVP-VARX model, we refer to Nakajima et al. (2011) method, and discard the initial 1,000 samples, while retaining the subsequent 10,000 relatively effective samples. The parameter estimation results are shown in Supplementary Table A1 and Supplementary Figures A1, A2 in Supplementary Appendix SII.
The estimated results of
4.2.2 Average extreme risk structure of the carbon market
Based on the estimation results of the TVP-VARX model, the overall effects of other markets and exogenous shocks on the extreme risk in the carbon market are examined using Equations 7 and 8. Figure 3 reports the results of the calculations of the average contribution of extreme risks in various markets and exogenous shocks to the carbon market’s extreme risk based on different forecasting periods (
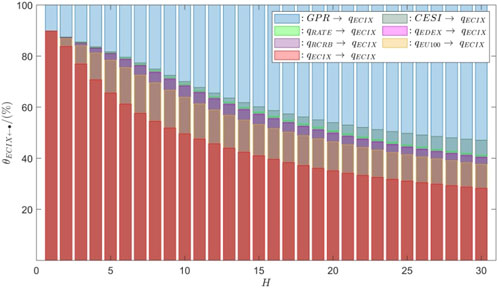
Figure 3. Average contribution ratios of various markets and external shocks to extreme risk in the carbon market over different forecast periods.
As Figure 3 shows, as the prediction period increases, the structure of extreme risk in the carbon market exhibits significant changes. For the extreme risks in the carbon market, the proportion of extreme risk contributed by the market itself declines from approximately 89.80% when H = 1–28.25% when H = 30, with an average of approximately 45.90%. The risk incentives within the market are very important sources of risk, including the market supply–demand level, the liquidity of carbon assets, emission reduction policies, and climate change. Geopolitical risk is the factor with the most significant influence on extreme risks to the carbon market, apart from the carbon market itself. Its average contribution rate increases from 10.15% when H = 1 to approximately 52.94% when H = 30 and surpasses the contribution of the carbon market itself at H = 15. First, when geopolitical risks are heightened, panic can ensue among trading participants in the carbon market, which occurs not only in the production processes of high-emission companies but also within the trading processes of market participants, subsequently leading to intensified extreme risk. Second, elevated geopolitical risks can exacerbate fluctuations in the prices of commodities, such as energy and industrial products, and have a profound impact on exchange rates, thereby increasing extreme risks facing the carbon market. The significant contribution level of high geopolitical risks also supports the typical characteristics of extreme risks with high sensitivity to sudden events and external shocks, such as geopolitics. The spillover effect of extreme risks in the stock market on extreme risks in the carbon market ranges from 3.11% to 15.07%, reaching a maximum at H = 8 and then gradually decreasing. The high contribution of extreme risk in the stock market to extreme risk in the carbon market is mainly due to the stock market’s active trading, strong liquidity, diversified market participation, and higher efficiency in information transmission. Consequently, the spillover of extreme risks in the stock market is faster and more intense. The average impact of extreme risks in the commodity market on the carbon market is similar to that of the financial market, but it reaches its maximum value at H = 11, at approximately 4.35%. The effect during each forecast period is smaller, with an average proportion of approximately 3.09%, which is significantly less than the 11.08% contribution level of the stock market. Regarding the main reasons for these differences, first, the financial attributes of the commodity market are weaker than those of the stock market; hence, the direct transmission mechanisms of investment and speculative behavior are somewhat restricted. Second, the commodity market’s indirect mechanisms of influencing the carbon market through inflation and industrial chain transmission require a longer time. The average contribution of economic risk to the extreme risk of the carbon market steadily increased from 0.49% (H = 1) to 5.97% (H = 30), indicating that adverse macroeconomic changes are primarily transmitted to the carbon market through an industrial chain transmission mechanism. The effect of economic risk on the extreme risk in the carbon market requires considerable time to accumulate. The contribution of extreme risks in the foreign exchange and interest rate markets to extreme risks in the carbon market is relatively low, averaging 0.22% and 0.51%, respectively. The main participants in the European carbon market are high-emission companies or other institutions from European countries conducting transactions and settlements in Euros, while the interest rate market is mainly affected by macroeconomic conditions and the monetary policy of the European Union. Thus, the contribution of the foreign exchange and interest rate markets to the extreme risk of the carbon market is limited. However, it cannot be ignored that the foreign exchange and interest rate markets are both affected by economic and geopolitical risks, which will cause them to form a complex network of extreme risk spillovers along with other markets.
To further validate the results of the above analysis, Table 4 reports the average extreme risk spillover intensity and direction among various markets over a forecasting period of 10 days (i.e., H = 10). It also calculates the average contribution level of two exogenous variables,

Table 4. Average spillover index of economic risk, geopolitical risk, and extreme risk among markets (
Table 4 shows that geopolitical risk contributes significantly to extreme risk in all markets, further validating the high sensitivity characteristic of extreme risk to sudden exogenous shocks like geopolitics. Even more remarkably, over a forecasting period of 10 days, the effect of geopolitical risk on the extreme risk of the foreign exchange market averages 71.04%. When geopolitical risk factors such as wars, political turmoil, and tensions in international relations occur, safe-haven capital flows, international trade, and international energy prices will be significantly affected. Under a global exchange rate and transaction settlement system dominated by the US dollar, the Euro to US dollar exchange rate will inevitably suffer a substantial impact. The stock market is the largest net spillover source of extreme risk, while the commodities market is the largest net spillover recipient. This finding is consistent with most research and aligns with the theoretical analysis discussed earlier. First, on the direct path, when the stock market experiences significant fluctuations, investors may shift their capital from the stock market to the commodities market in search of more stable returns. Second, on the indirect path, the stock market can affect global commodity prices through market liquidity and the US dollar exchange rate channels, especially for commodities priced in US dollars. Economic risk has a relatively low impact on extreme risks across all markets, with the two largest contributions being 6.02% and 1.10% for the commodities and carbon markets, respectively. This conclusion is consistent with the pathways of economic risk impact. Economic risk generally affects the pricing system through trade, finance, and industry pathways, thus having limited influence on extreme risks in markets over a shorter forecasting period (H = 10). Additionally, the average spillover effect of economic risk on the extreme risk of the carbon market is approximately 1.10%, which does not exclude the possibility that during certain specific stages, such as the stage of the COVID-19 epidemic, when economic expectations and reality diverge significantly, the impact on extreme risks in the carbon market could be exacerbated. Although the contributions of the foreign exchange and interest rate markets to extreme risk in the carbon market are very small, based on the results in Table 4, the foreign exchange market plays a very important role as a net recipient of extreme risk under exogenous shocks, while the interest rate market contributes significantly by both bring a recipient and proving a spillover of market extreme risk. This indicates that the foreign exchange and interest rate markets constitute very important indirect pathways for the transmission of extreme risk between markets under the influence of exogenous risks.
4.2.3 Time-varying extreme risk structure in the carbon market
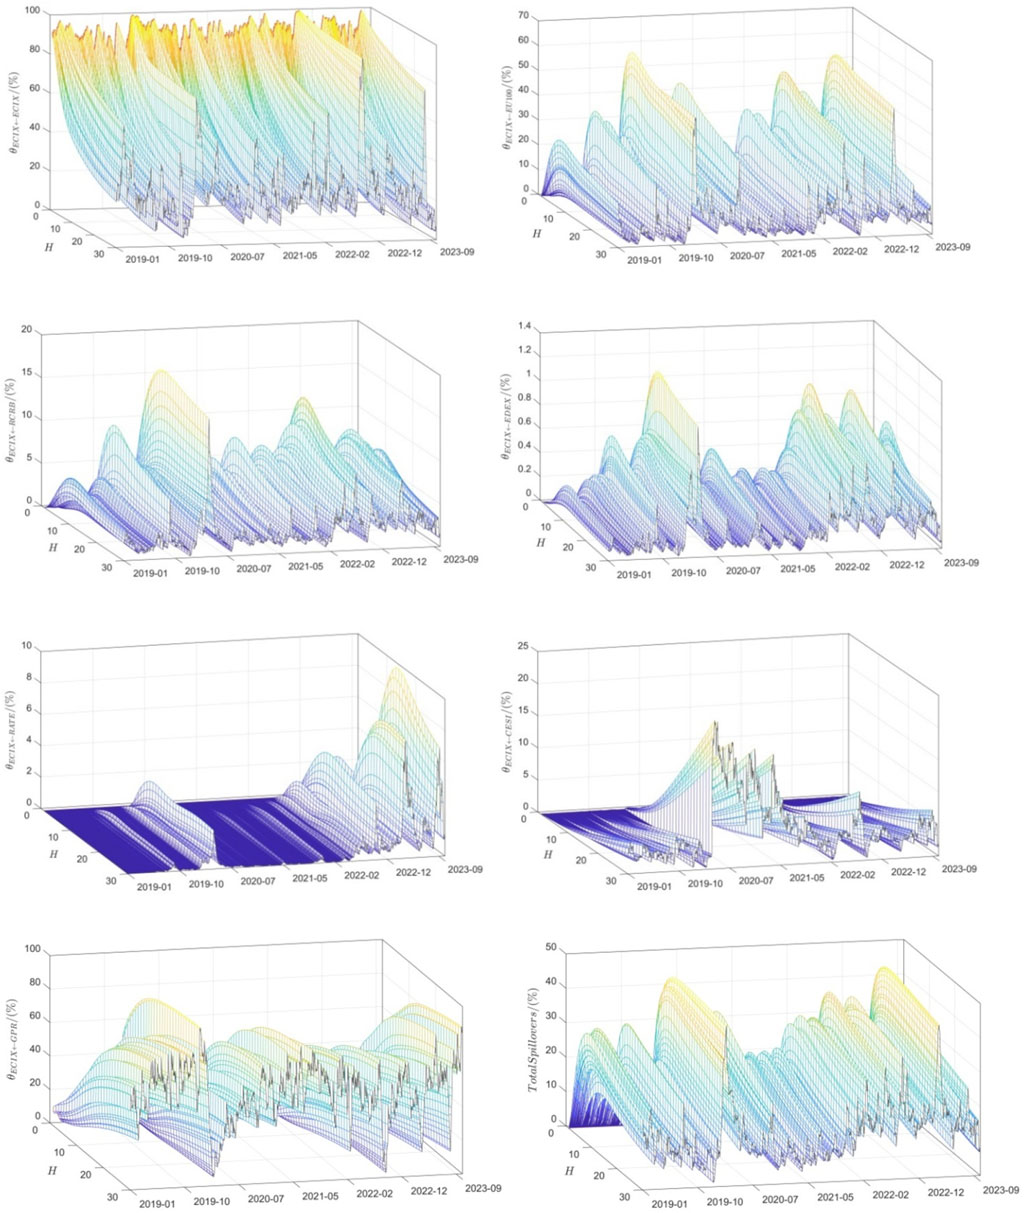
Unlike the average extreme risk structure of the carbon market in each forecast period, referred to as variable H in Section 4.2.2, this section primarily presents an analysis of the main features of the time-varying extreme risk structure in the carbon market from January 2019 to September 2023. Figure 4 presents the three-dimensional forecast MSE decomposition results at different time points under different forecast periods (i.e., H and t both change), indicating the contribution level of exogenous risk shocks and extreme risks from various markets to the extreme risk of the carbon market. To facilitate the analysis of the time-varying structure, this section also fixes the forecast period at 10 days and measures the contribution results of extreme risks to the carbon market at different time points, as shown in Figure 5.
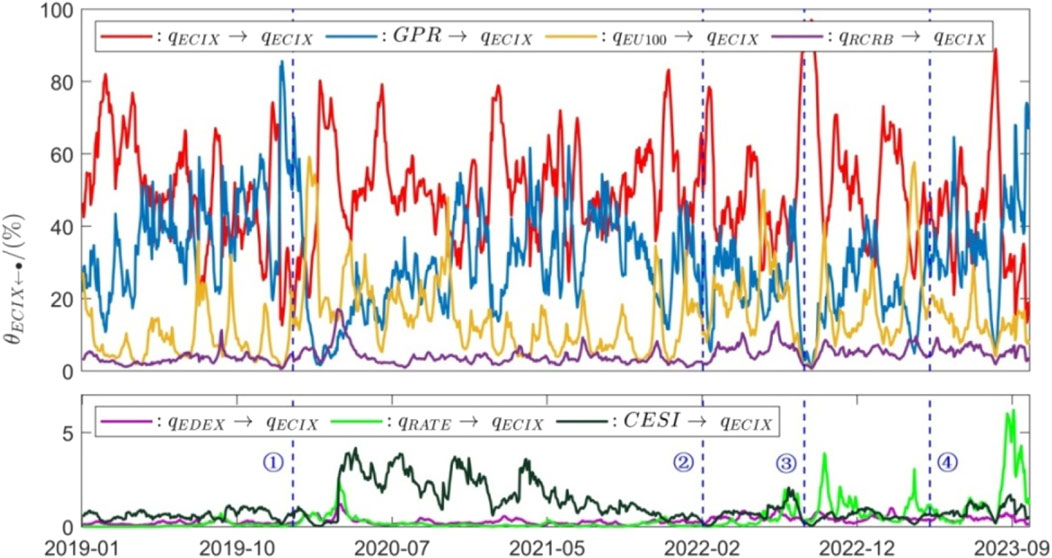
Figure 5. Time-varying structure of extreme risks in the carbon emissions trading market (
Figures 4, 5 show that the carbon market exhibits significant time variability in its extreme risk structure under the influence of extreme risks from other markets and exogenous shocks. Specifically, the contribution of internal factors within the carbon market to its own extreme risk ranges from 12.65% to 96.97% over a 10-day forecast period, showing considerable fluctuations, and is the most significant contribution most of the time. This indicates that in the management of extreme risks, attention should be paid to preventing tail risks caused by internal market factors. Consistent with previous results, geopolitical risk is the external factor with the greatest impact on the carbon market’s extreme risk, apart from the market itself, contributing between 0.90% and 85.61% over a 10-day forecast period. Notably, geopolitical risk contributed significantly to the carbon market’s extreme risk during the period before and after the COVID-19 outbreak, as well as during the tense situation before the Russia–Ukraine war. The impact of extreme risks in the stock market on the extreme risk of the carbon market shows certain regularities. For example, during the periods before and after the COVID-19 outbreak, Russia–Ukraine war, and halting of Nord Stream 1, a higher extreme risk spillover effect was observed. This further indicates that, when hit by exogenous shocks, stock markets are more likely to act as net spillers of extreme risk, which adversely affects the carbon market. The economy was significantly affected during the COVID-19 prevention and control period after the outbreak, causing a severe deviation between actual economic development and expectations. Consequently, the contribution of economic shocks to the carbon market’s extreme risk significantly increased and persisted. Similarly, after the COVID-19 outbreak, the contributions of the commodity, exchange, and interest rate markets to the carbon market’s extreme risk increased; however, unlike economic risk, the duration was relatively short. During the Russia–Ukraine war and when Nord Stream 1 was halted, the contributions of extreme risks from the commodity and exchange rate markets to the extreme risk of the carbon market intensified significantly, mainly because of the energy tension and regional instability caused by external factors, which had a significant impact on exchange rates. The contribution of extreme risks from the interest rate market to the carbon market’s extreme risk also noticeably increased during this period. Combined with policy changes in European interest rates, in July 2022, Europe ended its eight-year “negative interest rate” era, and the European Central Bank’s interest rate increases were far beyond expectations, implying higher debt pressure and financing costs for high-emission companies and concerns about a new round of sovereign debt crises. Additionally, in April 2023, after the European Union passed the “Strasbourg Climate bills”,’ the contribution level of the carbon market to its own extreme risk showed a slight downward trend, proving to some extent that this reform has a positive effect on stabilizing the carbon market and mitigating endogenous extreme risks. However, owing to data limitations, the long-term effects require further validation.
4.3 Robustness tests
To examine the robustness of the MVMQ-CAViaRX and TVP-VARX-DY models, this study utilized EUA futures price data from 2 January 2019, to 16 October 2023, replacing the ECIX for robustness testing. Both are carbon allowance price series, with the difference being that the former is futures prices, the latter is the spot price index, and the other variables remain unchanged. The MVMQ-CAViaRX model estimation results with the replacement variable are shown in Table 5, the TVP-VARX model parameter results can be found in Supplementary Appendix SIII, and the forecast of the 10-day average extreme risk spillover results are presented in Table 6.

Table 6. Average spillover index of economic risk, geopolitical risk, and extreme risk among markets after replacing variables (
The results in Table 5 are fairly similar to those in Table 3, with the main estimation results maintaining consistent signs and significance levels and the Wald test results for extreme risk dependence remaining the same. This indicates that the conclusions of the MVMQ-CAVIaRX model regarding extreme risk measurement and tail dependence testing are robust.
In Supplementary Appendix SIII, the MCMC estimation results presented in Supplementary Table A2 and Supplementary Figures A3, A4 are generally consistent with those of the model before variable replacement, reflecting the good convergence and effectiveness of this parameter estimation method. Moreover, when measuring the intensity of the extreme risk spillovers between markets and from exogenous shocks, the main conclusions remain similar to those of the model before variable replacement. As Table 6 shows, with the forecast period fixed at 10 days, the average intensity and direction of extreme risk spillovers from other markets and exogenous shocks to the EUA futures market show no significant changes compared to Table 4, and the values are very close. Owing to space limitations, further results of the robustness checks are not presented here.
4.4 Discussions
Unlike many studies focusing on risk spillovers between carbon markets and directly related sectors such as fossil energy, renewable energy, and electricity markets (Ding et al., 2022; Su et al., 2023; Zhang et al., 2022), this paper constructs a comprehensive theoretical framework that considers the carbon market and related markets as an extreme risk transmission system with complex interrelationships, influenced by exogenous economic and geopolitical risks. A key issue in studying the extreme risk spillover effects between carbon and related markets is accurately measuring extreme risks. Current methods, such as CAViaR and CoVaR (Naeem and Arfaoui, 2023; Zhao and Xu, 2023; Siddique et al., 2023), typically focus on single-market risk measurement and do not incorporate the dependency structure of different markets or external shocks into the models. This paper employs the MVMQ-CAViaRX risk measurement model, which considers both risk contagion between markets and the impact of external shocks. The Wald test confirms the existence of extreme risk dependencies between the carbon and related markets, influenced by external economic and geopolitical risks. These conclusions align with the findings of Yang et al. (2023) and Tao et al. (2024).
For the study of time-varying extreme risk structures, this paper uses the TVP-VARX model, which is consistent with the theoretical framework and extreme risk measurement model settings. Additionally, using the DY spillover index model modified by external variables, the paper examines the contributions of related markets and external shocks to the extreme risk of the carbon market. Unlike most existing research methods in the literature review, the extreme risk transmission in the related market is bidirectional, whereas external shocks are unidirectional. Short-term extreme risks are primarily driven by endogenous risks within the carbon market, exogenous shocks from geopolitical factors, and risk contagion from the stock and commodity markets. In contrast, for long-term extreme risks, the external shocks of economic risks, as well as the risk contagion effects from interest rate and exchange rate markets, have been significantly enhanced. These conclusions confirm that extreme risks are highly sensitive to external shocks, such as geopolitical factors (Gong et al., 2024; Jiang et al., 2024), and provide empirical evidence for the risk transmission mechanisms within the theoretical framework to some extent.
However, this paper follows research conventions and considering the “dimensionality” issue of the TVP-VARX model, and still uses a single market variable to characterize the carbon and related markets, failing to incorporate more variables into the model to fully reflect the overall market situation. Additionally, the study does not include critical external shocks such as extreme weather and climate policy uncertainties (Dong et al., 2024; Chen and Sun, 2022), which we plan to explore in future research.
5 Conclusion and policy implications
5.1 Conclusion
Based on an analysis of the risk spillover mechanism between the carbon market and the stock, commodity, exchange rate, and interest rate markets under the effects of economic and geopolitical risks, this study first employs the MVMQ-CAViaRX model to measure the extreme risks of the carbon market and test the dependence of extreme risks in each market under exogenous risk shocks. Then, the TVP-VARX-DY model is constructed to study the average extreme risk structure of the carbon market in different prediction periods and the time-varying extreme risk structure at different time points. The main conclusions are as follows.
First, significant extreme risk dependency was observed among the carbon, stock, commodity, exchange rate, and interest rate markets, which are also influenced by exogenous shocks. The extreme risk measurement results of the carbon market considering the above effects show that the extreme risk in the carbon market was relatively high after periods such as the COVID-19 outbreak, Russia–Ukraine war, and halting of Nord Stream 1.
Second, the results of the average extreme risk structure measurement in the carbon market indicate that the carbon market’s extreme and geopolitical risks contribute the most to the market’s extreme risk, confirming that extreme risk is more sensitive to sudden external shocks. In terms of extreme risk spillovers between markets, the stock market contributes significantly to the carbon market’s extreme risk, followed by the commodity market. Although foreign exchange and interest rate markets make a limited contribution to the carbon market’s extreme risk, they play an important intermediary role in the entire risk spillover system. Economic risk has a relatively slow but continuously increasing effect on extreme risk in the carbon market.
Third, the analysis of the time-varying extreme risk structure of the carbon market shows that in most periods, geopolitical risks have a significant impact on the extreme risk of the carbon market. During the COVID-19 outbreak, Russia–Ukraine war and halting of Nord Stream 1, and economic risks and the extreme risks of the stock, commodity, and foreign exchange markets showed significant variability in their contributions to the extreme risk of the carbon market, along with evidence of heterogeneity. The contribution of the interest rate market to the extreme risk of the carbon market has notably increased following the end of the “negative interest rate” era in Europe.
5.2 Policy implications
Based on the above research conclusions, regulatory authorities of the carbon market should address extreme risks from a systemic perspective. First, extreme risks in the carbon market mainly stem from its own contributions. Carbon market policies should consistently aim to stabilize market supply and demand, enhance market liquidity, and implement effective emission reduction policies to mitigate extreme risks from endogenous sources. Secondly, in the external environment, especially when there are significant fluctuations in geopolitics, stock and commodity markets, the carbon market will be greatly impacted in the short term. It is crucial to prevent price volatility from leading to extreme losses for participants. In the long term, economic risks must be considered, and carbon market policies should incorporate economic cycle considerations, with timely adjustments to adapt the changes of economic conditions. Thirdly, interest rate and exchange rate markets also influence extreme risks in the carbon market. Therefore, carbon market policies should account for regional monetary policy changes, particularly during significant shifts in interest rate policies and major external political and economic events, and adjust corresponding policies in a timely manner to ensure the stability of the carbon market.
Data availability statement
The original contributions presented in the study are included in the article/Supplementary Material, further inquiries can be directed to the corresponding authors.
Author contributions
JM: Conceptualization, Data curation, Methodology, Software, Writing–original draft, Writing–review and editing. XY: Conceptualization, Funding acquisition, Project administration, Supervision, Writing–review and editing. FH: Formal Analysis, Investigation, Writing–review and editing. YX: Formal Analysis, Investigation, Writing–review and editing.
Funding
The author(s) declare that financial support was received for the research, authorship, and/or publication of this article. This work was supported by the Key Project of the National Social Science Foundation of China (21AGJ009). The authors thank the NSSFC for its financial support and the comments of the anonymous evaluation experts, and are responsible for the consequences of this article.
Conflict of interest
The authors declare that the research was conducted in the absence of any commercial or financial relationships that could be construed as a potential conflict of interest.
Publisher’s note
All claims expressed in this article are solely those of the authors and do not necessarily represent those of their affiliated organizations, or those of the publisher, the editors and the reviewers. Any product that may be evaluated in this article, or claim that may be made by its manufacturer, is not guaranteed or endorsed by the publisher.
Supplementary material
The Supplementary Material for this article can be found online at: https://www.frontiersin.org/articles/10.3389/fenvs.2024.1499743/full#supplementary-material
Footnotes
1Data source: “Emissions Trading Worldwide: 2024 ICAP Status Report.”
2According to the theoretical framework proposed by White et al. (2015), the MVMQ-CAViaR model allows the inclusion of covariates of interest. White et al. have provided proofs related to the asymptotic theory of the MVMQ-CAViaRX model.
3Figure 1 only reports the 1% quantile measurement results for the European Carbon Index return series (
References
Antonakakis, N., Chatziantoniou, I., and Gabauer, D. (2020). Refined measures of dynamic connectedness based on time-varying parameter vector autoregressions. J. Risk Financial Manag. 13 (4), 84. doi:10.3390/jrfm13040084
Cao, G., and Xie, F. (2024). Extreme risk spillovers across energy and carbon markets: evidence from the quantile extended joint connectedness approach. Int. J. Finance & Econ. 29 (2), 2155–2175. doi:10.1002/ijfe.2781
Chai, S., and Zhou, P. (2019). Measuring the integrated risk of carbon financial market by a non-parametric copula-CVaR model. Chin. J. Manag. Sci., 27 (08): 1–13. (in Chinese). doi:10.16381/j.cnki.issn1003-207x.2019.08.001
Chen, B., and Sun, Y. (2022). The impact of VIX on China’s financial market: a new perspective based on high-dimensional and time-varying methods. North Am. J. Econ. Finance 63, 101831. doi:10.1016/j.najef.2022.101831
Chen, C., Wang, H., and Shan, J. (2023). The spillover effect of US monetary policy on global macro economy and the coordination effect of international monetary policy. Stat. Res. 40 (06), 20–35. (in Chinese). doi:10.19343/j.cnki.11-1302/c.2023.06.002
Chen, J., Liang, Z., Ding, Q., and Liu, Z. (2022a). Quantile connectedness between energy, metal, and carbon markets. Int. Rev. Financial Analysis 83, 102282. doi:10.1016/j.irfa.2022.102282
Chen, Y., Wang, C., Miao, J., and Zhou, T. (2022b). Identifying risk transmission in carbon market with energy, commodity and financial markets: evidence from time-frequency and extreme risk spillovers. Front. Energy Res. 10, 922808. doi:10.3389/fenrg.2022.922808
Dai, X., Xiao, L., Wang, Q., and Dhesi, G. (2021). Multiscale interplay of higher-order moments between the carbon and energy markets during Phase III of the EU ETS. Energy Policy 156, 112428. doi:10.1016/j.enpol.2021.112428
Diebold, F. X., and Yilmaz, K. (2012). Better to give than to receive: predictive directional measurement of volatility spillovers. Int. J. Forecast. 28 (1), 57–66. doi:10.1016/j.ijforecast.2011.02.006
Ding, Q., Huang, J., and Zhang, H. (2022). Time-frequency spillovers among carbon, fossil energy and clean energy markets: the effects of attention to climate change. Int. Rev. Financial Analysis 83, 102222. doi:10.1016/j.irfa.2022.102222
Dong, Q., Zhao, Y., Ma, X., and Zhou, Y. (2024). Risk spillover between carbon markets and stock markets from a progressive perspective: measurements, spillover networks, and driving factors. Energy Econ. 129, 107228. doi:10.1016/j.eneco.2023.107228
Gong, Z., Chen, Y., Zhang, H., and Chen, F. (2024). Tail risk connectedness in the Carbon-Finance nexus: evidence from a quantile spillover approach in China. Finance Res. Lett. 67, 105803. doi:10.1016/j.frl.2024.105803
Huang, X., Wang, Y., and Li, H. (2024). Exploring the asymmetric influence of economic policy uncertainty on the nonlinear relationship between exchange rate and carbon prices in China. North Am. J. Econ. Finance 73, 102166. doi:10.1016/j.najef.2024.102166
Jiang, W., Zhang, Y., and Wang, K. H. (2024). Analyzing the connectedness among geopolitical risk, traditional energy and carbon markets. Energy 298, 131411. doi:10.1016/j.energy.2024.131411
Koop, G., Pesaran, M. H., and Potter, S. M. (1996). Impulse response analysis in nonlinear multivariate models. J. Econ. 74 (1), 119–147. doi:10.1016/0304-4076(95)01753-4
Lin, B., and Li, M. (2023). Emerging industry development and information transmission in financial markets: evidence from China's renewable energy. Energy Econ. 128, 107192. doi:10.1016/j.eneco.2023.107192
Liu, Y., and Yan, B. (2024). Spillover effects of carbon, energy, and stock markets considering economic policy uncertainty. J. Econ. Finance 48, 563–591. doi:10.1007/s12197-024-09665-y
Liu, Z., Zhang, Z., Dai, P., and Liu, W. (2023). A study on the spillover effect of crash risk between carbon and stock markets: COVID-19, investor sentiment and economic policy uncertainty. Syst. Eng. - Theory & Pract. 43 (3), 740–754. (in Chinese). doi:10.12011/SETP2022-0458
Machado, J. A. F., and Silva, J. M. C. S. (2013). “Quantile regression and heteroscedasticity,” in Discussion paper. Colchester: University of Essex, Department of Economics.
Meng, B., Lin, X., and Kuang, H. (2023). Research on the long memory linkage effect of economic policy uncertainty on shipping market and financial market. Syst. Engineering-Theory & Pract. 43 (07), 1927–1945. (in Chinese). doi:10.12011/SETP2022-1966
Naeem, M. A., and Arfaoui, N. (2023). Exploring downside risk dependence across energy markets: electricity, conventional energy, carbon, and clean energy during episodes of market crises. Energy Econ. 127, 107082. doi:10.1016/j.eneco.2023.107082
Nakajima, J., Kasuya, M., and Watanabe, T. (2011). Bayesian analysis of time-varying parameter vector autoregressive model for the Japanese economy and monetary policy. J. Jpn. Int. Econ. 25 (3), 225–245. doi:10.1016/j.jjie.2011.07.004
Pesaran, H. H., and Shin, Y. (1998). Generalized impulse response analysis in linear multivariate models. Econ. Lett. 58 (1), 17–29. doi:10.1016/s0165-1765(97)00214-0
Primiceri, G. E. (2005). Time varying structural vector autoregressions and monetary policy. Rev. Econ. Stud. 72, 821–852. doi:10.1111/j.1467-937x.2005.00353.x
Ren, X., Dou, Y., Dong, K., and Yan, C. (2023). Spillover effects among crude oil, carbon, and stock markets: evidence from nonparametric causality-in-quantiles tests. Appl. Econ. 55 (38), 4486–4509. doi:10.1080/00036846.2022.2128297
Siddique, M. A., Nobanee, H., Karim, S., and Naz, F. (2023). Do green financial markets offset the risk of cryptocurrencies and carbon markets? Int. Rev. Econ. & Finance 86, 822–833. doi:10.1016/j.iref.2023.04.005
Su, C. W., Pang, L. D., Qin, M., Lobonţ, O. R., and Umar, M. (2023). The spillover effects among fossil fuel, renewables and carbon markets: evidence under the dual dilemma of climate change and energy crises. Energy 274, 127304. doi:10.1016/j.energy.2023.127304
Subramaniam, N., Wahyuni, D., Cooper, B. J., Leung, P., and Wines, G. (2015). Integration of carbon risks and opportunities in enterprise risk management systems: evidence from Australian firms. J. Clean. Prod. 96, 407–417. doi:10.1016/j.jclepro.2014.02.013
Tao, M., Poletti, S., Wen, L., and Sheng, M. S. (2024). Dynamic spillovers between the carbon, stock, and energy markets: a New Zealand case. J. Clean. Prod. 434, 140278. doi:10.1016/j.jclepro.2023.140278
Tian, T., Lai, K., and Wong, C. W. Y. (2022). Connectedness mechanisms in the “Carbon-Commodity-Finance” system: investment and management policy implications for emerging economies. Energy Policy 169, 113195. doi:10.1016/j.enpol.2022.113195
Wang, X. (2020). Frequency dynamics of volatility spillovers among crude oil and international stock markets: the role of the interest rate. Energy Econ. 91, 104900. doi:10.1016/j.eneco.2020.104900
White, H., Kim, T. H., and Manganelli, S. (2015). VAR for VaR: measuring tail dependence using multivariate regression quantiles. J. Econ. 187 (1), 169–188. doi:10.1016/j.jeconom.2015.02.004
Yang, M. Y., Chen, Z., Liang, Z., and Li, S. P. (2023). Dynamic and asymmetric connectedness in the global “Carbon-Energy-Stock” system under shocks from exogenous events. J. Commod. Mark. 32, 100366. doi:10.1016/j.jcomm.2023.100366
Zeng, Y., Wen, H., and Chen, X. (2017). Stock market interconnection, tail risk contagion, and systemically important markets: analysis based on multiple quantile regression models. Stud. Int. Finance, (09): 86–96. (in Chinese). doi:10.16475/j.cnki.1006-1029.2017.09.009
Zhang, B., Fan, Z., and Li, X. (2010). Co-Movement between China and U.S.’s stock markets. Econ. Res. J., 45 (11): 141–151. (in Chinese)
Zhang, W., He, X., and Hamori, S. (2022). Volatility spillover and investment strategies among sustainability-related financial indexes: evidence from the DCC-GARCH-based dynamic connectedness and DCC-GARCH t-copula approach. Int. Rev. Financial Analysis 83, 102223. doi:10.1016/j.irfa.2022.102223
Zhang, Y. J., and Wei, Y. M. (2010). An overview of current research on EU ETS: evidence from its operating mechanism and economic effect. Appl. Energy 87 (6), 1804–1814. doi:10.1016/j.apenergy.2009.12.019
Keywords: carbon emission trading market, extreme risk structure, spillover effects, geopolitical risk, economic risks
Citation: Mi J, Yang X, Huang F and Xu Y (2024) Geopolitical, economic risk and the time-varying structure of extreme risk in the carbon emissions trading market. Front. Environ. Sci. 12:1499743. doi: 10.3389/fenvs.2024.1499743
Received: 21 September 2024; Accepted: 29 November 2024;
Published: 16 December 2024.
Edited by:
Mirela Panait, Petroleum & Gas University of Ploieşti, RomaniaReviewed by:
Rozalia Gabor, George Emil Palade University of Medicine, Pharmacy, Sciences and Technology of Târgu Mureş, RomaniaLaeeq Razzak Janjua, WSB Universities, Poland
Copyright © 2024 Mi, Yang, Huang and Xu. This is an open-access article distributed under the terms of the Creative Commons Attribution License (CC BY). The use, distribution or reproduction in other forums is permitted, provided the original author(s) and the copyright owner(s) are credited and that the original publication in this journal is cited, in accordance with accepted academic practice. No use, distribution or reproduction is permitted which does not comply with these terms.
*Correspondence: Feifei Huang, aHVhbmdmZkBnY3UuZWR1LmNu; Yufa Xu, eHV5dWZhQGdjdS5lZHUuY24=
 Junlong Mi
 Xing Yang1,2,3