- 1College of Soil and Water Conservation, Southwest Forestry University, Kunming, China
- 2College of Economics and Management, Southwest Forestry University, Kunming, China
- 3Research Institute of Forest Cities, Southwest Forestry University, Kunming, China
Introduction: Investigation of the evolutionary trend of habitat quality in karst and rocky desertification zones is crucial for enhancing ecological security and conservation.
Methods: Analysis of land use statistics from the years 2000, 2010, and 2020, changes in habitat quality (HQ) and land use (LULC) between 2000 and 2020 were analyzed using Huize County in Yunnan Province as an example. The InVEST and FLUS models were applied to simulate LULC under different scenarios in 2030 and 2040 and assess changes in spatial gradients of habitat quality at each timepoint and factors influencing them.
Results: The findings indicated that (1) The predominant land use types are grassland and woodland, experiencing the most significant growth in urbanized areas, the main sources of which are paddy fields and high-cover grassland. (2) The habitat quality between 2000 and 2020 was average and displayed a consistent decline. The spatial distribution pattern indicates low HQ in urban areas, high HQ in the outskirts, low HQ in the south-west, and high HQ in the north-east. In all four scenarios, habitat quality predominantly decreases in urban areas and regions with a dense concentration of built-up land. (3) Habitat quality spatial distribution is primarily affected by the type of land use, with NDVI being the secondary determinant.
Discussion: The ecological environment of Huize County must be restored and safeguarded with a focus on ecological priorities and harmonious development scenarios. This study provides methodological lessons for ecorestoration and policymakers in areas of karstic rocky desertification.
1 Introduction
Karst desertification is the phenomenon and process of destruction of surface vegetation, soil erosion, and large-scale exposure of bedrock under humid climate conditions, which is disturbed by karstic activity and irrational human activity, resulting in decertified landscapes (Tang et al., 2019). While southwest China has significant ecological protection, there is also a severe rock desertification problem in its southwest karst region, resulting in a decline in ecosystem function and a serious threat to the ecological security of the region (Li T. et al., 2023). Thus, it is imperative that the ecological environment in the southwest karst region is protected and restored to maintain the ecological security of the region (Chang et al., 2024). Various scholars at home and abroad have conducted systematic research on extracting and assessing rocky desertification areas, spatial and temporal evolution patterns, influence mechanisms, restoration, and management to realize the combination of rocky desertification prevention and control (D’Ettorre et al., 2024). According to Guo et al., rocky desertification was examined spatially and temporally by using a spatial remote sensing monitoring model for rocky desertification constructed in Bijie City for the past 35 years, and geographic probes were used to clarify the driving factors for rocky desertification evolution in different periods (Guo et al., 2023); A model proposed by Zhang et al. (2021) can be used to extract information about karst rock desertification directly from complex features within karst areas; A southern karst desertification management area is used as the research object by Wu J. et al. (2022), who combine remote sensing and geographic information system technology to construct a landscape ecological quality model and analyze the ecosystem’s stability, degree of disturbance, and other characteristics quantitatively; As a result of quantitative analysis of the spatial and temporal changes and evolutionary patterns of rocky desertification from 2001 to 2020, Qian et al. (2022) were able to improve the CA-Markov model, and three governance scenarios were developed to predict rocky desertification trends in the next 30 years.
HQ is a crucial metric accustomed to evaluating the ecological conditions of a habitat (Hall et al., 1997), which not only reflects regional biodiversity status but also ecosystem ability to provide ecological services (Gomes et al., 2021; Marques et al., 2020). The quality of habitat is intricately linked to alterations in human economic and social endeavors (Koo et al., 2020; Su et al., 2012). Recent findings indicate that urbanization is the primary driver for alterations in the distribution and quality of habitats (McDonald et al., 2018; Tang et al., 2020; Yang, 2021). As populations agglomerate and human activities intensify, natural habitats are under greater pressure (Chen et al., 2022; Yang et al., 2023). The current research methods used to assess habitat quality at different spatial scales can be divided into two categories: the first is the use of field surveys to determine habitat quality through the development of an indicator system, which is time-consuming and difficult to implement. Secondly, habitat quality can be assessed using models (Terrado et al., 2016). Recent findings indicate that the main models currently utilized for evaluating regional habitat quality include the Social Valuation of Ecosystem Services (SolVES) model (Sherrouse et al., 2014), the HSI model (Bełcik et al., 2019), the MIMES model (Boumans et al., 2015), and the Trade-offs-Habitat Quality (InVEST-HQ) model (Marques et al., 2020). Among them, the InVEST-HQ model is mostly suitable for research areas with poor species distribution data or the coexistence of mixed habitat types. It has the advantages of convenient operation, strong visualization ability, and a more complete theoretical system (Akbari et al., 2021). Scholars at home and abroad mainly make land use dynamic prediction with the help of cellular automata (CA), artificial neural networks (ANN), Markov chains (MC), ANN-CA, PLUS models, and FLUS models (Zhang et al., 2022; Lin et al., 2020; Liu et al., 2017; Liang et al., 2018; Huang et al., 2024a; He et al., 2017), etc., and realize habitat quality prediction and assessment through the InVEST-HQ model. Based on the meta cellular automata model, FLUS (Future Land Use Simulation) model integrates the dual impacts of natural and human activities. Using artificial neural network algorithms, it is optimized and improved. Based on the combination of land use data with different driving force factors, suitability probability maps are generated for various land uses in the study area, as well as predicting the spatial distribution of future land uses with high simulation accuracy by simulating regional land use responses (Chen et al., 2021; Liu et al., 2023). Geostatistical analyses and Geodetector were used to investigate the regional and temporal dynamics of habitat quality (Cai et al., 2023); factor correlation analyses, multivariate linear regressions, and geographically weighted regressions (Liu et al., 2017; Zhu et al., 2020) were used for the profiling of influencing factors and driving mechanisms. Unlike traditional models, which are limited in their ability to examine the effects of each factor individually, Geodetector can quantify the synergistic effects of factors and analyze the spatial distribution because of multiple factors, revealing the interactions among them (Li Y. et al., 2023).
Karst regions are characterized by karst development and high landscape heterogeneity, which makes the interaction between human activities and the ecological environment more complex (Li T. et al., 2023). Karst desertification research currently focuses primarily on macro-level changes in desertification, analysis of its causes, and discussion of preliminary management strategies (Pan et al., 2022; Yang et al., 2022; Chong et al., 2021). And there is a lack of research that focuses on the quality of habitats and the factors that drive them. With mountains and valleys crisscrossing its territory, complex geological structure, and complete stratigraphic development, Huize County is situated in the northeast Yunnan Plateau. As a typical karst area, carbonate rocks are widely distributed, have many caves and landforms, and are distributed in patches (Zhao L. et al., 2023). There is an increasing contradiction between aggravated land rock desertification and socio-economic development, and the environment is in a fragile state. Despite this, little research has been conducted on changes in habitat quality in the region. A few studies have been conducted using the InVEST model to simulate habitat quality in karst regions; however, most have used conventional parameters without considering the threats to habitat quality posed by rocky desertification, resulting in limitations in assessment results and driving factor analyses.
The study employed land use data from Huize County for the years 2000, 2010, and 2020 to deploy the InVEST-HQ model for the computation of habitat quality. By incorporating rocky desertification indicators into the Habitat Quality Assessment System, the specificity of habitat quality assessment can be captured more accurately. The evolution pattern analysis of habitat quality was conducted using the transfer matrix and spatial autocorrelation. Additionally, the FLUS and InVEST-HQ models were employed to predict future habitat quality under various scenarios, considering Huize County’s ecological environment and social development goals. The impacts of different development scenarios on habitat quality were assessed; moreover, Geodetector was utilized to analyze the influencing factors. The purpose of this research is to examine the scientific issues associated with land use and habitat quality in karstic desertification areas, as well as the mechanisms affecting habitat quality. To provide a scientific basis for ecological conservation and sustainable development of the Karst region.
2 Materials
2.1 Study area
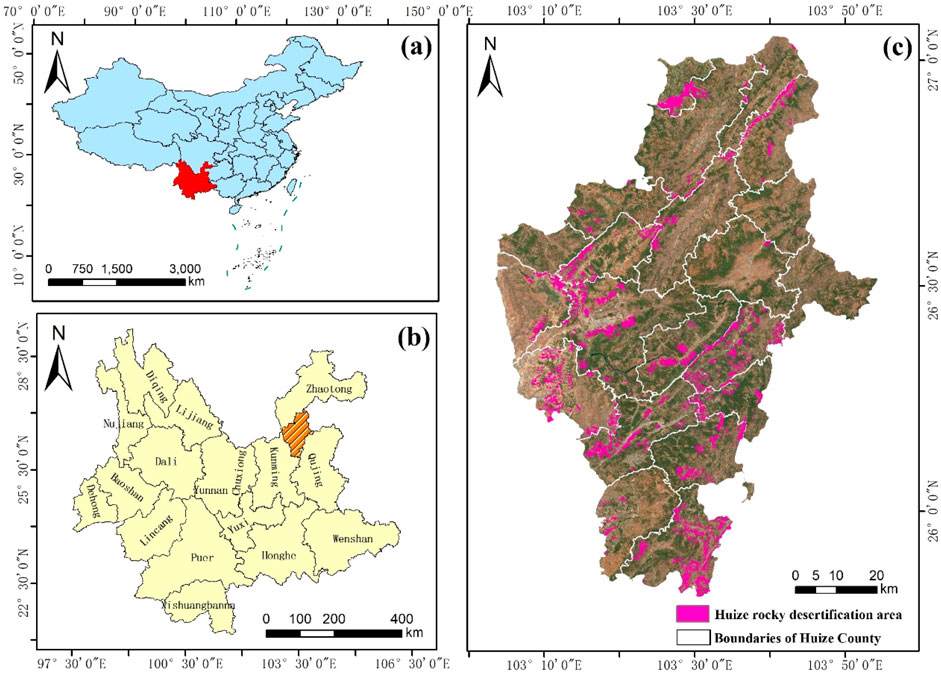
Huize County is in Qujing City, within the province of Yunnan, on the eastern part of the Yunnan plateau and near the convergence zone of the Qianxi plateau. The geography displays a variation in elevation, characterized by elevated terrain in the southern division and lower terrain in the northern division, characterized by a step-like descent. The highest elevation of the territory reaches 4,017.3 m, the lowest elevation of 695 m. The territory of the river basin covers an area of 5,854 km2. The mean annual precipitation is 817.7 mm. Vegetation area for central, east Yunnan plateau semi-moist evergreen broad-leaved forests, Yunnan pine forest area, northeast Yunnan plateau high, mid-mountain Yunnan pine forest sheep meadow subarea. Influenced by the topography, climate, soil, and vegetation show significant vertical changes. At the end of 2022, the urban population was 328,800, with a resident population of 791,300 and an urbanization rate of 41.6%. (Figure 1).
2.2 Data source and preprocessing
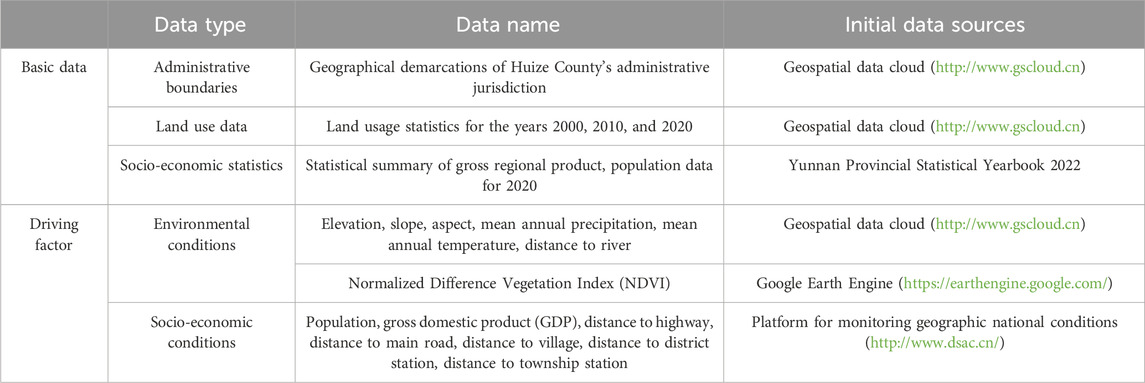
Data on land usage for the years 2000, 2010, and 2020 were utilized in this analysis and acquired through decoding Landsat images with a spatial resolution of 30 m. There were six primary classifications of land use zones: agriculture, forest land, grassland, watersheds, populated land, and unutilized land. Additionally, there were 25 subcategories based on the land use categorization system of the Chinese Academy of Sciences (CAS). Driving factors are derived from the geospatial data cloud and the geographic national condition monitoring platform. Detailed data information and sources are shown in Table 1. The study data were all resampled to 30 m, with uniform raster row and column numbers of 2,820 and 4,596, and processed using ArcGIS 10.8, FLUS V2.4, and InVEST 3.13.0.
2.3 Scenario setting
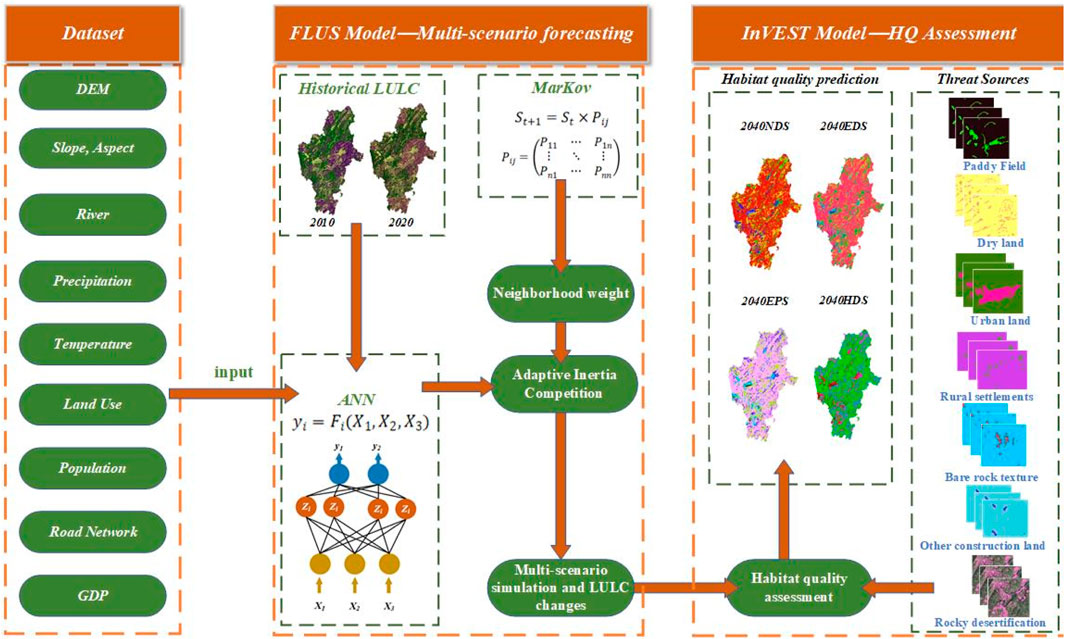
Four scenarios were established to simulate and predict habitat quality in Huize County based on its geo-geomorphology and socio-economic development as follows:
(1) Natural Development Scenario (NDS): Based on the assumption that the development trend remains unchanged and modeled with the development trend from 2010 to 2020, the transfer category and probability are determined.
(2) Economic Development Scenario (EDS): In accordance with the report on the draft national economic and social development plan for Huize County for 2024, transforming and upgrading the industry, accelerating the development of culture and tourism, and fostering the growth of the tertiary sector will be promoted. IBM SPSS Statistics 26 was used to calculate the correlation between GDP and each category in Huize County from 2000 to 2020. Statistical findings indicate that the Pearson correlation coefficient between GDP and urban land as well as other building land in Huize County is the highest, equaling 0.995 (P < 0.01). Therefore, it is assumed that within the EDS, urban land and other construction land cannot be transformed into other land categories, and all other land categories can be transformed into urban land and other construction land, and the probability of transferring each land category increases by 50%. The probability of transferring each category is increased by 50%. Urban land and other construction land remain unchanged.
(3) Ecological priority scenario (EPS): As part of its commitment to ecological environmental protection and restoration, Huize County actively practices the concept “green mountains are golden mountains.” A new round of forest land protection and use planning in Huize County will require coordination of forest land protection and use, as well as clarification of forestry production space and ecological space. In order to guarantee the development of ecological space for woodland and grassland, it is assumed that forested land, shrubland, open woodland, and other forested land can be converted to each other but not to other land categories, and the transfer probability of the four categories of land is increased by 100%, and the transfer probability of urban land, rural residential land, and other construction land is decreased by 50%. The probability of transfer is unchanged for urban land, rural residential land, and other construction land, and the probability of transfer is reduced by 50% for all other land categories.
(4) Harmonious development scenario (HDS): Ensure that all aspects of coordination are considered, including urban-rural coordination, economic and social coordination, and human-nature coordination. Through the promotion of agricultural modernization, new industrialization, tourism industrialization, and appropriate economic development, it provides economic income such as arable land and construction land while simultaneously protecting natural areas such as forests and grasslands. It is assumed that the transfer probability of forest land and grassland remains unchanged in this scenario, the transfer probability of urban land, rural residential land, and other construction land increases by 25 percent, and the transfer probability of the rest of the land categories decreases by 25 percent (Figure 2).
3 Methods
3.1 Pearson’s correlation coefficient
The Pearson correlation coefficient quantifies the degree of correlation between two variables (Ma et al., 2016), which range from −1 to 1. The study used the coefficient to calculate the degree of correlation by comparing Huize County’s GDP with various categories. Equation 1 gives the calculation formula:
where
3.2 Land demand forecasting based on FLUS modeling
The FLUS model integrates land use change and future land use scenario simulation under human activities and natural influences (Chen et al., 2021; Feng et al., 2021). The total probability is calculated by Equation 2:
where
The study mainly considered 13 driving factors: elevation, slope, slope direction, average annual precipitation, average annual temperature, distance from highway, distance from main road, distance from river, distance from village, distance from county station, distance from township station, gross domestic product, and population, and simulated the 2020 land use data with the 2010 land use data as the base period data and checked the accuracy of the land use data. The Kappa coefficients of natural development, economic development, ecological priority, and harmonious development scenarios are all 0.898. The FOM coefficient is 0.02, indicating that the simulation effect is reasonable, and the model is usable (Liu et al., 2023).
3.3 Habitat quality assessment based on the InVEST model
The habitat quality model combines information on land cover and biodiversity threat factors to generate habitat quality maps. It ranges from 0 to 1, with larger values indicating better habitat quality (Sallustio et al., 2017; Wang et al., 2024). Equation 3 gives the calculation formula:
where
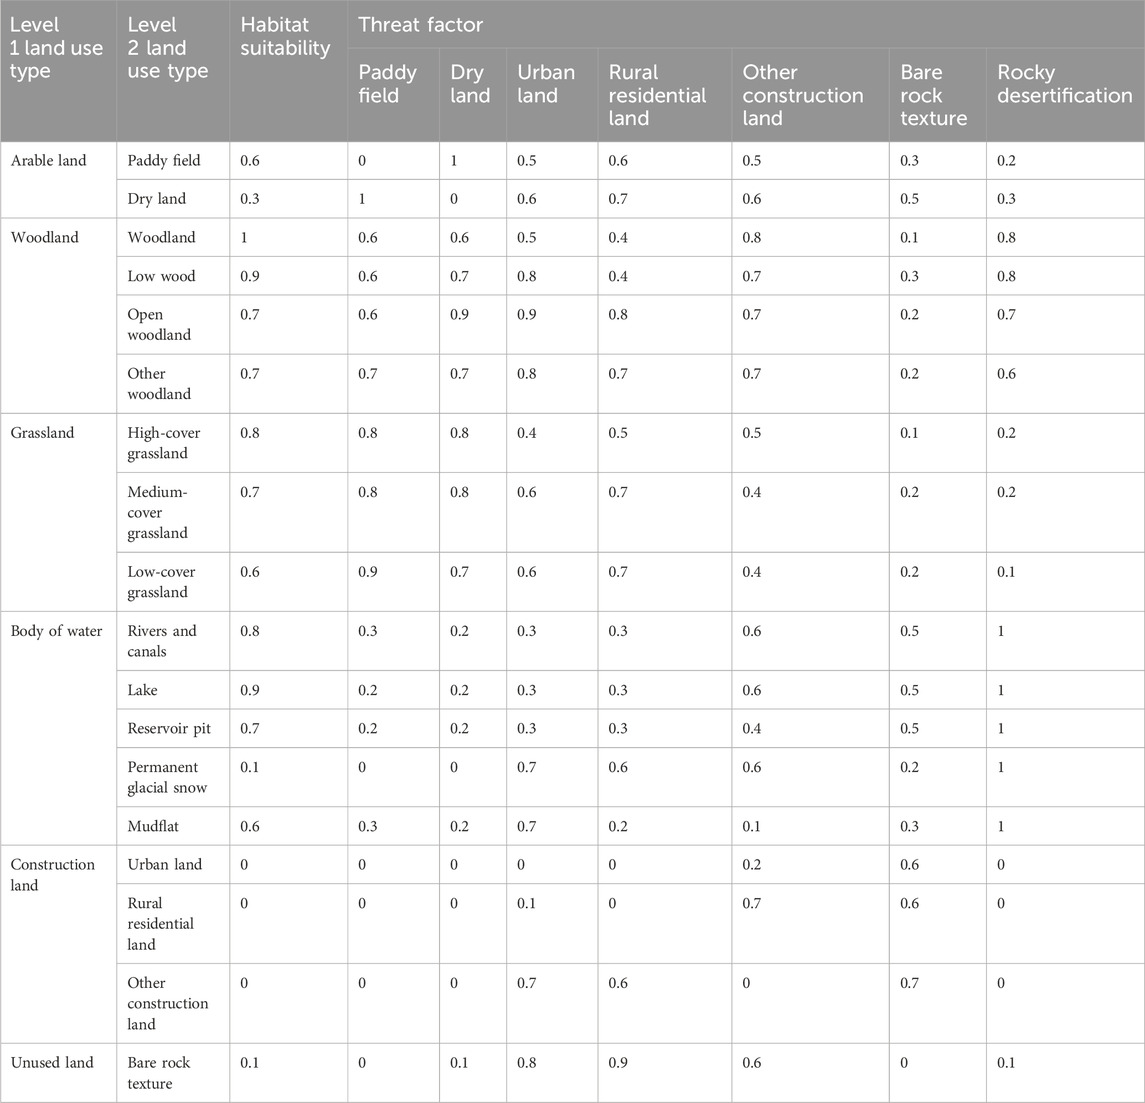
Generally, natural environments are the most sensitive to external stressors, followed by semi-artificial environments, which are relatively less sensitive to ecological stressors. The InVEST model divides land use into natural and manmade environments. Construction land, as a typical human-made environment, can reflect the threatening impacts of human activities on habitats, ecological conditions, and biodiversity in a particularly significant way. A certain extent of ecological destruction is also caused by arable land, which is a semi-artificial environment. In addition, bare rock textures and rocky desertification areas are important indicators of rocky desertification. As a result of this analysis, urban land, rural residential land, other construction land, paddy fields, dry land, rocky desertification areas, and bare rock texture were identified as threat factors. Taking into consideration the InVEST Model User Manual and the relevant literature (He et al., 2023; Ji et al., 2023; Huang et al., 2024b), the maximum impact distance and weight of each threat source factor (Table 2) as well as the suitability and sensitivity to stressors of different habitat types (Table 3) were determined. Huize County habitat quality levels were categorized into five categories: low (0.0–0.2), lower (0.2–0.4), medium (0.4–0.6), higher (0.6–0.8) and, high (0.8–1.0).

Table 2. The maximum distance, weight and spatial decay type of threat factors affecting habitat quality.
3.4 Spatial autocorrelation analysis of habitat quality
Spatial autocorrelation reflects the correlation between a specific geographical phenomenon or a specific attribute value on a regional unit and the same phenomenon or attribute value on neighboring regional units. It is a measure of the degree of aggregation of values in a spatial domain, and Moran’s I index is commonly used to measure the interrelationships between spatial elements (Zhang L. et al., 2023). In this study, the spatial distribution characterization of habitat quality in the case site will be carried out using GeoDa 1.22. Spatial autocorrelation is divided into global spatial autocorrelation and local spatial autocorrelation. As shown in Equations 4 and 5, the formulas are as follows:
Global Moran’s I index formula:
Local Moran’s I index formula:
where
3.5 Geodetector
Geodetector is a statistical method proposed by Wang et al. to detect spatial heterogeneity and reveal the driving factors behind it. The dependent variable Y (habitat quality) and independent variables X (land use type, precipitation, air temperature, elevation, population density, slope, and NDVI) were selected for analysis. In this study, factor detectors and interaction detectors were used to explore the drivers of spatial differentiation in habitat quality in 2020. Factor probes are measured by the q-value metric. According to Equation 6, the formulas are as follows (Li Y. et al., 2023):
where the value range of q is [0, 1], which indicates the explanatory power of the independent variable
4 Results
4.1 Characteristics of spatial and temporal land use changes in Huize County
4.1.1 Changes in land-use types
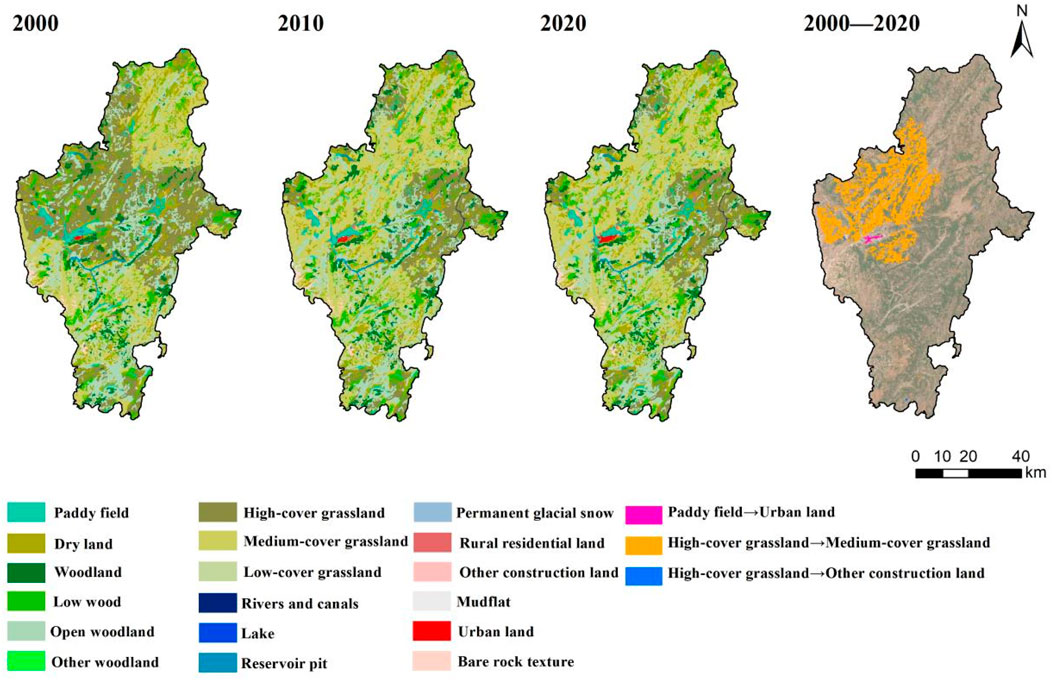
From Figure 3, grassland is the primary land use type in Huize County (50.25%). Forest land is the second most prevalent (32.59%), of which medium-coverage grassland and sparse forest land accounted for the largest proportion, 34.21% and 18.96%, respectively; other land use categories represented a lesser percentage. The area of forest land in Huize County increased the most from 2000 to 2020, amounting to 8,650.89 hm2, followed by construction land and water; grassland area decreased the most, with 10,113 hm2, followed by cropland, with a decrease of 1,564.15 hm2. Spatially, the greatest land use change occurred in the northwestern part of Huize County.
4.1.2 Land use transfer matrix
High-cover grassland was the most converted in Huize County from 2000 to 2020, mainly to medium-cover grassland (Figure 4C). This was followed by dryland, primarily transformed into open woodland, high-cover grassland, and medium-cover grassland. With an area of 88,594.56 hm2, medium-cover grassland has been transported in the biggest amount, which is consistent with the transformation trend from 2000 to 2010 (Figure 4A), and the change in land types from 2010 to 2020 is more complicated, indicating that it has been greatly influenced by human activities during this decade (Figure 4B).
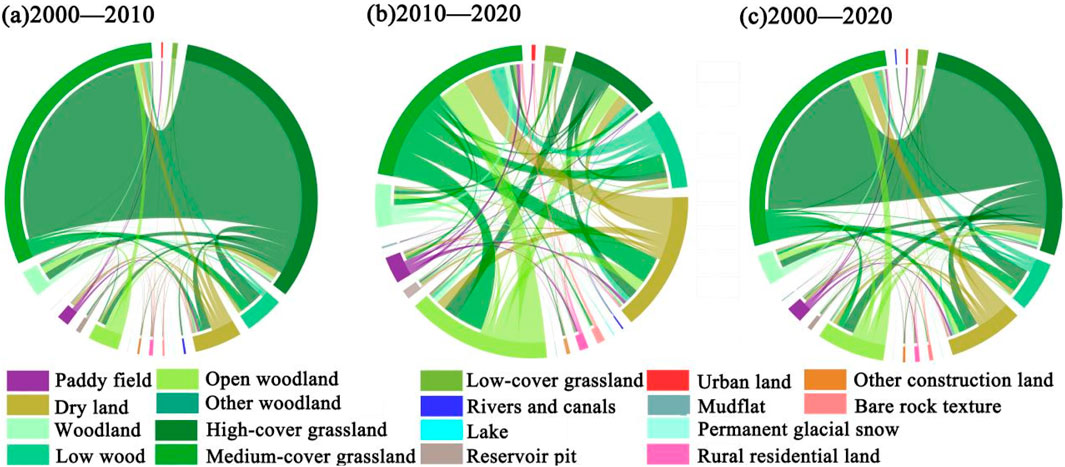
Figure 4. Land use changes in Huize County between 2000 and 2020. (A) 2000–2010. (B) 2010–2020. (C) 2000–2020.
The area of other construction land increased the highest between 2000 and 2020 (93.8%), followed by urban land (69.6%), which was mainly converted to paddy land; other construction land was converted at the fastest rate (79.6%), and it was converted to rural settlements with 171.28 hm2, followed by high-covered grassland, and then converted to medium-covered grassland with 71,026.61 hm2, a decrease of 56.3%. Urban land occupation of paddy fields is concentrated in urban areas; medium-coverage grassland and other construction land occupations of high-coverage grassland are mainly set in urban areas and the northwest, and the distribution of other areas is scattered, which coincides with the rocky desertification area of Huize County (Figure 3).
4.1.3 Forecasts of alterations in land utilization by 2030 and 2040 under different scenarios
Under all four scenarios, as shown in Figure 5, the area of construction land will continue to rise. Under the NDS, reservoirs pits and ponds and other construction land have the largest area of growth, and all other land types have the same trend of change as in 2010–2020, except for other woodland, high-cover grassland, and mudflat; the remaining land types’ trends under the EDS are the same as those under the NDS, except for the decrease of permanent glacier snow; under the EPS, the area of shrub forests and sparse woodlands increases, and the area of shrub forests in 2030 rises to 49,409.64 hm2, and in 2040 further grows up to 49,491.99 hm2, and the area of open forest land increases to 112,961.52 hm2 in 2030 and further increases to 113,693.31 hm2 in 2040, which is consistent with the expectation of environmental prioritization and sustainable development, the area used for urban and other construction slows down, while the area of rural communities grows at a slower rate; in the HDS, the 2030–2040 are all in the same trend as in 2010–2020.
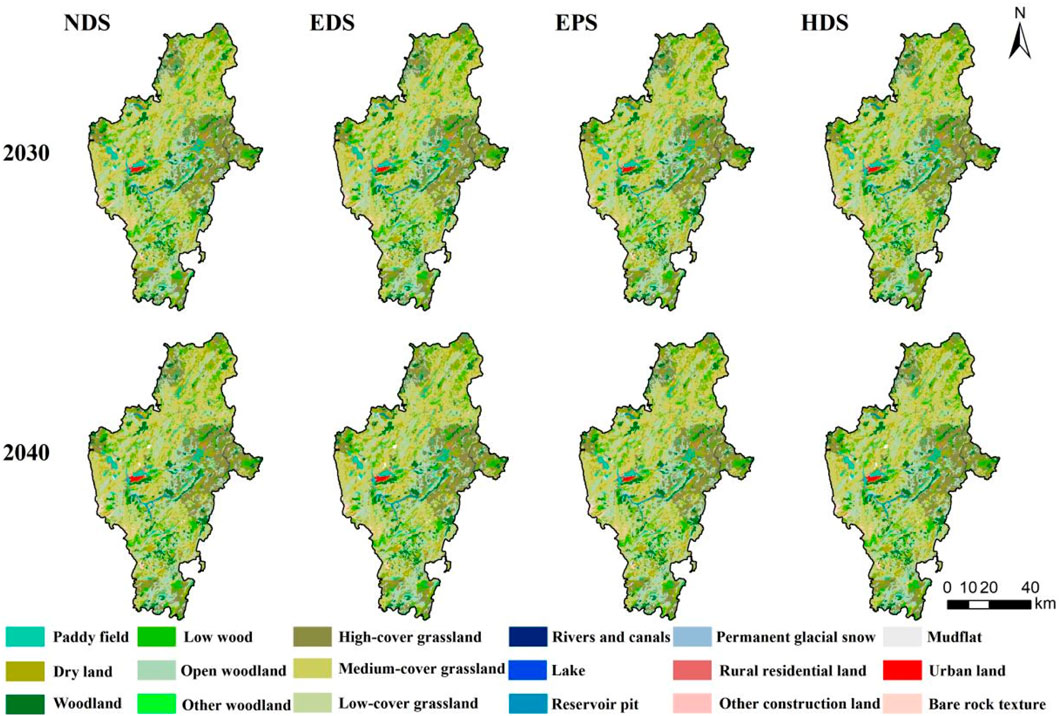
Figure 5. Huize County land use simulation prediction map for 2030 and 2040 under several scenarios.
4.2 Features of temporal and spatial variations in Huize County’s habitat quality
4.2.1 Spatial and temporal variations in habitat quality
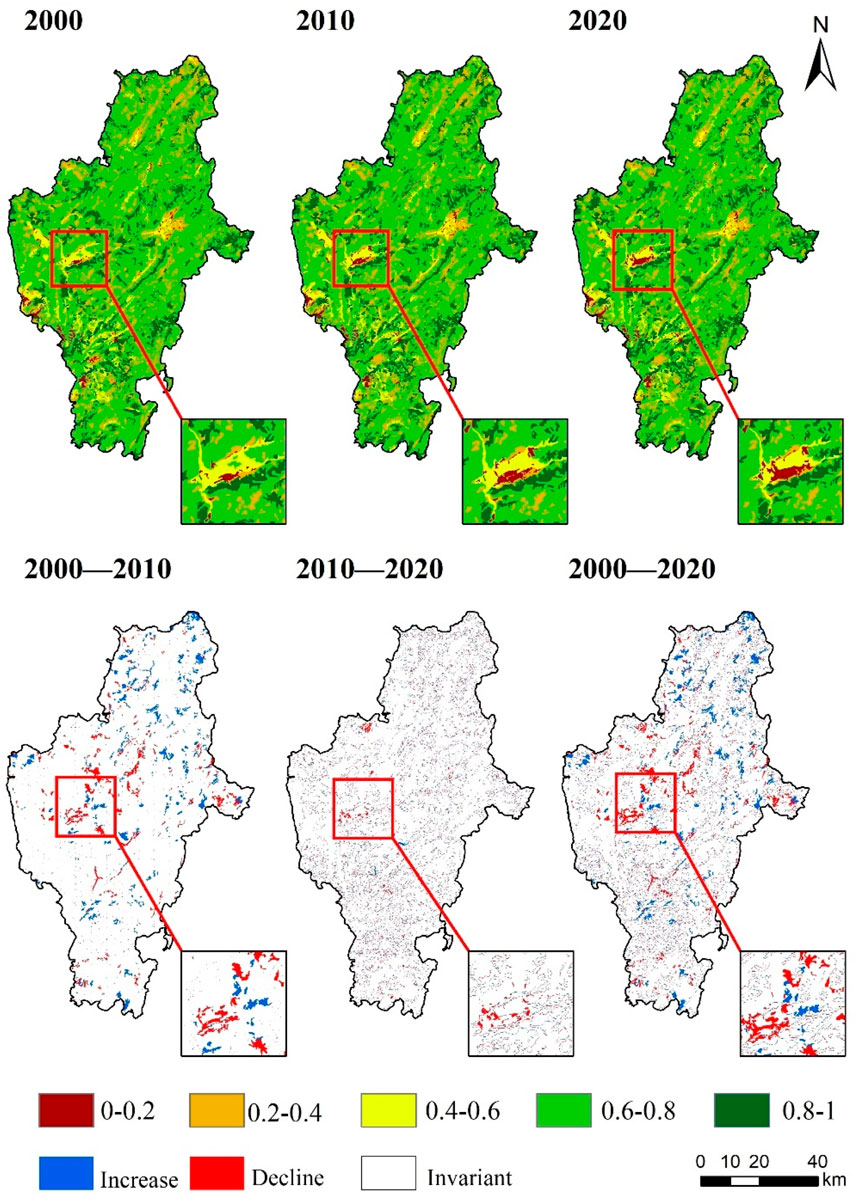
The average values of habitat quality in Huize County in 2000, 2010, and 2020 were 0.6922, 0.6814, and 0.6795, respectively, with an average level of habitat quality and an overall declining trend. The area of the area with no change in habitat quality level from 2000 to 2020 stands for 88.00%, while the shrinking area accounted for 5.51%, and the expanding area accounted for 6.49%. The area of low habitat quality area increased by 1948.32 hm2, accounting for 0.33%; the area of lower habitat quality area decreased by 632.52 hm2, accounting for 0.1%; the area of medium habitat quality area decreased by 1,721.7 hm2, accounting for 0.29%; the area of higher habitat quality area accounted for the largest share and decreased, with a total decrease of 6,751.53 hm2, accounting for 1.13%; the area of higher habitat quality area increased by 6,991.02 hm2, accounting for an increase of 1.19%. In some parts of the region, high-HQ areas are increasing because of ecological conservation efforts. Nonetheless, the increase in low-HQ areas and the decrease in low, lower, and medium habitat quality areas indicate that the ecological environment is still undergoing serious challenges.
The spatial pattern of habitat quality in Huize County is characterized by the distribution of low in the urban area, high in the periphery, low in the southwest, and high in the northeast (Figure 6). The low habitat quality level is mostly concentrated on urban land, rural settlements, and other construction land. There is a significant decline in habitat quality in the center of the county. This is largely due to the expansion of urban land uses, changing the surrounding land use types, and causing increased harm to habitat. Areas where woodlands and grasslands are located are mostly in high as well as higher levels of habitat quality due to little anthropogenic impacts. Habitat quality declined the most around the urban area from 2000 to 2020 and improved in the northeast. Judging from the changes in habitat quality at all levels, the management of rocky desertification in Huize County has had a slight effect. However, ecological and environmental protection still needs to be strengthened.
4.2.2 Habitat quality projections for 2030 and 2040 under different scenarios
The findings indicate the spatial arrangement of habitat quality in Huize County in 2030–2040 under the four scenarios is basically the same as that in 2000–2020, as depicted in Figure 7. Under the four scenarios of NDS, EDS, EPS, and HDS, the mean habitat quality by 2030 was 0.6793, 0.6793, 0.6800, and 0.6794, respectively, and by 2040 was 0.6787, 0.6784, 0.6798, and 0.6786, respectively. In the different scenarios for 2030 and 2040, there are differences in the average HQ of Huize County. Except for the EPS, habitat quality in urban areas under the other three scenarios showed a decreasing trend. Overall, decreasing HQ level mainly occurs in urban areas and areas where construction land is concentrated under the four scenarios. In contrast, increasing habitat quality mainly occurs in natural ecological habitats such as paddy fields, grasslands, and woodland types. In all four scenarios, the proportion of land area with unchanged habitat quality level is relatively high, above 97%. According to the four scenarios, the mean habitat quality is EPS > HDS > NDS > EDS. The area of low habitat quality areas increased by 0.11% under NDS between 2020 and 2040. This can be attributed to the fact that, under the state of nature, urbanization is continuously expanding the urban area, converting a significant portion of natural habitats, such as croplands and woodlands, into construction areas. Rapid economic development is accompanied by the rapid expansion of industrial scale and accelerated urban expansion, which results in an increase of 0.14% in low habitat quality areas under EDS. Under EPS, the lowest percentage of habitat quality decline occurred, and the highest percentage of habitat quality improvement occurred. The area of low habitat quality decreased, while the areas of higher habitat quality and high habitat quality areas increased by 0.06% and 0.08%, respectively. Under HDS, the area of low habitat quality areas increased by 0.12%, which is in the same range as NDS and EDS. In terms of habitat quality conditions and changes in each scenario, the EPS is most favorable to habitat quality in Wheeler County, and the EDS is the most threatening to habitat quality.
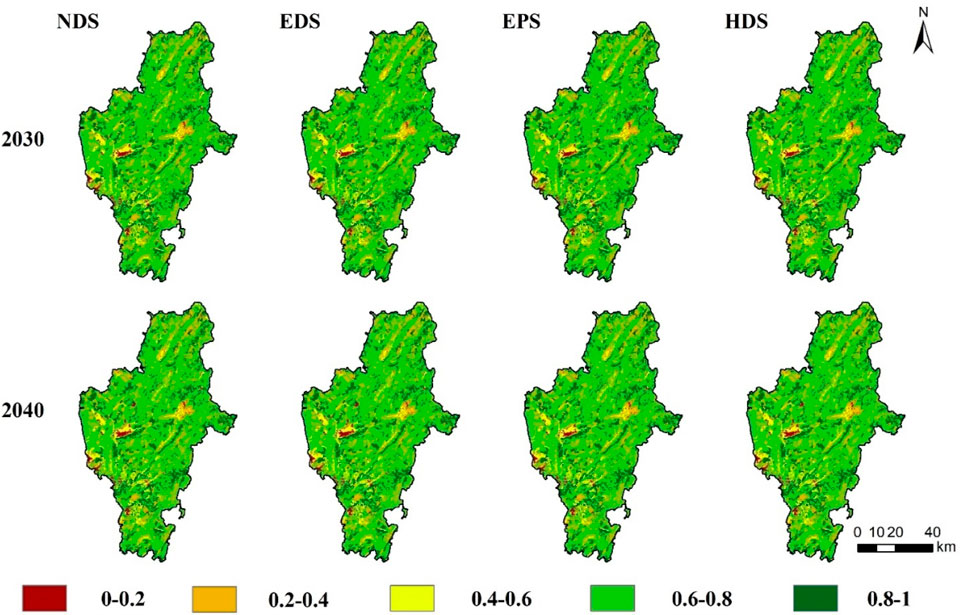
Figure 7. Huize County’s habitat quality prediction and spatial distribution under several scenarios.
4.2.3 Analysis of spatial autocorrelation in habitat quality
The study established a grid system with cells of 1 km × 1 km and computed the average habitat quality for each individual cell. Spatial autocorrelation analyses were conducted on the distribution patterns of habitat quality in 2000, 2010 and 2020, and the results showed that the global Moran’s I indicator of habitat quality in Huize County was 0.471 (Figure 8A), 0.453 (Figure 8B), and 0.457 (Figure 8C), respectively, which passed the significance test, indicating that habitat quality in Huize County has a strong positive spatial correlation and that the characteristics of spatial aggregation are relatively stable.
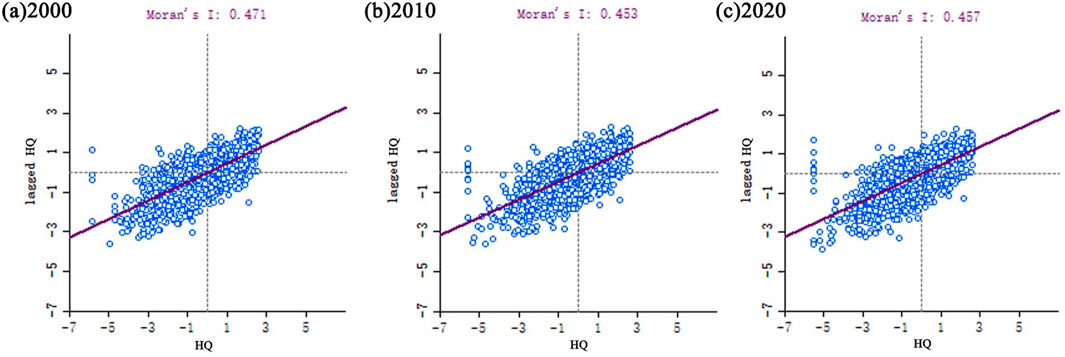
Figure 8. Huize County global spatial autocorrelation analysis of habitat quality. (A) 2000. (B) 2010. (C) 2020.
The results of LISA cluster plot analysis for Huize County in 2000 (Figure 9A), 2010 (Figure 9B), and 2020 (Figure 9C) show that the habitat quality is categorized into five distinct classifications. It can be concluded that habitat quality in Huize County is characterized by H-H and L-L clusters, which indicates a positive spatial autocorrelation. H-H clusters are found in grassland and woodland areas that have higher habitat quality, and L-L clusters are distributed around the construction land with poorer habitat quality. According to the statistical data on the quantity of grouped grids, it can be concluded that the number of H-L grids increased from 2000 to 2020, and the number of H-H, L-L, and L-H grids continued to decrease.
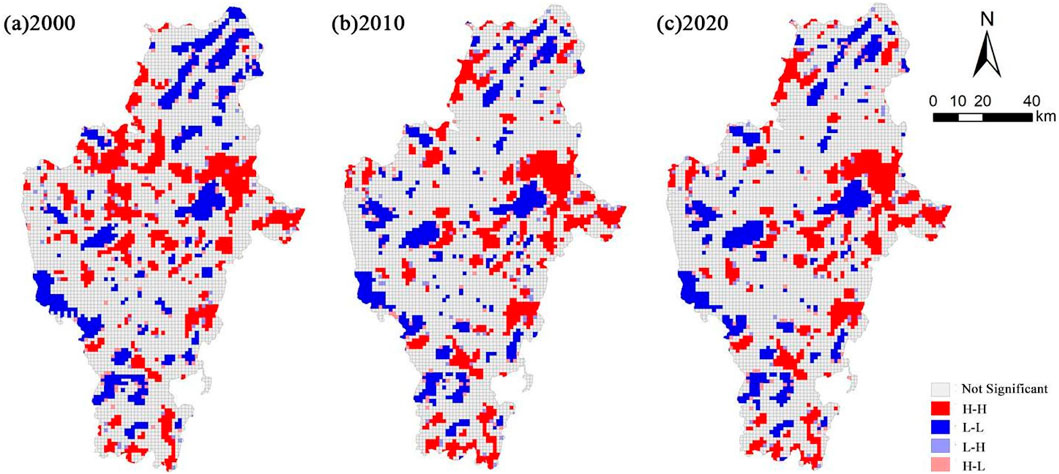
Figure 9. Localised spatial autocorrelation analysis of habitat quality in Huize County. (A) 2000. (B) 2010. (C) 2020.
4.3 Examination of the variables affecting the spatial variation in Huize County’s habitat quality
4.3.1 Driver one-factor detection analysis
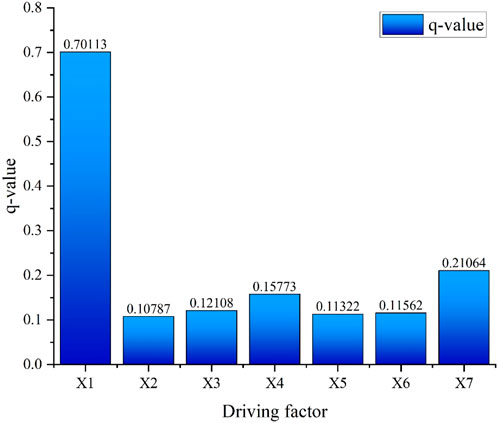
From the factor explanatory power q-value (Figure 10), Land use type (X1) > NDVI (X7) > Elevation (X4) > Air temperature (X3) > Slop (X6) > Population density (X5) > Precipitation (X2) in the degree of explanation of habitat quality of the impact factors in 2020. All results of the habitat quality driver detections passed the significance test of p < 0.05. Among them, 0.701 is the driving force of land use. This is the dominant factor affecting habitat quality, indicating the environmental impact of human activity. There are several land uses that affect habitat quality, including cropland, woodland, grassland, and construction land; areas that contain a higher proportion of woodland and grassland areas are rated higher for habitat quality; Changing areas of construction land are useful indicators of urbanization and expansion, as construction land and cropland may result in a lower habitat quality rating when they are combined with cropland. NDVI follows with a driving force of 0.211. The NDVI can be viewed as a vegetation factor, and vegetation can effectively sequester carbon and reduce soil erosion when growing in a suitable environment. The third strongest driver of habitat quality was elevation at 0.158. This indicates that changes in elevation may lead to changes in temperature, precipitation, and vegetation type. These changes directly affect species distribution and ecosystem structure. Temperature (0.121), slope (0.116), population density (0.113), and precipitation (0.108) were less powerful drivers but also contributed to habitat quality to some extent. Temperature and precipitation influence the growth of vegetation and the control of soil erosion by affecting water supply and evapotranspiration. Slope, which represents topography, can affect habitats by regulating ecological conditions such as surface temperatures and water storage capacities. Density of the population is an important indicator of human activity, and its level is related to the degree to which natural habitats are disturbed by human activity.
4.3.2 Driver interaction factor detection analysis
As shown in Table 4, the interactions between the drivers were all non-linearly enhanced and two-factor enhanced. Except for the interactions between land use and the other five drivers, population density and slope, population density and NDVI, all factors increased nonlinearly with one another, which were two-way augmented, with the two-way augmentation being greater than the nonlinear augmentation. Land use and other factor drivers exceeded 70%. These findings suggest that the kind of land use is the primary factor influencing the quality of the habitat. The kind of land use and the other variables interact strongly. Temperature ∩ slope (0.466), elevation ∩ slope (0.432), precipitation ∩ elevation (0.408), and elevation ∩ NDVI (0.462) were all greater than 0.4, and the two-factor interactions were enhanced to varying degrees, indicating that habitat quality was affected by multifactor interactions.
5 Discussion
5.1 Multi-scenario predictive assessment of land change and habitat quality
Although the application of the InVEST-HQ model has been relatively widespread (Chen C. et al., 2023; Yohannes et al., 2021; Yang et al., 2018), it is mostly an assessment of the historical status quo of habitat quality in the whole region, and there is insufficient research on the simulation and prediction of future multi-scenarios, which makes it difficult to meet the needs of spatial governance in the new era. The karst region of eastern Yunnan is an important socio-economic and ecologically fragile area (Zhang et al., 2024a), playing an important role in economic development and biodiversity conservation strategies (Zhao Z. et al., 2023), but literature involving habitat quality in the region is relatively rare, and in-depth exploration of the evolution mechanism and prediction and assessment of habitat quality in the region is needed to provide scientific reference for ecological and environmental governance and protection of karst land, as well as for the promotion of regional high-quality development. In this paper, changes in land use and habitat quality in Huize County from 2000 to 2020 are studied. The future evolution of land use patterns and habitat quality was analyzed in depth using the InVEST and FLUS models. The rate of decline in habitat quality slowed down from 2010 to 2020, and since the comprehensive management project of rocky desertification in karst areas was initiated by the state in 2008, the project has had a significant positive impact on the ecological environment of Huize County. However, despite the progress made in the management of rocky desertification areas in the county, it faces many challenges (Zhang G. et al., 2023). Among them, the large size of the rocky desertification area, coupled with the complex natural conditions and more prominent anthropogenic interference factors, has led to enormous difficulties in governance (Wang Y. et al., 2023). The areas with the worst habitat quality are built-up areas and agricultural areas, which is consistent with the findings of Zhang and Chen (2022) on the pattern of habitat quality in their study area, and the main reason may be that development activities such as land development, resource extraction, and industrial production have caused serious damage and pollution to the ecological environment, which triggered the loss of biodiversity and the decline of environmental quality (Yang H. et al., 2023). To improve habitat quality, land use planning and management must be further strengthened. Scientific and reasonable land use methods need to be adopted to minimize the negative impact on the ecological environment (Chen X. et al., 2023; Ma et al., 2023). The extent of urbanized land increased under all four scenarios projections, indicating that human activities have significantly changed land types through urbanization, agriculture, industry, infrastructure development, tourism development, and policy planning (Luan et al., 2023). Among the four scenarios, compared with the other three scenarios, the EPS is the most effective for ecological restoration in Huize County, which aligns with the findings reported by Fu Shaotong and colleagues (Fu et al., 2024), in which the area of scrub forests and sparse forested land increases and the area of urban and other built-up land decreases due to the fact that the focus is on the preservation and restoration of ecosystem functions in this scenario. This scenario can enhance the ecosystem’s stability and improve resistance to external pressures such as natural disasters and climate change (Zhang et al., 2017). It can also help protect the urban and rural ecological environment. It can promote sustainable development, encourage the establishment of ecological civilizations and sustainable green development, and maximize environmental benefits (Li et al., 2019). Consequently, more eco-friendly land use and resource management policies are adopted to reduce human activity’s impact on the ecosystem (Hou and Wu, 2024; Zhao L. et al., 2023). The biggest factor affecting habitat quality is land use type, which aligns with the discoveries made by Xie and Zhang (2023), as different land use types may bring different ecological pressures and resource utilization methods, which have significant effects on habitat quality. The results suggest that natural factors play a key role in habitat quality. Economic factors also significantly regulate and influence habitat quality (Li et al., 2022). Therefore, the synergistic effect between the factors should be considered comprehensively (Zhang et al., 2024b).
5.2 Research on mechanisms affecting habitat quality
Geodetector, a powerful tool in spatial analysis, was used in this study to effectively reveal geographical heterogeneity and identify differences in factors’ influence on target variables in different regions (Huang et al., 2021; Wang X. et al., 2023). This is done by quantifying the contribution of factors to geographic phenomena and spatial differentiation. In this study, seven factors, namely, land use type, precipitation, air temperature, elevation, population density, slope, and NDVI, were selected as driving factors to explore their influence on HQ in Huize County. These factors can have a direct impact on habitat resource availability and ecological stability, which in turn impacts HQ. Different types of land use can impact HQ in different ways. Land use type showed the strongest influence in single-factor exploration, indicating its significant effect on habitat quality spatial differentiation (Yue et al., 2024). Land use change is often the main driver of habitat quality change, especially in areas strongly disturbed by human activities (Yang L. et al., 2023; Liu et al., 2022). As a secondary influence, NDVI can indicate the health of ecosystems, in which high values are associated with healthy ecosystems. Changes in it can indicate how human activities influence HQ. Topographic factors modulate HQ spatial distribution to some extent. In addition, they may indirectly influence habitat quality by influencing climatic conditions and biodiversity (Ma et al., 2024). In addition to single-factor analyses, Geodetector played a crucial role in revealing interactions between multiple factors and quantifying their effects on spatial distribution (Zhang S. et al., 2023). This is an invaluable advantage in understanding complex geographical processes. It contributes to a more comprehensive understanding of spatial phenomena where multiple factors come together (Guo et al., 2022). In the interaction detection, the interaction between land use type and other factors showed the largest effect. This indicates that the combined effect of land use and natural factors such as climate and topography have a more complex and far-reaching impact on habitat quality. Increasing construction land may fragment habitats, which will increase the effects of precipitation and temperature changes on species survival (Liu et al., 2022). In addition, topographic structures, such as elevation and slope, act in synergy with land use types to influence erosion patterns, runoff patterns, and soil fertility, further complicating habitat management. As a result, interactions between different factors exceed simple additive effects (Guo et al., 2022). They enhance the overall impact of individual factors on HQ through the interplay of complex ecological mechanisms. Different types of land, such as grasslands and woodlands, were considered to improve HQ in the study area. A single factor, precipitation, had a marginal effect on HQ. However, the interaction with elevation had a significant effect, indicating that a number of factors interact to determine HQ (Wang Y. et al., 2023). This interaction effect reflects the synergy between human activities and the natural environment (Zhang et al., 2024a). It further emphasizes the need to consider multiple factors and their interactions comprehensively when carrying out habitat quality assessment and ecological conservation planning to develop more effective conservation strategies (Lv et al., 2023).
5.3 Recommendations for optimizing HQ
5.3.1 Restructuring of land use types
Based on the study on the dynamic evolution of land use and its corresponding changes in habitat quality, decreasing the occupation of ecological land near construction sites, such as forest, grassland, and water, as well as slowing down the expansion of construction sites, will result in higher HQ improvements in the study area (Zhang et al., 2022; Wu Z. et al., 2022). First, optimizing land use can improve the allocation of industrial space more rationally, reducing overreliance on construction land for economic development and minimizing environmental impact (Zhang et al., 2020). Additionally, reducing urban and construction encroachment on ecological land (e.g., forest lands and grasslands) can protect the ecosystem and maintain the region’s ecosystem balance (Zhou et al., 2020). Based on the simulation projections, construction land will continue to grow in all four scenarios between 2030 and 2040. Thus, Huize County should implement the forest and grassland protection system firmly based on strict control of the uncontrolled expansion of construction land in the upcoming round of planning.
5.3.2 Ecological restoration of low HQ areas
Considering areas with low HQ and areas with declining HQ under scenario modeling, adhere to an ecological priority and green development strategy (Song et al., 2020). Mountain, water, forest, field, and lake protection and restoration must be continuously promoted, and a reasonable ratio of construction land to green space and ecological reserves should be allocated for construction in newly renovated built-up areas (Gao et al., 2022). By scientifically dividing functional zones, industrial, residential, and commercial land uses are ensured not to encroach excessively on ecologically sensitive areas, especially wetlands, forests, and other areas with ecological significance (Chen et al., 2024). Green belts, pocket parks, and ecological corridors are among the green infrastructure to be constructed. Providing habitat connectivity, improving air quality, improving quality of life, and enhancing biodiversity in urban areas (Li et al., 2024; Zhang et al., 2024). Establish artificial afforestation and grass plantings to protect slopes, with special attention to drought and barren-resistant plant species, such as Amorpha fruticosa, Caragana korshinskii, Hippophae rhamnoides, etc., The use of biotechnology and engineering techniques enhances the fertility and water retention of soils, as well as promoting the growth of vegetation.
5.4 Limitations
In this study, 13 driving factors were identified, including elevation, slope, and aspect, from natural environmental and socio-economic factors to be input into the FLUS model. The lack of soil data in the model led to it ignoring soil characteristics when predicting land use changes, thereby affecting the accuracy and spatial heterogeneity of land use simulation. This weakened the model’s predictive ability. Soil type is a crucial factor in determining land suitability and influences land use type. In subsequent studies, soil data will be introduced and model parameters adjusted in order to improve the model. It is urgent to implement these improvements, as they will significantly enhance the accuracy and reliability of the model’s predictions and its effectiveness in land resource management and planning.
The InVEST model parameters were determined through parametric references to relevant literature and expert advice (Xiang et al., 2023), which may be applicable and reliable in their original study context. However, environmental conditions, ecological processes, and land-use practices may vary significantly across ecosystems and geographical regions, and the direct application of these parameters may ignore ecological characteristics and geographical differences between regions. This uncertainty may affect decision-makers assessments of ecosystem services and the effectiveness of management options, thus limiting the generalizability and reliability of the model for application in different regions. Future research should incorporate corrections based on this study with field sampling data to improve model parameter localization.
6 Conclusion
This paper uses InVEST (Integrated Valuation of Ecosystem Services and Tradeoffs) and FLUS (Fuzzy Land Use Simulation) models, which are widely used in environmental research, to compare and analyze the results of the predictive simulation of habitat quality in Huize County under four scenarios and the analysis of influencing factors, and draws the following conclusions:
(1) Medium-cover grassland and sparse woodland account for the largest proportion of land in Huize County. From 2000 to 2020, the land area designated for construction in Huize County experienced progressive growth. Most urban and rural settlement land is transformed from agricultural land (especially paddy fields). To change the land use structure, the return of farmland to forests, the cultivation of plantations, and the priority protection of grasslands and woodland patches are important measures.
(2) Huize County habitat quality has seen a consistent decline from 2000 to 2020. The spatial pattern exhibits a distribution characterized by low values in the urban area, high values in the periphery, low values in the southwest, and high values in the northeast. EPS and HDS are the optimal approaches for safeguarding habitat quality. As economic development is being promoted, it is important to take measures to ensure ecological protection, increase investment in ecology, and ensure the sustainability of ecosystems to minimize adverse environmental impacts.
(3) The habitat quality in Huize County is a complex issue, influenced by a confluence of natural and economic factors. Among these, the type of land use, elevation, and temperature stand out as the three variables with the most significant effects on habitat quality. Understanding and addressing these factors is crucial for any efforts to improve habitat quality. Ensure that land-use planning is strengthened, particularly in areas of mining and agricultural development, to protect ecosystems.
Data availability statement
The original contributions presented in the study are included in the article/supplementary material, further inquiries can be directed to the corresponding authors.
Author contributions
XL: Conceptualization, Data curation, Formal Analysis, Investigation, Methodology, Software, Validation, Visualization, Writing–original draft. SZ: Investigation, Writing–original draft. XnL: Supervision, Writing–review and editing. RC: Investigation, Writing–original draft. XH: Project administration, Supervision, Writing–review and editing. JP: Funding acquisition, Writing–review and editing.
Funding
The author(s) declare that financial support was received for the research, authorship, and/or publication of this article. This research was funded by the National Natural Science Foundation of China (No. 31901322).
Acknowledgments
The authors gratefully acknowledge the support of the funding.
Conflict of interest
The authors declare that the research was conducted in the absence of any commercial or financial relationships that could be construed as a potential conflict of interest.
Publisher’s note
All claims expressed in this article are solely those of the authors and do not necessarily represent those of their affiliated organizations, or those of the publisher, the editors and the reviewers. Any product that may be evaluated in this article, or claim that may be made by its manufacturer, is not guaranteed or endorsed by the publisher.
References
Akbari, A., Pittman, J., and Feick, R. (2021). Mapping the relative habitat quality values for the burrowing owls (Athene cunicularia) of the Canadian prairies using an innovative parameterization approach in the InVEST HQ module. Environ. Manage. 68 (3), 310–328. doi:10.1007/s00267-021-01502-w
Bełcik, M., Klimaszewski, K., Pełnia-Iwanicka, E., and Zajchowska, J. (2019). Testing the habitat suitability index for great crested newt in Central Poland. Ecol. Res. 34 (6), 711–717. doi:10.1111/1440-1703.12051
Boumans, R., Roman, J., Altman, I., and Kaufman, L. (2015). The multiscale integrated model of ecosystem services (MIMES): simulating the interactions of coupled human and natural systems. Ecosyst. Serv. 12, 30–41. doi:10.1016/j.ecoser.2015.01.004
Cai, Z., Zhang, Z., Zhao, F., Guo, X., Zhao, J., Xu, Y., et al. (2023). Assessment of eco-environmental quality changes and spatial heterogeneity in the yellow river delta based on the remote sensing ecological index and geo-detector model. Ecol. Inf. 77, 102203. doi:10.1016/j.ecoinf.2023.102203
Chang, J., Li, Q., Zhai, L., Liao, C., Qi, X., Zhang, Y., et al. (2024). Comprehensive assessment of rocky desertification treatment in Southwest China Karst. Land Degrad. Dev. 35, 3461–3476. doi:10.1002/ldr.5146
Chen, C., Liu, J., and Bi, L. (2023). Spatial and temporal changes of habitat quality and its influential factors in China based on the InVEST model. Forests 14 (2), 374. doi:10.3390/f14020374
Chen, X., Yu, L., Cao, Y., Xu, Y., Zhao, Z., Zhuang, Y., et al. (2023). Habitat quality dynamics in China’s first group of national parks in recent four decades: evidence from land use and land cover changes. J. Environ. Manage. 325, 116505. doi:10.1016/j.jenvman.2022.116505
Chen, X., Yu, L., Du, Z., Xu, Y., Zhao, J., Zhao, H., et al. (2022). Distribution of ecological restoration projects associated with land use and land cover change in China and their ecological impacts. Sci. Total Environ. 825, 153938. doi:10.1016/j.scitotenv.2022.153938
Chen, Y., Cheng, C., Xiong, K., Rong, L., and Zhang, S. (2024). Quantifying the biodiversity and ecosystem service outcomes of Karst ecological restoration: a meta-analysis of South China Karst. CATENA 245, 108278. doi:10.1016/j.catena.2024.108278
Chen, Z., Huang, M., Zhu, D., and Altan, O. (2021). Integrating remote sensing and a markov-FLUS model to simulate future land use changes in Hokkaido, Japan. Remote Sens. 13 (13), 2621. doi:10.3390/rs13132621
Chong, G., Hai, Y., Zheng, H., Xu, W., and Ouyang, Z. (2021). Characteristics of changes in karst rocky desertification in southtern and western China and driving mechanisms. Chin. Geogr. Sci. 31, 1082–1096. doi:10.1007/s11769-021-1243-3
D’Ettorre, U., Liso, I., and Parise, M. (2024). Desertification in karst areas: a review. Earth-Sci. Rev. 253, 104786. doi:10.1016/j.earscirev.2024.104786
Feng, D., Bao, W., Fu, M., Zhang, M., and Sun, Y. (2021). Current and future land use characters of a national central city in eco-fragile region—a case study in Xi’an city based on FLUS model. Land 10 (3), 286. doi:10.3390/land10030286
Fu, S., He, C., Ma, J., Wang, B., and Zhen, Z. (2024). Ecological environment quality of the Shanxi section of the Yellow River Basin under different development scenarios. Chin. J. Appl. Ecol. 35 (5), 1337–1346. doi:10.13287/j.1001-9332.202405.027
Gao, M., Hu, Y., and Bai, Y. (2022). Construction of ecological security pattern in national land space from the perspective of the community of life in mountain, water, forest, field, lake and grass: a case study in Guangxi Hechi, China. Ecol. Indic. 139, 108867. doi:10.1016/j.ecolind.2022.108867
Gomes, E., Inácio, M., Bogdzevič, K., Kalinauskas, M., Karnauskaitė, D., and Pereira, P. (2021). Future scenarios impact on land use change and habitat quality in Lithuania. Environ. Res. 197, 111101. doi:10.1016/j.envres.2021.111101
Guo, B., Yang, F., Fan, Y., and Zang, W. (2023). The dominant driving factors of rocky desertification and their variations in typical mountainous karst areas of southwest China in the context of global change. Catena 220, 106674. doi:10.1016/j.catena.2022.106674
Guo, L., Li, P., Zhang, J., Xiao, X., and Peng, H. (2022). Do socio-economic factors matter? A comprehensive evaluation of tourism eco-efficiency determinants in China based on the geographical detector model. J. Environ. Manage. 320, 115812. doi:10.1016/j.jenvman.2022.115812
Hall, L. S., Krausman, P. R., and Morrison, M. L. (1997). The habitat concept and a plea for standard terminology. Wildl. Soc. Bull. 25 (1), 173–182.
He, J., Huang, J., and Li, C. (2017). The evaluation for the impact of land use change on habitat quality: a joint contribution of cellular automata scenario simulation and habitat quality assessment model. Ecol. Model. 366, 58–67. doi:10.1016/j.ecolmodel.2017.10.001
He, N., Guo, W., Wang, H., Yu, L., Cheng, S., Huang, L., et al. (2023). Temporal and spatial variations in landscape habitat quality under multiple land-use/land-cover scenarios based on the PLUS-InVEST model in the Yangtze River basin, China. Land 12 (7), 1338. doi:10.3390/land12071338
Hou, Y., and Wu, J. (2024). Land-use and habitat quality prediction in the fen river basin based on PLUS and InVEST models. Front. Environ. Sci. 12. doi:10.3389/fenvs.2024.1386549
Huang, L., Du, Y., and Tang, Y. (2024a). Ecosystem service trade-offs and synergies and their drivers in severely affected areas of the Wenchuan earthquake, China. Land Degrad. Dev. 35, 3881–3896. doi:10.1002/ldr.5193
Huang, L., Tang, Y., Song, Y., Liu, J., Shen, H., and Du, Y. (2024b). Identifying and optimizing the ecological security pattern of the Beijing–Tianjin–Hebei urban agglomeration from 2000 to 2030. Land 13, 1115. doi:10.3390/land13081115
Huang, S., Xiao, L., Zhang, Y., Wang, L., and Tang, L. (2021). Interactive effects of natural and anthropogenic factors on heterogenetic accumulations of heavy metals in surface soils through geodetector analysis. Sci. Total Environ. 789, 147937. doi:10.1016/j.scitotenv.2021.147937
Ji, X., Sun, Y., Guo, W., Zhao, C., and Li, K. (2023). Land use and habitat quality change in the yellow river basin: a perspective with different CMIP6-based scenarios and multiple scales. J. Environ. Manage. 345, 118729. doi:10.1016/j.jenvman.2023.118729
Koo, H., Kleemann, J., and Fürst, C. (2020). Integrating ecosystem services into land-use modeling to assess the effects of future land-use strategies in northern Ghana. Land 9 (10), 379. doi:10.3390/land9100379
Li, H., Fang, C., Xia, Y., Liu, Z., and Wang, W. (2022). Multi-scenario simulation of production-living-ecological space in the Poyang lake area based on remote sensing and RF-markov-FLUS model. Remote Sens. 14 (12), 2830. doi:10.3390/rs14122830
Li, S., He, F., Zhang, X., and Zhou, T. (2019). Evaluation of global historical land use scenarios based on regional datasets on the Qinghai-Tibet area. Sci. Total Environ. 657, 1615–1628. doi:10.1016/j.scitotenv.2018.12.136
Li, T., Bao, R., Li, L., Tang, M., and Deng, H. (2023). Temporal and spatial changes of habitat quality and their potential driving factors in southwest China. Land 12 (2), 346. doi:10.3390/land12020346
Li, W., Kang, J., and Wang, Y. (2024). Effects of habitat fragmentation on ecosystem services and their trade-offs in Southwest China: a multi-perspective analysis. Ecol. Indic. 167, 112699. doi:10.1016/j.ecolind.2024.112699
Li, Y., Yu, M., Zhang, H., and Xie, Y. (2023). From expansion to shrinkage: exploring the evolution and transition of karst rocky desertification in karst mountainous areas of Southwest China. Land Degrad. Dev. 34, 5662–5672. doi:10.1002/ldr.4188
Liang, X., Liu, X., Li, X., Chen, Y., Tian, H., and Yao, Y. (2018). Delineating multi-scenario urban growth boundaries with a CA-based FLUS model and morphological method. Landsc. Urban Plan. 177, 47–63. doi:10.1016/j.landurbplan.2018.04.016
Lin, W., Sun, Y., Nijhuis, S., and Wang, Z. (2020). Scenario-based flood risk assessment for urbanizing deltas using future land-use simulation (FLUS): Guangzhou metropolitan area as a case study. Sci. Total Environ. 739, 139899. doi:10.1016/j.scitotenv.2020.139899
Liu, C., Wang, C., Li, Y., and Wang, Y. (2022). Spatiotemporal differentiation and geographic detection mechanism of ecological security in Chongqing, China. Glob. Ecol. Conserv. 35, e02072. doi:10.1016/j.gecco.2022.e02072
Liu, X., Liang, X., Li, X., Xu, X., Ou, J., Chen, Y., et al. (2017). A future land use simulation model (FLUS) for simulating multiple land use scenarios by coupling human and natural effects. Landsc. Urban Plan. 168, 94–116. doi:10.1016/j.landurbplan.2017.09.019
Liu, X., Wang, X., Chen, K., and Li, D. (2023). Simulation and prediction of multi-scenario evolution of ecological space based on FLUS model: a case study of the Yangtze river economic belt, China. J. Geogr. Sci. 33 (2), 373–391. doi:10.1007/s11442-023-2087-9
Luan, Y., Huang, G., and Zheng, G. (2023). Spatiotemporal evolution and prediction of habitat quality in Hohhot city of China based on the InVEST and CA-markov models. J. Arid. Land. 15 (1), 20–33. doi:10.1007/s40333-023-0090-8
Lv, Y., Xiu, L., Yao, X., Yu, Z., and Huang, X. (2023). Spatiotemporal evolution and driving factors analysis of the eco-quality in the lanxi urban agglomeration. Ecol. Indic. 156, 111114. doi:10.1016/j.ecolind.2023.111114
Ma, D., Huang, Q., Zhang, Q., Wang, Q., Xu, H., and Yan, Y. (2024). Evaluation of eco-environmental quality and analysis of driving forces in the yellow river delta based on improved remote sensing ecological indices. Stoch. Envi-ron Res. Risk Assess. 38 (8), 3199–3220. doi:10.1007/s00477-024-02740-0
Ma, L., Wang, L., Jia, Y., and Yang, Z. (2016). Arsenic speciation in locally grown rice grains from Hunan province, China: spatial distribution and potential health risk. Sci. Total Environ. 557–558, 438–444. doi:10.1016/j.scitotenv.2016.03.051
Ma, T., Liu, R., Li, Z., and Ma, T. (2023). Research on the evolution characteristics and dynamic simulation of habitat quality in the southwest mountainous urban agglomeration from 1990 to 2030. Land 12 (8), 1488. doi:10.3390/land12081488
Marques, J. C., Cunha, P. P., and Teixeira, Z. (2020). Ecosystem services as a resilience descriptor in habitat risk assessment using the InVEST model. Ecol. Indic. 115, 106426. doi:10.1016/j.ecolind.2020.106426
McDonald, R. I., Güneralp, B., Huang, C.-W., Seto, K. C., and You, M. (2018). Conservation priorities to protect vertebrate endemics from global urban expansion. Biol. Conserv. 224, 290–299. doi:10.1016/j.biocon.2018.06.010
Pan, L., Li, R., Shu, D., Zhao, L., Chen, M., and Jing, J. (2022). Effects of rainfall and rocky desertification on soil erosion in karst area of Southwest China. J. Mt. Sci. 19, 3118–3130. doi:10.1007/s11629-022-7458-7
Qian, C., Qiang, H., Qin, C., Wang, Z., and Li, M. (2022). Spatiotemporal evolution analysis and future scenario prediction of rocky desertification in a subtropical karst region. Remote Sens. 14, 292. doi:10.3390/rs14020292
Sallustio, L., De Toni, A., Strollo, A., Di Febbraro, M., Gissi, E., Casella, L., et al. (2017). Assessing habitat quality in relation to the spatial distribution of protected areas in Italy. J. Environ. Manage. 201, 129–137. doi:10.1016/j.jenvman.2017.06.031
Sherrouse, B. C., Semmens, D. J., and Clement, J. M. (2014). An application of social values for ecosystem services (SolVES) to three national forests in Colorado and Wyoming. Ecol. Indic. 36, 68–79. doi:10.1016/j.ecolind.2013.07.008
Song, S., Liu, Z., He, C., and Lu, W. (2020). Evaluating the effects of urban expansion on natural habitat quality by coupling localized shared socioeconomic pathways and the land use scenario dynamics-urban model. Ecol. Indic. 112, 106071. doi:10.1016/j.ecolind.2020.106071
Su, S., Xiao, R., and Zhang, Y. (2012). Multi-scale analysis of spatially varying relationships between agricultural landscape patterns and urbanization using geographically weighted regression. Appl. Geogr. 32 (2), 360–375. doi:10.1016/j.apgeog.2011.06.005
Tang, F., Fu, M., Wang, L., and Zhang, P. (2020). Land-use change in Changli county, China: predicting its spatio-temporal evolution in habitat quality. Ecol. Indic. 117, 106719. doi:10.1016/j.ecolind.2020.106719
Tang, J., Tang, X., Qin, Y., He, Q., Yi, Y., and Ji, Z. (2019). Karst rocky desertification progress: soil calcium as a possible driving force. Sci. Total Environ. 649, 1250–1259. doi:10.1016/j.scitotenv.2018.08.242
Terrado, M., Sabater, S., Chaplin-Kramer, B., Mandle, L., Ziv, G., and Acuña, V. (2016). Model development for the assessment of terrestrial and aquatic habitat quality in conservation planning. Sci. Total Environ. 540, 63–70. doi:10.1016/j.scitotenv.2015.03.064
Wang, H., Liu, W., Dai, G., Ma, Y., Yang, L., and Zhang, Z. (2024). The effectiveness of natural reserves from the perspective of habitat quality in the southern section of the hengduan mountains, southwestern China. J. Environ. Manage. 363, 121380. doi:10.1016/j.jenvman.2024.121380
Wang, X., Su, F., Yan, F., Zhang, X., and Wang, X. (2023). Effects of coastal urbanization on habitat quality: a case study in Guangdong-Hong Kong-Macao greater bay area. Land 12 (1), 34. doi:10.3390/land12010034
Wang, Y., Xu, D., and Li, L. (2023). Assessing the influences of natural and human factors upon desertification vulnerability in northern China during 1985–2010. Catena 233, 107529. doi:10.1016/j.catena.2023.107529
Wu, J., Luo, J., Zhang, H., Qin, S., and Yu, M. (2022). Projections of land use change and habitat quality assessment by coupling climate change and development patterns. Sci. Total Environ. 847, 157491. doi:10.1016/j.scitotenv.2022.157491
Wu Z., Z., Zhu, D., Xiong, K., and Wang, X. (2022). Dynamics of landscape ecological quality based on benefit evaluation coupled with the rocky desertification control in South China Karst. Ecol. Indic. 138, 108870. doi:10.1016/j.ecolind.2022.108870
Xiang, Q., Kan, A., Yu, X., Liu, F., Huang, H., Li, W., et al. (2023). Assessment of topographic effect on habitat quality in mountainous area using InVEST model. Land 12 (1), 186. doi:10.3390/land12010186
Xie, B., and Zhang, M. (2023). Spatio-temporal evolution and driving forces of habitat quality in Guizhou province. Sci. Rep. 13 (1), 6908. doi:10.1038/s41598-023-33903-8
Yang, H., Garousi, F., Wang, J., Cao, J., Xu, X., Zhu, T., et al. (2022). Land use effects on gross soil nitrogen transformations in karst desertification area. Plant Soil 475, 61–77. doi:10.1007/s11104-021-05021-9
Yang, H., Yu, J., Xu, W., Wu, Y., Lei, X., Ye, J., et al. (2023). Long-time series ecological environment quality monitoring and cause analysis in the dianchi lake basin, China. Ecol. Indic. 148, 110084. doi:10.1016/j.ecolind.2023.110084
Yang, L., Pan, S., Chen, W., Zeng, J., Xu, H., and Gu, T. (2023). Spatially non-stationary response of habitat quality to land use activities in world’s protected areas over 20 years. J. Clean. Prod. 419, 138245. doi:10.1016/j.jclepro.2023.138245
Yang, S., Zhao, W., Liu, Y., Wang, S., Wang, J., and Zhai, R. (2018). Influence of land use change on the ecosystem service trade-offs in the ecological restoration area: dynamics and scenarios in the Yanhe watershed, China. China. Sci. Total Environ. 644, 556–566. doi:10.1016/j.scitotenv.2018.06.348
Yang, Y. (2021). Evolution of habitat quality and association with land-use changes in mountainous areas: a case study of the taihang mountains in Hebei province, China. Ecol. Indic. 129, 107967. doi:10.1016/j.ecolind.2021.107967
Yohannes, H., Soromessa, T., Argaw, M., and Dewan, A. (2021). Spatio-temporal changes in habitat quality and linkage with landscape characteristics in the beressa watershed, blue nile basin of Ethiopian highlands. J. Environ. Manage. 281, 111885. doi:10.1016/j.jenvman.2020.111885
Yue, Z., Xiao, C., Feng, Z., Wang, Y., and Yan, H. (2024). Accelerating decline of habitat quality in Chinese border areas. Resour. Conserv. Recycl. 206, 107665. doi:10.1016/j.resconrec.2024.107665
Zhang, D., Huang, Q., He, C., and Wu, J. (2017). Impacts of urban expansion on ecosystem services in the beijing-tianjin-hebei urban agglomeration, China: a scenario analysis based on the shared socioeconomic pathways. Resour. Conserv. Recycl. 125 (C), 115–130. doi:10.1016/j.resconrec.2017.06.003
Zhang, G., Roslan, S. N. A., Quan, L., and Yuan, P. (2023). Simulation of spatiotemporal patterns of habitat quality and driving mechanism in Anhui province, China. Front. Environ. Sci. 11. doi:10.3389/fenvs.2023.1145626
Zhang, J., Liu, M., Liu, X., Luo, W., Wu, L., and Zhu, L. (2021). Spectral analysis of seasonal rock and vegetation changes for detecting karst rocky desertification in southwest China. Int. J. Appl. Earth Obs. Geoinformation 100, 102337. doi:10.1016/j.jag.2021.102337
Zhang, L., Fang, C., Zhao, R., Zhu, C., and Guan, J. (2023). Spatial-temporal evolution and driving force analysis of eco-quality in urban agglomerations in China. Sci. Total Environ. 866, 161465. doi:10.1016/j.scitotenv.2023.161465
Zhang, S., Wang, Y., Zhang, C., Wang, X., Li, C., Wu, Y., et al. (2023). Evaluation on the adaptability of yunnan karst ecosystems based on “rock-soil-water-vegetation.”. Ecol. Eng. 193, 107009. doi:10.1016/j.ecoleng.2023.107009
Zhang, S., Yang, P., Xia, J., Wang, W., Cai, W., Chen, N., et al. (2022). Land use/land cover prediction and analysis of the middle reaches of the Yangtze River under different scenarios. Sci. Total Environ. 833, 155238. doi:10.1016/j.scitotenv.2022.155238
Zhang, T., and Chen, Y. (2022). The effects of landscape change on habitat quality in arid desert areas based on future scenarios: tarim river basin as a case study. Front. Plant Sci. 13, 1031859. doi:10.3389/fpls.2022.1031859
Zhang, W., Pan, X., Liang, J., Zeng, J., and Song, C. (2024a). Study on the hydrogeological structure of a karst subterranean river and seepage of a karst reservoir: a case study of the yibasan reservoir in Yunnan province, China. Water 16 (1), 92. doi:10.3390/w16010092
Zhang, W., Xiong, K., Li, Y., Song, S., and Xiang, S. (2024b). Improving grassland ecosystem services for human wellbeing in the karst desertification control area: anthropogenic factors become more important. Sci. Total Environ. 946, 174199. doi:10.1016/j.scitotenv.2024.174199
Zhang, X., Song, W., Lang, Y., Feng, X., Yuan, Q., and Wang, J. (2020). Land use changes in the coastal zone of China’s Hebei Province and the corresponding impacts on habitat quality. Land Use Policy 99, 104957. doi:10.1016/j.landusepol.2020.104957
Zhang, X., Wan, W., Fan, H., Dong, X., and Lv, T. (2024). Temporal and spatial responses of landscape patterns to habitat quality changes in the poyang lake region, China. J. Nat. Conserv. 77, 126546. doi:10.1016/j.jnc.2023.126546
Zhao, L., Su, M., Wang, X., Li, X., Chang, X., and Zhang, P. (2023). Spatial–temporal evolution and prediction of habitat quality in Beijing–Tianjin–Hebei region based on land use change. Land 12 (3), 667. doi:10.3390/land12030667
Zhao, Z., Wang, J., Wang, L., Rao, X., Ran, W., and Xu, C. (2023). Monitoring and analysis of abandoned cropland in the karst plateau of eastern Yunnan, China based on Landsat time series images. Ecol. Indic. 146, 109828. doi:10.1016/j.ecolind.2022.109828
Zhou, Y., Li, X., and Liu, Y. (2020). Land use change and driving factors in rural China during the period 1995-2015. Land Use Policy 99, 105048. doi:10.1016/j.landusepol.2020.105048
Keywords: land us, habitat quality, InVEST model, FLUS model, multi-scenario projections, spatial autocorrelation analysis, geodetector
Citation: Li X, Zhang S, Li X, Chen R, Huang X and Peng J (2024) Multi-scenario simulation and optimization of habitat quality under karst desertification management. Front. Environ. Sci. 12:1495262. doi: 10.3389/fenvs.2024.1495262
Received: 12 September 2024; Accepted: 22 October 2024;
Published: 31 October 2024.
Edited by:
Sérgio António Neves Lousada, University of Madeira, PortugalReviewed by:
Duanqiang Zhai, Tongji University, ChinaMiao Liu, Chinese Academy of Sciences (CAS), China
Yi Tang, Institute of Disaster Prevention, China
Copyright © 2024 Li, Zhang, Li, Chen, Huang and Peng. This is an open-access article distributed under the terms of the Creative Commons Attribution License (CC BY). The use, distribution or reproduction in other forums is permitted, provided the original author(s) and the copyright owner(s) are credited and that the original publication in this journal is cited, in accordance with accepted academic practice. No use, distribution or reproduction is permitted which does not comply with these terms.
*Correspondence: Xiaoyuan Huang, aHh5MjFjbkBzd2Z1LmVkdS5jbg==; Jiansong Peng, cGpzQHN3ZnUuZWR1LmNu
 Xiang Li
 Shunmin Zhang1
 Xiaona Li