- Research Institute of Resource-Based Economic Transformation and Development, Shanxi University of Finance and Economics, Taiyuan, China
As rapid urbanization challenges urban ecosystem stability, understanding the relationship between manufacturing agglomeration (MA) and urban ecological resilience (UER) has become increasingly critical. This study examines how MA influences UER in China’s Yangtze River Delta region, employing dynamic spatial panel models to analyze prefecture-level panel data from 2003 to 2020. Our findings reveal an inverted U-shaped relationship between MA and UER, with significant spatial spillover effects. Specifically, moderate levels of MA enhance UER through improved resource efficiency and technological innovation, while excessive agglomeration leads to environmental degradation. The study also identifies green technological innovation as a critical mediating mechanism in this relationship. These findings contribute to theoretical understanding and policy formulation for sustainable urban development.
1 Introduction
Rapid urbanization has put tremendous pressure on urban ecosystems (Grimm et al., 2008), with recent studies highlighting the increasing environmental challenges posed by industrial development and technological changes (Zhao et al., 2024; Chen et al., 2024). This pressure has made urban areas increasingly vulnerable to environmental disturbances, affecting their ecological stability and development sustainability (Li et al., 2022). Complex urban ecological resilience (UER)—the ability to absorb, adapt to, and recover from shocks while maintaining key functions (Meerow et al., 2016)—is shaped by ecological factors and socioeconomic structures and processes (Folke et al., 2010). Enhancing UER has thus become a critical challenge for sustainable urban development worldwide (Bai et al., 2018).
Among the various socioeconomic factors influencing UER, the spatial concentration of industrial activities, particularly manufacturing agglomeration (MA), has garnered increasing scholarly attention (Wang and Zhou, 2021). This attention stems from the complex and often contradictory effects of MA on urban environments. On the one hand, MA can generate negative externalities through pollution and resource depletion, potentially undermining the resistance and recoverability of urban ecosystems. On the other hand, MA may foster positive effects through knowledge spillovers and technological innovations, potentially enhancing cities’ adaptability to environmental challenges. The interplay between these competing forces necessitates a nuanced understanding of the MA-UER relationship.
The Yangtze River Delta region (YRDr) presents a compelling case study to examine this relationship. As a pioneer of China’s economic development, the YRDr accounts for a quarter of the country’s total economic output and stands as one of China’s most economically vibrant, globalized, and innovative regions. However, the rapid expansion of manufacturing activities has significantly pressured the region’s ecological environment. This challenge has gained particular salience, given the Chinese government’s increasing emphasis on promoting ecological civilization and high-quality development (State Council of China, 2019). The Outline of the Plan for the Integrated Development of the YRDr, issued by the Central Committee of the Communist Party of China (CPC) and the State Council in 2019, explicitly prioritizes ecological protection and emphasizes strengthening the ecological foundation for green development.
Understanding the relationship between MA and UER is crucial for promoting sustainable development in the YRDr. However, existing empirical evidence on this relationship remains inconsistent and inconclusive. Moreover, while previous studies have examined various aspects of MA and environmental impacts, few have systematically investigated the spatial spillover effects and underlying mechanisms MA influences UER, particularly in rapidly developing regions like the YRDr.
This research makes several contributions to the literature. First, by focusing on the YRDr, we comprehensively analyze MA’s impact on UER in a region that exemplifies the challenges and opportunities of balancing industrial development with ecological resilience. Second, we employ dynamic spatial panel models to examine both the short-term and long-term effects of MA on UER. This methodological approach allows us to capture the complex temporal and spatial dimensions of the MA-UER relationship. Finally, we investigate the mediating role of green technological innovation in the MA-UER relationship, offering insights into the mechanisms through which industrial agglomeration might contribute to environmental sustainability.
The findings of this study have important implications for regional development policies and environmental governance. By understanding how MA affects UER through various channels and across different spatial scales, policymakers can better design interventions that promote industrial development while enhancing urban ecological resilience. This is particularly relevant for regions like the YRDr seeking to achieve high-quality, sustainable development in an increasingly complex economic and environmental landscape.
2 Related literature review
Regarding the theoretical connotation of ecological resilience, in the early 21st century, Holling pioneered the idea of resilience into social-ecological system research, defining it as the ability of social-ecological systems to cope with external perturbations and to improve system functions (Holling, 1973). With the gradual extension of related research from natural ecology to human ecology, the idea of resilience has also been expanded to the urban field, and in general, a certain consensus has been reached on the definition of UER, which includes the coordination and organizational capacity of the urban system itself and its ability to resist and recover from external uncertain risks. Since then, scholars around the world have successively conducted qualitative research on ecological resilience in terms of development mechanisms, paths and influencing factors (Meerow et al., 2016; Wang et al., 2018; Wang et al., 2024a), and have made a comprehensive study on the theoretical framework of UER (Adger, 2000; Li and Wang, 2023), comprehensive measurement, driving mechanisms and barriers (Fu et al., 2023) have been studied.
At present, academic research on MA has been relatively affluent. Academics have investigated the connection between MA and local environmental development and green efficiency from several angles (Zheng and Lin, 2018; Wang et al., 2024b; Wu et al., 2024a). Some studies have argued that MA brings congestion effects (Andersson and Loof, 2011; Lu et al., 2021) and exacerbates environmental pollution in the region (Verhoef and Nijkamp, 2002). Through spatial spillover effects, the surrounding cities’ manufacturing sector will impact any city’s MA and environmental pollution. Agglomeration and contamination of the environment through spatial spillover effects in adjacent cities (Cheng, 2016). On the other hand, some research offers an alternative perspective, contending that MA can enhance environmental contamination (He, 2006; Zeng and Zhao, 2009) and foster innovation through the diffusion of information and technology, ultimately leading to an improvement in environmental quality (Dong et al., 2012). In addition, studies on the dual role of the agglomeration effect and the crowding effect of MA, and regional environmental development present a non-linear relationship. There is an apparent inverted “U” curve relationship between MA and regional environmental pollution (Wang and Wang, 2019) and a positive “U” relationship with urban green efficiency (Yuan et al., 2020).
In conclusion, despite the fruitful results of relevant studies focusing on MA and UER, only some have included MA and UER in the same analytical framework. In addition, existing studies have mainly analyzed at the provincial level. Therefore, considering the region’s comparative advantages, more studies and analyses of UER at the prefecture-level are needed. In addition, existing studies have analyzed the impact of MA on UER in the region from a single perspective, without including the utility of MA’s impact on UER in the surrounding regions. The empirical results of this paper provide a new empirical basis for the current YRDr to promote the cooperation between ministries and provinces in a more targeted way from its advantages and also provide a new reference for government departments to make full use of the collaboration between ministries and provinces to drive the sustainable development of the region in the new period.
3 Conception framework
3.1 Direct effect of MA to influence UER
MA refers to the high concentration of manufacturing and relevant industries in a geographical region. The theoretical foundation for understanding its impact on urban ecological resilience (UER) stems from the new economic geography theory, which emphasizes the role of agglomeration externalities in shaping regional environmental outcomes. These externalities manifest through scale and scope effects, creating complex dynamics between industrial concentration and ecological resilience (Hong et al., 2020).
The primary mechanism through which MA influences UER operates via several interconnected channels. At the infrastructure level, enterprises within agglomerated areas can share common facilities and services, promoting the development of local supporting industries while reducing fixed-cost investments and production costs. This shared resource utilization enhances economic efficiency and significantly impacts environmental management through coordinated infrastructure development. Moreover, MA affects regional development through external economies of scope, facilitating the division of labour and collaboration among enterprises. This collaboration leads to reorganising and optimising regional production systems, elevating specialization levels and potentially supporting more effective environmental practices through improved coordination and resource optimization. However, expanding production scale and increased enterprise productivity associated with rising MA levels can lead to heightened energy consumption, potentially compromising regional environmental quality. Therefore, understanding the degree of MA is crucial when analyzing its effects on UER.
The relationship between MA and UER demonstrates distinct characteristics across different development stages, suggesting a non-linear pattern. Enterprises prioritize economic benefits over environmental quality in regions with low MA levels, implementing individual and often inadequate pollution treatment activities. This fragmented approach to environmental management results in suboptimal outcomes, where adverse environmental impacts outweigh the positive externalities of scale economies, technological spillovers, and knowledge sharing. During this initial phase, the environmental burden is exacerbated by limited investment in environmental protection infrastructure, inefficient resource utilization due to lack of coordination, and the predominance of energy-intensive, highly polluting production processes.
As MA reaches more advanced stages, several transformative mechanisms emerge to enhance UER. The industrial structure gradually shifts from energy-intensive and highly polluting heavy industries toward technology-intensive, green, and intelligent manufacturing. This structural transformation is driven by increased competition, enhanced innovation capabilities through knowledge spillovers, and greater availability of specialized services. Higher agglomeration levels facilitate more sophisticated environmental management practices through collective infrastructure development, shared monitoring systems, and coordinated pollution control efforts. The concentration of economic activity also enables the development of industrial symbiosis and circular economy practices, leading to more efficient resource utilization and improved environmental performance.
3.2 Mediating effect of MA to influence UER
Green Technology Innovation (GTI) is defined as innovative technologies, processes, or products designed to mitigate pollutant emissions and optimize energy consumption (Lv et al., 2021; Bai et al., 2023). In recent years, digital transformation has significantly enhanced the development of GTI (Wu et al., 2024b), making it a critical component in global environmental governance and sustainable development (Lin et al., 2023; Jiao et al., 2023). By incorporating digital technologies and green innovations, GTI aims to substantially reduce environmental risks and maximize resource utilization efficiency throughout the product lifecycle (Yua and Liub, 2022). Recent empirical evidence suggests that digital-driven GTI has become increasingly influential in minimizing adverse impacts on ecosystems, particularly in regions with high levels of manufacturing agglomeration (Hu et al., 2024; Zhang et al., 2024).
The mechanism through which MA influences UER via GTI is multifaceted. Primarily, MA engenders high-density innovation networks that facilitate the dissemination and exchange of tacit knowledge. This knowledge spillover effect cultivates a fertile environment for GTI, catalyzing the innovation and diffusion of green technologies. Furthermore, the scale economies generated by MA enhance energy utilization efficiency and expand market opportunities and resource availability for GTI. Empirical evidence suggests that innovation activities exhibit heightened intensity within industrial agglomeration zones. These economies of scale and scope reduce green technologies’ research, development, and implementation costs, accelerating their commercialization trajectory.
The continuous progression of green technologies has precipitated a structural transformation in regional industries, characterized by a shift from low-value-added, pollution-intensive models towards high-value-added, environmentally sustainable practices. This transition attenuates environmental degradation (Fan et al., 2024) and augments resource utilization efficiency, fostering optimization and upgrading industrial structures. The related variety theory provides a theoretical underpinning for elucidating this phenomenon, positing that related yet differentiated industrial structures enhance regional economic adaptability and resilience. Propelled by GTI, traditional industries undergo technological upgrades and green transformations, forging complementary and synergistic relationships with emergent green sectors. This evolution engenders novel avenues for economic growth and bolsters regional ecological resilience.
Through these mechanisms, GTI exerts multifaceted positive impacts on UER. First, it stimulates the proliferation of nascent green industries, thereby diversifying the urban industrial landscape. This aligns with the tenets of related variety theory, underscoring the significance of industrial structure diversification in fortifying regional economic adaptability and resilience. Second, GTI enhances the overall innovation capacity of urban centers, augmenting their resilience to exogenous shocks. Scholarly research indicates that the resilience of regional innovation systems is instrumental in sustaining long-term economic growth trajectories. Moreover, GTI improves resource utilization efficiency, mitigating urban dependence on specific resources and enhancing urban resource security. This phenomenon resonates with ecological modernization theory, which emphasizes the pivotal role of technological innovation in achieving synergistic outcomes between environmental stewardship and economic development.
In conclusion, the intricate interplay between MA, GTI, and UER delineates a complex yet promising pathway toward sustainable urban development. By leveraging the agglomeration advantages of manufacturing clusters to foster green technological innovations, cities can enhance their economic resilience while advancing environmental sustainability objectives. This synergistic approach addresses immediate environmental concerns and positions urban economies for long-term, sustainable growth in an increasingly resource-constrained and environmentally conscious global context.
4 Research design
4.1 Models
4.1.1 Spatial panel model
Before proceeding with the empirical analysis, we must address the critical statistical assumptions underlying our spatial econometric models. First, we construct the spatial weights matrix based on economical contiguity, Furthermore, for model specifications, we assume that both the spatial lag coefficient (
The subscripts i and t represent the prefecture-level cities and the year, respectively;
Consider that interregional activity does not occur in isolation and can be influenced by neighbouring areas due to interaction effects. In addition, considering that in economic reality, UER will be affected by the previous period’s level, there is time inertia, and the lag term can better overcome the endogeneity problem caused by omitted variables. Based on this, this paper extends Formula 1 to test the spatial spillover effect of MA using a spatial dynamic econometric model. The model is as follows:
where
4.1.2 Mediating effect model
To further explore the influence mechanism of MA on UER, this paper refers to the classic mediation effect model (Chen and Lee, 2020) to test the mediation effect of GTI in MA and UER from green utility model patents (UtyGTI) and green invention-based patents (InvGTI):
In the context of this analysis, the paper redefines MA as X, and the process of GTI as M in Equation 3. To comprehensively assess the intricate dynamics between these elements, the study integrates a range of additional factors into the mediating effect model. These include control variables that capture other relevant influences, time-lagged terms of the explained variable (Y) to account for temporal continuities, and spatial-lagged terms of all variables to address the spatial dependencies and interactions among the units of analysis.
4.2 Variable selection
4.2.1 Explained variable
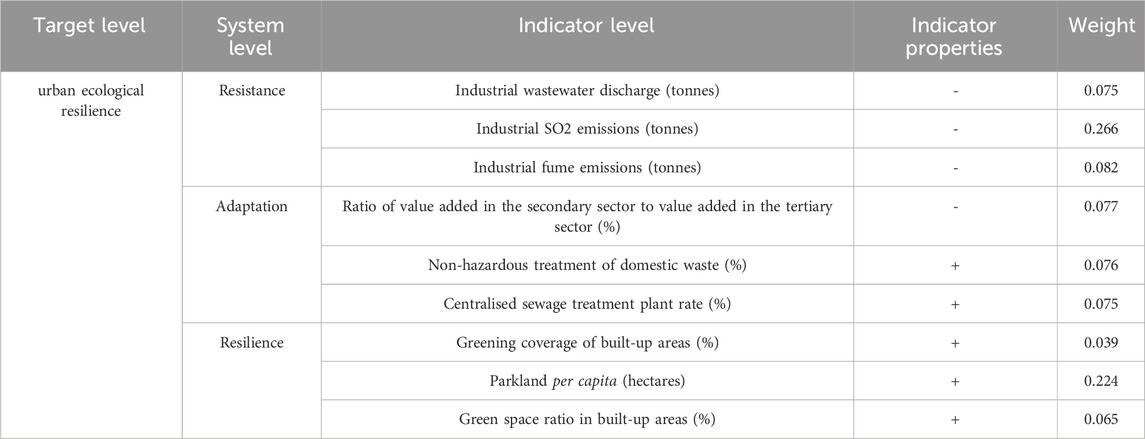
Following the principles of accessibility, comprehensiveness and comparability of the construction of the indicator system, combining the connotation of UER and referring to the results of previous studies (Martin and Sunley, 2015; Wu et al., 2020) this paper is based on the resistance-adaptation-resilience framework to construct a UER level evaluation index system in Table 1. This UER capacity characterizes the vulnerability and sensitivity of the city when it is impacted, the urban ecological adaptive capacity that characterizes the level of adjustment of the city when it faces disturbances, the urban ecological resilience capacity that embodies the speed of recovery and the degree of restoration of the city after experiencing perturbations, are included in the unified index system. Due to the different indicator units, this paper standardizes the individual indicators and then uses the entropy method Topsis to calculate the ecological resilience level of each city.
4.2.2 Core explanatory variable
Since location entropy is conducive to eliminating endogenous effects due to regional scale differences (Zheng and Lin, 2018), this study employs location entropy to quantify the degree of manufacturing agglomeration within prefecture-level cities in YRDr.
4.2.3 Mediating variable
As a quantitative tool, green patent application data can more intuitively measure the output of GTI activities (Shen et al., 2021). Compared with the number of patents granted, the number of patent applications reflects the current trend of technological innovation. It allows us to examine the impact of MA on the output of GTI activities in cities based on a more time-sensitive perspective. Therefore, this paper uses the Wanfang Data Knowledge Service Platform as the data source to obtain and construct a spatiotemporal database of green patent applications at the prefecture-level city level in the YRDr, and aggregate the total number of green invention patents and green utility model patents filed to assess the level of GTI, the unit of which is 1,000 pieces.
4.2.4 Control variables
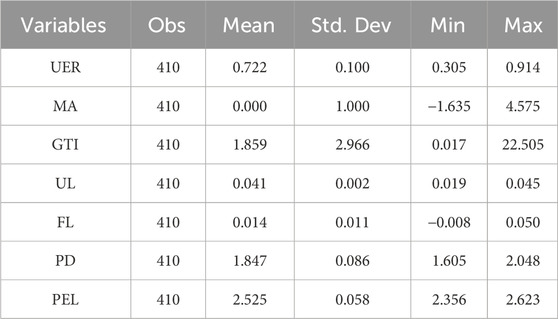
To minimize the potential issue of omitted variable bias beyond the core and mechanism variables, this study draws on relevant literature and economic theory (Ma et al., 2024; Jiang et al., 2024), incorporating the following control variables into the model: including urbanization level (UL), measured by the ratio of the urban resident population to the total resident population; financial level (FL), measured as the logarithm of total deposits at the end of the year in regional financial institutions; population density (PD), calculated as the logarithm of the total year-end population of each city divided by its administrative area size; and the primary education level (PEL): expressed as the logarithm of the number of people enrolled in primary school. To mitigate potential multicollinearity between MA and its quadratic term, we applied standardization to both MA and MA2. The statistical characteristics of the main variables are shown in Table 2.
5 Empirical research and discussion
5.1 The influence of MA on UER
5.1.1 Spatial correlation test
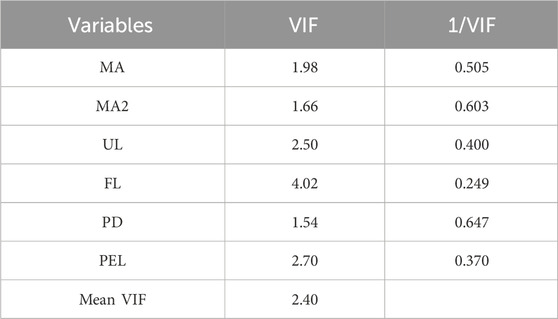
Before proceeding with the empirical analysis, we conduct multicollinearity diagnostics for our model. Table 3 presents the results of VIF (Variance Inflation Factor) tests after centering the variables. The VIF test results suggest no severe multicollinearity problems in the model, as all VIF values are well below the conventional threshold of 5.
Because traditional panel econometric model estimates ignore possible spatial spillovers, they are prone to biased error in the results. To assess the presence of spatial correlation between MA and UER, this paper employs the global Moran’s I test. Subsequently, this paper refers to Equations 2, 4 in turn through the LM test, the RLM test, the WALD test and the Hausman test, and finds that all the tests passed the significance test, so this paper adopts the fixed effects of the spatial Durbin model (SPDM).
5.1.2 Spatial regression results
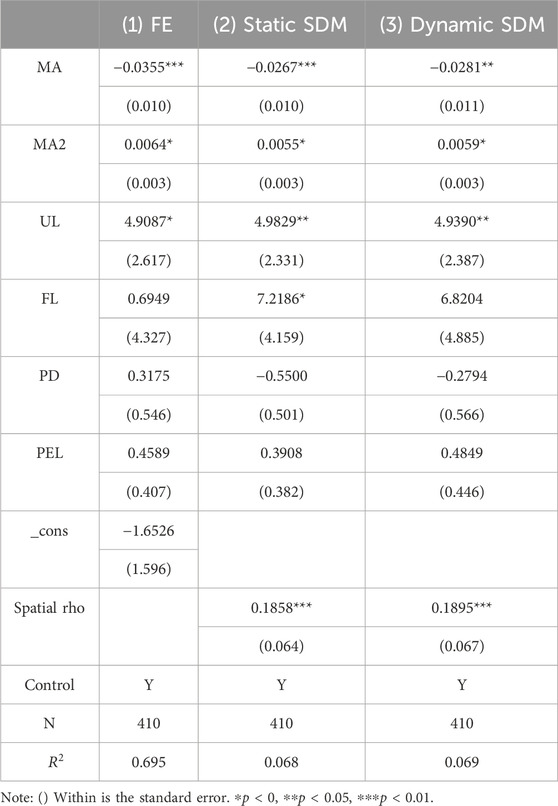
In addition to using the dynamic SPDM model, this paper reports the FE and static SAR models’ results. Before interpreting the results, we verify the statistical assumptions in Section 4.1. As shown in Table 4, the estimated spatial lag coefficient (
The coefficient of the primary term of MA estimated by the FE model in the model (1) is significantly negative at the 1% level. The coefficient of the secondary term is significantly positive at the 1% level, which indicates that there is an apparent positive U-shaped relationship between MA and UER, i.e., with the increase of the level of MA, the impact of the MA on the UER will be changed from negative to positive. That is the impact of MA on UER shifts from negative to positive as the level of MA increases. Initially, the negative impact of MA on UER may reflect the early-stage environmental pressures associated with manufacturing agglomeration, such as increased pollution, resource depletion, and ecosystem disruption. As MA levels increase, the positive impact likely stems from technological advancements, improved environmental management practices, and the adoption of cleaner production methods, ultimately enhancing the city’s ecological resilience. The coefficients of the primary and secondary terms of MA estimated by the static SPDM and dynamic SDM models in models (2) and model (3) also passed the 10% significance test, which is consistent with the estimation results of the non-spatial econometric model.
Further analysis of the coefficients of MA in the model reveals that the coefficients of the primary term and the coefficients of the quadratic term of MA in model (1) are more significant than the coefficients of MA in models (2) and (3), which suggests that if spatial correlation and endogenous correlation are ignored, the impact of MA on UER may be overestimated. This overestimation highlights the importance of considering spatial spillover effects in assessing the impact of MA on UER. It suggests that a city’s ecological resilience is influenced by its manufacturing agglomeration and neighbouring areas, emphasizing the need for regional coordination in environmental policies and industrial planning. Therefore, the results of the subsequent analyses in this paper are based on the dynamic SPDM model that considers the explanatory variables’ endogeneity, spatial correlation and time lag effect.
5.1.3 Spatial effect decomposition
To measure the impact of MA on UER, this paper carried out a spatial effect decomposition, and the results of the effect Decomposition for Dynamic SPDM are shown in Table 5. In the short term, the coefficient of MA is −0.0274 and MA2 is 0.0071, indicating significant spatial linkage effects. In the long run, the coefficient of MA is −0.0275 and MA2 is 0.0071. The results show that both MA and MA2 are significant at the 5% level in both periods, indicating the stability of MA’s impact on UER over time. The inflection points are 1.930 and 1.937 for short-term and long-term respectively, suggesting a consistent inverted U-shaped relationship between MA and UER. The increased values of spatial effects from short-term to long-term (such as UL from 4.2986 to 4.3481, FL from 5.4896 to 5.6051) suggests that over time, the environmental practices and policies associated with MA have an even more pronounced impact on the broader region. This could be attributed to the gradual diffusion of eco-friendly technologies and management practices across cities and the cumulative effects of environmental policies on regional ecosystems.”
The analysis further delineates that MA impedes UER when its level is below 1.930 in the short term, suggesting a threshold effect where MA initially acts as a barrier to UER. Conversely, once MA surpasses this threshold, it markedly enhances UER, illustrating a transformative shift in its impact. Similarly, as presented in Table 5, long-term effects also exhibit an inverted U-shaped relationship between MA and UER, with the long-term inflection point slightly higher at 1.937 compared to the short-term. This consistent inverted U-shaped relationship across both time frames underscores the nuanced dynamics between MA and UER. Notably, the higher inflection point in the long-term analysis (1.937 versus 1.930) indicates that the beneficial impacts of MA on UER are sustained longer over extended periods. This temporal shift suggests that the positive contributions of MA to UER become more enduring as the temporal horizon extends, affirming the stable and evolving nature of this relationship.
5.1.4 Robustness test
The previous empirical analyses of the benchmark regression used a model that controls for regional time and regional fixed effects, which, to a specific extent, controls for the impact of omitted variable factors that may come from different levels. To further verify and enhance the reliability of the estimation results, this paper will use the following methods to conduct the robustness test based on applying control variables.
5.1.4.1 Modification of the spatial weight matrix measurement method
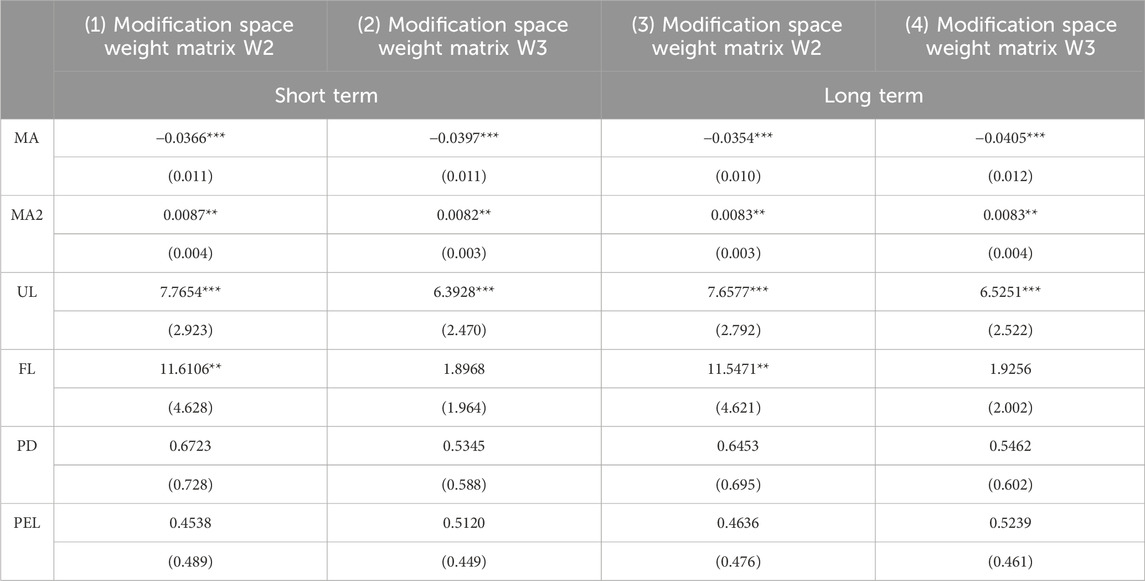
Drawing upon the research of Feng et al. (2019) and Han et al. (2018), this study employs the SPDM, utilizing both a neighborhood spatial weight matrix (W2) and an inverse squared geographical distance spatial weight matrix (W3) to reanalyze the impact of MA on UER. This approach facilitates the validation of the conclusion’s robustness. Table 6 indicates that irrespective of whether the analysis is conducted over the short or long term, a significant positive U-shaped relationship persists between MA and UER both within and outside the region. The estimated coefficients for other control variables remain primarily consistent with preliminary findings, suggesting that alterations in the spatial weight matrix measurement methodology exert minimal influence on the core conclusions of this paper.
5.1.4.2 Adding control variables
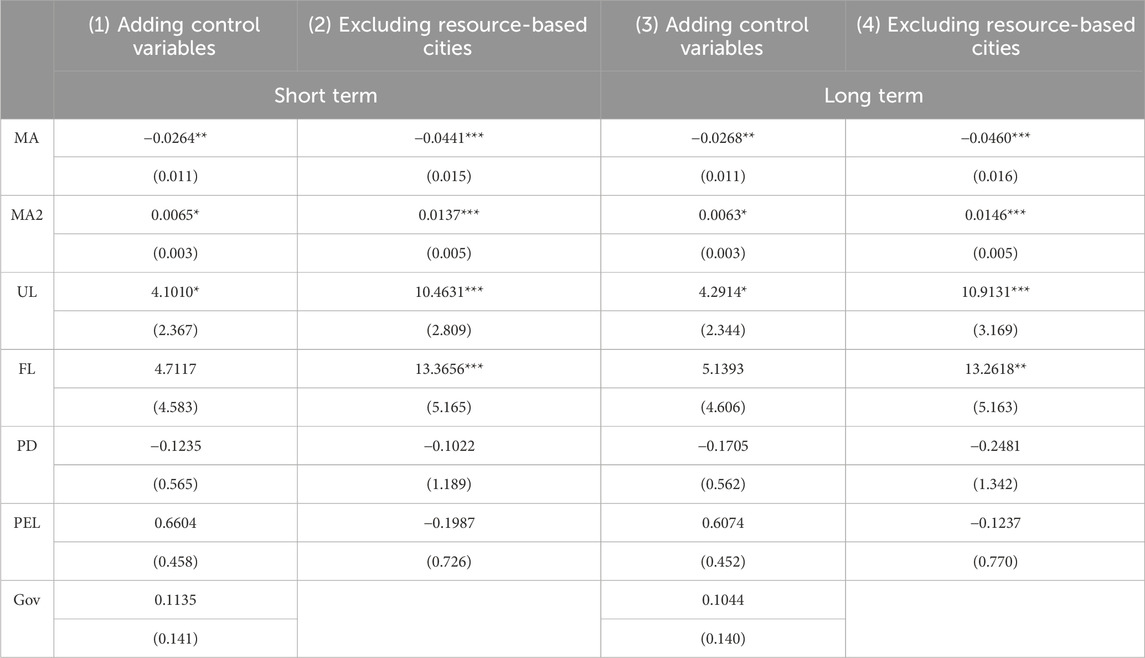
Governments can formulate appropriate regional policies and differentially allocate resources to continuously optimize urban ecological resilience. Thus, based on the baseline model, this paper adds the level of government intervention (gov) and measures it as the ratio of local government fiscal expenditure to gross urban product. According to the results presented in model (1) and model (3) within Table 7, incorporating the government intervention variable did not alter the established positive U-shaped relationship between MA and UER, reinforcing the robustness and validity of the principal findings in the face of additional variable analysis.
5.1.4.3 Excluding resource-based cities
Manufacturing industries tend to be resource-intensive, with higher energy consumption and pollutant emissions in production, significantly affecting the coordinated development of the region. This paper excludes resource-based cities from the sample to mitigate the impact of sample selection bias. Following the guidelines of the “National Sustainable Development Plan for Resource-based Cities” issued by the State Council, an analysis of the relationship between MA and UER in non-resource-based cities within the YRDr was conducted. The results from model (2) and model (4) in Table 7 demonstrate a significant positive U-shaped relationship between MA and UER, further attesting to the reliability of the core conclusions of this study.
5.2 Mediating effect of GTI
The above theoretical analysis indicates that GTI mediates between MA and UER. This paper employs a classical mediation effect model to test whether MA indirectly influences UER through GTI empirically. A dynamic Spatial Panel Data Model (SPDM) is utilized for parameter estimation to ensure consistency and comparability of the results.
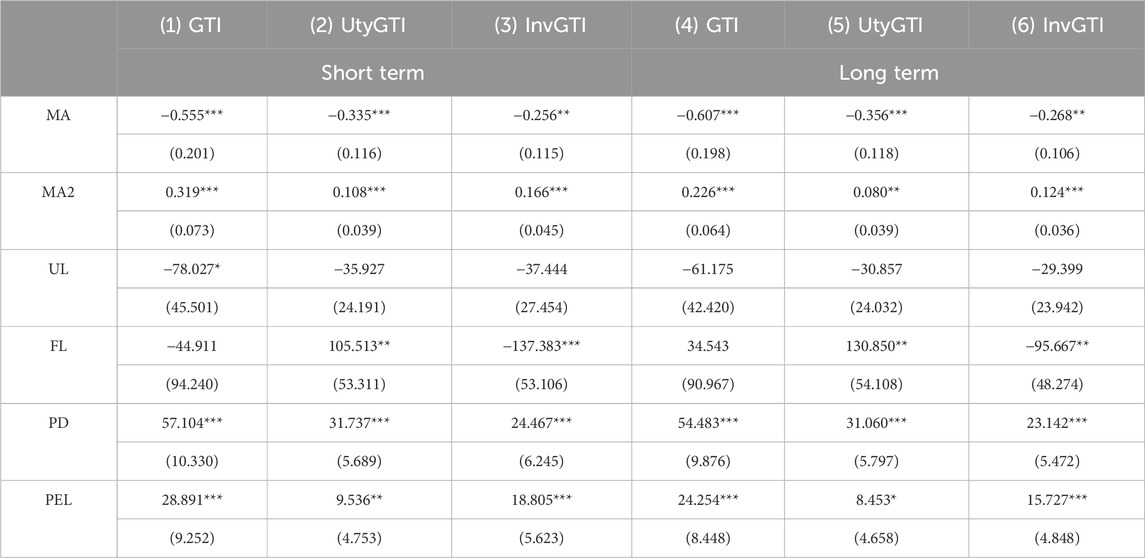
Model (1) and model (4) in Table 8 show that the coefficient of the primary term of MA is significantly negative at the 1% level. In contrast, the coefficient of the quadratic term is significantly positive at the same level, indicating a significant positive U-shaped relationship between MA and GTI. This pattern suggests that as the MA level increases, the GTI level initially decreases before increasing, implying that MA levels must be maintained within a specific range to achieve urban GTI. This U-shaped relationship reveals a complex dynamic between MA and GTI. Initially, as manufacturing concentration increases, it may prioritize traditional production methods and scale economies over GTI. However, beyond a certain threshold, the agglomeration benefits, such as knowledge spillovers, shared resources, and increased competition, likely stimulate more significant investment in green technologies. This transition point could represent a critical mass where the pressure for environmental compliance and the potential for eco-innovation outweigh the initial focus on conventional manufacturing practices.
Further, this paper employs InvGTI and UtyGTI to measure GTI, respectively and examines how different types of green patent applications affect UER on MA. The regression results presented in Table 8 indicate that, upon further distinguishing between different types of green patents, the coefficients for both the primary and secondary terms of MA are significant at the 5% level, and that MA affects the number of green utility model patents filed to a slightly greater extent than it does the number of green invention patents. This indicates that, at the overall level, GTI has a mediating role in MA and UER, and there is no apparent distinction between patent types. Compared to invention patents, the more substantial effect on utility model patents suggests that MA may have a more immediate impact on incremental or applied green innovations rather than fundamental breakthroughs. This could imply that the agglomeration process fosters an environment where companies are more inclined to adapt and improve existing green technologies for practical applications, which might be more readily implementable in enhancing UER.
6 Conclusions and policy recommendations
How does manufacturing agglomeration impact urban ecological resilience in both short and long terms? What role does green technology innovation play in mediating the relationship between MA and UER? To address these questions, this paper first constructed a comprehensive UER evaluation system for the Yangtze River Delta region using the entropy weight TOPSIS method. This system incorporates three key dimensions of UER in the new era: ecological resistance, adaptation, and resilience.Through empirical analysis using a dynamic spatial Durbin model, our findings reveal several important insights. First, we identify a significant inverted U-shaped relationship between MA and UER in both short and long terms. This indicates that MA’s impact on UER initially shows a positive effect up to a certain threshold, beyond which its influence becomes negative. The consistency between short-term and long-term effects suggests the stability of MA’s impact on UER over time. Additionally, we find that GTI serves as a crucial mediating mechanism through which MA influences UER, highlighting the important role of technological innovation in shaping environmental outcomes.
Therefore, the following policy recommendations are proposed.
(1) Timely adjustment of regional policies according to the changing dynamics of the MA level. The 20th CPC National Congress report emphasizes the need to build livable, resilient, and smart cities. This paper finds that MA has a non-linear relationship with UER that is first negative and then positive, so it is necessary to reasonably promote MA. On the one hand, for the regions with a low level of MA, we should promote the reasonable flow of production factors and the optimal allocation of innovation resources, steadily improve MA, and accelerate the elimination of congestion effects brought by MA; on the other hand, for the regions with a high MA level, we should carry out overall planning and layout of their manufacturing industries, optimize the construction of manufacturing industrial ecology, and promote the knowledge spillover effect and technology spillover effect brought by MA. On the other hand, for regions with higher levels of MA, the overall planning and layout of their manufacturing industries should be carried out to optimize the construction of the manufacturing industry ecology, give full play to the knowledge spillover effect and technology spillover effect brought by MA, and promote the improvement of the UER in the city and the surrounding areas.
(2) Strengthen the role of MA in promoting GTI. On the one hand, amplify support for technological innovation, enhance the development of relevant infrastructure, and encourage increased investments in green technology research and development. This initiative aims to foster closer technical cooperation and sharing among enterprises, expedite the regional dissemination and application of green technologies, and realize high-quality regional development. On the other hand, accelerate the growth of advanced manufacturing clusters and optimize the digital transformation and upgrading of the manufacturing sector to establish a modern industrial system. This approach will drive the manufacturing industry towards a highly green transformation and enhance urban ecological resilience, adaptability, and toughness. Ultimately, it creates a livable, safe environment and a healthy and sustainable ecosystem development.
Despite these findings and implications, several promising directions for future research emerge. First, as digital transformation increasingly shapes industrial development, future studies could explore how digital technologies mediate the MA-UER relationship. This could involve investigating how innovative manufacturing and Industry 4.0 initiatives affect the environmental impacts of industrial agglomeration. Second, future research could extend the geographical scope beyond the Yangtze River Delta region to other urban agglomerations worldwide. Such comparative studies help identify whether the patterns observed in this study are universal or context-specific. Third, future work could incorporate more sophisticated measures of ecological resilience, including biodiversity indicators and ecosystem service metrics.
Data availability statement
The original contributions presented in the study are included in the article/supplementary material, further inquiries can be directed to the corresponding author.
Author contributions
CW: Conceptualization, Data curation, Formal Analysis, Funding acquisition, Investigation, Methodology, Project administration, Resources, Software, Supervision, Validation, Visualization, Writing–original draft, Writing–review and editing.
Funding
The author(s) declare that no financial support was received for the research, authorship, and/or publication of this article.
Conflict of interest
The author declares that the research was conducted in the absence of any commercial or financial relationships that could be construed as a potential conflict of interest.
Publisher’s note
All claims expressed in this article are solely those of the authors and do not necessarily represent those of their affiliated organizations, or those of the publisher, the editors and the reviewers. Any product that may be evaluated in this article, or claim that may be made by its manufacturer, is not guaranteed or endorsed by the publisher.
Supplementary material
The Supplementary Material for this article can be found online at: https://www.frontiersin.org/articles/10.3389/fenvs.2024.1492866/full#supplementary-material
Abbreviations
UER, Urban Ecological Resilience; MA, Manufacturing Agglomeration; GI, Green Technology Innovation; YRDr, Yangtze River Delta region; UL, Urbanisation Level; FL, Financial Level; IL, Industrial Level; PEL, Primary Education Level; SPDM, Spatial Panel Durbin Model.
References
Adger, W. N. (2000). Social and ecological resilience: are they related? Prog. Hum. Geogr. 24 (3), 347–364. doi:10.1191/030913200701540465
Andersson, M., and Loof, H. (2011). Agglomeration andproductivity: evidence from firm-level data. Ann. Regional Sci. 46 (3), 601–620. doi:10.1007/s00168-009-0352-1
Anselin, L. (1988). Lagrange multiplier test diagnostics for spatial dependence and spatial heterogeneity. Geogr. Anal. 20 (1), 1–17.
Bai, Y., Deng, X., Jiang, S., Zhang, Q., and Wang, Z. (2018). Exploring the relationship between urbanization and urban eco-efficiency: Evidence from prefecture-level cities in China. J. Clean. Prod. 195, 1487–1496. doi:10.1016/j.jclepro.2017.11.115
Bai, D., Hu, J., Irfan, M., and Hu, M. (2023). Unleashing the impact of ecological civilization pilot policies on green technology innovation: evidence from a novel SC-DID model. Energy Econ. 125, 106813. doi:10.1016/j.eneco.2023.106813
Chen, Y., and Lee, C. C. (2020). Does technological innovation reduce CO2 emissions? Cross-country evidence. J. Clean. Prod. 263, 121550. doi:10.1016/j.jclepro.2020.121550
Chen, Y., Li, Q., and Liu, J. Y. (2024). Innovating sustainability: VQA-based AI for carbon neutrality challenges. J. Organ. End User Comput. (JOEUC) 36 (1), 1–22. doi:10.4018/joeuc.337606
Cheng, Z. (2016). The spatial correlation and interaction between manufacturing agglomeration and environmental pollution. Ecol. Indic. 61, 1024–1032. doi:10.1016/j.ecolind.2015.10.060
Dong, B., Gong, J., and Zhao, X. (2012). FDI and environmental regulation: pollution haven or a race to the top? J. Regul. Econ. 41 (2), 216–237. doi:10.1007/s11149-011-9162-3
Fan, W., Wu, X., and He, Q. (2024). Digitalization drives green transformation of supply chains: a two-stage evolutionary game analysis. Ann. Operations Res. 1–20. doi:10.1007/s10479-024-06050-0
Feng, Y., Wang, X., Du, W., Wu, H., and Wang, J. (2019). Effects of environmental regulation and FDI on urban innovation in China: a spatial Durbin econometric analysis. J. Clean. Prod. 235, 210–224. doi:10.1016/j.jclepro.2019.06.184
Folke, C., Carpenter, S. R., Walker, B., Scheffer, M., Chapin, T., and Rockström, J. (2010). Resilience thinking: integrating resilience, adaptability and transformability. Ecol. Soc. 15 (4), art20. doi:10.5751/es-03610-150420
Fu, S., Liu, J., Wang, J., Tian, J., and Li, X. (2023). Enhancing urban ecological resilience through integrated green technology progress: evidence from Chinese cities. Environ. Sci. Pollut. Res. 31, 36349–36366. doi:10.1007/s11356-023-29451-3
Grimm, N. B., Faeth, S. H., Golubiewski, N. E., Redman, C. L., Wu, J., Bai, X., et al. (2008). Global change and the ecology of cities. Science 319 (5864), 756–760. doi:10.1126/science.1150195
Han, F., Xie, R., Lu, Y., Fang, J., and Liu, Y. (2018). The effects of urban agglomeration economieson carbon emissions: evidence from Chinese cities. J. Clean. Prod. 172, 1096–1110. doi:10.1016/j.jclepro.2017.09.273
He, J. (2006). Pollution haven hypothesis and environmental impacts of foreign direct investment: the case of industrial emission of sulfur dioxide (SO2) in Chinese provinces. Ecol. Econ. 60 (1), 228–245. doi:10.1016/j.ecolecon.2005.12.008
Holling, C. S. (1973). Resilience and stability of ecological systems. Annu. Rev. Ecol. Syst. 4, 1–23. doi:10.1146/annurev.es.04.110173.000245
Hong, Y., Lyu, X., Chen, Y., and Li, W. (2020). Industrial agglomeration externalities, local governments’ competition and environmental pollution: evidence from Chinese prefecture-level cities. J. Clean. Prod. 277, 123455. doi:10.1016/j.jclepro.2020.123455
Hu, F., Zhang, S., Gao, J., Tang, Z., Chen, X., Qiu, L., et al. (2024). Digitalization empowerment for green economic growth: the impact of green complexity. Environ. Eng. and Manag. J. (EEMJ) 23 (3), 519–536. doi:10.30638/eemj.2024.040
Jiang, L., Lai, Y., Guo, R., Li, X., Hong, W., and Tang, X. (2024). Measuring the impact of government intervention on the spatial variation of market-oriented urban redevelopment activities in Shenzhen, China. Cities 147, 104834. doi:10.1016/j.cities.2024.104834
Jiao, Y., Xu, F., and Yang, H. (2023). Does urban greening construction promote technological innovation of enterprises? Evidence from China. Prague Econ. Pap. 32 (6), 628–658. doi:10.18267/j.pep.848
LeSage, J. P., and Pace, R. K. (2009). Spatial econometric models[M]//Handbook of applied spatial analysis: Software tools, methods and applications. Springer: Berlin, Heidelberg.
Li, G., and Wang, L. (2023). Study of regional variations and convergence in ecological resilience of Chinese cities. Ecol. Indic. 154, 110667. doi:10.1016/j.ecolind.2023.110667
Li, T., Xin, S., and Xi, Y. (2022). “Predicting multi-level socioeconomic indicators from structural urban imagery,” in Proceedings of the 31st ACM international conference on information and knowledge management, 3282–3291.
Lin, T., Wu, W., Du, M., Ren, S., Huang, Y., and Cifuentes-Faura, J. (2023). Does green credit really increase green technology innovation? Sci. Prog. 106 (3), 00368504231191985. doi:10.1177/00368504231191985
Lu, P., Liu, J., Wang, Y., and Ruan, L. (2021). Can industrial agglomeration improve regional green total factor productivity in China? An empirical analysis based on spatial econometrics. Growth Change 52 (2), 1011–1039. doi:10.1111/grow.12488
Lv, C., Shao, C., and Lee, C. C. (2021). Green technology innovation and financial development: do environmental regulation and innovation output matter? Energy Econ. 98, 105237. doi:10.1016/j.eneco.2021.105237
Ma, Q., Zhang, Y., Hu, F., and Zhou, H. (2024). Can the energy conservation and emission reduction demonstration city policy enhance urban domestic waste control? Evidence from 283 cities in China. Cities 154, 105323. doi:10.1016/j.cities.2024.105323
Martin, R., and Sunley, P. (2015). On the notion of regional economic resilience: conceptualization and explanation. J. Econ. Geogr. 15 (1), 1–42. doi:10.1093/jeg/lbu015
Meerow, S., Newell, J. P., and Stults, M. (2016). Defining urban resilience: a review. Landsc. urban Plan. 147, 38–49. doi:10.1016/j.landurbplan.2015.11.011
Shen, F., Liu, B., Luo, F., Wu, C., Chen, H., and Wei, W. (2021). The effect of economic growth target constraints on green technology innovation. J. Environ. Manag. 292, 112765. doi:10.1016/j.jenvman.2021.112765
State Council of China (2019). Full text: China’s National Defense in the New Era. Available at: https://english.www.gov.cn/archive/whitepaper/201907/24/content_WS5d3941ddc6d08408f502283d.html.
Verhoef, E. T., and Nijkamp, P. (2002). Externalities in urban sustainability: environmental versus localization-type agglomeration externalities in a general spatial equilibrium model of a single-sector monocentric industrial city. Ecol. Econ. 40 (2), 157–179. doi:10.1016/s0921-8009(01)00253-1
Wang, Y., and Wang, J. (2019). Does industrial agglomeration facilitate environmental performance: new evidence from urban China? J. Environ. Manag. 248, 109244. doi:10.1016/j.jenvman.2019.07.015
Wang, X., and Zhou, D. (2021). Spatial agglomeration and driving factors of environmental pollution: A spatial analysis. J. Clean. Prod. 279, 123839. doi:10.1016/j.jclepro.2020.123839
Wang, Y., Yan, W., Ma, D., and Zhang, C. (2018). Carbon emissions and optimal scale of China's manufacturing agglomeration under heterogeneous environmental regulation. J. Clean. Prod. 176, 140–150. doi:10.1016/j.jclepro.2017.12.118
Wang, Z., Cao, X., Ren, X., and Gozgor, G. (2024a). Digital finance and the energy transition: evidence from Chinese prefecture-level cities. Glob. Finance J. 61, 100987. doi:10.1016/j.gfj.2024.100987
Wang, Z., Fu, H., and Ren, X. (2024b). Assessing the effects of extreme climate risk on urban ecological resilience in China. Environ. Sci. Pollut. Res. 31 (19), 28225–28240. doi:10.1007/s11356-024-33039-w
Wu, S., Cao, J., and Shao, Q. (2024a). How to select remanufacturing mode: end-of-life or used product? Environ. Dev. Sustain., 1–21. doi:10.1007/s10668-024-04515-7
Wu, S., Cheng, P., and Yang, F. (2024b). Study on the impact of digital transformation on green competitive advantage: the role of green innovation and government regulation. Plos one 19 (8), e0306603. doi:10.1371/journal.pone.0306603
Wu, X., Zhang, J., Geng, X., Wang, T., Wang, K., and Liu, S. (2020). Increasing green infrastructure-based ecological resilience in urban systems: a perspective from locating ecological and disturbance sources in a resource-based city. Sustain. Cities Soc. 61, 102354. doi:10.1016/j.scs.2020.102354
Yua, Y. U., and Liub, Z. (2022). Article citation contribution indicator: application in energy and environment. Ecofeminism Clim. Change 3 (2), 81–84. doi:10.26480/efcc.02.2022.81.84
Yuan, H., Feng, Y., Lee, C. C., and Cen, Y. (2020). How does manufacturing agglomeration affect green economic efficiency? Energy Econ. 92, 104944. doi:10.1016/j.eneco.2020.104944
Zeng, D.-Z., and Zhao, L. (2009). Pollution havens and industrial agglomeration. J.Environ. Econ.Manag 58 (2), 141–153. doi:10.1016/j.jeem.2008.09.003
Zhang, L., Sun, H., Pu, T., and Chen, Z. (2024). Do green finance and hi-tech innovation facilitate sustainable development? Evidence from the Yangtze River Economic Belt. Econ. Analysis Policy 81, 1430–1442. doi:10.1016/j.eap.2024.02.005
Zhao, S., Zhang, L., Peng, L., Zhou, H., and Hu, F. (2024). Enterprise pollution reduction through digital transformation? Evidence from Chinese manufacturing enterprises. Technol. Soc. 77, 102520. doi:10.1016/j.techsoc.2024.102520
Keywords: manufacturing agglomeration, urban ecological resilience, urban sustainable development, green technology innovation, spatial measurement models
Citation: Wang C (2024) How does manufacturing agglomeration affect urban ecological resilience? evidence from the Yangtze river delta region of China. Front. Environ. Sci. 12:1492866. doi: 10.3389/fenvs.2024.1492866
Received: 08 September 2024; Accepted: 03 December 2024;
Published: 18 December 2024.
Edited by:
Xiaohang Ren, Central South University, ChinaCopyright © 2024 Wang. This is an open-access article distributed under the terms of the Creative Commons Attribution License (CC BY). The use, distribution or reproduction in other forums is permitted, provided the original author(s) and the copyright owner(s) are credited and that the original publication in this journal is cited, in accordance with accepted academic practice. No use, distribution or reproduction is permitted which does not comply with these terms.
*Correspondence: Chen Wang, d2FuZ2NoZW40NjEzQDE2My5jb20=
 Chen Wang