- Water Resources Department, Henan Yellow River Hydrological Survey and Design Institute, Zhengzhou, China
Introduction: Vegetation plays a crucial role in terrestrial ecosystems, acting as a vital link connecting the lithosphere, hydrosphere, and atmosphere in terms of energy flow and material cycling. Changes in surface vegetation significantly regulate the water cycle, energy flow within terrestrial surfaces, and global carbon balance.
Methods: This study focuses on nine major river basins in China to quantitatively investigate the impacts of climate factors, vegetation dynamics, and land use changes on carbon use efficiency (CUE) and water use efficiency (WUE).
Results: The primary controlling factors of WUE trends are NDVI (average contribution: 33.75% ± 6.90%) and VPD (average contribution: 28.04% ± 3.98%). NDVI predominates in the Haihe, Yellow River, Yangtze River, Pearl River, and Songliao River basins, while shortwave radiation (Srad) dominates in the southeastern rivers and inland river areas, and humidity (Shum) in the southwestern river basins. For CUE trends, the main controlling factors are Srad (average contribution: 36.46% ± 3.40%) and precipitation (Pre) (average contribution: 26.72% ± 5.20%). NDVI negatively influences the Huaihe River and southeastern river basins, while Pre negatively influences the Songliao River and Yellow River basins, and Srad negatively influences the Huaihe and southwestern river basins. Pre predominates in the Huaihe, Songliao, Haihe, southwestern river basins, and inland river areas, while Srad predominates in the Pearl River, Yangtze River, and Yellow River basins.
Discussion: Climate factors and vegetation dynamics have significant regional impacts on WUE and CUE across different river basins, especially the roles of NDVI and VPD on WUE, and Srad and precipitation on CUE. These differences underscore the importance of developing region-specific management strategies to optimize ecosystem services in each basin.
1 Introduction
Vegetation plays a crucial role in terrestrial ecosystems, serving as a key intermediary in the exchange of energy and matter between the lithosphere, hydrosphere, and atmosphere. Changes in vegetation have significant regulatory effects on the hydrological cycle, energy transfer within terrestrial surfaces, and the global carbon cycle (Foley et al., 1996; Ostle et al., 2009). Faced with the dual impacts of climate change and human activities, dynamic changes in vegetation not only respond to external environmental changes but also serve as explicit indicators of the internal state of ecosystems. Therefore, vegetation is considered an important indicator for assessing ecosystem health and sensitivity to environmental changes (Qi et al., 2019; Seddon et al., 2016). The characteristics of vegetation changes are of significant importance for the overall adaptability and stability of ecosystems. On the other hand, vegetation is not merely a passive recipient of external environmental changes; it dynamically responds to the external environment through its biophysical and biochemical processes. In this process, vegetation exerts significant influences on regional and global carbon-water cycling systems through ecological and physiological processes such as photosynthesis and transpiration (Hu et al., 2008).
Carbon Use Efficiency (CUE) determines the rate at which energy and matter flow towards higher trophic levels, converting plant produced carbon into microbial products and ecosystem carbon storage. It is typically expressed as the ratio of Net Primary Productivity (NPP) to Gross Primary Productivity (GPP) (Lu et al., 2011; DeLucia et al., 2007). Water Use Efficiency (WUE) in vegetation, defined as the amount of fixed carbon per unit of water transpired, quantifies the trade-off between carbon gain and water loss in terrestrial ecosystems. This efficiency is commonly represented by the ratio of ecosystem biomass production (GPP or NPP) to Evapotranspiration (ET) (Sinsabaugh et al., 2013). A thorough understanding of the dynamic changes and controlling factors of CUE and WUE is crucial for predicting ecosystem responses to climate change. CUE and WUE serve as vital indicators of carbon and water cycling in vegetation ecosystems, reflecting vegetation growth status and environmental responsiveness. By calculating and analyzing these indicators, we can compare differences in carbon and water cycling among different ecosystems and understand how plants respond to environmental changes (Fisher et al., 2017).
Historically, studies of WUE have focused on individual plants, with gas exchange methods offering insight at the leaf level. With advancements in remote sensing, large-scale assessments of WUE have become possible, expanding research to ecosystems such as forests, grasslands, and farmlands (John et al., 2013). Remote sensing data, especially from satellites, now enables regional and global-scale analysis of water use efficiency, though results can vary based on factors like vegetation type, leaf area index (LAI), radiation, temperature, and precipitation (Xu et al., 2019). Despite these advancements, challenges remain in understanding how these factors influence WUE across spatial and temporal scales.
Land Use and Cover Change (LUCC) plays a significant role in altering terrestrial carbon and water cycles by changing surface energy balances, water availability, and nutrient flows (Liu et al., 2023; Posch and Bennett, 2009). Studies across various regions highlight the temporal and spatial variability of WUE. For instance, in the Amazon Basin, researchers have observed distinct spatial patterns of WUE that differ from those in East Asia or the United States (Zhou et al., 2018). Zhao et al. (2020) found that WUE in southwest China varies across vegetation types, ranking from highest to lowest as forest, shrubland, farmland, and grassland. This finding contrasts with results from the Loess Plateau, where Zhang et al. (2016) ranked WUE from highest to lowest as grassland, woodland, shrubland, and farmland. Such comparisons underscore the need to understand how regional factors, such as climate and land use, influence WUE and carbon-water interactions.
Regarding CUE, past studies often treated CUE as a fixed value (∼0.5), assuming that about half of the carbon assimilated is allocated to biomass (Zhang et al., 2014). However, recent findings challenge this assumption. For instance, (Campioli et al., 2015) showed that CUE varies depending on environmental conditions and vegetation types, while DeLucia et al. (2007) argued that CUE should be considered an ecosystem specific parameter. Remote sensing data from the Moderate Resolution Imaging Spectroradiometer (MODIS) revealed significant spatial variability in CUE, influenced by geographic and climatic factors (Chen et al., 2018; Zhang et al., 2019). This variability aligns with global observations that suggest CUE fluctuates with climate, ecosystem type, and human management practices.
While many studies have focused on large-scale assessments of CUE and WUE, uncertainties remain. For example, models estimating CUE vary in how they parameterize photosynthesis and autotrophic respiration, contributing to inconsistent results (Chen et al., 2018; Waring et al., 1998). Moreover, research from regions such as the Amazon Basin, East Asia, and the Loess Plateau presents differing conclusions on the drivers of CUE and WUE, highlighting the importance of geographical context.
This study aims to investigate the dynamic relationships among climatic factors, vegetation dynamics, and land use types with carbon-water use efficiency, determining the contributions of climatic factors and vegetation dynamics to changes in carbon-water use efficiency. The findings contribute to assessing the health of ecosystems in different watersheds. Based on the characteristics of different watersheds and their primary influencing factors, targeted resource management strategies can be implemented to enhance water resource utilization efficiency and carbon cycle stability.
2 Materials and methods
2.1 Study area
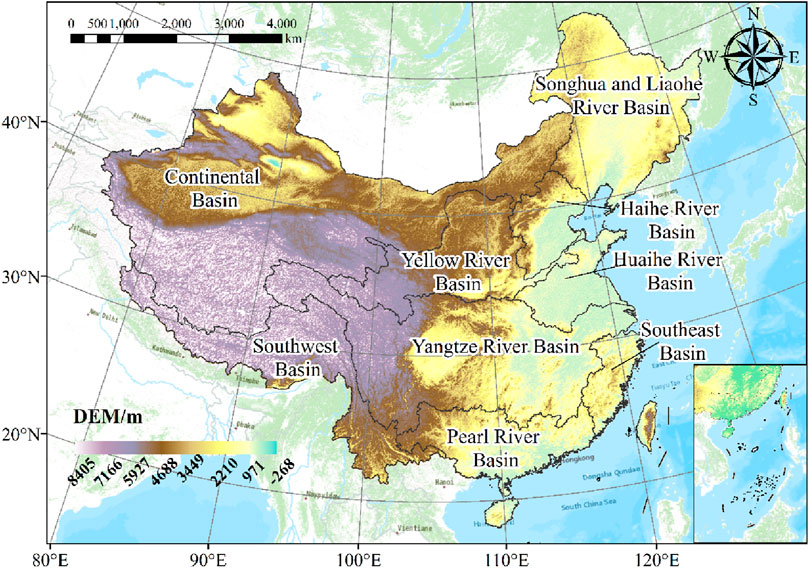
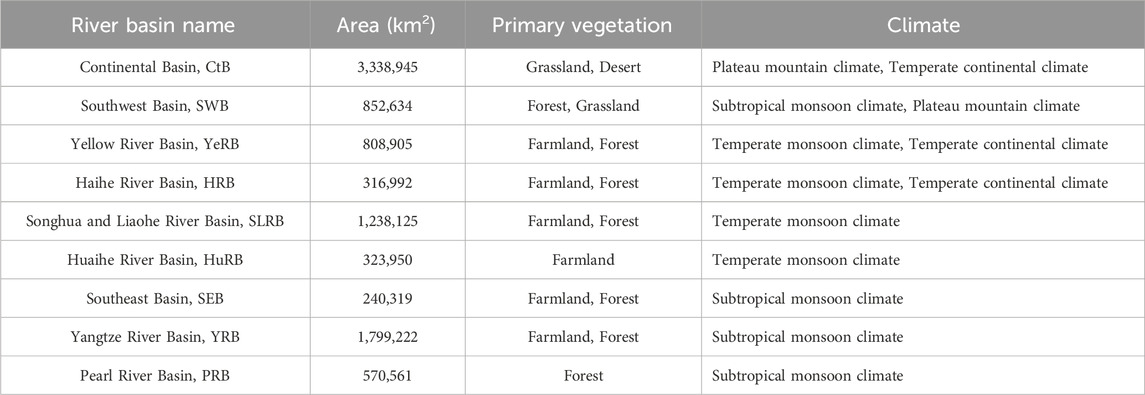
China is located in the northern part of the Eastern Hemisphere, spanning latitudes between 3.86°N and 53.55°N and between 73.66°E and 135.05°E, and is on the eastern part of the Eurasian continent and the western part of the Pacific Ocean. The terrain is higher in the west and lower in the east, with mountains, plateaus and hills dominating the terrain, accounting for about 67% of the land area, while basins and flat principles account for about 33% of the land area. Its mountain ranges are mainly distributed along the east-west-northeast-southwest direction, including the Karakorum Mountains, Yinshan Mountains, Qinling Mountains, Changbai Mountains, Daxing’anling Mountains, Taiwan Mountains and Hengduan Mountains. China’s climate is characterized by high temperatures and rainy summers, cold winters with little rain, and a high degree of consistency between the high temperature period and the rainy period, which is a clear manifestation of the universal law of monsoon climate. Geographically, China is located in the world’s largest continent the eastern part of Asia and Europe, and at the same time adjacent to the world’s largest ocean the west coast of the Pacific Ocean, and its southwest and the Indian Ocean is not far away. This unique geographic location determines that China’s climate is strongly influenced by both the continent and the ocean, which makes the monsoon climate characteristics particularly prominent. These climatic characteristics not only affect China’s natural environment, but also have a profound impact on agricultural production, water resource distribution, and human settlement patterns (Figure 1; Table 1).
2.2 Data acquisition and processing
2.2.1 ET data
The evapotranspiration data are derived from an actual evapotranspiration dataset, known as the Terrestrial Evapotranspiration Data for China (TEDAC), based on the Nonlinear Complementary Relationship (CR) model. TEDAC operates at a spatial resolution of 0.1° and a temporal resolution at monthly scale. The dataset spans from January 2000 to December 2017, encompassing Actual Evapotranspiration (AET). Validation of TEDAC AET dataset was conducted using in situ measurements from 13 eddy covariance stations, achieving Nash Sutcliffe efficiency values ranging from 0.72 to 0.94 (https://doi.org/10.11888/AtmosPhys.tpe.249493.file).
2.2.2 Vegetation data
MODIS/Terra NPP product originates from the MOD17A3HGF v006 dataset provided by NASA for the years 2000–2017 (https://lpdaac.usgs.gov/), with a spatial resolution of 1 km × 1 km. Data processing involved using the Modis Reprojection Tool (MRT) software for calculations.
Gross Primary Productivity (GPP) product is sourced from the MOD17A2H dataset provided by NASA for the years 2000–2017 (https://lpdaac.usgs.gov/). This dataset features an 8-day composite with a spatial resolution of 500 m, based on the concept of radiation use efficiency, making it potentially valuable as input data for models.
2.2.3 Land use data
The CLCD dataset with 30 m resolution offers higher spatial resolution and a longer historical record compared to existing annual land cover products such as MCD12Q1 and ESACCILC. Third party validation of the CLCD dataset demonstrates overall accuracy surpassing MCD12Q1, ESACCILC, FROM_GLC (Global Land Cover Fine Resolution Observation and Monitoring), and GlobaLand30.
2.2.4 Other data
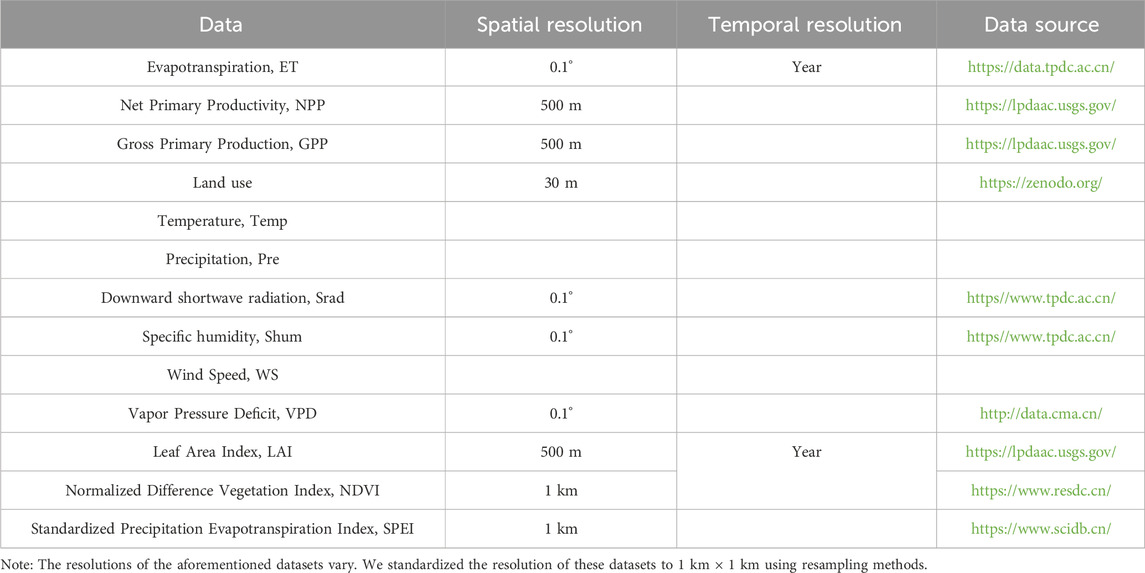
Meteorological data including Temperature (Temp), Precipitation (Pre), Downward Shortwave Radiation (Srad), Specific Humidity (Shum), and Wind Speed (WS) are sourced from the China Meteorological Forcing Dataset (CMFD) (https://data.tpdc.ac.cn/). CMFD provides national meteorological data from 1979 to 2018 at a spatial resolution of 0.1° and a temporal resolution of 3 h, widely used for model driving and data analysis research. For each station, flux data on rainy days and the following day, as well as outliers, were excluded. Monthly mean temperature values (Ta) and cumulative monthly precipitation (P) are derived from daily data. Additionally, Vapor Pressure Deficit (VPD) is calculated using relative humidity (RH, %) and Ta (°C) according to the formula provided (http://data.cma.cn/) (Equation 1).
Leaf Area Index (LAI) data are obtained from LP DAAC (https://lpdaac.usgs.gov/); Normalized Difference Vegetation Index (NDVI) data are sourced from the Data Center for Resources and Environmental Sciences, Chinese Academy of Sciences (https://www.resdc.cn/). Data for the Standardized Precipitation Evapotranspiration Index (SPEI) are acquired from the Scientific Data Bank (https://www.scidb.cn/).
While these datasets provide comprehensive coverage and high spatial resolution, they are subject to inherent limitations (Table 2). For instance, remote sensing products like MODIS may be affected by cloud cover, atmospheric conditions, and sensor calibration issues, potentially influencing the accuracy of derived metrics such as NPP and GPP. Additionally, while the CLCD dataset offers improved spatial accuracy, challenges may arise in interpreting land use changes over time due to classification errors or changes in land management practices.
2.3 Research method
2.3.1 Calculation method of carbon-water use efficiency
WUE (gC/m2·mm) can be expressed as the ratio of NPP (gC/m2) to ET (mm) (Equation 2):
CUE can be expressed as the ratio of NPP (gC/m2) to GPP (gC/m2) (Equation 3).
These calculations allow for the assessment of carbon sequestration relative to water usage, providing insights into ecosystem efficiency in terms of resource utilization.
2.4 Relative contribution rate
To analyze trends in WUE, climate factors, and vegetation factors, we employed a simple linear regression model to determine the slope, which indicates the direction and strength of the relationship over time. This approach provides a straightforward method for quantifying changes in WUE and its association with climatic variables. To minimize the influence of non-climatic factors on WUE, we utilized the first difference detrending method. This technique removes trends from the data, allowing for a clearer examination of the relationships between climate variables and WUE. Detrending is crucial in time series analysis as it helps isolate the effect of short-term fluctuations from long-term trends. Given the inter correlation among climate factors, we conducted partial correlation analysis to quantify the relationship between the detrended climate factors and detrended WUE. This method controls for the effects of other variables, allowing us to focus on the direct relationship between the two primary variables of interest. By identifying the factor with the highest partial correlation coefficient, we determined the dominant climate factor affecting WUE.
To further quantify the contribution of climatic factors to WUE, we performed multiple linear regression analysis. In this analysis, the first differences of the climate factors served as predictor variables, while the first difference of WUE was treated as the response variable (Chen et al., 2017) (Equation 4):
where, Yds represents the normalized detrended WUE; ai denotes the regression coefficients for each predictor variable; Xids refers to the normalized detrended climate factors. This method allows us to quantify how changes in climate factors contribute to variations in WUE, providing a clearer understanding of the interplay between climatic and anthropogenic influences.
Assuming that the dependent variable responds similarly to both climatic trends and interannual climatic variations, the contribution of climate to the WUE trend from 2000 to 2017 can be quantified using the aforementioned regression coefficients and the trends of the climate factors (Equations 5, 6).
where, Xis_trend represents the trend of the normalized climate factors; Qc denotes the contribution of climate to the trend of normalized WUE; Ys_trend refers to the trend of normalized WUE; Ytrend indicates the overall trend of WUE; Qac represents the actual contribution of climate to the WUE trend. This comprehensive analysis enables a nuanced understanding of the climatic influences on WUE trends over the specified period.
3 Results
3.1 Impact of land use conversion on carbon-water use efficiency
3.1.1 Impact of land use conversion on water use efficiency
The average WUE values for the nine land cover types in this study are ranked as follows: forest (1.134 gC/mm·m2) > shrubland (1.109 gC/mm·m2) > wetland (0.848 gC/mm·m2) > cropland (0.818 gC/mm·m2) > impervious surfaces (0.688 gC/mm·m2) > water bodies (0.630 gC/mm·m2) > grassland (0.522 gC/mm·m2) > bare land (0.292 gC/mm·m2) > ice/snow (0.169 gC/mm·m2).
Woodlands and shrubs demonstrate the highest WUE. Their conversion to other land types results in decreased WUE, with the most significant declines observed when woodlands are converted. Conversely, mutual conversions between shrubs and woodlands positively influence WUE, though the changes are greater when woodlands convert to shrubs. Vegetation degradation has a larger impact on WUE than vegetation restoration (Figure 2).
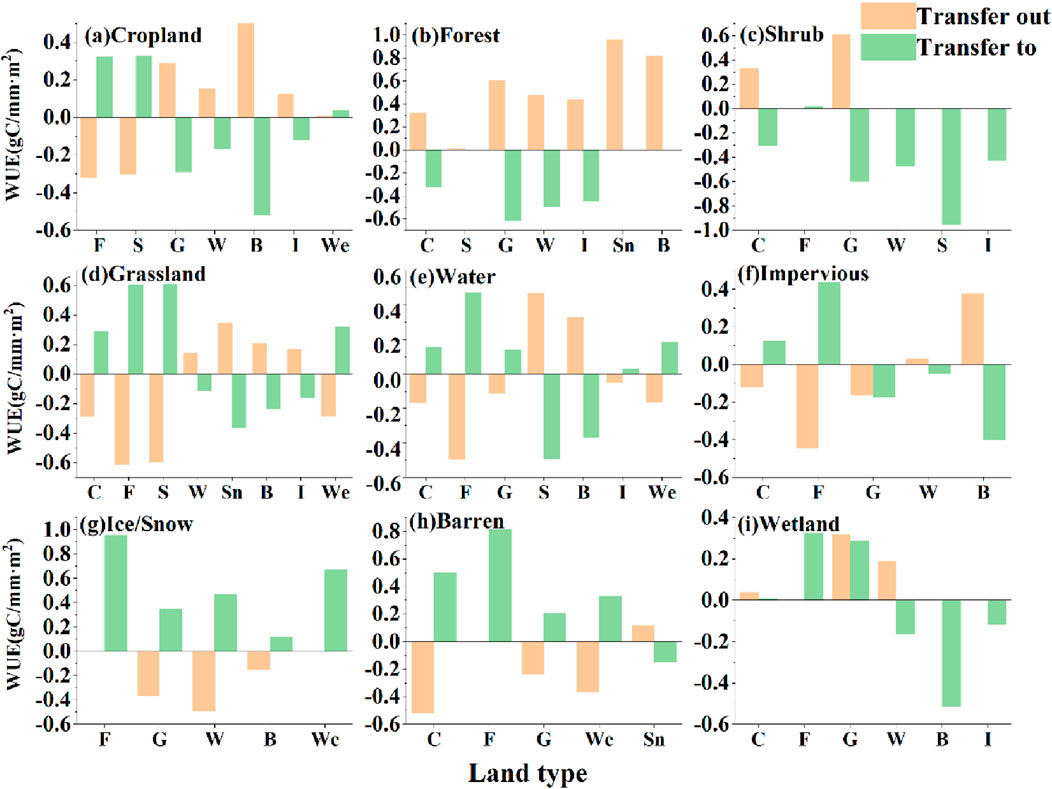
Figure 2. Changes in WUE caused by land cover type conversions from 2000 to 2017 (C: Cropland; F: Forestland; S: Shrubland; G: Grassland; W: Water bodies; Sn: Ice/Snow; B: Bare land; I: Impervious surfaces; We: Wetland. “Transition to” refers to WUE changes when other land cover types are converted to land cover type j; “Transition from” refers to WUE changes when land cover type j is converted to other land cover types). (A) Cropland; (B) Forest; (C) Shrub; (D) Grassland; (E) Water; (F) Impervious; (G) Ice/Snow; (H) Barren; (I) Wetland.
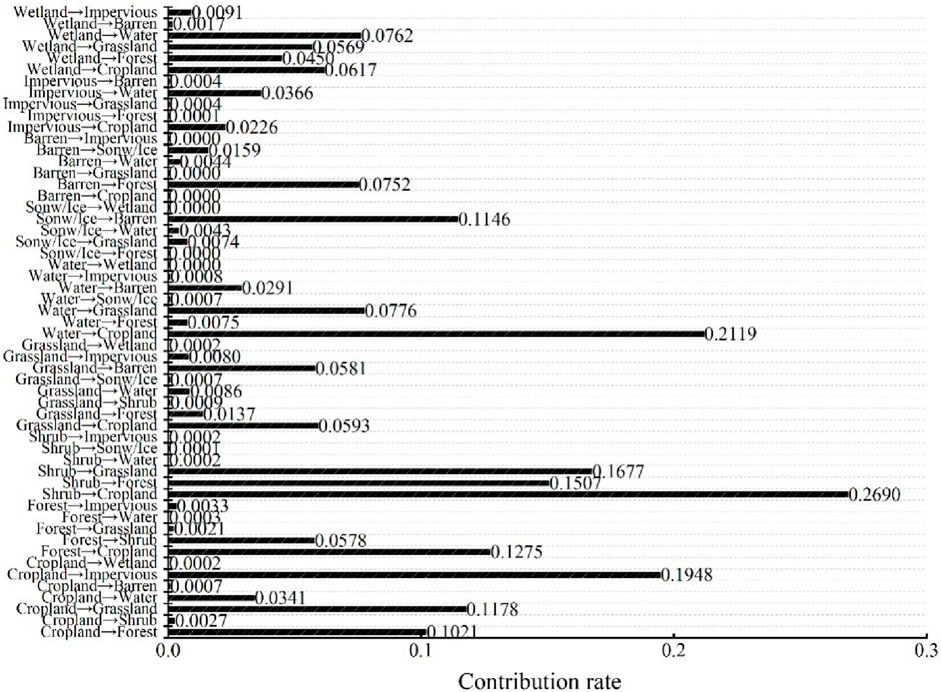
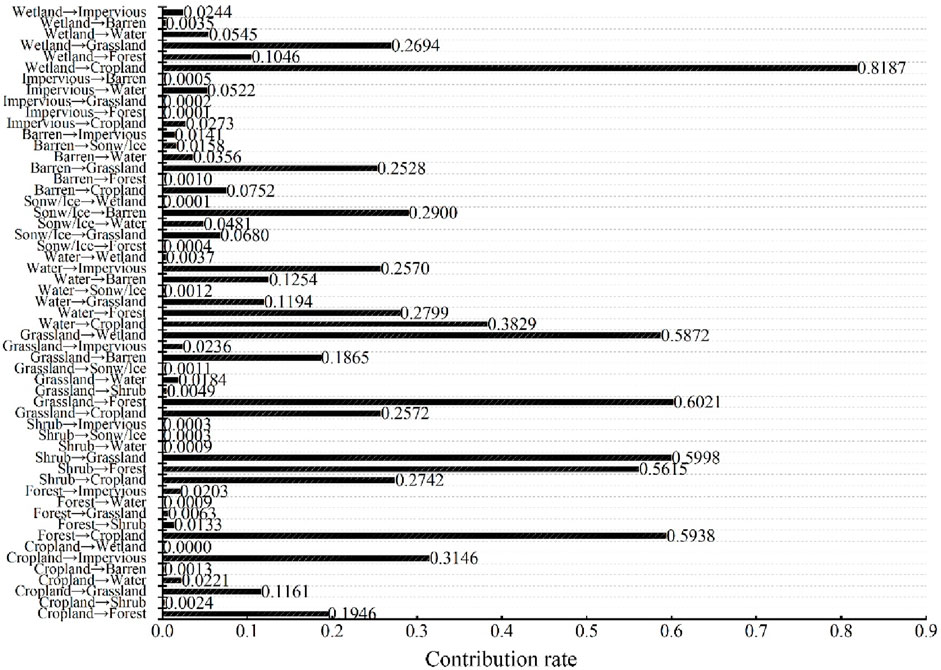
Between 2000 and 2017, shrubland to cropland conversion decreased WUE by 0.30 gC/mm·m2 (26.90% contribution), while cropland to forestland increased WUE by 0.32 gC/mm·m2 (10.21%). Other significant changes include cropland to impervious surfaces (decrease of 0.12 gC/mm·m2, 19.48% contribution) and grassland to cropland (increase of 0.287 gC/mm·m2, 5.93%). Overall, conversions involving shrubs had the highest impact on (Figure 3).
3.1.2 Impact of land use conversions on carbon efficiency
The average CUE rankings are: ice/snow (0.429) > shrubland (0.348) > grassland (0.325) > bare land (0.323) > water bodies (0.320) > forest (0.293) > wetland (0.292) > cropland (0.266) > impervious surface (0.261) (Figure 4). From 2000 to 2017, the conversion of wetlands to cropland decreased CUE by 0.05 (81.87% contribution), while grassland to wetland conversion reduced CUE by 0.08 (58.72%). Forest to grassland conversion increased CUE by 0.05 (0.63%), while forest to cropland decreased CUE by 0.008 (59.38%). Cropland to forestland conversion notably increased CUE by 0.44 (19.46%), showcasing forests’ carbon storage advantage (Figure 5).
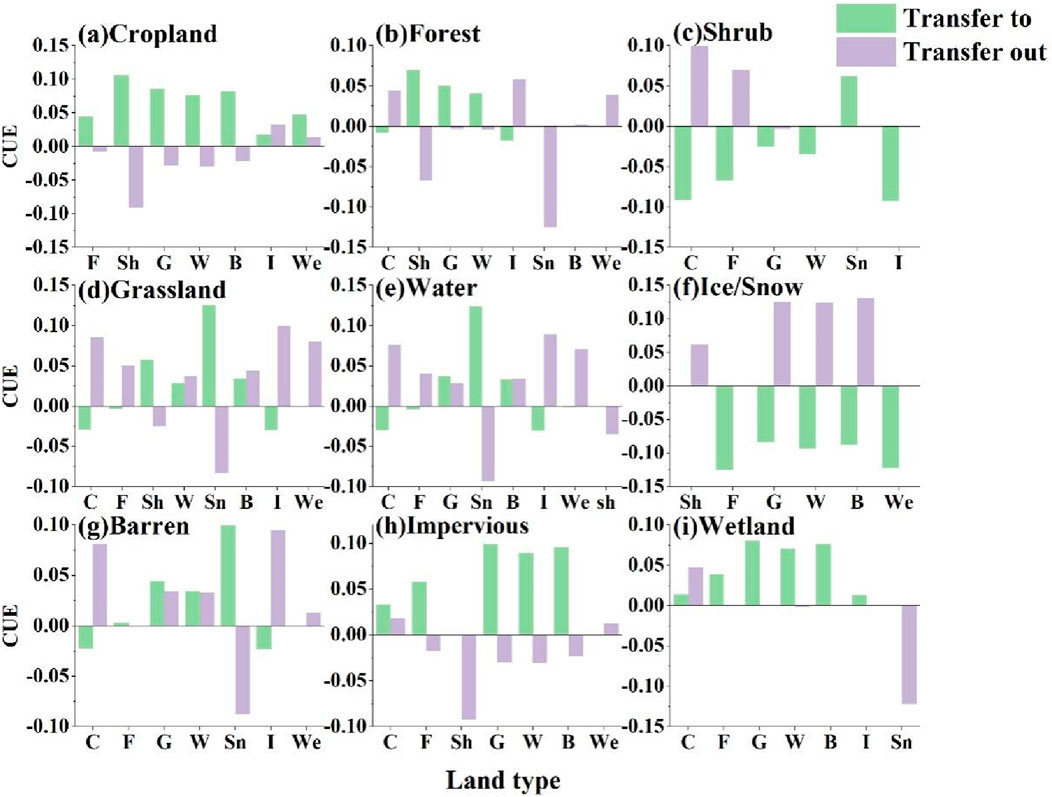
Figure 4. Changes in Carbon Use Efficiency (CUE) caused by land cover type conversions from 2000 to 2017 (C: Cropland; F: Forest; S: Shrub; G: Grassland; W: Water; Sn: Snow/Ice; B: Bare soil; I: Impervious surface; We: Wetland. “Conversion to” refers to changes in CUE when other land cover types convert to land cover type j; “Conversion from” refers to changes in CUE when land cover type j converts to other land cover types). (A) Cropland; (B) Forest; (C) Shrub; (D) Grassland; (E) Water; (F) Impervious; (G) Ice/Snow; (H) Barren; (I) Wetland.
3.2 Effects of climate and vegetation dynamics factors on carbon-water use efficiency
3.2.1 Effects of climate and vegetation dynamics factors on water use efficiency
WUE shows positive correlations with VPD, temperature, and LAI across most land use types, with negative correlations observed for solar radiation in vegetation poor areas. NDVI shows a strong positive correlation with WUE for all but impervious surfaces, ice/snow, and bare land. Regional analysis indicates NDVI as the dominant factor influencing WUE (33.75% contribution), especially in the Yellow, Songliao, and Pearl River Basins. VPD follows with a 28.04% contribution, negatively impacting WUE across 66.21% of the area. Wind speed and specific humidity also significantly affect WUE (Figures 6–8).
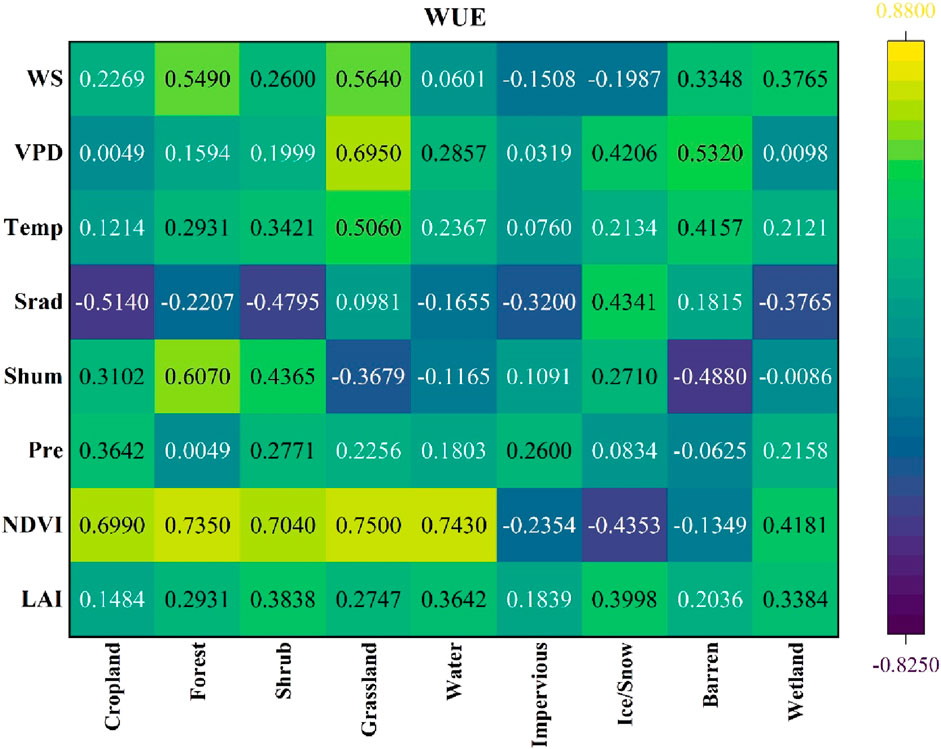
Figure 6. The correlation between Temp, Pre, Srad, Shum, VPD, WS, LAI, NDVI, and WUE across nine land use types.
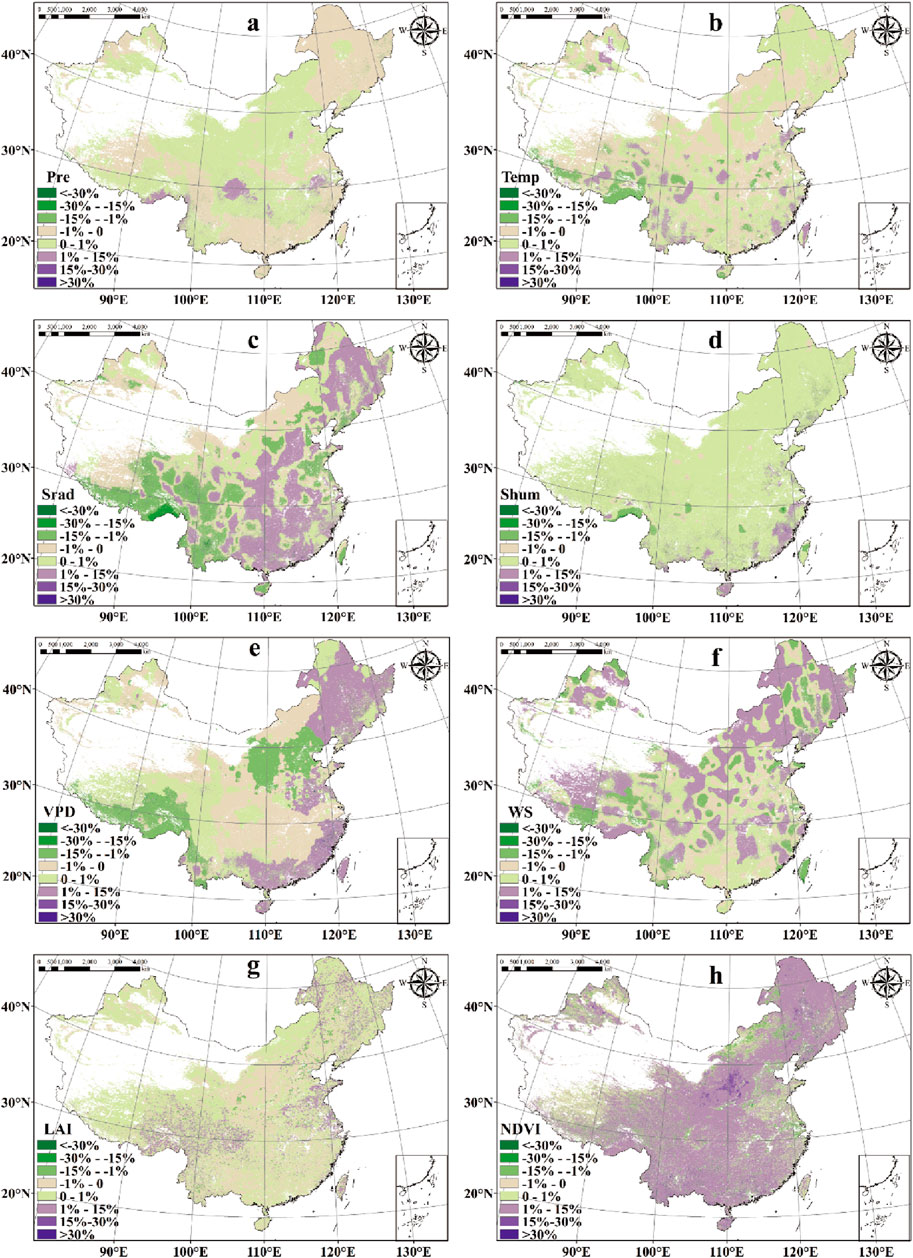
Figure 7. Contribution rates of different driving factors to the multi year average WUE. (A), Pre; (B), Temp; (C), Srad; (D), Shum; (E), VPD; (F), WS; (G), LAI; (H), NDVI.
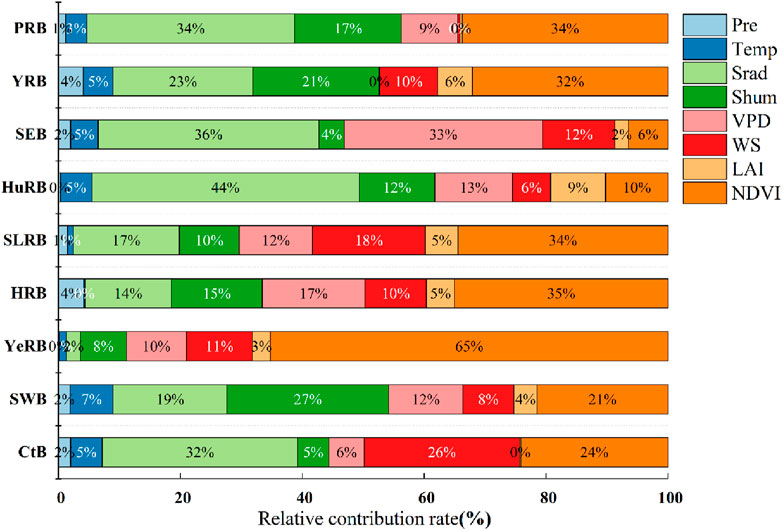
Figure 8. Relative contributions of climate factors and vegetation dynamics factors to WUE variations across nine major river basins in China.
3.2.2 The impact of climate and vegetation dynamics factors on carbon use efficiency
Climate factors are key drivers of CUE variability. Precipitation shows positive correlations with CUE for snow, impervious surfaces, and water bodies but negative correlations for forests and shrubs. Solar radiation is the primary controlling factor for CUE trends (36.46% contribution), followed by precipitation (26.72%) and LAI (24.71%). Temperature generally has a negative influence, especially in the inland and Yangtze River regions, while NDVI positively impacts 94.07% of the total area. (Figures 9–11).
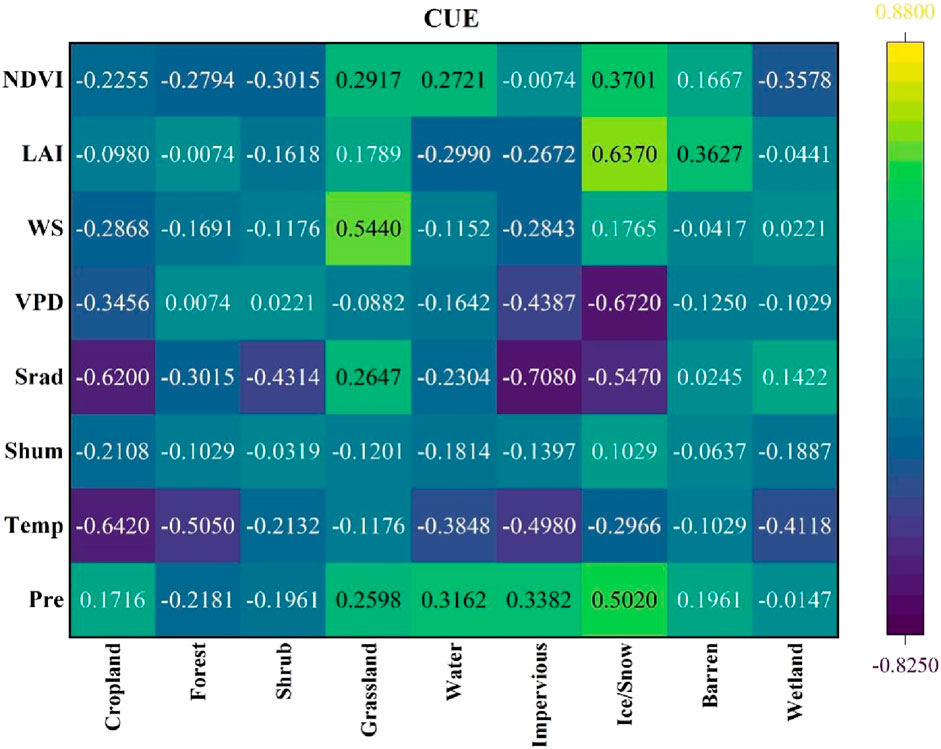
Figure 9. Correlation of Temp, Pre, Srad, Shum, VPD, WS, LAI, and NDVI with Carbon Use Efficiency (CUE) across nine land use types.
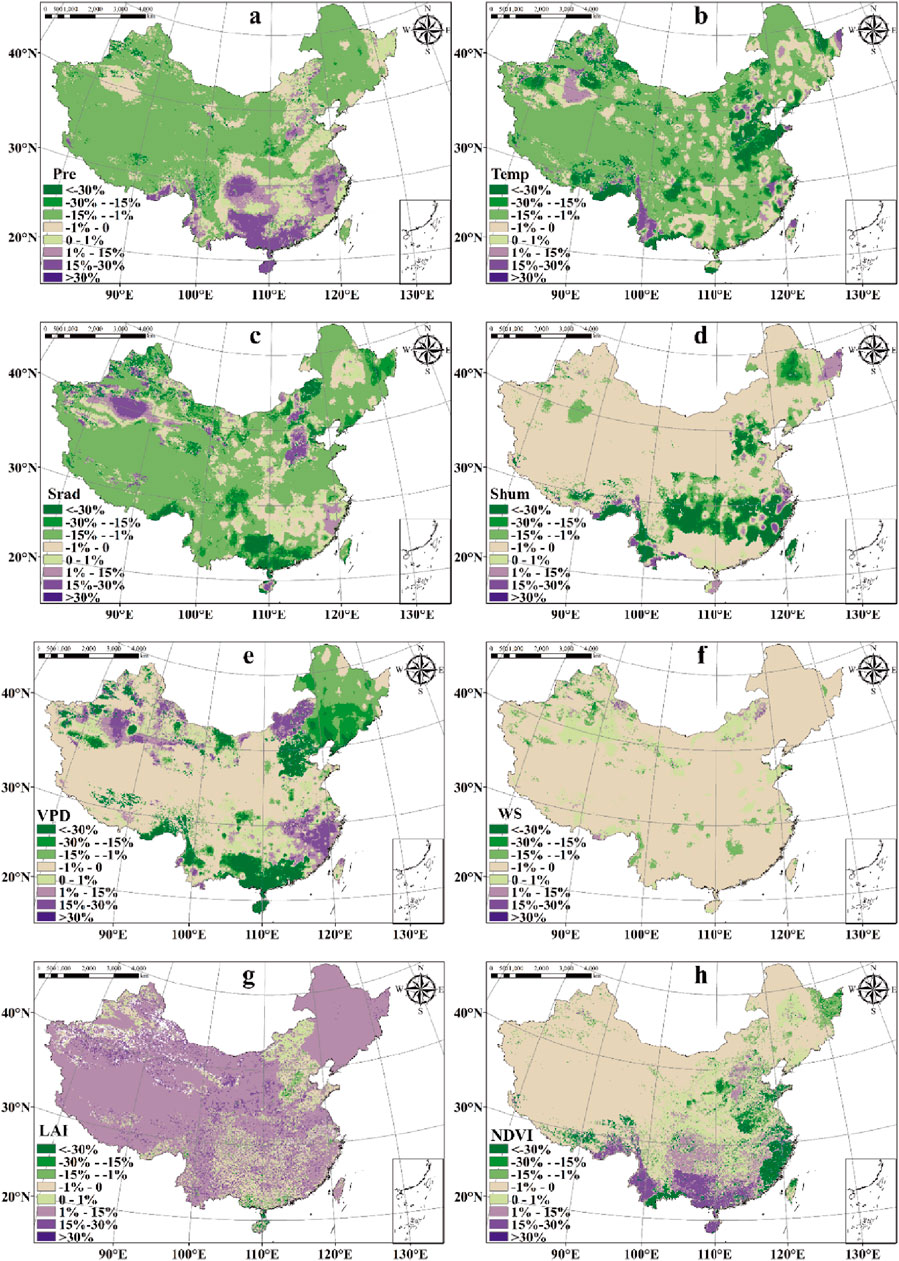
Figure 10. Contribution rates of different driving factors to the average annual Carbon Use Efficiency (CUE). (A), Pre; (B), Temp; (C), Srad; (D), Shum; (E), VPD; (F), WS; (G), LAI; (H), NDVI.
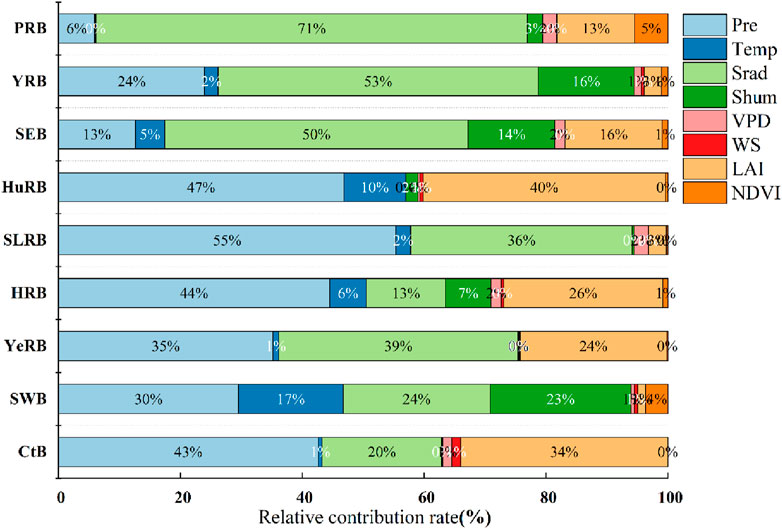
Figure 11. Relative contributions of various climatic and vegetation dynamic factors to changes in Carbon Use Efficiency (CUE) in nine major river basins in China.
4 Discussion
4.1 Factors influencing WUE (water use efficiency)
The spatial distribution of Water Use Efficiency (WUE) is primarily influenced by vegetation composition, land use types, and their spatial distribution (Tang et al., 2014). Favorable climatic conditions enhance vegetation growth, which, in turn, increases WUE. However, significant spatiotemporal variations in ecosystem WUE exist across different regions, and even within the same vegetation type, WUE can vary significantly across various areas. For instance, (Zhang et al., 2016) highlighted the spatiotemporal patterns of WUE in China’s Loess Plateau from 2000 to 2010, ranking annual mean WUE from high to low as grasslands, forests, shrublands, and croplands. In contrast, Guo et al. (2019) analyzed WUE changes across various vegetation types in China from 1982 to 2015 and found that deciduous broadleaf forests exhibited the highest WUE among all vegetation types. Wang et al. (2020) similarly studied WUE changes on the Qinghai-Tibet Plateau from 1982 to 2015, concluding that evergreen broadleaf forests had the highest WUE. These disparities suggest that variations in climatic conditions and human activities, such as irrigation, significantly impact WUE.
Notably, human activities play a crucial role in determining WUE. Appropriate irrigation and fertilization practices can enhance WUE, potentially counteracting declines driven by climate and land use changes (Tian et al., 2011). A study in the Yellow River Basin of China demonstrated that converting grasslands to croplands or forests improved WUE, aligning with our findings (Sun et al., 2022). The transitions between forested and grassland areas, or between grasslands and barren ecosystems, indicate that conversions from high to low vegetation cover result in relative WUE decreases, and vice versa. For example, in the Hai River Basin, the expansion of artificial surfaces was a primary cause of WUE reduction, whereas the landscaping of bare land contributed to WUE increases. The dynamics of green spaces are thus a crucial factor affecting WUE changes (Zhao et al., 2019). However, in Northeast China, the conversion of farmland to forest ecosystems did not result in increased WUE, likely due to regional climatic conditions. In the arid western regions of North China, croplands exhibited higher WUE than forestlands, highlighting the complexity of influencing factors (Xiao et al., 2013).
Significant differences in WUE exist across various land cover types. Bare lands typically exhibit lower WUE due to minimal vegetation cover and high evaporation rates. Conversely, forests, characterized by developed root systems and dense foliage, generally demonstrate higher WUE compared to grasslands, croplands, and wetlands. In our study, forests exhibited higher WUE values than croplands and grasslands, consistent with previous research on WUE variations among different vegetation types (Khalifa et al., 2018). Variability in WUE values within grid units for different vegetation types may contribute to discrepancies in WUE values. These uncertainties can elucidate the differences between our study and others. Overall, forestlands exhibit higher WUE than farmlands, indicating more effective utilization of available water resources through access to larger root zone areas, aligning with findings by (Khalifa et al., 2018).
Furthermore, Tian et al. (2010) demonstrated that WUE varies with land cover due to differences in carbon uptake and water consumption. Consequently, afforested and ecologically restored areas have become significant carbon sinks due to their strong carbon fixation capacity per unit of water consumed. Following the implementation of environmental restoration and watershed programs in the 1980s, WUE across land covers increased substantially, with trends in WUE over a 33-year period primarily driven by higher Net Primary Production (NPP). Previous studies on the impacts of watershed environmental restoration (Gebremicael et al., 2017; Nyssen et al., 2010) highlight the importance of ecological restoration and soil and water conservation measures in enhancing the sustainability of land and water resources.
Climate factors (temperature, precipitation, vapor pressure deficit, solar radiation, wind speed, and soil moisture) and vegetation dynamic factors (NDVI and LAI) influence variations in WUE by controlling both NPP and ET (Yang Y. H. et al., 2016). Overall, in China, NDVI has the greatest impact on WUE, as Sun et al. (Sun et al., 2016) suggest that vegetation adjusts stomatal conductance and water use efficiency in response to external environmental conditions during growth, maintaining normal growth and physiological functions. Notably, LAI and NDVI show an increasing trend in most regions of China, reflecting an overall “greening” (Tang et al., 2022). Our study results indicate that greening plays a dominant role in WUE changes in most regions of China, rather than climatic factors, consistent with previous research (Zhu et al., 2015). LAI is consistently positively correlated with WUE, attributed to its regulation of the ratio of NPP to transpiration; thus, as LAI increases, plants consume more water for NPP while soil evaporation decreases due to reduced solar radiation and precipitation reaching the land surface (Yang Y. T. et al., 2016).
The implications of our research findings for ecological and agricultural practices are profound. Enhancing Water Use Efficiency (WUE) is crucial for sustainable land management, particularly in the context of increasing water scarcity and climate change. Understanding the factors that contribute to improved WUE can guide effective irrigation strategies and vegetation management practices, thereby promoting ecological restoration and agricultural productivity. For instance, adopting management practices that favor specific vegetation types, such as deciduous broadleaf forests, may enhance the overall effectiveness of water resource management. Furthermore, strategies aimed at restoring and maintaining green spaces can positively influence WUE, thereby improving water resource utilization and ecosystem health. Changes in WUE directly impact land management practices. An increase in WUE can enhance the water use efficiency of agricultural systems, potentially reducing irrigation demands and alleviating water stress on surrounding ecosystems. This, in turn, may contribute to increased crop yields while conserving water resources. Conversely, in regions experiencing a decline in WUE, a reassessment of land use practices may be necessary to mitigate adverse effects on agricultural output and ecological health. Understanding the driving factors behind changes in WUE can inform policymakers and land managers in developing targeted interventions that align land use with sustainable water resource management. In summary, the findings of this study underscore the importance of integrating ecological factors into water resource management strategies. As water scarcity continues to pose challenges, enhancing WUE through scientifically-informed land management practices is vital for maintaining agricultural productivity and ecological integrity.
4.2 Factors influencing CUE (carbon use efficiency)
Analyzing changes in vegetation Carbon Use Efficiency (CUE) across the nine major river basins in China offers critical insights into the regional carbon cycle dynamics, highlighting the role of vegetation in regulating ecosystem carbon fluxes. CUE, which measures the ratio of carbon assimilated for growth and reproduction relative to the total carbon uptake, is a key indicator of ecosystem productivity and carbon sequestration potential. Zhao et al. (2021) observed that dense vegetation tends to exhibit lower CUE than sparse vegetation, and that forest CUE is generally lower than that of shrubs and herbaceous plants. These findings are consistent with our study, reaffirming the complexity of carbon allocation in various vegetation types. However, the mechanisms underpinning these differences may vary based on land use history, management intensity, and species composition, which future studies should explore further.
In contrast to Zhao et al. (2021) broad analysis of vegetation types, our study provides new insights into the climate-CUE relationship, specifically the influence of VPD (Vapor Pressure Deficit) on plant physiological processes. While Law et al. (2002) reported that vegetation CUE is positively correlated with precipitation and negatively correlated with temperature, our results refine this understanding by isolating the negative effects of temperature and VPD on CUE. VPD affects stomatal conductance, which in turn regulates CO2 uptake, making it a critical factor in plant photosynthesis and respiration. This finding supports Liu et al. (2011), further underscoring VPD’s role in limiting carbon assimilation under water-stressed conditions, which has far-reaching implications for future vegetation responses to increasing aridity and climate extremes.
A particularly novel finding of our study is the observed negative correlation between CUE and solar radiation (Srad), diverging from the conventional understanding that increased solar energy typically enhances biomass accumulation. While higher net solar radiation provides ample energy for photosynthesis, our results suggest that this relationship may be nonlinear, with diminishing returns in carbon use efficiency due to the increased respiration costs associated with high sunlight intensity. This sensitivity of respiration to solar radiation warrants deeper investigation, as it challenges previous assumptions about the direct benefits of solar energy on plant productivity, indicating that excess radiation may offset the gains from photosynthesis.
The role of NDVI in regulating CUE offers another important perspective. Previous studies, such as those by Polley et al. (2010), demonstrated NDVI’s utility as a proxy for canopy development and its influence on CO2 fluxes. Our findings align with Liu et al. (2011), demonstrating a significant positive correlation between NDVI and CUE, thus highlighting the role of vegetation greenness and canopy structure in promoting carbon assimilation. This relationship emphasizes the importance of maintaining healthy, dense vegetation cover, particularly in regions where CUE is vulnerable to climatic stressors (Yashiro et al., 2010).
As climate change continues to exert increasing pressure on ecosystems, enhancing or maintaining Carbon Use Efficiency (CUE) through targeted land management practices is critical for sustaining ecosystem functions. Policymakers and land managers must account for the spatiotemporal dynamics of CUE when designing interventions to ensure that ecosystems remain productive and resilient under future climate scenarios. Incorporating CUE dynamics into effective land-use planning can enhance ecosystem services, such as carbon sequestration and water resource regulation, and contribute to long-term ecological sustainability. The findings of this study provide important insights into the factors influencing CUE, with implications not only for theoretical ecology but also for practical applications in land management and agriculture. By elucidating the complex relationships between CUE, climate, and vegetation dynamics, this study lays the foundation for more effective and sustainable management of ecosystems and agricultural landscapes in the face of ongoing environmental changes.
4.3 Carbon and water use efficiency in changing environments
The changes in Carbon Use Efficiency (CUE) and Water Use Efficiency (WUE) are closely related to land-use conversion and are also deeply influenced by climate change and internal climate variability. Global warming and fluctuations within the climate system jointly drive the complex changes in the carbon and water cycles of ecosystems. Therefore, it is necessary to further explore the role of these climatic factors in the discussion.
The impact of internal climate variability on regional climate and ecological processes cannot be overlooked. Ca et al. (2024) found that the pronounced warming on the Mongolian Plateau is partly attributable to the enhancement of internal climate variability, rather than solely to global warming. This internal variability not only alters regional water use efficiency by influencing temperature and precipitation patterns but may also affect carbon cycling processes by modulating ecosystem evapotranspiration. In this study, WUE shows significant correlations with climatic variables (e.g., temperature, VPD, and precipitation), particularly in regions with dense vegetation, where internal climate variability may amplify the effects of these climatic factors on WUE. For example, WUE in the Yellow River, Songliao River, and Pearl River Basins is significantly driven by NDVI and VPD, which is closely related to the regional climate fluctuations caused by internal climate variability. Therefore, future research should pay more attention to how climate variability affects carbon and water use efficiency in specific regions.
Under the context of global warming, changes in climate patterns profoundly influence carbon and water use efficiency. Chen et al. (2024) pointed out that global warming has strengthened the impact of the North Pacific Oscillation (NPO) on the development of ENSO, which means that changes in atmospheric circulation could significantly alter the distribution of precipitation and temperature, thus affecting water use and carbon storage in ecosystems. In this study, the positive correlations between WUE and temperature and VPD are significant across most land types, but in areas with sparse vegetation (e.g., bare land and ice/snow), negative correlations are observed, possibly reflecting the increasing water stress in these regions caused by global warming-induced drought. Moreover, the complex relationship between CUE, precipitation, and solar radiation suggests that global warming, by altering the long-term trends of these climatic variables, may have profound effects on the carbon use efficiency of ecosystems.
Future climate change scenarios (e.g., SSP245, SSP585) will further affect carbon and water use efficiency, especially under the dual influence of human activities and climate-driven land-use changes. The combined effects of global warming and internal climate variability could exacerbate the differences in carbon and water cycles across different land types. For example, this study found that the conversion of forests and shrublands has the greatest impact on WUE and CUE, highlighting the importance of ecological restoration and sustainable land management for enhancing carbon storage capacity and water use efficiency. Future research should further integrate simulations of climate variability and the impacts of extreme climate events to reveal the dynamic responses of carbon and water use efficiency under various climate change scenarios.
5 Conclusion
This study quantitatively analyzed the impact of land use conversion, climate, and vegetation dynamics on the carbon-water use efficiency (WUE) across nine major river basins in China. The primary controlling factors influencing WUE trends were identified as NDVI (Normalized Difference Vegetation Index) and VPD (Vapor Pressure Deficit). Contributions of Pre (precipitation), Temp (temperature), WS (wind speed), and LAI (Leaf Area Index) exhibited relatively dispersed positive and negative rates. Positive contributions of VPD were predominantly observed in the Songliao River basin, Huai River basin, Pearl River basin, and various southeastern river basins. Conversely, negative contributions of Srad (surface solar radiation) were mainly concentrated in inland river patches, the Huai River basin, and southwestern river basins. The Yellow River basin, Yangtze River basin, Pearl River basin, and Songliao River basin showed a dominant influence of NDVI, while Srad predominated in the southeastern river basins, Huai River basin, and inland river patches, and Shum (soil moisture) in the southwestern river basins. For Carbon Use Efficiency (CUE) trends, the main controlling factors were Srad and Pre. LAI, Shum, Temp, and VPD exhibited relatively dispersed positive and negative contribution rates. Negative contributions of NDVI were primarily observed in the Huai River basin and southeastern river basins, Pre in the Songliao River basin and Yellow River basin, and Srad in the Huai River basin, southwestern river basins, and southeastern river basins, with WS primarily influencing the Songliao River basin and Yangtze River basin negatively. The Huai River basin, Songliao River basin, Hai River basin, southwestern river basins, and inland river patches were dominated by Pre, while the Yangtze River basin, Yellow River basin, and Pearl River basin were dominated by Srad. This paper focused exclusively on analyzing the annual scale variations of WUE and CUE in Chinese river basins.
The study focused exclusively on analyzing the annual-scale variations of WUE and CUE in Chinese river basins. However, it underscores the crucial importance of understanding seasonal and monthly variations to comprehensively grasp the dynamic processes within the study area throughout the year. Therefore, future research should intensify analyses across different temporal scales to provide a more scientific and comprehensive basis for decision-making in related fields. The limitations of this study lie in its focus solely on annual-scale WUE and CUE variations, without delving into the influences of seasonal and monthly changes on these efficiencies. To attain a more comprehensive understanding of ecosystem dynamics, future research should emphasize multi-temporal scale analyses, particularly concerning changes across different seasons and climate conditions. Additionally, given the impacts of human activities, future studies should integrate socio-economic factors to assess their potential effects on water resource management and sustainable agricultural practices.
Data availability statement
The original contributions presented in the study are included in the article/supplementary material, further inquiries can be directed to the corresponding author.
Author contributions
GZ: Writing–review and editing. GW: Writing–review and editing.
Funding
The author(s) declare that financial support was received for the research, authorship, and/or publication of this article. This project was funded by the Huang Committee Outstanding Young Talents Science and Technology Project (HQK-202305) (Guodong, Zhang) and Qian Kehe Zhicheng (2023) Yiban 206 (Guanyi, Wu).
Conflict of interest
The authors declare that the research was conducted in the absence of any commercial or financial relationships that could be construed as a potential conflict of interest.
Publisher’s note
All claims expressed in this article are solely those of the authors and do not necessarily represent those of their affiliated organizations, or those of the publisher, the editors and the reviewers. Any product that may be evaluated in this article, or claim that may be made by its manufacturer, is not guaranteed or endorsed by the publisher.
References
Ca, Q. Y., Chen, W., Chen, S. F., Xie, S. P., Piao, J. L., Ma, T. J., et al. (2024). Recent pronounced warming on the Mongolian Plateau boosted by internal climate variability. Nat. Geosci. 17 (3), 181–188. doi:10.1038/s41561-024-01377-6
Campioli, M., Vicca, S., Luyssaert, S., Bilcke, J., Ceschia, E., Chapin III, F. S., et al. (2015). Biomass production efficiency controlled by management in temperate and boreal ecosystems. Nat. Geosci. 8 (11), 843–846. doi:10.1038/ngeo2553
Chen, S. F., Chen, W., Xie, S. P., Yu, B., Wu, R. G., Wang, Z. B., et al. (2024). Strengthened impact of boreal winter North Pacific Oscillation on ENSO development in warming climate. npj Clim. Atmos. Sci. 7 (1), 69–11. doi:10.1038/s41612-024-00615-3
Chen, X., Mo, X., Hu, S., and Liu, S. (2017). Contributions of climate change and human activities to ET and GPP trends over North China Plain from 2000 to 2014. J. Geogr. Sci. 27, 661–680. doi:10.1007/s11442-017-1399-z
Chen, Z., Yu, G., and Wang, Q. (2018). Ecosystem carbon use efficiency in China: variation and influence factors. Ecol. Indic. 90, 316–323. doi:10.1016/j.ecolind.2018.03.025
DeLucia, E. H., Drake, J. E., Thomas, R. B., and Gonzalez-Meler, M. (2007). Forest carbon use efficiency: is respiration a constant fraction of gross primary production? Glob. Change Biol. 13 (6), 1157–1167. doi:10.1111/j.1365-2486.2007.01365.x
Fisher, J. B., Melton, F., Middleton, E., Hain, C., Anderson, M., Allen, R., et al. (2017). The future of evapotranspiration: global requirements for ecosystem functioning, carbon and climate feedbacks, agricultural management, and water resources. Water Resour. Res. 53 (4), 2618–2626. doi:10.1002/2016wr020175
Foley, J. A., Prentice, I. C., Ramankutty, N., Levis, S., Pollard, D., Sitch, S., et al. (1996). An integrated biosphere model of land surface processes, terrestrial carbon balance, and vegetation dynamics. Glob. Biogeochem. Cycles 10 (4), 603–628. doi:10.1029/96gb02692
Gebremicael, T. G., Mohamed, Y. A., Van Zaag, P., and Hagos, E. Y. (2017). Temporal and spatial changes of rainfall and streamflow in the Upper Tekeze-Atbara river basin, Ethiopia. Hydrology Earth Syst. Sci. 21 (4), 2127–2142. doi:10.5194/hess-21-2127-2017
Guo, L. M., Sun, F. B., Liu, W. B., Zhang, Y. Y., Wang, H., Cui, H. J., et al. (2019). Response of ecosystem water use efficiency to drought over China during 1982-2015: spatiotemporal variability and resilience. Forests 10 (7), 598. doi:10.3390/f10070598
He, Y., Piao, S., Li, X., Chen, A., and Qin, D. (2018). Global patterns of vegetation carbon use efficiency and their climate drivers deduced from MODIS satellite data and process-based models. Agric. For. Meteorology 256-257, 150–158. doi:10.1016/j.agrformet.2018.03.009
Hu, Z., Yu, G., Fu, Y., Sun, X., Li, Y., Shi, P., et al. (2008). Effects of vegetation control on ecosystem water use efficiency within and among four grassland ecosystems in China. Glob. Change Biol. 14 (7), 1609–1619. doi:10.1111/j.1365-2486.2008.01582.x
John, R., Chen, J., Ou-Yang, Z.-T., Xiao, J., Becker, R., Samanta, A., et al. (2013). Vegetation response to extreme climate events on the Mongolian Plateau from 2000 to 2010. Environ. Res. Lett. 8 (3), 035033. doi:10.1088/1748-9326/8/3/035033
Khalifa, M., Elagib, N. A., Ribbe, L., and Schneider, K. (2018). Spatio-temporal variations in climate, primary productivity and efficiency of water and carbon use of the land cover types in Sudan and Ethiopia. Sci. Total Environ. 624, 790–806. doi:10.1016/j.scitotenv.2017.12.090
Law, B. E., Falge, E., Gu, L., Baldocchi, D. D., Bakwin, P., Berbigier, P., et al. (2002). Environmental controls over carbon dioxide and water vapor exchange of terrestrial vegetation. Agric. For. Meteorology 113 (1-4), 97–120. doi:10.1016/s0168-1923(02)00104-1
Liu, C. C., Liu, Y. G., Guo, K., Fan, D. Y., Li, G. Q., Zheng, Y. R., et al. (2011). Comparative ecophysiological responses to drought of two shrub and four tree species from karst habitats of southwestern China. Trees 25, 537–549. doi:10.1007/s00468-010-0533-7
Liu, Y., Ding, Z., Chen, Y., Zheng, Y., Jiang, Y., Jiang, Y., et al. (2023). Restored vegetation is more resistant to extreme drought events than natural vegetation in Southwest China. Sci. Total Environ. 866, 161250. doi:10.1016/j.scitotenv.2022.161250
Lu, E., Luo, Y. L., Zhang, R. H., Wu, Q., and Liu, L. (2011). Regional atmospheric anomalies responsible for the 2009-2010 severe drought in China. J. Geophys. Research-Atmospheres 116. doi:10.1029/2011jd015706
Nyssen, J., Clymans, W., Descheemaeker, K., Poesen, J., Vandecasteele, I., Vanmaercke, M., et al. (2010). Impact of soil and water conservation measures on catchment hydrological response-a case in north Ethiopia. Hydrol. Process. 24 (13), 1880–1895. doi:10.1002/hyp.7628
Ostle, N. J., Smith, P., Fisher, R., Woodward, F. I., Fisher, J. B., Smith, J. U., et al. (2009). Integrating plant–soil interactions into global carbon cycle models. J. Ecol. 97 (5), 851–863. doi:10.1111/j.1365-2745.2009.01547.x
Polley, H. W., Emmerich, W., Bradford, J. A., Sims, P. L., Johnson, D. A., Saliendra, N. Z., et al. (2010). Physiological and environmental regulation of interannual variability in CO2 exchange on rangelands in the western United States. Glob. Change Biol. 16 (3), 990–1002. doi:10.1111/j.1365-2486.2009.01966.x
Posch, S., and Bennett, L. T. P. (2009). Photosynthesis, photochemistry and antioxidative defence in response to two drought severities and with re-watering in Allocasuarina luehmannii. Plant Biol. 11, 83–93. doi:10.1111/j.1438-8677.2009.00245.x
Qi, H., Huang, F., and Zhai, H. (2019). Monitoring spatio-temporal changes of terrestrial ecosystem soil water use efficiency in Northeast China using time series remote sensing data. Sensors 19 (6), 1481. doi:10.3390/s19061481
Seddon, A. W. R., Macias-Fauria, M., Long, P. R., Benz, D., and Willis, K. J. (2016). Sensitivity of global terrestrial ecosystems to climate variability. Nature 531 (7593), 229–232. doi:10.1038/nature16986
Sinsabaugh, R. L., Manzoni, S., Moorhead, D. L., and Richter, A. (2013). Carbon use efficiency of microbial communities: stoichiometry, methodology and modelling. Ecol. Lett. 16 (7), 930–939. doi:10.1111/ele.12113
Sun, H. W., Chen, L., Yang, Y., Jiang, Y., Qi, Y., Zhao, Y., et al. (2022). Assessing variations in water use efficiency and linkages with land-use changes using three different data sources: a case study of the Yellow River, China. Remote Sens. 14 (5), 1065. doi:10.3390/rs14051065
Sun, Y., Piao, S., Huang, M., Ciais, P., Zeng, Z., Cheng, L., et al. (2016). Global patterns and climate drivers of water-use efficiency in terrestrial ecosystems deduced from satellite-based datasets and carbon cycle models. Glob. Ecol. Biogeogr. 25 (3), 311–323. doi:10.1111/geb.12411
Tang, X., Li, H., Desai, A. R., Nagy, Z., Luo, J., Kolb, T. E., et al. (2014). How is water-use efficiency of terrestrial ecosystems distributed and changing on Earth? Sci. Rep. 4, 7483. doi:10.1038/srep07483
Tang, X. G., Xiao, J. F., Ma, M. G., Xia, J., Tian, F., Zhao, X., et al. (2022). Satellite evidence for China's leading role in restoring vegetation productivity over global karst ecosystems. For. Ecol. Manag. 507, 120000. doi:10.1016/j.foreco.2021.120000
Tian, H. Q., Chen, G. S., Liu, M. L., Zhang, C., Sun, G., Lu, C. Q., et al. (2010). Model estimates of net primary productivity, evapotranspiration, and water use efficiency in the terrestrial ecosystems of the southern United States during 1895-2007. For. Ecol. Manag. 259 (7), 1311–1327. doi:10.1016/j.foreco.2009.10.009
Tian, H. Q., Lu, C. Q., Chen, G. S., Xu, X. F., Liu, M. L., Ren, W., et al. (2011). Climate and land use controls over terrestrial water use efficiency in monsoon Asia. Ecohydrology 4 (2), 322–340. doi:10.1002/eco.216
Wang, L. M., Li, M. Y., Wang, J. X., Li, X. H., and Fang, H. L. (2020). An analytical reductionist framework to separate the effects of climate change and human activities on variation in water use efficiency. Sci. Total Environ. 727, 138306. doi:10.1016/j.scitotenv.2020.138306
Waring, R. H., Landsberg, J. J., and Williams, M. (1998). Net primary production of forests: a constant fraction of gross primary production? Tree Physiol. 18 (2), 129–134. doi:10.1093/treephys/18.2.129
Xiao, J. F., Sun, G., Chen, J. Q., Chen, H., Chen, S., Dong, G., et al. (2013). Carbon fluxes, evapotranspiration, and water use efficiency of terrestrial ecosystems in China. Agric. For. Meteorology 182, 76–90. doi:10.1016/j.agrformet.2013.08.007
Xu, C., McDowell, N. G., Fisher, R. A., Wei, L., Sevanto, S., Christoffersen, B. O., et al. (2019). Increasing impacts of extreme droughts on vegetation productivity under climate change. Nat. Clim. Change 9 (12), 948–953. doi:10.1038/s41558-019-0630-6
Yang, Y. H., Wu, Q. B., Yun, H. B., Jin, H. J., and Zhang, Z. Q. (2016a). Evaluation of the hydrological contributions of permafrost to the thermokarst lakes on the Qinghai-Tibet Plateau using stable isotopes. Glob. Planet. Change 140, 1–8. doi:10.1016/j.gloplacha.2016.03.006
Yang, Y. T., Guan, H., Batelaan, O., McVicar, T. R., Long, D., Piao, S., et al. (2016b). Contrasting responses of water use efficiency to drought across global terrestrial ecosystems. Sci. Rep. 6, 23284. doi:10.1038/srep23284
Yashiro, Y., Shizu, Y., Hirota, M., Shimono, A., and Ohtsuka, T. (2010). The role of shrub (Potentilla fruticosa) on ecosystem CO2 fluxes in an alpine shrub meadow. J. Plant Ecol. 3 (2), 89–97. doi:10.1093/jpe/rtq011
Zhang, T., Peng, J., Liang, W., Yang, Y., and Liu, Y. (2016). Spatial-temporal patterns of water use efficiency and climate controls in China's Loess Plateau during 2000-2010. Sci. Total Environ. 565, 105–122. doi:10.1016/j.scitotenv.2016.04.126
Zhang, Y., Huang, K., Zhang, T., Zhu, J., and Di, Y. (2019). Soil nutrient availability regulated global carbon use efficiency. Glob. Planet. Change 173, 47–52. doi:10.1016/j.gloplacha.2018.12.001
Zhang, Y., Yu, G., Yang, J., Wimberly, M. C., Zhang, X., Tao, J., et al. (2014). Climate-driven global changes in carbon use efficiency. Glob. Ecol. Biogeogr. 23 (2), 144–155. doi:10.1111/geb.12086
Zhao, J. X., Feng, H. Z., Xu, T. R., Wu, X. C., He, G. H., Yang, S. F., et al. (2021). Physiological and environmental control on ecosystem water use efficiency in response to drought across the northern hemisphere. Sci. Total Environ. 758, 143599. doi:10.1016/j.scitotenv.2020.143599
Zhao, J. X., Xu, T. R., Xiao, J. F., Guo, Y. Q., Zhang, F. Y., Wang, R. H., et al. (2020). Responses of water use efficiency to drought in southwest China. Remote Sens. 12 (1), 199. doi:10.3390/rs12010199
Zhao, Y., Zhang, X., Bai, Y., Zhang, Y., Wang, C., and Liu, M. (2019). Does land use change affect green space water use? An analysis of the Haihe River Basin. Forests 10 (7), 545. doi:10.3390/f10070545
Zhou, G., Zhou, X., Nie, Y., Bai, S. H., Zhou, L., Shao, J., et al. (2018). Drought-induced changes in root biomass largely result from altered root morphological traits: evidence from a synthesis of global field trials. Plant, cell and Environ. 41 (11), 2589–2599. doi:10.1111/pce.13356
Keywords: water use efficiency, carbon use efficiency, land use, vegetation dynamics, China
Citation: Zhang G and Wu G (2024) Factors influencing carbon and water use efficiency in changing environments. Front. Environ. Sci. 12:1481082. doi: 10.3389/fenvs.2024.1481082
Received: 16 August 2024; Accepted: 24 October 2024;
Published: 05 November 2024.
Edited by:
Shangfeng Chen, Chinese Academy of Sciences (CAS), ChinaReviewed by:
Yahui Guo, Central China Normal University, ChinaJerry Lee Hatfield, United States Department of Agriculture, United States
Copyright © 2024 Zhang and Wu. This is an open-access article distributed under the terms of the Creative Commons Attribution License (CC BY). The use, distribution or reproduction in other forums is permitted, provided the original author(s) and the copyright owner(s) are credited and that the original publication in this journal is cited, in accordance with accepted academic practice. No use, distribution or reproduction is permitted which does not comply with these terms.
*Correspondence: Guanyi Wu, d3VndWFueWk1NUAxNjMuY29t
 Guodong Zhang
 Guanyi Wu