- 1The Institute of Atmospheric Environment, China Meteorological Administration, Shenyang, China
- 2Shenyang Center of China Geological Survey, Ministry of Natural Resources, Shenyang, China
- 3Northeast Geological S&T Innovation Center of China Geological Survey, Ministry of Natural Resources, Shenyang, China
- 4Key Laboratory of Black Soil Evolution and Ecological Effect, Ministry of Natural Resources, Shenyang, China
- 5Key Laboratory of Black Soil Evolution and Ecological Effect, Liaoning, Shenyang, China
Introduction: The Northeast black soil area is an important marketable grain base in China. However, due to soil erosion, the black soil layer has been gradually thinning and its quality deteriorating. Therefore, accurately assessing the extent of soil erosion in this region is essential for the protection and sustainable utilization of black soil resources.
Methods: In this study, linear and nonlinear models were compared combined with remote sensing images to invert soil organic carbon (SOC). In the scenario of SOC change, temporally variable soil erodibility factor were obtained. Then based on the RUSLE model and GIS technology, land use, rainfall, soil texture and digital elevation model (DEM) were used to evaluate the temporal and spatial variation characteristics of soil erosion in black soil region from 1995 to 2020 in Hulan River Basin. The main influencing factors were explored by random forest model and analyzes in combination with eco-geological.
Results: The findings are as follows: The random forest (RF) model was optimal for SOC inversion (2020: R2 = 0.64, RMSE = 0.70, 2010: R2 = 0.66, RMSE = 0.35). The erosion intensity was mainly slight or mild while mean annual soil loss firstly decreased then increased from 1995 to 2020 reaching a rate of 1020.16 t km−2 y−1 by 2020. Rainfall and topography were the main driving factors of soil conservation changes, and soil erosion was more likely to occur in the eco-geological environment of the neutral rock hilly woodland area.
Discussion: The results provide insights into spatial distribution characteristics of black soils erosion which are crucial for preventing further degradation and ensuring national food security.
1 Introduction
The concentration and fertility of black soil resources in northeast China are pivotal for ensuring food and ecological security. However, extensive land reclamation and transitional development have resulted in soil erosion in the region, exacerbated by the unique topography of the floodplain. Soil erosion not only alters the physical environmental conditions of black soil and depletes soil nutrients but also leads to reduced grain production, deterioration of the ecological environment, water pollution, and severe constraints on land productivity and regional ecosystem services (Wang, F. et al., 2022; Qin and Wang, 2011; Zhu, Y., 2021; Han and Li, 2018; Yang, F. et al., 2018). Since the 1950s, there has been a significant decrease in average black soil thickness by approximately 40 cm (Wang S. et al., 2023; Huang et al., 2019). Therefore, it is of great significance to grasp the situation of black soil erosion and evaluate the spatial distribution characteristics of soil erosion for preventing degradation of black soil and ensuring national food security. At the same time, the analysis of soil erosion offers valuable insights into the investigation of regional tectonic environmental activities. Because the activities of geological structures can trigger local geomorphological changes, such as slope incisions, river terraces, water system turning, and deep valleys. These alterations contribute to the occurrence or exacerbation of soil erosion. And the erosion intensity serves as the most effective indicator for evaluating regional denudation, indirectly reflecting the characteristics of micro-geomorphological changes resulting from regional tectonic activities. Therefore, the study of soil erosion holds significant importance in assessing tectonic evolution and the development of river hydrology (Ghosh and Kundu, 2025).
Various models incorporating land use, soil texture, geomorphology, vegetation, and climate data have been developed both in China and abroad to predict and quantify soil erosion, such as the universal soil loss equation (USLE), the revised universal soil loss equation (RUSLE), Chinese Soil Loss Equation (CSLE), the water erosion prediction project, etc. Among these models, RUSLE stands out due to its easily obtainable parameters with high precision, making it widely used for assessing soil erosion in watershed areas and black soil regions (Hu et al., 2018; Ren et al., 2015; Xiong et al., 2023; Singh et al., 2023; E, 2015). Wang T. et al. (2023) conducted a spatial-temporal analysis of soil erosion in the typical black soil region of Binxian County, Heilongjiang Province from 2000 to 2020 using the RUSLE soil erosion equation. E. (2015) examined the spatial-temporal pattern and evolution process of soil erosion in WuYuer river from 1980 to 2010, while also analyzing the main driving factors of regional soil erosion based on the theories of soil erosion and landscape ecology. The results revealed that non-irrigated farmland located at elevations ranging from 150 to 200 m with slopes between 5 and 15° experienced the most severe levels of soil erosion. Additionally, Wei et al. (2006) simulated soil erosion and studied the relationship between landscape index and erosion modulus by correlation analysis and multiple regression based on RUSLE of GIS.
The RUSLE model contains rainfall erosion (R) factor, topographic (LS) factor, the land cover (C) factor, soil erodibility (K) factor and conservation measure (P) factor. The soil erodibility factor reflects the difficulty of soil dispersion and transportation (Tian et al., 2023). Previous studies on dynamic changes in soil erosion have predominantly relied on the World Soil Database (HWSD) for K factor calculations (Xue et al., 2018). However, with the intervention of human factors such as conservation tillage and afforestation, the content of organic carbon in soil has changed (Shi, W. et al., 2023). By solely utilizing one-time organic carbon information to simulate dynamic changes in soil erosion, the significance of soil erodibility in soil and water conservation may be overlooked (Tian et al., 2023). Therefore, it is necessary to dynamically evaluate the soil organic carbon (SOC) content to accurately determine erosion conditions.
This study utilized the Hulan River Basin as the research area and employed remote sensing inversion to obtain dynamic SOC content. Subsequently, by employing the RF and RUSLE models, we analyzed the spatial and temporal patterns as well as the evolutionary processes of soil erosion in a typical black soil area for 1995, 2010, and 2020. Additionally, we investigated the primary factors influencing soil erosion while exploring changes in erosion characteristics under eco-geological conditions. These findings provide valuable scientific insights for effective soil erosion control and sustainable soil and water conservation practices.
2 Materials and methods
2.1 Study area
The Hulan River Basin is located in the eastern Songnen Plain, central Heilongjiang Province, China (Figure 1). It serves as a primary tributary of the left bank of the Songhua River and receives inflows from the Nuoming River and Tongken River originating from Hulan City, Harbin. It is a fan-shaped branch with high terrain in the northeast and low in the southwest (Xu, H., 2020; Wang et al., 2015; Zhou et al., 2018). The study area with a total area of 38,719 km2 covers parts of Harbin, Heihe, Suihua and Yichun with the geographic location between 45°36′-48°6′north latitudes and 125°23′-128° 43′east longitude (Figure 1). The average annual temperature ranges from 0°C to 3°C within the Hulan River Basin. The main soil types in the study area are black soil, black calcium soil, meadow soil and dark brown earth among which the black soil area is the largest, totaling 10,291 km2. These fertile soil conditions have facilitated rapid development within the agricultural sector in this region.
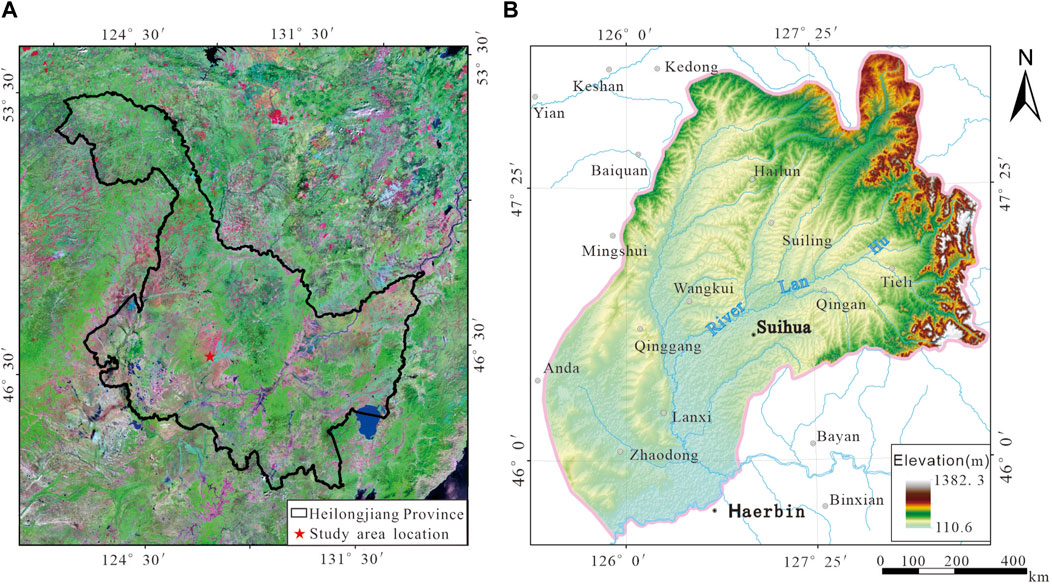
Figure 1. Hulan River Basin elevation and location map. (A) The location of the Hulan River Basin in Heilongjiang Province; and (B) The elevation map of the Hulan River Basin.
2.2 Data and materials
2.2.1 Meteorological data
The meteorological data utilized in this study comprised monthly average precipitation data at a 1 km resolution for the years 1995, 2010, and 2020 obtained from the National Tibetan Plateau Data Centre. Additionally, annual rainfall was derived through raster calculation.
2.2.2 Soil texture data
Soil texture data was obtained from the World Soil Database HWSD. The soil organic carbon (SOC) content in 1995 came from the second national soil survey in China, 2010 and 2020 were estimated through inversion of measured data.
2.2.3 DEM data
30 m resolution topographic data (SRTM DEM) were obtained from Geospatial Data Cloud.
2.2.4 Vegetation cover data
The vegetation cover data at a resolution of 250 m were acquired from the data center of the Institute of Resources and Environment, Chinese Academy of Sciences.
2.2.5 Land use land cover data
Land use data were also obtained from the data center of the Institute of Resources and Environment, Chinese Academy of Sciences. It was generated by manual visual interpretation based on Landsat. And the data format was vector data.
2.2.6 Remote sensing images
This study utilized Landsat 8 and Landsat 5 images from the USGS Earth Explorer website, captured in October 2010 and 2020. In order to improve the accuracy of SOC inversion, radiometric calibration and atmospheric correction were carried out on the images (Jiang, S. et al., 2022; Dai et al., 2023).
2.2.7 Soil sample collection
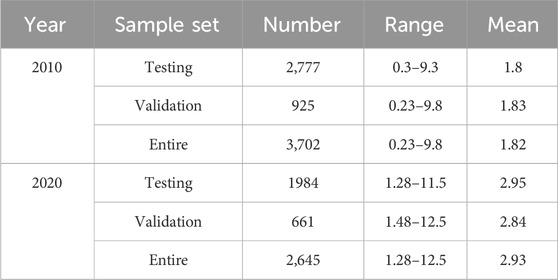
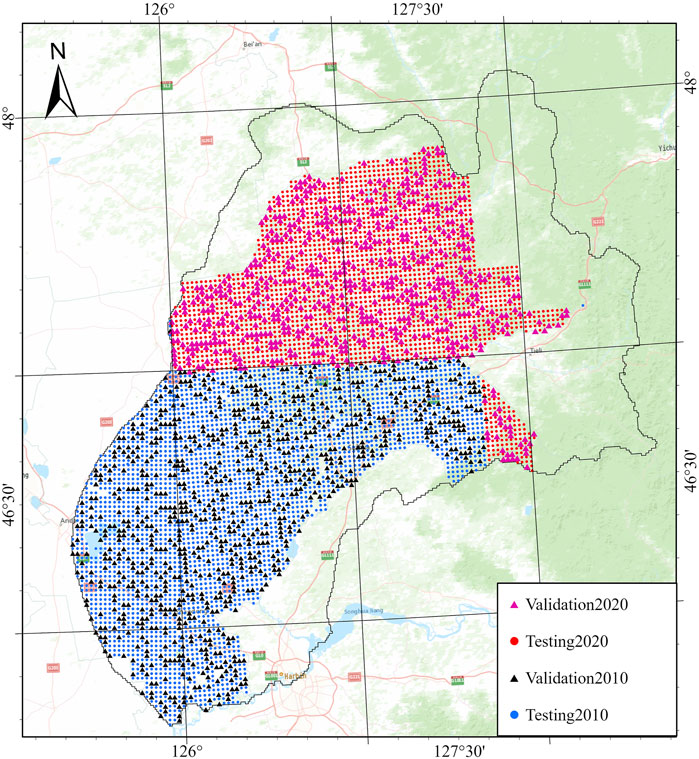
We carried out surface soil samples (0–20 cm) campaign in this area, collecting 2,645 soil samples in 2020 and 3,702 soil samples in 2010 at a density of one point per square kilometer. Following the combination of every four original samples, they were naturally air-dried and sieved through a 20-mesh nylon sieve. The organic carbon content was determined using the potassium dichromate-external heating method. Subsequently, the samples were randomly divided into training and validation sets with a ratio of three to one. Detailed information can be found in Table 1, while Figure 2 illustrates their spatial distribution.
2.3 Methods
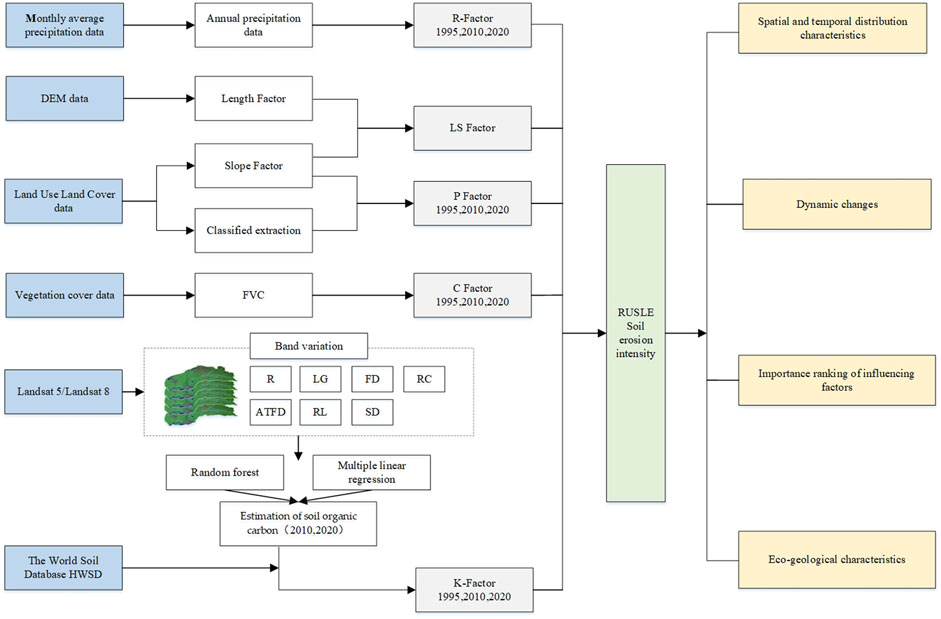
In this study, the RUSLE model (including R, K, LS, C and P factor) was used to simulate the soil erosion in the black soil area from 1995 to 2020. The SOC within the K factor was determined through a comparison between measured soil sample data and remote sensing imagery using linear and nonlinear models for inversion. The random forest algorithm was used to explore the main controlling factors affecting soil erosion in black soil, and the analysis was carried out in combination with the eco-logical and geological conditions. The flowchart is shown in Figure 3.
2.3.1 Estimation of SOC
2.3.1.1 Characteristic wavelength selection
In order to enhance the correlation between the image bands and SOC, and to enlarge the response characteristics of organic carbon band, the band reflectance (R) was mathematically transformed in the study: reciprocal (RC), logarithmic (LG), first derivative (FD), second derivative (SD), logarithm of reciprocal (RL), reciprocal logarithmic first-order differential (ATFD) transformations (Jiang, C.L. et al., 2023; Lu et al., 2020). Correlation analysis is commonly employed for feature band extraction, with Pearson correlation analysis primarily used to assess the strength and direction of linear relationships between two variables. However, soil spectral reflectance and SOC content often exhibit more complex relationships beyond simple linearity, which may lead to insufficient explanation when applying linear models for SOC inversion purposes (Jia et al., 2023). Therefore, random forest (RF) was used to select the response bands of SOC in the study. RF is a machine learning algorithm based on classification tree (Breiman, 2001). It can calculate the importance of independent variables according to the change of error. The greater the importance value, the greater the impact on SOC, which is helpful to help us understand which bands and mathematical transformations are crucial to the prediction of organic carbon (Chen et al., 2022; Zhu, Q. et al., 2020). Additionally, RF can also be employed for identifying factors influencing soil erosion (Cao et al., 2023).
2.3.1.2 Regression model
In the study of satellite remote sensing prediction SOC, the modeling methods can be roughly divided into two categories: linear and nonlinear modeling (Liu, Y.F. et al., 2017; Li, W.Y. et al., 2023). To ensure the practicality and stability of the remote sensing inversion model, as well as to build upon previous research findings, we employed multiple linear regression (MLR) and RF techniques (Zhao et al., 2019). Model with higher prediction accuracy was selected for SOC estimation to obtain K factor.
2.3.1.3 Model accuracy and validation
To assess the performance of our model, the accuracy of the inversion models of the SOC was measured using the determination coefficient (R2) and root mean square error (RMSE), The calculation method was as follows (Shi, Y.J. et al., 2022):
where
2.3.2 Soil erosion model
The revised universal soil loss equation (RUSLE) model proposed in 1997 was used to estimate the actual soil erosion in the study area (Renard et al., 1997). It has been demonstrated to be appropriate for the northeast Chinese area with black soil. The corresponding formula is listed as follows (Ma et al., 2023; Fang and Fan, 2020; Ning et al., 2023):
where A is the average annual soil loss (t ha−1 y−1), R is the rainfall erosivity factor (MJ mm ha−1 h−1 y−1), LS is the topographic factor, C is the cover management factor, and P is the conservation measure. K is the erodibility factor of soil (t ha h ha−1 MJ−1 mm−1).
2.3.2.1 Rainfall erosivity (R factor)
Rainfall erosivity refers to the potential ability of rainfall to induce soil erosion, which is determined by the physical characteristics of rainfall events (Xu, X.J. et al., 2023; Wang, W. and Jiao, 1996). The following equation, developed by Wischmeier, was used in the computation of rainfall erosivity (Arnoldus,1977; Chen, W. et al., 2023)
where R is the rainfall erosivity factor (MJ mm ha−1 h−1 y−1), P is the yearly precipitation (mm) and Pi is the precipitation in the given month (mm).
2.3.2.2 Soil erodibility (K factor)
Soil erodibility characterizes the difficulty of soil erosion and reflects the sensitivity of soil to denudation and transportation of erosion exogenic forces. The value has a high correlation with soil texture. The Erosion Productivity Impact Model (EPIC) developed by Willams was used to calculate the K factor (Williams and Singh, 1995). Its mathematical formulas are shown in Equations 5, 6:
where SAN, SIL, CLA and C are percentage content of sand, silt, clay, and organic matter, respectively. The result is an American unit. So the K value needs to be multi-plied by a conversion factor of 0.1317 in order to convert to the International System (Liu, B. et al., 2001).
2.3.2.3 Topographic (LS) factor
Topographic (LS) factor reflects the influence of topography on soil erosion. As the slope becomes longer and steeper, the water catchment area increases and the water flow speed increases, which will lead to increased soil erosion. In this paper, the calculation formula of slope length (L) factor proposed by Wischmeier and Smith (1978) and the calculation formula of slope factor (L) proposed by Liu et al. (2000) were adopted. Combined with DEM information, the LS factor value was calculated, and the topographic (LS) factor grid layer was generated. The factor is calculated using these equations Equations 7–11.
where L is the slope length factor; S is the slope steepness factor; λ is the horizontal projected slope length; α is a variable length-slope exponent; β is a factor that varies with slope gradient; and θ is the slope angle.
2.3.2.4 Land cover (C) factor
The C factor is used to reflect the effects of vegetation cover and management measures on soil erosion in the RUSLE model, while NDVI accurately captures the spatial variability of vegetation cover. Greater vegetation cover corresponds to reduced risk of soil erosion. Cai et al. (2000) utilized rainfall observation data within the watershed to establish a relationship between vegetation cover and the C factor, a method widely applied in assessing erosion within watersheds (Equations (12) and (13)) (Ma et al., 2001; Yu et al., 2006):
where
2.3.2.5 Conservation measure (P) factor
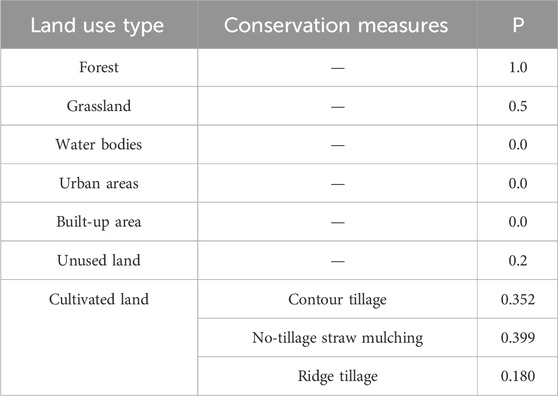
The P factor quantifies the erosion rate associated with various conservation practices. And it characterizes the impact of land use or farming systems on soil erosion. The P factor ranges from 0 to 1. The closer the P-value is to 0, the more significant the effect of implementing soil and water conservation measures are. The survey area was divided into two categories (agricultural land and non-agricultural land). Non-agricultural land needs to be combined with the actual situation of the black soil area and refer to some studies to assign the P factor using the land use type (Ma et al., 2023; Li, J.L. et al., 2020; Yang, J.J. et al., 2019). There are primarily three types of protective measures for cultivated land in the black soil region of northeast China: no-tillage straw mulching, contour tillage, and ridge tillage (Guo et al., 2013). However, further investigation is necessary to determine the precise conservation measures required in different areas. Therefore, in this study, 0.331 value of cultivated land conservation measures in Northeast black soil area stipulated in “Technical Regulations on Dynamic Monitoring of Regional Soil Erosion” promulgated by the Ministry of Water Resources of China was used as the average P-value of cultivated land in Hulan River Basin (Table 2).
3 Results
3.1 SOC estimation
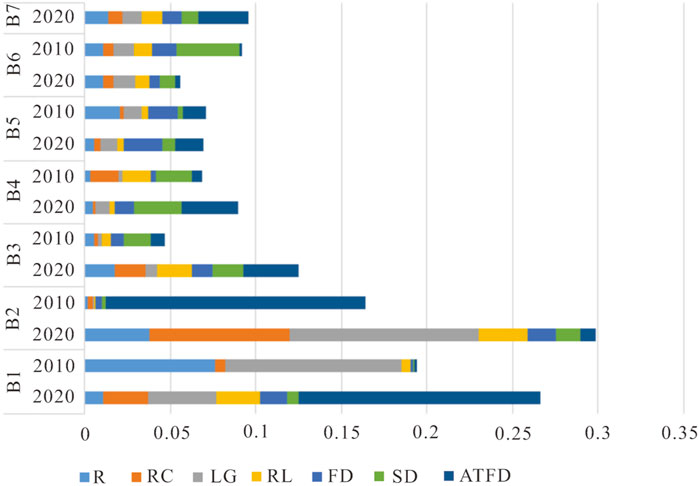
The remote sensing images and their mathematical transformation as independent variables, and Soil sample organic carbon content as the dependent variable were input into the RF model for important bands sorting (Figure 4). Then, 15 independent variables with higher influence were selected as the characteristic bands of SOC inversion for MLR and RF prediction. The model validation results are shown in Table 3. Comparing linear and nonlinear models, the R2 of RF in 2010 and 2020 were greater than the MLR. So RF was chose to estimate SOC. As shown in Figure 5, SOC ranged from 0.71% to 5.61%, with an average of 2.51% in 2010 and it ranged from 1.62 to 6.49, with an average of 2.89% in 2020. Combined with the second national soil survey (average SOC = 2.56%), SOC content increased by 12.9%. Spatially, the distribution of organic carbon in this area is low in the southwest and high in the northeast. It is mainly due to the hilly forest land in the northeast with many plant residues, high altitude and cold climate, which leads to the slow decomposition of organic matter and the high organic carbon density of forest soil. The obtained SOC distribution data were mainly used to calculate the K factor in 2010 and 2020 in combination with Formula 5.
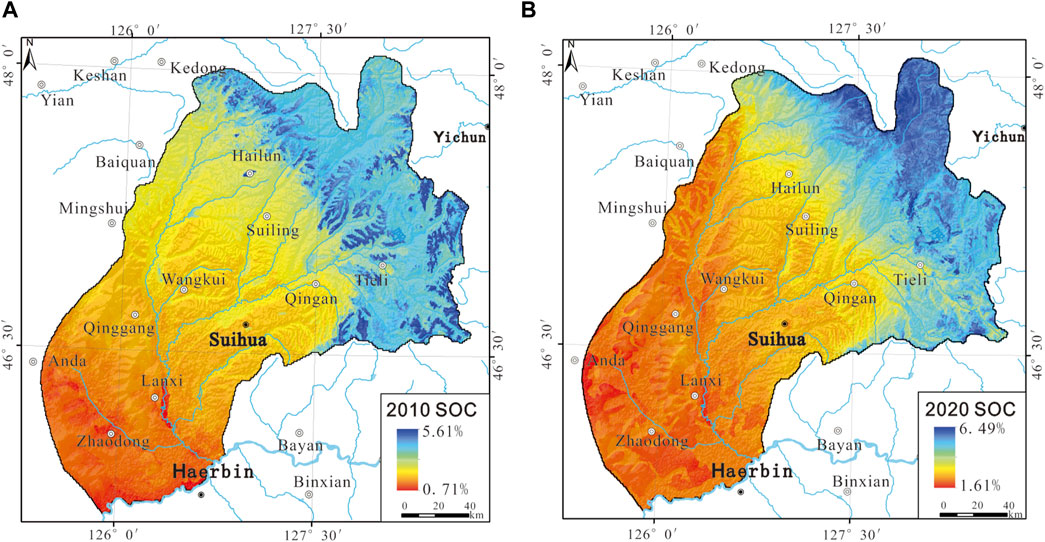
Figure 5. Prediction of spatial distribution of SOC in different years using Landsat in the Hulan River Basin. (A) 2020; and (B) 2010.
3.2 Spatio-temporal variations of black soil erosion
3.2.1 Spatio-temporal characteristics of soil erosion intensity
The soil erosion rate of Hulan River Basin in 1990,2010 and 2020 was calculated by RUSLE. The erosion rate of the Hulan River Basin showed a trend of decreasing first and then increasing from 1995 to 2020. The average of soil erosion decreased from 762.68 t km-2 y-1 to 662.22 t km-2 y-1, and then increased to 1,020.16 t km-2 y-1, and the soil erosion increased as a whole. According to the standard for soil erosion gradation and classification (SL 190–2007) released by the Ministry of Water Resources, China, the soil erosion intensity in Hulan River Basin was divided into six grades of micro-degree, where A < 2 is slight; 2 ≤ A < 25 is mild; 25 ≤ A < 50 is moderate; 50 ≤ A < 80 is strong; 80 ≤ A < 150 is very strong; and A ≥ 150 is severe. Table 4 is formed by area statistics. The area of slight erosion was about 25,882.91 km2 in 1995, increased by 1,166.41 km2 in 2010 and decreased to 24,374.21 km2 in 2020. The average of soil erosion of different grades decreased first and then increased. Since the slight erosion rep-resents that the amount of soil erosion is lower than the local soil loss tolerance, the part that really belongs to soil erosion is the soil above slight erosion. The area of above slight erosion increased by 12.74% from 1995 to 2020. Therefore, it was generally believed that the erosiveness of black soil erosion is increased.
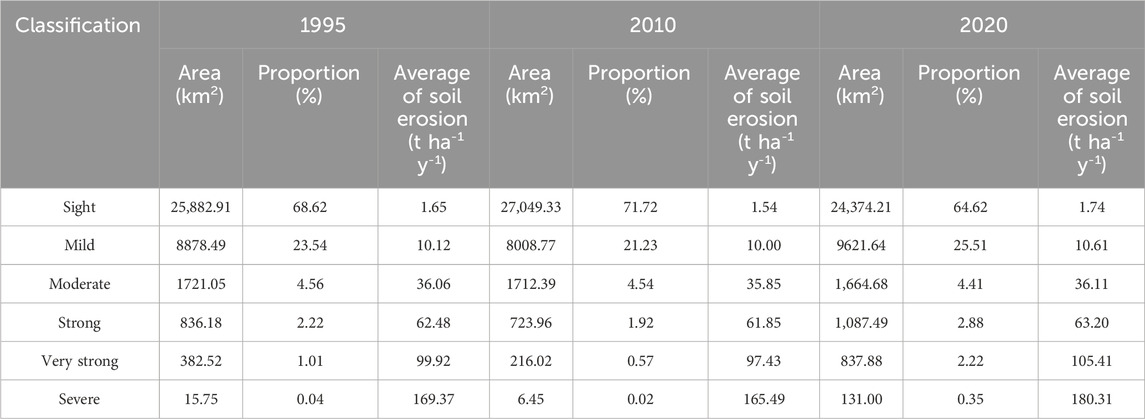
Table 4. Area of different soil erosion levels in the Hulan River Basin from 1995 to 2020 based on RUSLE.
Combined with the spatial distribution map of soil erosion grade (Figure 6), the soil erosion in Hulan River Basin from 1995 to 2020 was mainly slight and mild. More than mild erosion was mainly distributed in the higher hilly areas. The northern region of Zhaodong witnessed an increase in areas exhibiting mild erosion from 1995 to 2010, and it improved significantly from 2010 to 2020. The degree of soil erosion in other areas of the Hulan River Basin was slowed down from 1995 to 2010, but the area of erosion increased after 10 years, and the erosion area spread to the southwest and northeast.
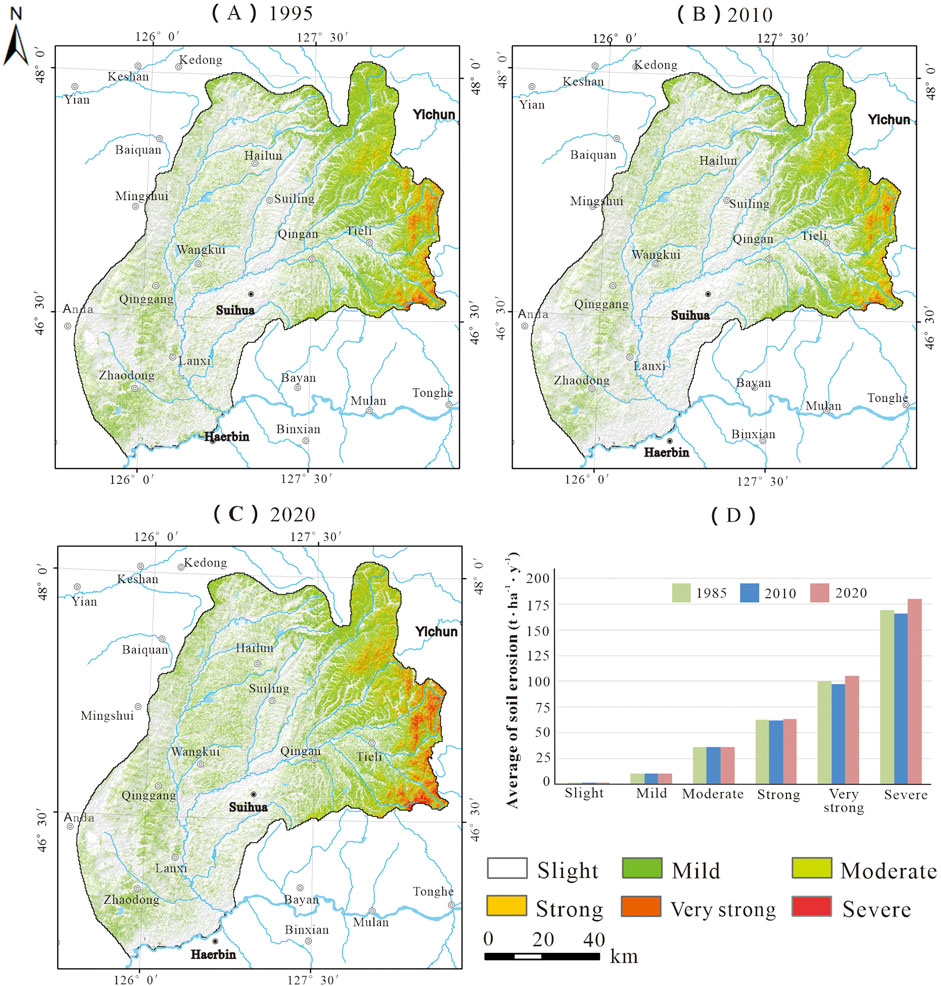
Figure 6. Distribution of different soil erosion degree and average of soil erosion statistics in Hulan River Basin from 1995 to 2020 based on RUSLE. (A) Distribution of erosion degree in 1995; (B) Distribution of erosion degree in 2010; (C) Distribution of erosion degree in 2020; and (D) The average of soil erosion in for each category.
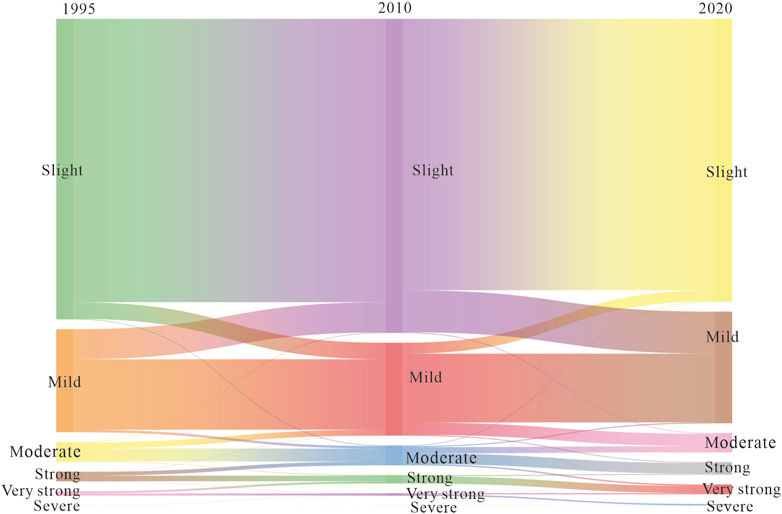
In order to explore the changes of soil erosion intensity in different degrees, this paper analyzed and counted the soil erosion grades from 1995 to 2020, calculated the area of soil erosion intensity change from 1995 to 2010 and from 2010 to 2020, and generated Figure 7. The area with constant erosion degree was 32,255.08 km2 from 1995 to 2010, accounting for 85.52% of the whole area. The area with increased erosion degree was 1763.50 km2, mainly from slight erosion to mild erosion. From 2010 to 2020, the area with constant erosion degree in Hulan River Basin was 30,009.46 km2. Among them, the area with slight erosion degree was the largest, accounting for 61.96% of the whole area. The area with strong change in erosion degree was mainly from slight to mild, with a total of 3,611.94 km2.
Combined with the spatial variation map of soil erosion intensity (Figure 8), the spatial distribution of soil erosion intensity in different regions of Hulan River Basin was revealed. The degree of soil erosion in different regions varied with time. From 1995 to 2010, the soil erosion in the Hulan River Basin was mainly slowed down, and the aggravated areas were mainly distributed on both sides of the river gully (Figure 8A). After 10 years, the degree of erosion in the higher geography of Tieli City and other places had increased significantly (Figure 8B). The degree of soil erosion in Lanxi-Suihua remained unchanged, and the degree of soil erosion in Zhaodong slowed down from 1995 to 2020 (Figure 8C). The main reason was that the land is cultivated land, and the terrain fluctuates slowly. In recent years, the state had effectively controlled the slope farmland and achieved special rectification for the surrounding small watersheds (Zhuang et al., 2006). In addition to the intensification of erosion in hilly areas, the phenomenon of soil erosion in Hailun and Suiling were also more obvious. The reason may be that human activities such as urban expansion in small and medium-sized cities have caused damage to surface vegetation and caused changes in regional soil erosion grade intensity.
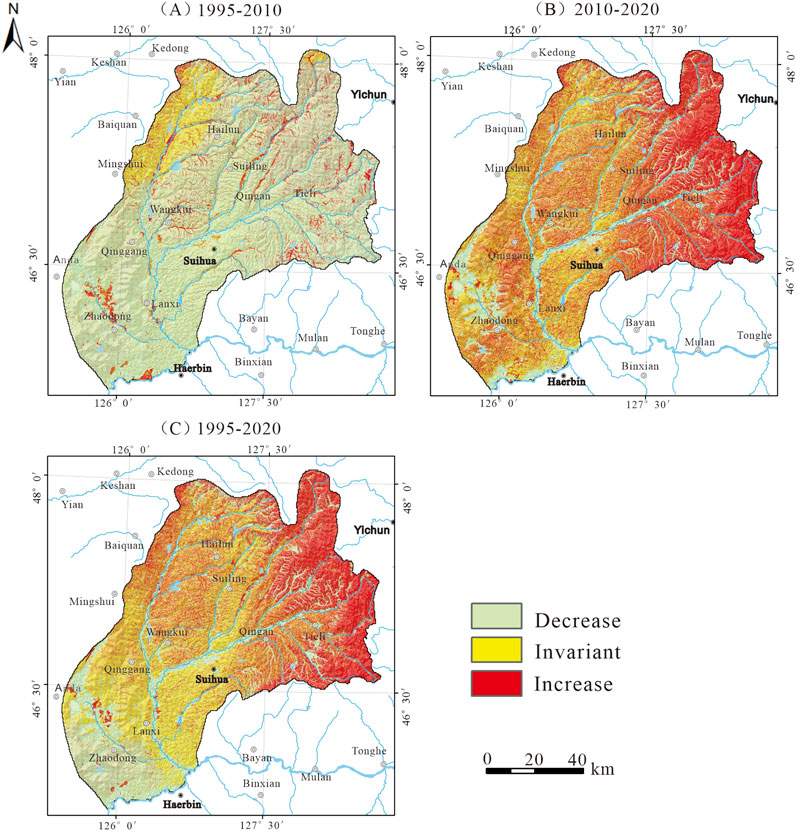
Figure 8. Spatial distribution of average annual soil loss change in Hulan River Basin. (A) Average annual soil loss change from 1995 to 2010; (B) Average annual soil loss change from 2010 to 2020; and (C) Average annual soil loss change from 1995 to 2020.
3.2.2 Effects of ecological environment factors on soil erosion
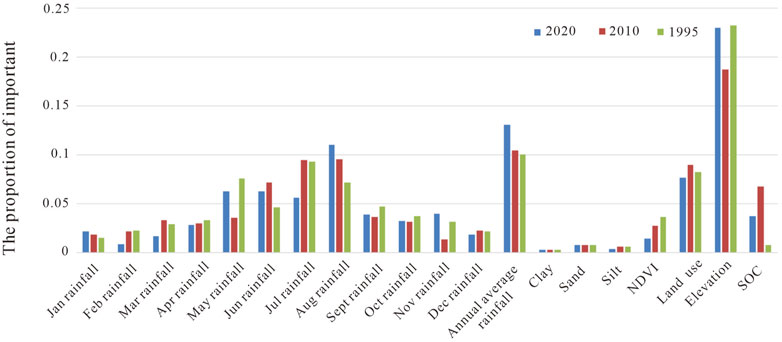
In the past, researchers mostly discussed the environmental dominant factors of soil erosion based on empirical knowledge, and rarely discussed from the model and the data itself (Liu, X. et al., 2022; Tan et al., 2023). According to Equation 3, RUSLE is composed of rainfall erosion factor, slope length–steepness factor, cover management factor conservation Measure factor and soil erodibility factor. It includes 20 data such as annual average rainfall, 12-month monthly average rainfall, sand content, silt content, clay content, organic carbon content, elevation, vegetation coverage and land use. Therefore, soil erosion is related to factors such as rainfall, soil texture, topography, vegetation covers and land use. In order to explore the main factors affecting soil and water loss in black soil, 20 indicators in 1995,2010 and 2020 were used as input values, and the importance degree was sorted by RF model. As shown in Figure 9, elevation has the greatest impact on soil erosion in the three-phase data analysis, followed by average annual rainfall.
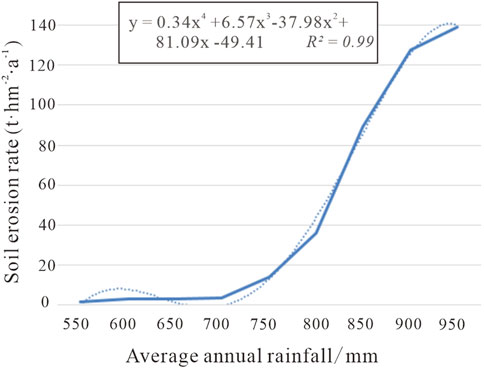
The relationship between soil erosion and average annual rainfall in black soil is shown in Figure 10. The relationship between erosion rate and annual average rainfall was a quartic polynomial fitting relationship, and R2 was 0.99. When the average annual rainfall was less than 700 mm, the change of rainfall had little effect on erosion. At this time, the occurrence of soil and water loss was mainly controlled by the small topographic fluctuation. When the rainfall exceeded 700 mm, rainfall became the dominant factor, and the erosion capacity increased with the increase of rainfall.
According to the natural discontinuity method, the elevation data of Hulan River Basin were divided into 8 grades (<156, (156,203), (203,259), (259,337), (337,430), (430,560), (560,776), ≥ 776 m). The changes of annual soil erosion rate at different elevation levels were analyzed. The impact of elevation on erosion is primarily related to the degree of topographic relief. Since the Late Pleistocene, the neotectonic movement has exhibited limited intensity, while the geomorphological evolution in the region has displayed characteristics indicative of an intermediate stage, and a positive correlation between elevation and relief can be observed. As shown in Figure 11, the terrain < 337 m was high plain, first platform and river beach. The terrain exhibits a slight undulation, and the influence of altitude on soil erosion is relatively negligible, thereby minimizing the likelihood of inducing soil erosion. As the elevation of hilly areas exceeded 430 m, the amount of soil erosion increased significantly with the increase of altitude. The primary factor was in the gradual increase of topographic relief, which led to an acceleration of rainwater flow and the subsequent formation of runoff. As the flow potential energy increases, the erosion of the soil below became more intense.
3.2.3 Eco-geological characteristics of soil erosion
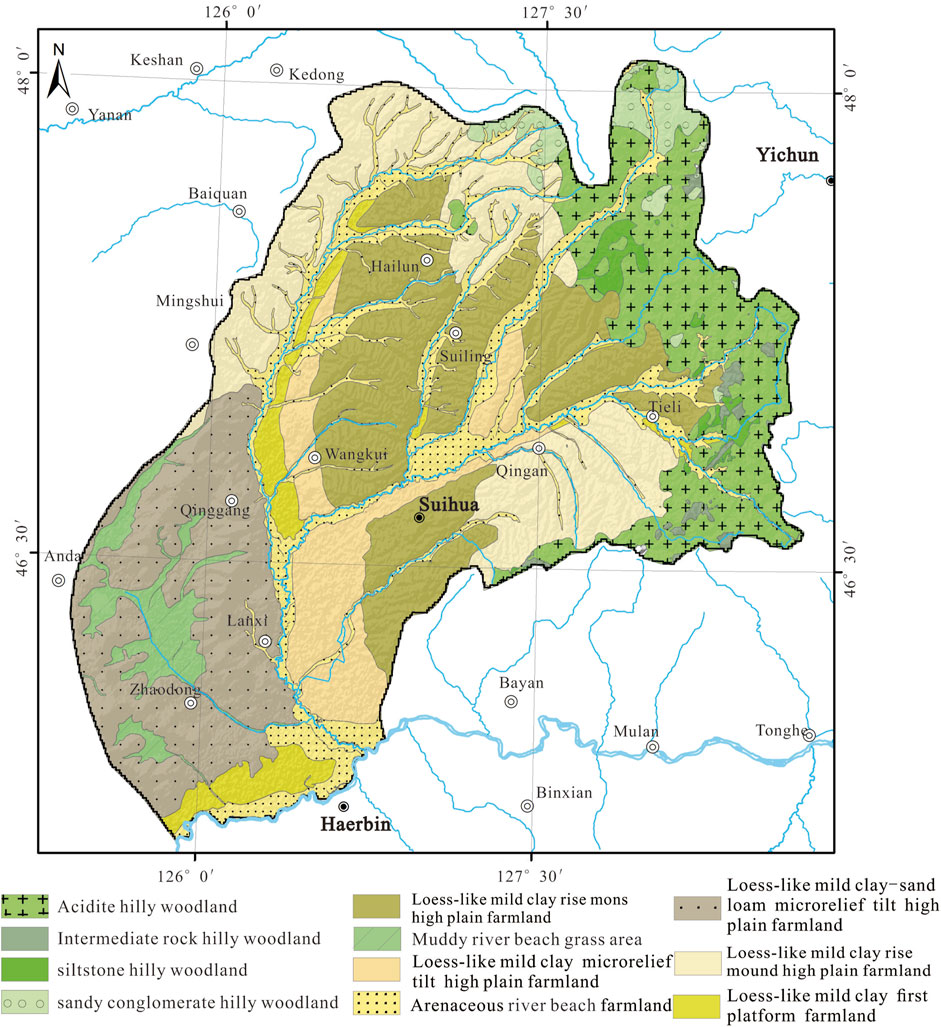
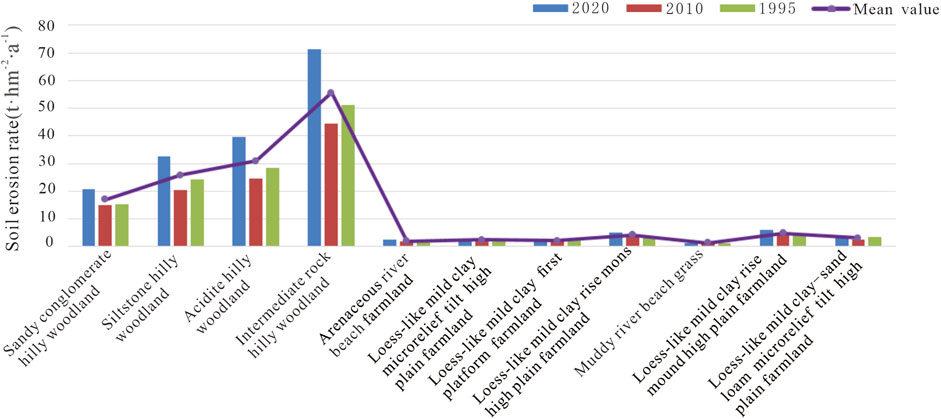
Eco-geological was first proposed by K. Tsol, a former Soviet Union scientist, to study the changes in the geological circle under the influence of human activities and natural factors (Wu and Liu, 2003). Subsequently, it was developed to study various ecological problems or ecological course in combination with geological mechanism investigation (Nie et al., 2019). Discussion on black soil erosion from the perspective of eco-geological is a research hotspot of soil erosion at present. By analyzing the erosion of black soil under different eco-geological conditions, it is helpful to explore the characteristics of ecological and geological comprehensive environment under the difference of erosion. The division of 11 eco-geological units in the Hulan River Basin was achieved by overlaying spatial data on the actual conditions of soil-forming parent material and parent rock, topography and landform, as well as land use, in accordance with the classification system presented in Table 5 (Figure 12). By counting the degree of change of erosion rate in different eco-logical geological areas, it was found that the intermediate rock hilly woodland was most easily to soil erosion (Figure 13). From 1995 to 2020, the soil erosion rate was 55.64 t ha−1 y−1, which was strong erosion. Mainly because of its location conditions would be subject to relatively strong water erosion. The erosion rate of sandy conglomerate hilly woodland is lower than that of the siltstone hilly woodland, it is because that the fragility of the same lithology affects the difficulty of soil erosion. The harder the lithology and the more stable the soil structure formed by weathering. Its ability to resist the erosion and dispersion of runoff on the soil itself is stronger, and it is not easy to be washed away by rainwater, so the stronger the soil erosion resistance, the less prone to soil erosion. In the cultivated land, the erosion degree of the loess-like mild clay rise mound high plain farmland area is higher. The average annual erosion amount reached 482.19 t km−2 a−1. The main reason is that the soil type in this area is loess-like mild clay with high clay content and poor permeability. This structure determines that the black soil has weak corrosion resistance and is prone to surface runoff. At the same time, the surface fluctuation degree is 20m∼30 m, which is prone to soil erosion (Yang and Meng, 2012; Li, Y., 2022). The eco-geological geological analysis of soil erosion is helpful for us to carry out erosion control place-based in the future.
4 Discussion
Black land resources play an irreplaceable role in ensuring food security in China. For a long time, due to natural factors and unreasonable human production and operation activities, soil erosion in the black soil area of Northeast China has been increasing (Li, T., 2012). The RUSLE model has been widely recognized as a valuable tool for assessing soil erosion risk at the watershed scale. However, it is important to note that the methods of obtaining factors and the sources of basic data may vary across different regions. But the K factor is predominantly calculated using Equations 5, 6 in Asia and Africa. For example, the formulas were employed by Okenmuo and Ewemoje (2023) in recent years to compute soil water erosion in Obibia River watershed, Anambra, Nigeria. Richi (2025) used the same formulas to determine the degrees of soil erosion risk in Ghamima River Basin, Syria. And the Global Soil Grid Database (Data time span:1971–1981) was utilized for the soil data involved. Furthermore, numerous studies have used second national soil survey in China to calculate the K value of long time series. But the alterations in soil physical and chemical properties exert an influence on the estimation of the model (Fang and Fan, 2020).
In this paper, the soil erosion assessment of Hulan River Basin in typical black soil area from 1995 to 2020 was carried out in combination with temporally variable SOC by using RUSLE. During the period from 1995 to 2020, there was an initial decline followed by subsequent increase in SOC levels within typical black soil regions as observed in this study. Combined with Equation 5, the K value of each year is obtained (Table 6). The SOC and K values exhibit a negative correlation. If the SOCs for 1995, 2010, and 2020 are both calibrated based on the organic carbon content at the time of the second national soil survey in China, then there will be a slight underestimation of 0.0005 in the K value for 2010 and a marginal overestimation of 0.0002 in the K value for 2020. The slight error in the value of K will result in a deviation ranging from-70.5 to 673.8 t km-2 y−1 in the erosion of the entire black soil area in 2010, and a deviation ranging from −90.94 to 628.3 t km−2 y−1 in 2020. This discrepancy poses significant challenges to accurately assessing black soil erosion. Through model calculation, it is considered that the degree of soil erosion in Hulan River Basin is mainly slight degree, and the erosion rate decreases first and then increases. It aligns with the outcomes in Cheng, J et al. (2024). The occurrence of more intense erosion was observed in areas with higher relief, which aligns with the findings of Abdo’s study on estimating potential soil erosion in Khawabi river basin, Tartous, Syria using RUSLE (Abdo, 2022). The researcher also used the latest soil data to estimate the K Factor. However, the lack of model validation data in the study area of the Hulan River Basin makes it impossible to quantitatively verify the model-based conclusions. In the future, the 137Cs tracer method will be used to calculate the total erosion amount in the region, and the model will be verified.
5 Conclusion
In this study, the measured soil information combined with remote sensing image was used to invert SOC and calculate dynamic soil erodibility factor. And the distribution and temporal and spatial variation characteristics of soil erosion in the Hulan River Basin in 1995,2010 and 2020 were simulated by the RUSLE model. The main ecological environment factors affecting the erosion of black soil were explored by random forest model, and soil erosion was analyzed in combination with eco-geological zoning. Our results show that: From 1995 to 2020, SOC content increased by 15.6% in the Hulan River Basin. It was dominated by slight and mild erosion, and the severe erosion was mainly distributed in hilly areas. The erosion rate decreased first and then increased. The average annual water erosion rate in 2020 was 1020.16 t km−2 a−1. From 1995 to 2010, the area with improved erosion degree was 3,698. 33 km2. From 2010 to 2020, the areas with strong changes in erosion degree were mainly concentrated in higher terrain areas. The average annual rainfall and elevation were the main factors affecting soil erosion in black soil area. When the altitude was greater than 337 m, the amount of soil erosion increased significantly with the increase of altitude. When the average annual rainfall was less than 700 mm, the topography was the dominant factor of soil erosion disaster. From the perspective of eco-geological characteristics, the erosion degree of hilly forest land was large, and the harder the soil parent rock of the same lithology was, the less likely the soil formed by weathering was to suffer from soil erosion.
Data availability statement
The original contributions presented in the study are included in the article/Supplementary Material, further inquiries can be directed to the corresponding author.
Author contributions
CC: Data curation, Writing–original draft, Writing–review and editing. ZY: Data curation, Writing–review and editing. KL: Investigation, Validation, Writing–review and editing. HD: Data curation, Writing–review and editing.
Funding
The author(s) declare financial support was received for the research, authorship, and/or publication of this article. This research was funded by the funding projects of Joint Open Fund of Shenyang Atmospheric Environment Research Institute of China Meteorological Administration and Liaoning Provincial Key Laboratory of Agrometeorological Disasters. (NO. 2023SYIAEKFMS31), Northeast Geological S&T Innovation Center of China Geological Survey (NO. QCJJ2023-38), China Geological Survey (NO. DD20230089 and NO.DD20230762), Strategic Priority Research Program of the Chinese Academy of Sciences (XDA28020302) and National Key Research and Development Program of China (Grant No.2023YFD1500801).
Conflict of interest
The authors declare that the research was conducted in the absence of any commercial or financial relationships that could be construed as a potential conflict of interest.
Publisher’s note
All claims expressed in this article are solely those of the authors and do not necessarily represent those of their affiliated organizations, or those of the publisher, the editors and the reviewers. Any product that may be evaluated in this article, or claim that may be made by its manufacturer, is not guaranteed or endorsed by the publisher.
Supplementary material
The Supplementary Material for this article can be found online at: https://www.frontiersin.org/articles/10.3389/fenvs.2024.1455737/full#supplementary-material
References
Abdo, H. (2022). Evaluating the potential soil erosion rate based on RUSLE model, GIS, and RS in Khawabi river basin, Tartous, Syria. DYSONA - Appl. Sci. 3 (1), 24–32. doi:10.30493/das.2021.311044
E, L. S. (2015). “Study on spatial temporal patterns and contributory factors of soil erosion in wuyur River Basin,” in Master. Harbin China: Harbin Normal University.
Cai, C. F., Ding, S. W., Shi, Z. H., Huang, L., and Zhang, G. (2000). Study of applying USLE and geographical information system IDRISI to predict soil erosion in small watershed. J. soil water conservation 2, 19–24. doi:10.13870/j.cnki.stbcxb.2000.02.005
Cao, Z., Chen, G., Zhang, S., Huang, S., Wu, Y., Dong, F., et al. (2023). An assessment of soil loss by water erosion in No-tillage and mulching, China. China. Water 15, 2821. doi:10.3390/w15152821
Chen, C. C., Dai, H. M., Feng, Y. L., Yang, Z., and Yang, J. J. (2022). Sentinel-2A based inversion of the organic matter content of soil in the Sunwu area. Geophys. and Geochem. Explor. 46, 1141–1148. doi:10.11720/wtyht.2022.0038
Chen, W., Huang, Y. C., Lebar, K., and Bezak, N. (2023). A systematic review of the incorrect use of an empirical equation for the estimation of the rainfall erosivity around the globe. Earth-Science Rev. 238, 104339. doi:10.1016/j.earscirev.2023.104339
Cheng, J., Zhang, X., Jia, M., Su, Q., Kong, D., and Zhang, Y. (2024). Integrated use of GIS and USLE models for LULC change analysis and soil erosion risk assessment in the hulan River Basin. Northeastern China. Water 16, 241. doi:10.3390/w16020241
Dai, J. J., Liu, T. Y., Zhao, Y. Y., Tian, S. F., Ye, C. Y., and Nie, Z. (2023). Remote sensing inversion of the zabuye salt lake in tibet, China using LightGBM algorithm. Front. Earth Sci. 10. doi:10.3389/feart.2022.1022280
Fang, H., and Fan, Z. (2020). Assessment of soil erosion at multiple spatial scales following land use changes in 1980–2017 in the black soil region, (NE) China. Int. J. Environ. Res. Public Health17 7378, 7378. doi:10.3390/ijerph17207378
Ghosh, S., and Kundu, S. (2025). Fluvial anomaly as indicator of tectonically active landscapes: a study in the Darjeeling Sikkim Himalaya, India. DYSONA - Appl. Sci. 6 (1), 70–85. doi:10.30493/das.2024.479536
Guo, Q. K., Liu, B. Y., Zhu, S. B., Wang, G. Y., Liu, N. Y., and Wang, A. J. (2013). Main factors of soil and water conservation tillage in China. Soil Water Conservation China 10, 22–26. doi:10.14123/j.cnki.swcc.2013.10.009
Han, X. Z., and Li, N. (2018). Research progress of black soil in Northeast China. Sci. Geogr. Sin. 38 (7), 1032–1041. doi:10.13249/j.cnki.sgs.2018.07.004
Hu, G., Song, H., Shi, X. J., Zhang, M. L., Liu, X. J., and Zhang, X. L. (2018). Soil erosion characteristics based on RUSLE in the wohushan reservoir watershed. Sci. Geogr. Sin. 38, 610–617. doi:10.13249/j.cnki.sgs.2018.04.015
Huang, D. H., Du, P. F., Wang, J., Wei, X., Liu, B., and Xu, J. J. (2019). Using reservoir deposits to quantify the source contributions to the sediment yield in the Black Soil Region, Northeast China, based on the fingerprinting technique. Geomorphology 339, 1–18. doi:10.1016/j.geomorph.2019.04.005
Jia, L., Yang, L., Ji, Y., Li, Y., and Dong, Q. (2023). Review on inversion of soil organic matter using satellite remote sensing. Remote Sens. Inf. 38 (2), 1–9. doi:10.20091/j.cnki.1000-3177.2023.02.001
Jiang, S., Liu, H. S., Lian, M. J., Lu, C. W., Zhang, S., Li, J. Y., et al. (2022). Rock slope displacement prediction based on multi-source information fusion and SSA-DELM model. Front. Environ. Sci. 10. doi:10.3389/fenvs.2022.982069
Jiang, C. L., Zhao, J. Y., and Li, G. R. (2023). Integration of Vis–NIR spectroscopy and machine learning techniques to predict eight soil parameters in Alpine Regions. Agronomy 13 (11), 2816. doi:10.3390/agronomy13112816
Li, J. L., Sun, R. H., Xiong, M. Q., and Yang, G. C. (2020). Estimation of soil erosion based on the RUSLE model in China. Acta Ecol. Sin. 40, 3473–3485. doi:10.5846/stxb201903290610
Li, W. Y., Mamat, S., and Maihemuti, B. (2023). Fractional differential-based hyperspectral inversion of soil organic matter content. Laser and Optoelectron. Prog. 60, 1–13. doi:10.3788/LOP220715
Li, T. (2012). “A cause study and module simulation of gully erosion in black soil region,” in Doctor. Northeast Institute of geography and agroecology, Chinese Academy of Sciences. China: Changchun.
Li, Y. (2022). The influence of lithology on the spatial distribution of soil erosion in Dafang County. Master. Guilin, China: Guilin University.
Liu, B. Y., Nearing, M. A., Shi, P. J., and Jia, Z. W. (2000). Slope length effects on soil loss for steep slopes. Soil Sci. Soc. Am. J. 64, 1759–1763. doi:10.2136/sssaj2000.6451759x
Liu, B., Xie, Y., and Zhang, K. (2001). Soil erosion forecasting model. Beijing, China: China Science and Technology Press.
Liu, Y. F., Song, Y. L., Guo, L., Chen, Y. Y., Lu, Y. N., and Liu, Y. (2017). Geostatistical models of soil organic carbon density prediction based on soil hyperspectral reflectance. Trans. Chin. Soc. Agric. Eng. 33, 183–191. doi:10.11975/j.issn.1002-6819.2017.02.025
Liu, X. M., Li, Y., Huang, Z. G., Deng, Y. S., Guo, H., and He, Q. (2022). Soil erosion characteristics of sugarcane growing watershed based on RUSLE. Bull. Soil Water Conservation 42 (82-88), 397. doi:10.13961/j.cnki.stbctb.20220310.001
Lu, Z. J., Liu, K. B., Xin, R., Fu, B., Huang, N., and Liu, Y. X. (2020). Spatial pattern inversion of soil surface organic matter in Qinggang County, Heilongjiang Province based on Sentinel 2A. Heilongjiang Agric. Sci. 10, 89–93. doi:10.11942/j.issn1002-2767.2022.10.0089
Ma, C. F., Ma, J. W., and Aosaier, B. (2001). Quantitative assessment of vegetation coverage factor in USLE model using remote sensing data. Bull. Soil Water Conservation 21, 6–9. doi:10.13961/j.cnki.stbctb.2001.04.002
Ma, S., Wang, L. J., Wang, H. Y., Zhao, Y. G., and Jiang, J. (2023). Impacts of land use/land cover and soil property changes on soil erosion in the black soil region, China. J. Environ. Manag. 328, 117024. doi:10.1016/j.jenvman.2022.117024
Nie, H. F., Xiao, C. L., and Guo, Z. C. (2019). Exploring the secret of ecosystem operation and evolution-interpretation of ecological geological survey ideas and methods. Sci. Cult. Popularization Land Resour. 04, 4–13.
Ning, J., Zhang, H. M., Shi, D. W., and Du, G. M. (2023). Analysis of trade-offs/synergies in land use function changes in Bin County, China. Front. Environ. Sci. 11. doi:10.3389/fenvs.2023.1120704
Okenmuo, F., and Ewemoje, T. (2023). Estimation of soil water erosion using RUSLE, GIS, and remote sensing in Obibia River watershed, Anambra, Nigeria. DYSONA - Appl. Sci. 4 (1), 6–14. doi:10.30493/das.2022.349144
Qin, J. X., and Wang, Z. L. (2011). Prediction of soil erosion in Conghua City based on GIS and RUSLE. Pearl River. 2, 37–41. doi:10.3969/j.issn.1001-9235.2011.02.012
Ren, K., Mei, K., Zhu, H. M., He, R., Zhu, Y. L., Lu, P., et al. (2015). Quantitative estimation of soil erosion in Shanxi Reservoir basin based on RUSLE. Chin. J. Ecol. 7, 1950–1958. doi:10.13292/j.1000-4890.20150612.009
Renard, K. G., Foster, G. R., Weesies, G. A., Mccool, D. K., and Yoder, D. C. (1997). Predicting soil erosion by water: a guide to conservation planning with the revised universal soil loss equation (RUSLE). U. S. Agriclture Handb.
Richi, S. (2025). Integrated RUSLE-GIS modeling for enhancing soil erosion management in Ghamima River Basin, Syria. DYSONA - Appl. Sci. 6 (1), 104–112. doi:10.30493/das.2024.479955
Shi, Y. J., Gao, Y., Wang, Y., Luo, D. N., Chen, S. Z., Ding, Z. T., et al. (2022). Using unmanned aerial vehicle-based multispectral image data to monitor the growth of intercropping crops in tea plantation. Front. plant Sci. 13, 820585. doi:10.3389/fpls.2022.820585
Shi, W. H., Wen, X. L., Li, S. H., Cheng, F. H., Zhao, S. L., Wang, Q. T., et al. (2023). Effects of green manure returning on soil aggregation, erodibility and organic matter. Jiangsu Agric. Sci. 51, 195–201. doi:10.15889/j.issn.1002-1302.2023.12.027
Singh, M. C., Sur, K., Al-Ansari, N., Arya, P. K., Verma, V. K., and Malik, A. (2023). GIS integrated RUSLE model-based soil loss estimation and watershed prioritization for land and water conservation aspects. Front. Environ. Sci. 11, 1136243. doi:10.3389/fenvs.2023.1136243
Tan, Y. B., Xie, J. L., Ran, J. H., Wang, Y. Q., Ai, J. Q., Tang, Y., et al. (2023). Analysis of spatio-temporal change and influencing factors of soil erosion in poyang lake basin based on RUSLE. J. Southwest Univ. Nat. Sci. Ed. 45, 46–56. doi:10.13718/j.cnki.xdzk.2023.09.005
Tian, Z. Y, Liang, Y., Zhao, Y., Cao, L. X., Zhao, Y., and Wu, Y. H. (2023). Updating method of soil erodibility factor in water-erosion areas of China and its application. Sci. Soil Water Conservation 21, 63–70. doi:10.16843/j.sswc.2023.06.007
Wang, W. Z., and Jiao, J. Y. (1996). Quantitative evaluation on factors influencing soil erosion in China. Bull. Soil Water Conservation 5, 1–20.
Wang, B., Wei, Y. X., Huang, J. B., Zhu, S. J., Zhang, Y., Lu, L. B., et al. (2015). Estimation and analysis of leaf area index in Hulan River basin. J. Eng. Heilongjiang Univ. 4 (1-5), 22. doi:10.13524/j.2095-008x.2015.04.054
Wang, F., Liu, J., Fu, T., Gao, H., and Qi, F. (2022). Spatio-temporal variations in soil erosion and its influence factors in Taihang Mountain area based on RUSLE modeling. Chin. J. Eco-Agriculture 30, 1064–1076. doi:10.12357/cjea.20220043
Wang, S., Xu, X., and Cao, W. (2023). Spatial and temporal changes of erosion in the black soil region of Northeast China from 2000 to 2020. Resour. Sci. 45, 951–965. doi:10.18402/resci.2023.05.06
Wang, T., Lu, Z. J., Ning, J., Fu, B., Xin, R., Huang, N., et al. (2023). Temporal and spatial characteristics of soil erosion in typical counties of black soil region based on RUSLE. Bull. Soil Water Conservation 43, 227–234. doi:10.13961/j.cnki.stbctb.2023.05.027
Wei, J., Xiao, D. N, Li, X. Z., Bu, R. C., and Zhang, C. S. (2006). Relationship between landscape pattern and soil erosion of an agricultural watershed in the Mollisols region of northeastern China. Acta Ecol. Sin. 8, 2608–2615. doi:10.3321/j.issn:1000-0933.2006.08.025
Williams, J. R., and Singh, V. (1995). The EPIC model. Computer models of watershed hydrology. Water Resour. 25, 909–1000.
Wu, C., and Liu, P. (2003). Ecological geological survey Work-Russia 's situation and enlightenment. Land Resour. Inf. 12, 36–42.
Xiong, M. Q., Liu, X. H., Zhang, X. F., Liu, J. F., Zheng, Y. W., Zhang, Z. F., et al. (2023). Spatio-temporal variation of soil conservation in the upper reaches of the Tarim River Basin based on RUSLE model. Geol. Bull. China, 1–13. doi:10.12097/gbc.2022.07.027
Xu, X. J., Yan, Y. J., Dai, Q. H., Yi, X. S., Hu, Z. Y., and Cen, L. P. (2023). Spatial and temporal dynamics of rainfall erosivity in the karst region of southwest China: interannual and seasonal changes. CATENA 221, 106763. doi:10.1016/j.catena.2022.106763
Xu, H. (2020). “Impact of groundwater irrigation on ammonia nitrogen migration process in Hulan River Basin,” in Master. Jilin China: Jilin University.
Xue, J. P., Lyu, D. W., Wang, D. Y., Wang, Y. M., Yin, D. L., Zhao, Z., et al. (2018). Assessment of soil erosion dynamics using the GIS-based RUSLE model: a case study of wangjiagou watershed from the three gorges reservoir region, southwestern China. Water 10, 1817. doi:10.3390/w10121817
Yang, Y., and Meng, Q. (2012). Soil erosion formation of soil erosion and soil and water conservation engineering prevention and control measures. Jilin Agric. 06, 197–198.
Yang, F., Song, J., Zhao, Y., Zhao, J., and Niu, C. (2018). Dynamic monitoring of ecological environment in black soil erosion area of Northeast China based on Remote Sensing. Res. Environ. Sci. 31, 1580–1587. doi:10.13198/j.issn.1001-6929.2018.05.24
Yang, J. J., Bai, L., and Wu, S. (2019). Study on the erosion in typical black soil areas of Heilongjiang Province by remote sensing monitoring technology. Geol. Resour. 28, 193–199+183. doi:10.13686/j.cnki.dzyzy.2019.02.013
Yu, R., Kang, Q., and Zhang, Z. X. (2006). Assessment of vegetation coverage factor in soil erosion model based on ASTER image interpretation. J. Hebei Normal Univ. 30 (1), 113–117. doi:10.3969/j.issn.1000-5854.2006.01.030
Zhao, X., Xu, Z. J., Yin, J. P., Bi, R. T., Feng, J. F., and Liu, P. (2019). Retrieval of soil organic carbon in cinnamon mining belt subsidence area based on OLI and 6SV. Spectrosc. Spectr. Analysis 39, 886–893. doi:10.3964/j.issn.1000-0593(2019)03-0886-08
Zhou, G. (2018). Study on the intra-annual runoff distribution characteristics in Hulan River Basin. Water Resour. Power 36, 39–43.
Zhu, Q., Guo, J. X., Guo, X., Han, Y., Liu, S. Y., Chen, L., et al. (2020). Research on influencing factors of soil erosion based on random forest algorithm——a case study in upper reaches of ganjiang River Basin. Bull. Soil Water Conservation 40, 59–68. doi:10.13961/j.cnki.stbctb.2020.02.009
Zhu, Y. (2021). A Study on soil erosion patterns and their responses to land use changes in a low mountain and hilly region of Northeast China. Jilin China: Jilin University.
Keywords: black soil erosion, soil organic carbon, RUSLE, random forest, eco-geological, Hulan River Basin
Citation: Chen C, Yang Z, Liu K and Dai H (2024) Spatio-temporal variations of black soil erosion under the scenario of soil organic carbon change based on RUSLE and random forest. Front. Environ. Sci. 12:1455737. doi: 10.3389/fenvs.2024.1455737
Received: 27 June 2024; Accepted: 24 October 2024;
Published: 07 November 2024.
Edited by:
Sawaid Abbas, University of the Punjab, PakistanCopyright © 2024 Chen, Yang, Liu and Dai. This is an open-access article distributed under the terms of the Creative Commons Attribution License (CC BY). The use, distribution or reproduction in other forums is permitted, provided the original author(s) and the copyright owner(s) are credited and that the original publication in this journal is cited, in accordance with accepted academic practice. No use, distribution or reproduction is permitted which does not comply with these terms.
*Correspondence: Ze Yang, eWFuZ3plMDkwMkAxNjMuY29t
 Chaoqun Chen
 Ze Yang
 Kai Liu
 Huimin Dai