- School of Humanities and Arts, Hunan International Economics University, Changsha, China
Introduction: A nature-connected environment is important for constructing building infrastructures in a sustainable city. However, its realistic application is rarely utilized in urban planning, primarily due to a lack of accurate regression of emotional perceptions of nature connectedness against existing landscape metrics.
Method: In this study, Changsha was selected as the study area, targeting 50 urban parks as plots, with 165 left unselected for prediction. Twenty pedestrians were randomly approached to assess their emotional perceptions of nature connectedness. Self-reported data were used to evaluate positive and negative emotion scores (Cronbach α: 0.803) and the emotional nonparametric relation index (ENRI) (Pearson correlation in retest: R square = 66.37%).
Results: Three machine-learning algorithms (random forest, AdaBoost, and gradient boosting trees [GBT]) were compared, with GBT being selected (R square: 76.49 ‒ 88.64 %) for further comparison with multivariate linear regression (MLR). Principal component analysis was used for verification, and the GBT algorithm surpassed MLR in regression performance. The green view index (GVI) in large and open green spaces was found to correlate with perceptions of positive emotions (parameter estimate [PE]: 0.02 ‒ 0.13). Conversely, large areas of green and blue spaces with low GVI on the flat plane were found to evoke negative emotions (PE: -0.13 and -0.04, respectively).
Discussion: Artificial intelligence was used for describing cases of design using our findings. For the purpose to evoke positive emotion of visitors, building embedded landscape can be designed in distant view with large tree canopies in closer view. Large area of green and blue spaces should not be recommended no matter whether buildings background the view.
1 Introduction
The United Nations published the Sustainable Development Goals (SDGs) to integrate states into a sustainable world. Building-embedded landscapes frame the major pillars of a city, but urban nature plays a significant role in sustainable social development (Fu et al., 2024; Wei et al., 2022a). Green and blue spaces (GBSs) are the primary components of urban nature and have been specifically highlighted to attract attention for promoting sustainable landscapes, as seen in SDG 15 “Life on Land” (Nasrabadi et al., 2023; Walter et al., 2023). Designing a sustainability-promoted building landscape must incorporate elements of GBS to improve access to urban nature (Talal and Gruntman, 2023), environmental justice (Walter et al., 2023), biodiversity conservation (Rajan et al., 2019; Wei et al., 2022b), social cohesion (Dawson et al., 2023; Dawson et al., 2024), and micro-climate mitigation (Li et al., 2022a; Roy et al., 2021). Public attention is increasingly drawn to these nature objectives due to the documented benefits on mental restoration (Kanelli et al., 2024; Velázquez et al., 2022) and emotional wellbeing (Liu et al., 2021a; Wei et al., 2021a). However, the key to hinder the popularization of urgent findings in theory results from lack of solid cases of planning and design with scientific evidence for building landscape GBS that can function to restoration.
Human beings have long been known to experience enhanced health and wellbeing through interactions with nature in urban settings (Holy-Hasted and Burchell, 2022; Lauwers et al., 2021; Vöelker and Kistemann, 2015). This improvement is supported by two well-established theoretical models: the Attention Recovery Theory (ART) (Kaplan and Kaplan, 1989) and the Stress Reduction Theory (SRT) (Ulrich et al., 1991). These models have been integrated into urban planning and design as nature-based solutions (NBSs) to enhance the mental health of residents (Andreucci et al., 2019; Du et al., 2019; Tache et al., 2023). Research, including studies on the interfaces between sidewalks and neighborhood green spaces, has confirmed these theories. Findings suggest that spending time in natural settings can offer greater health benefits than similar durations in built environments (Lee et al., 2009; Szabo et al., 2023; Wu et al., 2021). These advantages arise from reduced mental stress (Dawson et al., 2023; Wei et al., 2021a) and enhanced physical health (Wen et al., 2023; Wu et al., 2021). Further insights have been gained from studies on underlying mechanisms, revealing that factors like air humidity, sunlight spectrum, noise levels, wind speed, and air quality contribute to these health benefits (An et al., 2019; He et al., 2023a; Sou et al., 2021; Wei et al., 2020a)near natural environments. However, these findings are seldom applied to the actual design of built environments that incorporate natural features to optimize health benefits.
The connection to nature is crucial in the built environment, offering significant benefits to humans (Velázquez et al., 2022). Current literature identifies three main reasons for this effect. First, exposure to nature in Green Building Solutions (GBS) triggers positive emotions, reducing anxiety (Hong et al., 2019; Wei et al., 2021a). Second, high biodiversity in GBS is a key factor in health benefits (Cameron et al., 2020; Wei et al., 2022b) and has been linked to life satisfaction across Europe (Methorst et al., 2021). However, it is difficult to pinpoint which specific species contribute most to these perceptions. Third, micro-environmental factors such as sound and sight also play a role in eliciting positive emotions (Fang et al., 2024; Xiang et al., 2022). Micro-climatic conditions under canopies, such as shading and transpiration, enhance thermal comfort by altering wind velocity, humidity, sunlight penetration, and background noise (An et al., 2019; He et al., 2023a; Li et al., 2022a; Wei et al., 2020a). Recent studies have shown that the improvement in air quality provided by GBS may offer the most noticeable benefits (He et al., 2023b; Mao et al., 2022; Zhang et al., 2023). These studies typically focus on location-specific variables and realistic landscape settings. Geographical location remains a fundamental principle in building design (Mora-Pérez et al., 2015; Stamps and Naser, 1997), providing a foundation for balancing functionality and aesthetics.
Urban green blue spaces (GBS) can be analyzed by projecting planes for landscape metrics and area components across different studies (Liu et al., 2021b; Wang R. Y. et al., 2023; Zhang et al., 2021). In landscapes integrated with buildings, larger GBS areas can enhance visitors’ interactions with nature and promote emotional wellbeing (Wei et al., 2022a; Zhang et al., 2021). This observation is also supported by studies of neighboring GBS in residential communities (Chen and Guo, 2022). The frequency of interactions with nature in GBS is linked to a stronger connection to nature in urban areas (Huang et al., 2022; Talal and Gruntman, 2023). Designing built environments that incorporate nature, accessible to neighborhood buildings, is crucial (Talal and Gruntman, 2023). The visibility of greenery, which a visitor can see, determines the nature available in the green space. This visibility is measured using the Green View Index (GVI), which calculates the ratio of greenery pixels to those of the overall streetscape (Helbich et al., 2019; Huang et al., 2022). Enhancements in GBS area and GVI are associated with positive visitor experiences (Hao et al., 2024; Huang et al., 2022). These findings provide a theoretical basis for designing landscapes with GBS that function as nature-based solutions (NBS). However, further studies using model verification are needed to link GBS with emotional impacts in specific locations.
Multivariate linear regression (MLR) models are widely used in current research to explore the relationship between humans and nature. However, their use is limited within the framework of the general linear model (GLM). Machine learning has proven to be an effective tool for modeling these relationships (Hao et al., 2024; Huang et al., 2022). Training datasets for modeling evaluations based on metrics and quality in the GBS landscape has not been significantly challenged (Hoang and Tran, 2021; Rustamov et al., 2023). However, modeling human emotions still presents significant challenges, particularly in gaining access to reliable data. Extracting readable information from a facial photo requires training the model with a large testing and validation dataset to minimize the considerable uncertainties in interpreting human emotions (Guan et al., 2021; Wei et al., 2020b). In contrast, the detection of emotion-landscape relationships using machine-learning models and finding adequate references for model selection have started later and are notably lacking (Chen et al., 2022). Comparing MLR with machine-learning models is beneficial for designing landscapes with functional elements, as it allows for the use of a precise range of inputs. Therefore, it is valuable to screen various models and compare regressions to achieve optimal predictions using MLR.
The Random Forest (RF) model, widely recognized for its application in analyzing remote sensing data for landscape metrics (Lehmler et al., 2023), utilizes a combined learning approach for both classification and regression tasks. It operates by employing bagging techniques to generate multiple classifiers across different subsets, using a decision tree to integrate individual predictions into a comprehensive result (Li and Guo, 2023). Although RF can manage errors through out-of-bag (OOB) error assessments, this can sometimes lead to redundant processes and potentially unclear outcomes. In contrast, the AdaBoost algorithm enhances data processing and decision-making by sequentially adding weak learners robust model is developed until a (Zhang and Yang, 2015). Despite its high predictive accuracy, AdaBoost may be overly sensitive to noisy data and outliers, potentially causing deviations beyond typical logistic responses. Similarly, Gradient Boosting Trees (GBT) utilize a methodology akin to AdaBoost but optimize objectives along a gradient of decreasing residual error (Bagga et al., 2023). Theoretically, GBT can achieve highly accurate regression models, although this requires careful adjustment of variables to prevent overfitting. Overall, while RF is often the preferred method for handling large, multidimensional datasets, it performs less effectively with unstructured data, such as emotional scores. GBT, on the other hand, is favored for its precision but requires substantial manual tuning to reach optimal performance.
In this study, we proposed a design for integrating landscapes with nature in urban settings, using Changsha as a case study. The focus was on urban parks, where the connection to nature was evaluated through interviews with random pedestrians. We employed location-based GBS metrics and performed regression analysis on emotional responses using two different methods, which were then compared to identify the most effective approach. The goal was to demonstrate how a design incorporating natural elements in urban landscapes can positively influence human emotions. We hypothesized that factors such as larger park areas or higher Green View Index (GVI) would enhance emotional wellbeing by fostering a sense of connection to nature.
2 Methodology
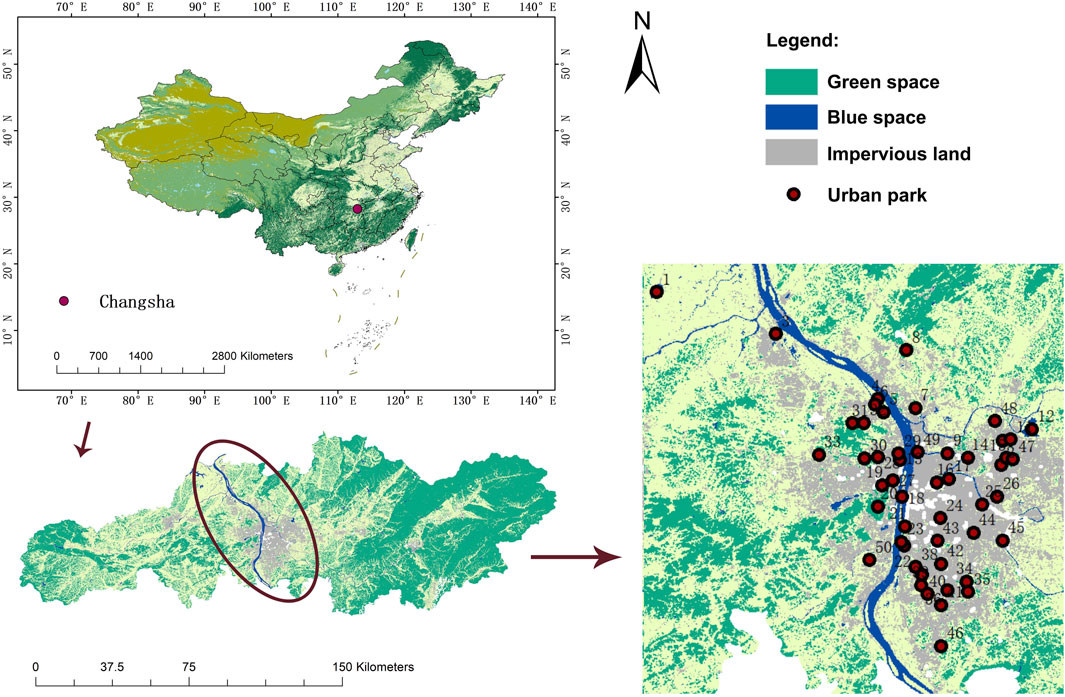
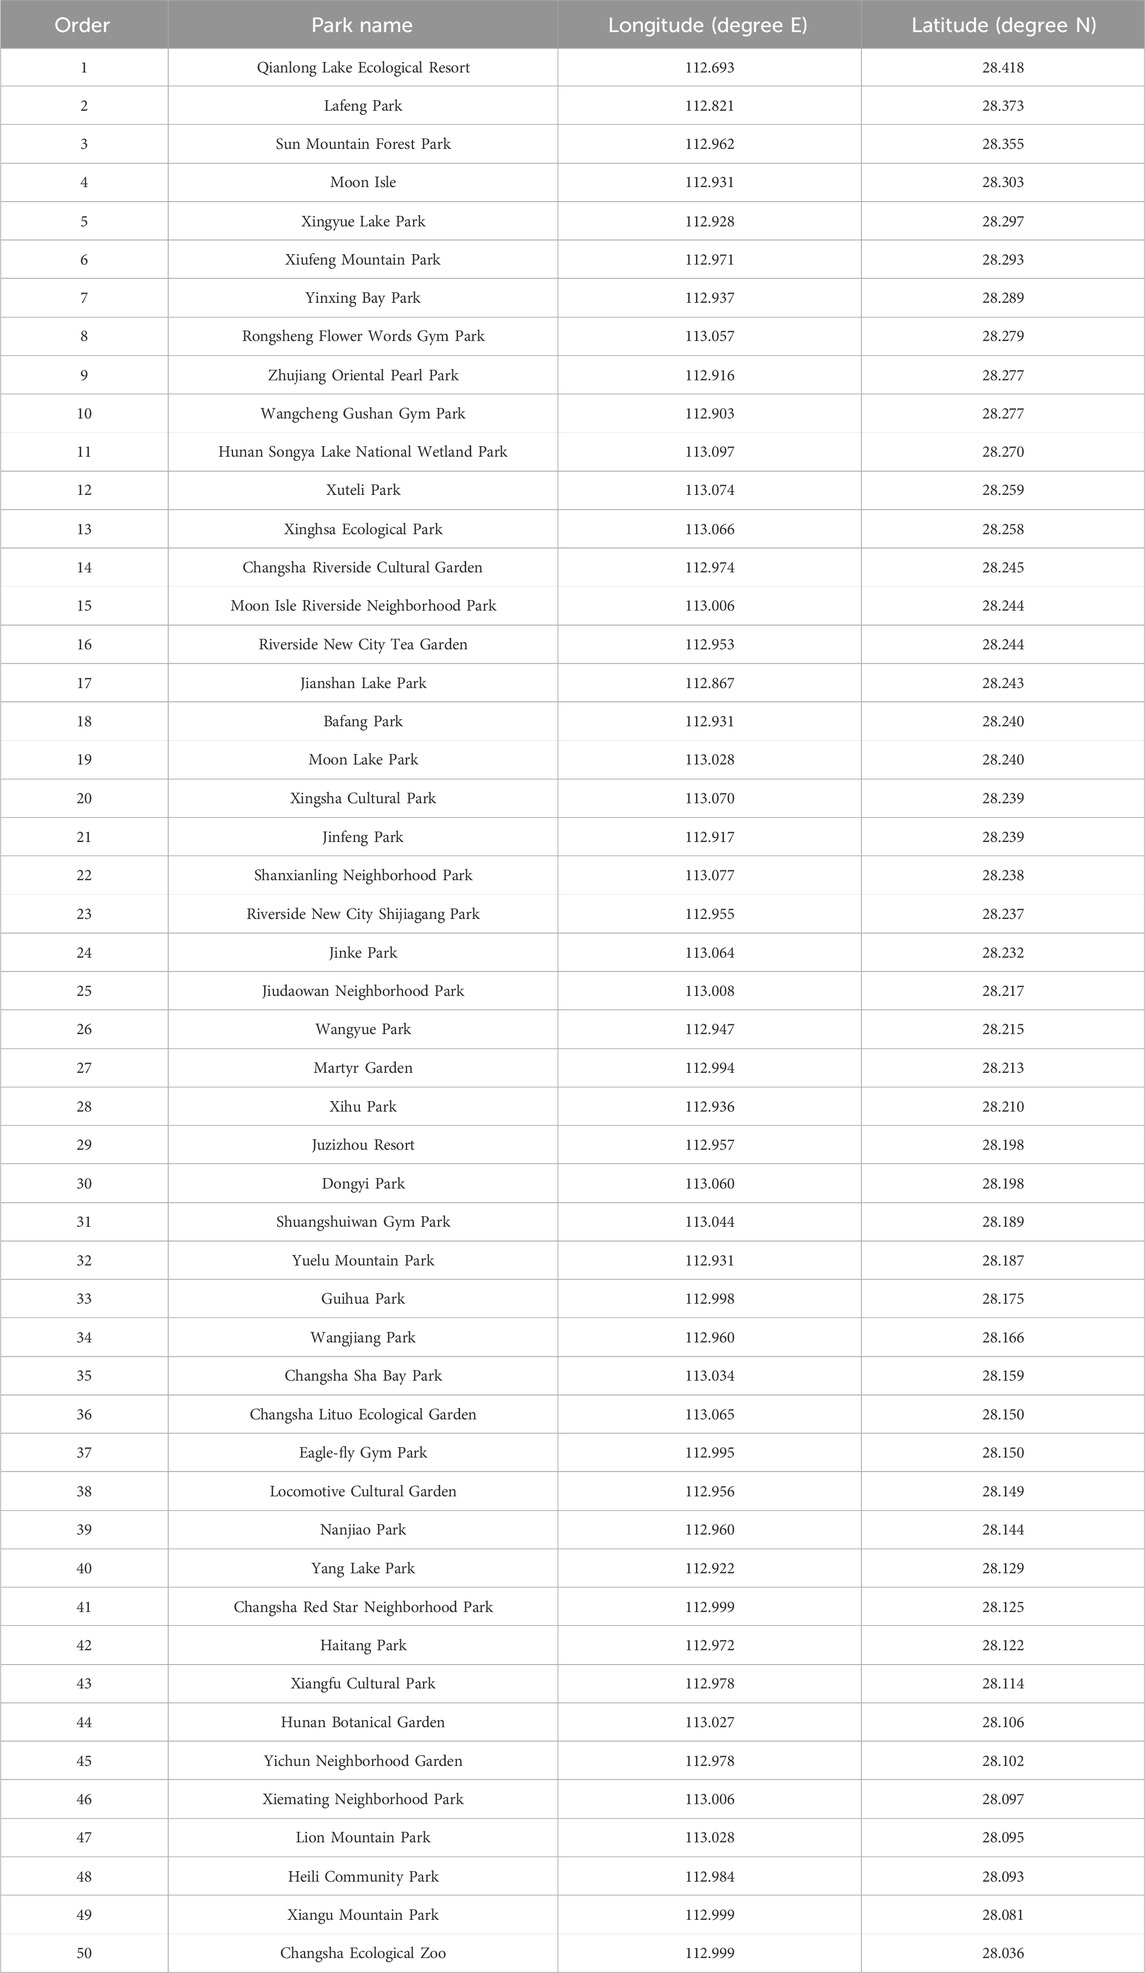
Changsha was selected as the study location, where 50 urban parks were examined (Figure 1). The city experiences a continental monsoon climate with annual temperatures ranging from 4.4°C to 34.2°C and average yearly precipitation of 1,361.6 mm. The local population is approximately 10.51 million, with 83.59% residing in urban areas. An application programming interface (API) was used to gather data on park locations from Baidu’s online maps. Of the 211 parks listed in the latest database update in 2023, 50 were randomly selected from the central urban areas (Figure 1). These parks were numbered and their distribution is depicted in Table 1.
2.1 Evaluation on landscape metrics
Spatial data for each park was derived from Landsat 8 OLI imagery at a 30 m resolution. Using ArcGIS version 10.2 software (Esri China branch, Shanghai, China), each park’s boundary was defined to calculate its projected area. The Green Space Area (GreenA) was estimated based on the extent of the normalized difference vegetation index (NDVI) across the park’s grid according to Equation 1.
where, NIR and BandRed are bands 5 and 4 in near infrared light and red light reflections, respectively. Waterbody area was estimated by the largeness of normalized difference water index (NDWI) (Sekertekin et al., 2018) according to Equation 2:
where, BandGreen and SWI1 are bands 3 and 6 in green and short-wave infrared 1 reflections, respectively. Impervious surface included lands covered by roads, lanes, and paved playgrounds, which can be estimated for its areas (ImpA) as nonnormalized difference impervious surface index (NDISI) (Xu, 2010) according to Equation 3:
where, MIR1 is band 1 in mid-infrared light reflection; TIR is a thermal infrared band 10. Additional landscape metrics are calculated in Equations 4 and 5 (Chen and Guo, 2022; Zhang et al., 2023):
where, BlueR is the areal ratio of blue space to host park (ParkA); BtoG is the areal ratio of blue space to green space in a common park.
2.2 Grid disassembly and green view index
The study area in Changsha was divided into 1,000 grids, each covering an area of 2.25 km2 (1.5 km × 1.5 km) as shown in Figure 2. Parks were mapped onto the grids with the fewest grids needed to completely encompass their boundaries. Selected parks were used for data analysis and regression, while others were reserved for prediction purposes. Streetscape images were collected using the Baidu online map API with Python version 3.6 (Python Foundation, Python Inc., Beaverton, Oregon, United States). The study targeted elements of vegetation such as leaves, needles, twigs, branches, and new shoots for image recognition using deep learning. Initially, these elements were identified using semantic tags from the Cityscapes Dataset (Cityscapes Dataset, 2023). The DeepLabV3+ model was then employed to refine the tagging of vegetation elements in the streetscape images by analyzing and categorizing pixels using the ResNet-101 network. Approximately 80% of the images were used for training to improve the recognition of vegetation pixels, and the remaining 20% were used for validation against the initial dataset (El-Hokayem et al., 2023). The accuracy of recognition was confirmed to be over 87%, considered satisfactory for Greenery Visibility Index (GVI) studies (Chen et al., 2020; Long and Liu, 2017). Examples of GVI value recognitions are depicted in Figure 3.

Figure 2. Schematic diagram of study area in Changsha disassembled in grids (each in 1.5 km diameter).
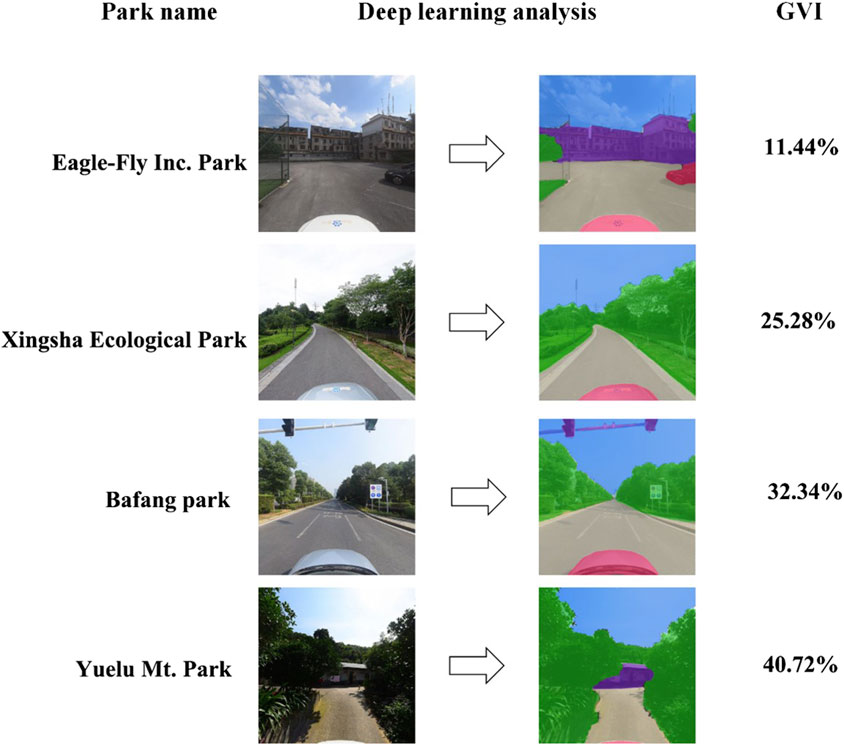
Figure 3. Typical recognition results of green view index (GVI) in urban parks of Changsha. Park names are derived from Table 1 and locations are referred to as plots in Figure 1.
2.3 Emotional perceptions of human-nature connectedness
Emotional perceptions of nature connectedness were assessed through self-reported scores from randomly selected pedestrians. Visitors were randomly chosen from a park where they were firstly photographed to record their faces and asked for whether they can consent the permission to attend our study as participants. If the consent was provided, the facial photo was reserved and the subject was further asked about self-reported scores towards perceived connectedness with nature; but if they rejected the attendance, photos were deleted immediately. The questionnaire, adapted from (Otamendi-Urroz et al., 2023) and reused in a study (Garau et al., 2024), included both consented participation and real-time interviews. Participants responded to 18 emotional descriptors, categorized into positive sentiments like alertness, awe, amusement, joy, contentment, hopefulness, gratitude, love, and pride, and negative emotions such as disgust, anger, embarrassment, sadness, shame, fear, contempt, and anxiety. Responses were recorded in a binary format, with 0 and 1 representing ‘no’ and ‘yes’, respectively. Using these responses, emotional perceptions of connectedness with nature in urban parks were quantified using an emotional nonparametric relation index (ENRI) as shown in Equation 6 (Garau et al., 2024).
where, ScoreP and ScoreN are totaling scores about binary perceived responses to positive and negative emotions, respectively, reported by the ith pedestrian up to the final jth per park. Some pedestrians consented the participation, but his/her responses included zero scores to any of emotions. This cannot be documented for recorded scores in next-step analysis.
Data of self-reported scores may contain bias caused by subjective interruption or uncontrolled systematic errors (Guan et al., 2021; Wei et al., 2021b). Therefore, data were validated by calculating the matching accuracy and detecting correlation with data collected from a retest (Mo et al., 2023). The Cronbach alpha was calculated to be 0.803, which fell in the level that can be fully reliable for the acceptance of data in a low variance (Mo et al., 2023; Paiva et al., 2014). Furthermore, self-reported data were validated with data from facial expression scores and Pearson correlation was calculated to be 66.37%. This also fell in the range that can be reliable that self-reported data can be reliable according to empirical values (Liu et al., 2024; Paiva et al., 2014). Overall, our results can be fully reliable for their contribution to the estimate on nature connectedness.
2.4 Data process and case design
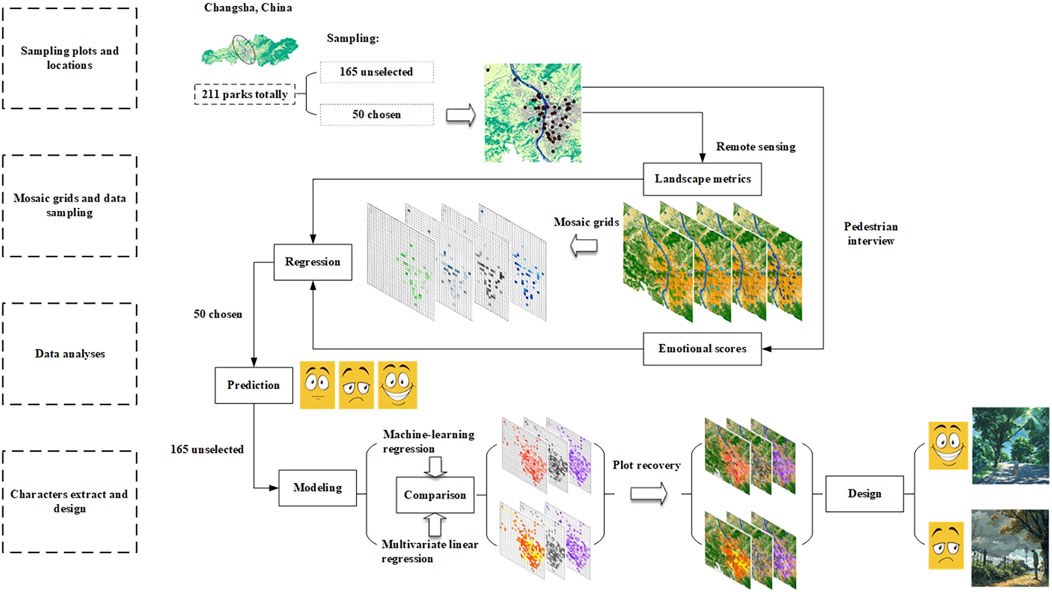
The layout of the entire study along with data statistics and processing are illustrated in Figure 4. Emotional results were averaged to derive mean scores for each selected park, alongside landscape metrics, which were mapped within the study area. Data extracted from selected parks were organized into mosaic grids, used for predicting emotional perceptions in other unselected park grids. All data underwent normality tests with consistent variances, allowing emotional scores to be analyzed for influencing factors from landscape metrics using multivariate linear regression (MLR). This analysis facilitated comparisons with prior studies on human emotional responses to Green and blue spaces (GBS) in urban parks (He et al., 2023b; Wei et al., 2022a). Independent variables showing significant impacts on emotional scores were noted as references. Using data from various urban parks, landscape metrics were employed to enhance machine-learning models—specifically Random Forest (RF), AdaBoost, and gradient boosting trees (GBT)—for predicting emotional scores. Modeling accuracy was assessed using root mean squared error (RMSE), mean square error (MSE), mean absolute error (MAE), and determination coefficient (R2). The importance of each landscape metric was evaluated across the three machine-learning models. Principal component analysis (PCA) was used to identify variation attributes of emotion and landscape data, aiding in comparing results between machine-learning models and MLR. The chosen model predicted emotional scores based on landscape metrics in grids of unselected parks. Green Vegetation Index (GVI) values were collected and averaged across all grids. These values were then mapped back onto land uses to display typical distributions of predicted emotional scores. Based on the number of selected parks (Table 1), typical parks with key landscape metrics that positively affect emotions were identified. These metrics were extracted and combined with regression results for use in designing with OpenArt (OpenArt, 2024).
3 Results
3.1 Spatial distributions of variables
Spatial distributions of landscape metrics for urban parks are depicted in Supplementary Figure S1, and mosaic grids in Figure 5. Parks in remote southern areas of Changsha, particularly GreenA, tend to be larger (Figure 5A). Conversely, BlueA does not follow this pattern and varies in size along the latitudinal gradient (Figure 5B). The Green Vegetation Index (GVI) is more uniformly distributed than GreenA and BlueA, with lower values in areas having higher proportions of impervious surfaces (Figures 5C, D).
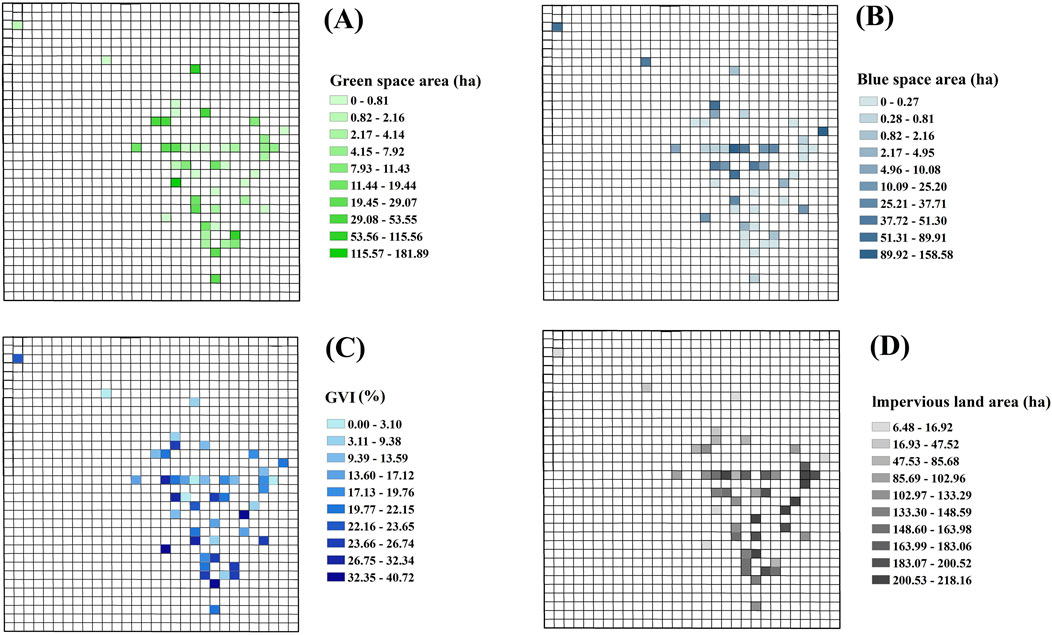
Figure 5. Spatial distributions of mosaic grids for green space area (A), blue space area (B), GVI (C), and impervious land area (D) in chosen parks of study area of Changsha.
The positive emotion score ranges from 1.33 to 6.60, averaging 4.95 ± 1.17 (± standard deviation), with higher scores in regions with larger green buffering spaces (GBS) (Figure 6A). The negative emotion score, with a lower average of 1.90 ± 0.62 (range: 1.00–3.33), is distributed more evenly (Figure 6B). The Emotional Normalized Ratio Index (ENRI) varies from −0.42 to 0.77 (mean: 0.43 ± 0.25), indicating a balance between positive and negative emotional perceptions, with higher positive scores associated with GBS and negative scores linked to impervious surfaces (Figure 6C).
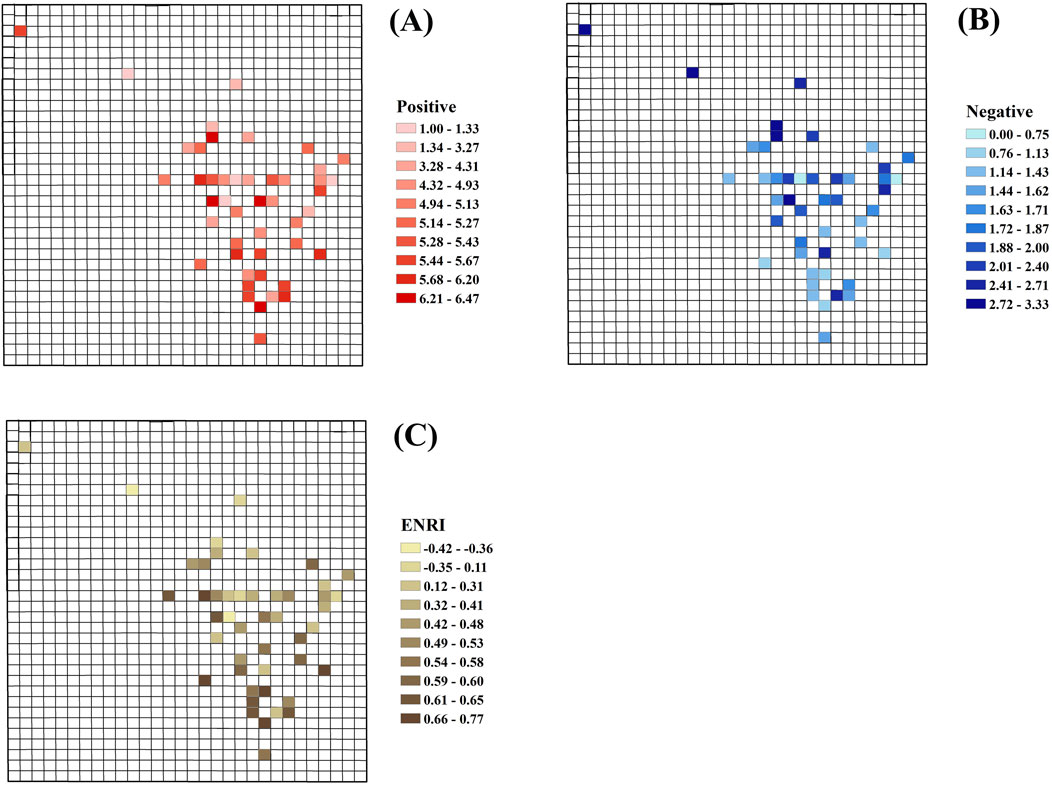
Figure 6. Spatial distributions of mosaic grids for positive (A) and negative (B) emotion scores and ENRI (C) in chosen parks of study area of Changsha.
3.2 Multivariate linear regression estimate
The areal ratio of blue to green spaces (BtoG) and GVI both significantly contribute to the positive emotion score, although GreenA slightly reduces it (F value = 52.37; P-value <0.0001; Figure 7A). Conversely, GVI and BlueR together have a substantial negative impact on the negative emotion score (F value = 14.28; P-value <0.0001; Figure 7B). Both variables positively affect ENRI (F value = 47.19; P-value <0.0001; Figure 7C).
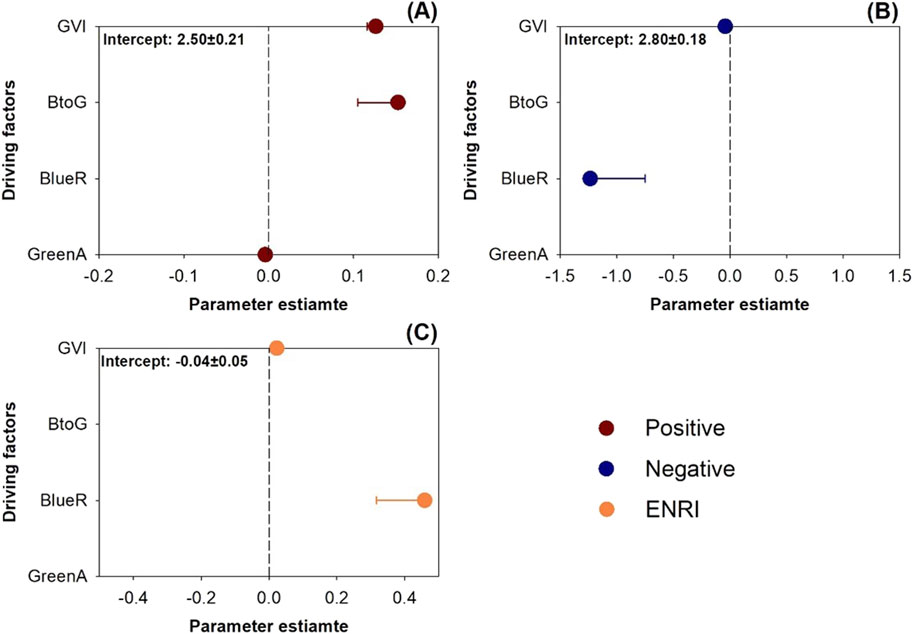
Figure 7. Multivariate linear regression of positive (A) and negative emotion scores (B) and NERI (C) against landscape metrics of green space area (GreenA), blue space areal ratio to host park area (BlueR), areal ratio of blue to green spaces (BTOG), and GVI. Error bars present standard errors towards the zero line.
3.3 Machine-learning modeling estimate
The performance of three machine-learning algorithms is presented in Table 2. The Gradient Boosting Tree (GBT) algorithm demonstrated superior performance compared to the others. Specifically, GBT achieved a higher coefficient of determination (R2) in regression analysis. However, it registered higher values of root mean squared error (RMSE), mean square error (MSE), and mean absolute error (MAE) when predicting negative emotion scores than the Random Forest (RF) algorithm. Despite this, the regression errors for GBT were generally better controlled compared to those for AdaBoost. Consequently, GBT was selected for further analysis in regression modeling.
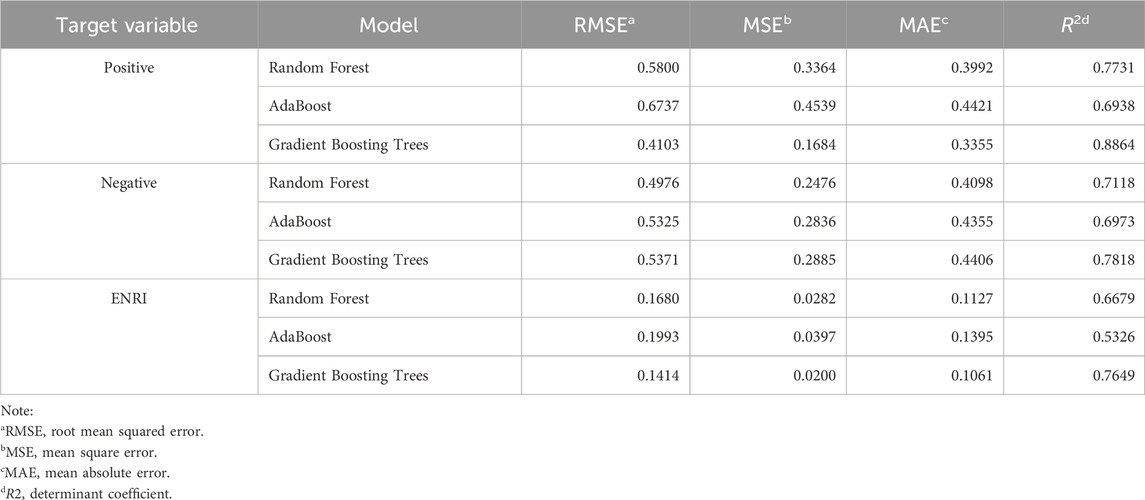
Table 2. Comparisons of regression performances using three machine-learning modelling algorithms for positive and negative emotional indexes and ENRI.
Regression analysis using GBT highlighted the significance of various landscape metrics on emotional scores. Metrics such as the area of green and blue spaces (GandB), park area (ParkA), the ratio of green space to impervious surfaces (GtoI), the ratio of impervious surface area to host park (ImpR), GreenA, and the Green Vegetation Index (GVI) were identified as significantly influential (Figure 8). Positive emotion scores correlated strongly with GVI in specific park grids (Figure 8A). Negative emotion scores were influenced by contributions from GandB, ParkA, GreenA (feature importance: all >0.2), and GVI (feature importance: 0.18) (Figure 8B). The Environmental Naturalness Related Index (ENRI) was primarily influenced by GreenA and GVI, both showing feature importances of ≥0.2 (Figure 8C).

Figure 8. Magnitudes of feature importance of landscape metrics for positive (A) and negative emotion scores (B) and ENRI (C) predicted by the machine-learning model using gradient boosting trees (GBT) algorithm. Only features with importance values >1.0 are listed as independent variables: GandB, green and blue space area of a park; GtoI, ratio of green space area to impervious surface land area; ImpR, ratio of impervious surface area to host park area.
3.4 Principal component analysis verification
The first two principal component analyses (PCAs) accounted for 56.17% of the cumulative eigenvalues, with the first PCA comprising 32.25% and the second 23.92% (Figure 9). Consequently, these two PCs represented over 50% of the data variation, with the first PCA proving more reliable for capturing data variation. The eigenvalues for the positive emotion score and ENRI followed a similar vector trend as the negative emotion score. The landscape metric of ImpR displayed a trend similar to that of the negative emotion score, both diverging from those along the first PC axis for ParkA, GandB, GreenA, GtoI, and GVI. These metrics were identified by the GBT algorithm in the machine-learning model (Figure 8), but were not detected by MLR (Figure 7). Parameters detected by MLR included BtoG and BlueR, which aligned with eigenvalues along the second PC axis, yet exhibited weaker trends against GVI and GreenA. Therefore, MLR only identified two parameters (GreenA and GVI) that aligned with trends in positive emotion score and ENRI; it also identified two other parameters unrelated to emotion scores. Overall, machine learning regression using the GBT algorithm outperformed MLR in modeling emotions related to landscape metrics.
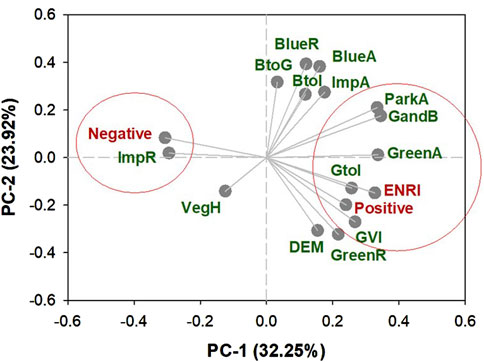
Figure 9. Nomograph of eigenvalues for the first and second principal components (PC-1 and PC-2, respectively). Red font letters mark emotion parameters and landscape metrics are marked in dark green font. Abbreviations: VegH, vegetative height in green space of a park; BtoI, ratio of blue space area to impervious land area of a park; DEM, digital elevation map value.
3.5 Location-based emotion distribution overlapping land uses
According to gradient boosted trees (GBT) modeling, it is possible to predict emotional scores for the remaining 165 unselected parks. The spatial distribution of these scores across all 165 parks is illustrated in Supplementary Figure S4. Additionally, grid distributions were superimposed on land uses, and the overlapping results are presented in Figure 10. When compared with multiple linear regression (MLR) results, the GBT model shows that high positive emotion scores are predominantly found in the southern built-up areas of Changsha, with occasional high scores in the northern parts as well (Figures 10A, B). Conversely, higher negative emotion scores are predicted by GBT in the eastern part of the study area, where MLR shows significantly fewer high values (Figures 10C, D). GBT also suggests that high Environmental Naturalness and Recreation Index (ENRI) levels mostly occur near rivers, aligning with MLR findings (Figures 10E, F).
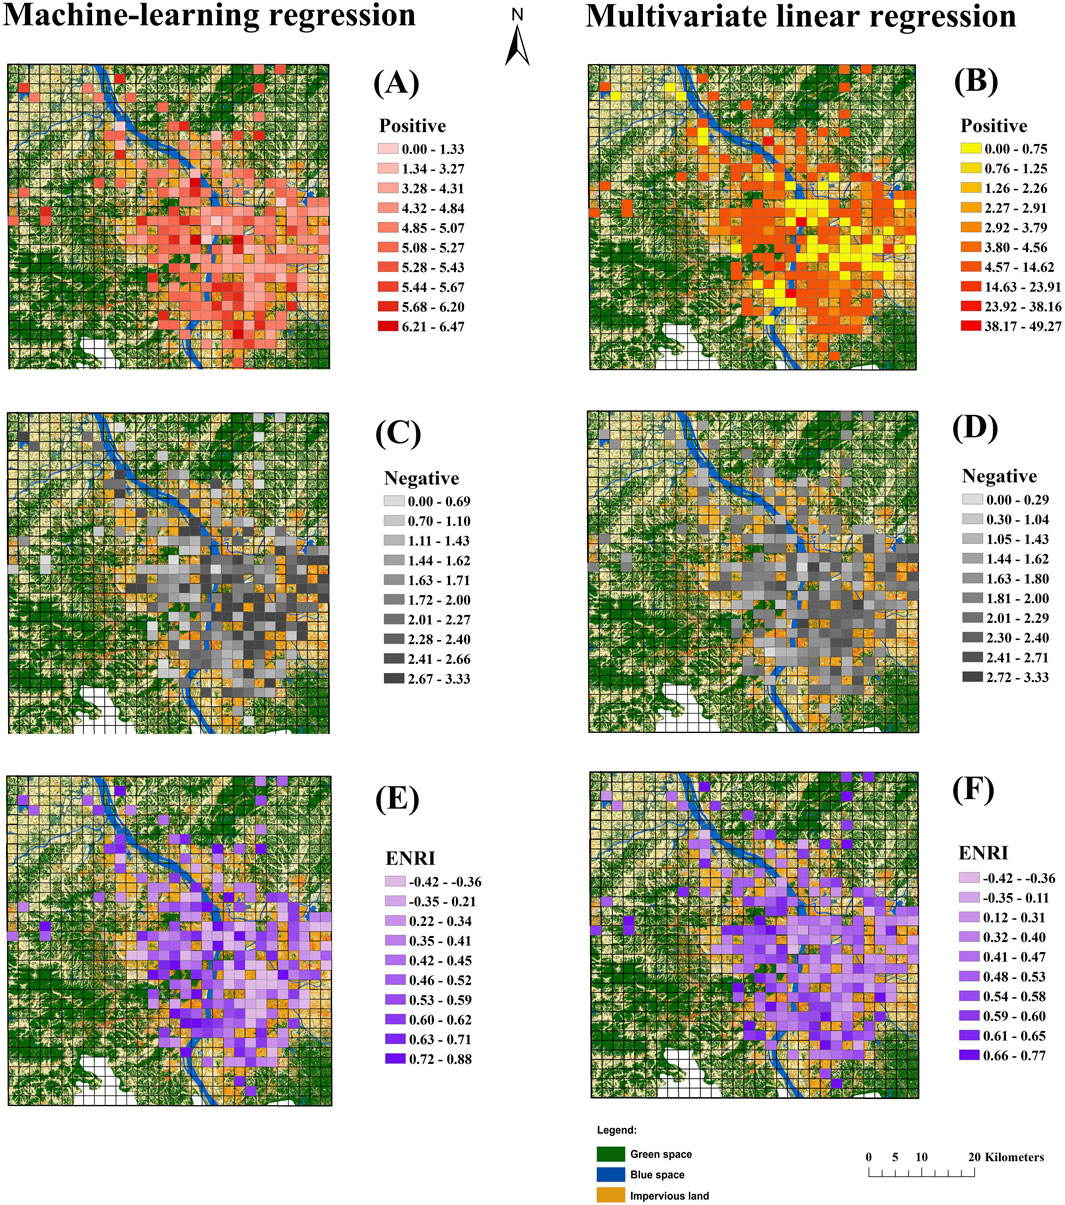
Figure 10. Spatial distributions of positive (A, B), negative (C, D), and ENRI (E, F) in grids of all parks over land uses in Changsha regressed by machine-learning GBT model (A, C, E) and multivariate linear regression (B, D, F).
3.6 Typical landscape description and case design
GBT regression results identify positive emotions predominantly in grids at the Changsha Ecological Zoo (Figure 1; Number 50; Table 1). A typical view here includes a streetscape enriched with a high green vegetation index (GVI) due to tree canopies over pedestrians (Figure 11A), which serves as a basis for design prompts.
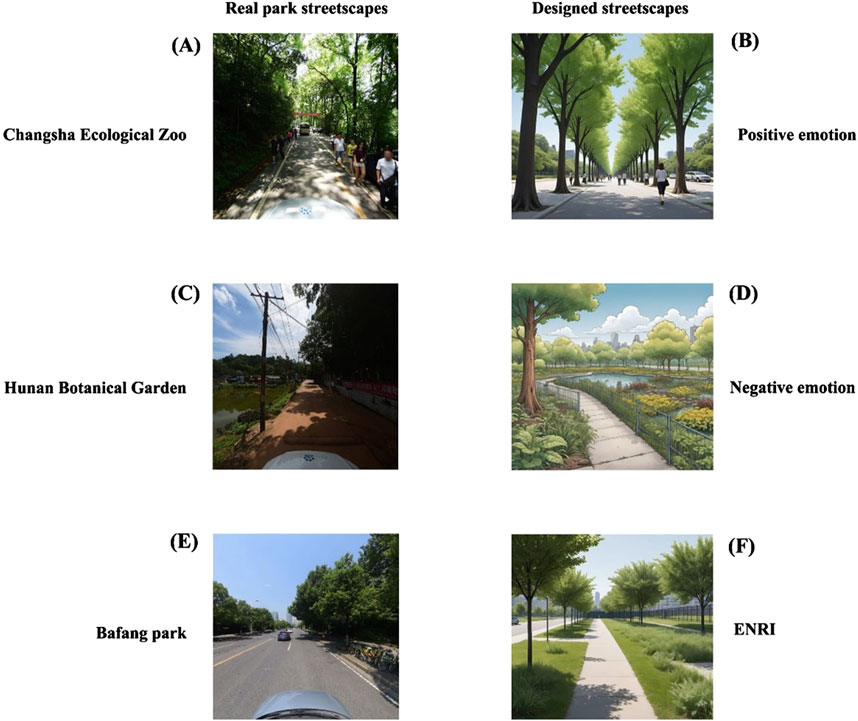
Figure 11. Typical streetscapes in chosen parks (A, C, E) with nature connectedness for positive (A, B) and negative emotions (C, D) and ENRI (E, F) which are referred to for designing using OpenArt (B, D, F).
“Drawn in an overall comic style about a line of street trees being planted along the sidewalk outside an urban forest park. The sky is blue and road is light grey. It is a morning time when sunlight is transmitted through dark-green tree canopies to the understory space that is covered by alternatively sunlight and shade spots mosaiced together. Tree canopies are connected together to be a long crown, which looks large at the nearest side, shrinks to be smaller along black-color iron fences of the park until invisible to the end of a street. Canopies are in light-green color at the nearby side, and turns to be darker and blacker at places in longer distance, until to be totally dark at the furthest. Tree canopies account for over 60% area of a streetscape. Most visual streetscape is occupied by connected tree canopies, that result from canopies from trees in species of lacquer, camphor, ulmus, Vervain, Elaeocarpus decipiens, pine, oak, and Symplocaceae. Tree canopies are placed at the top layer which cover back layers of metasequoia plants inside the park. The sidewalk is paved along the neighborhood of a botanic park, where no buildings can be seen.” The design result is shown in Figure 11B.
The Hunan Botanical Garden is identified by GBT as typically evoking negative emotions (Figure 1; Number 44; Table 1). This response is primarily due to extensive areas of dwarf plants on lawns, grasslands, and near water bodies, which result in a low GVI with visible buildings (Figure 11C).
“Drawn in an overall comic style about shrubs and weeds visible behind iron fences of a large urban park, large areas of lawns and wetland can be seen clearly inside the park, where no tree can be seen. Plants are mainly in species of ferns, flowers, and saplings. Although landscape inside the park looks enriched with greeneries and waterbody, most plants are dwarf both on land or in wetland and rare of plants on ground account for occupation of visual view which is full of blue sky and white clouds.”
The design can be seen in Figure 11D.
ENRI reflects a complex blend of positive and negative emotions, typically experienced in Bafang Park (Figure 1; Number 18; Table 1). This park is characterized by large open green spaces with moderate to high GVI levels, and buildings visible in the distance (Figure 11E). This setting can be used to prompt further analysis.
“Drawn in an overall comic style. Large areas of forested lands are distributed in a wide range across areas across black-color iron fences of an urban park. Trees are mostly planted in lines both inside the park and along a sidewalk outside park’s iron fences. Most lands outside the park fences are covered by lawns, meadows, and grasslands. Trees have large canopies in fresh green color in nearby position with shadows at further places. Large canopies are connected together to account for about 50% of visual view in a streetscape along park’s fences. A waterbody can be seen behind greeneries. The waterbody is a wetland with scattered green plants over and blue water surface behind shrub plants. The floor is mainly covered by grassland and lawns and nearly no impervious path or road can be seen.”
The design can be seen in Figure 11F.
4 Discussion
4.1 Connectedness of perceived emotions
The concept of natural connectedness is significant for the level of nature perceived and the corresponding emotional responses in humans (Otamendi-Urroz et al., 2023). This is evident in how humans emotionally react to landscapes with measurable amounts of nature (Garau et al., 2024). In our study, we measured perceived emotions using the emotion-nature ratio index (ENRI), calculated as the logarithm of the ratio of positive to negative emotion scores. Over 90% of ENRI values were positive, reflecting a higher report of positive emotions compared to negative ones. This finding aligns with observations in naturally preserved parks in southeastern Spain (Garau et al., 2024) and in coastal protected areas of the same region (Otamendi-Urroz et al., 2023). Thus, human physiological parameters were more suitable to be used for evaluating restorative effects than psychological factors (An et al., 2019; Wen et al., 2023; Yu et al., 2018). Our self-reported data were detected to have an acceptable correlation with facial expression scores, and the latter was attracting an accumulating number of followers who together gave a higher reliability than the earlier one (Wang X. P. et al., 2023; Xin et al., 2024). Other research utilizing facial expression scores also found predominantly positive emotional responses at city (Wei et al., 2021a), regional (Zhang et al., 2021), and national levels (He et al., 2023b). These results support theories such as stress recovery theory (SRT) and attention restoration theory (ART), suggesting that people tend to experience more positive emotions when they feel a connection to nature. Contrarily, artificially built environments, like those with extensive greenery in greenhouses, were linked to more negative emotional responses (Garau et al., 2024; Otamendi-Urroz et al., 2023). In our research, ENRI was particularly significant in park landscapes with large green spaces and high green view index (GVI). Crossover studies in heavily built environments have supported these findings (Wei et al., 2021b; Yu et al., 2018), suggesting the benefits of designing landscapes within buildings that promote a strong connection to nature, as assessed using ENRI.
4.2 Landscape metrics that contribute to emotional perceptions
The MLR results showed that BlueR significantly contributed to ENRI by reducing negative emotion scores. Additionally, increasing BtoG’s contribution could enhance positive emotions. Surprisingly, GreenA had a minimal and negative impact on positive emotion scores and showed no significant contributions to ENRI. PCA verification suggested these findings were largely unreliable due to their irrelevance to emotional scores. These metrics had strong individual correlations with emotional scores, but their interactions were nullified when contradicted by collinearity issues. Machine learning regression models, which do not rely on linear relationships, do not face these collinearity problems. It is realistic to face challenges to increase the ratio of BlueR in urban landscape which may need depressing ratio of GreenR. Stand area and municipal input will be two solid obstacles to achieve these benefits.
Generally, GBS represent a significant portion of accessible nature in urban parks. Research suggests that the combination of GBS plays a more crucial role in enhancing positive emotions than either green or blue spaces alone (Wang R. Y. et al., 2023). Studies also indicate that urban blue spaces are as beneficial as green spaces for mental wellbeing (Helbich et al., 2019; Vöelker and Kistemann, 2015). Specifically, green spaces are more beneficial for positive emotion in downtown areas with scattered, small patches, while blue spaces enhance positive emotions in remote, rural areas with large, continuous bodies of water (Wei et al., 2022a). In Changsha, the Xiang River flows through the city in a latitudinal direction, branching into several waterways in built-up downtown areas (Figures 1, 2). Here, large green spaces are fragmented into smaller, scattered patches. Parks near these blue spaces attracted volunteers who reported both positive and negative emotions, with a predominance of positive ones. According to GBT machine learning results, blue spaces had little direct impact on emotions but helped to integrate a network of green spaces and impervious surfaces. Buildings in these landscapes, characterized by extensive green spaces but sparse vegetation, primarily influenced feelings of sadness and reduced positive emotions.
In landscape metrics, the GVI significantly contributes to the perception of positive emotions, demonstrating that the amount of visible greenery in a streetscape is crucial for feeling connected with nature. This aligns with the findings of Huang et al. (Huang et al., 2022), who suggested that the ability to physically interact with greenery is more significant for fostering positive sentiments than merely having access to large green areas. Additionally, parks located in regions with extensive impervious surfaces, such as densely packed roads, typically display high Emotional Nature Relatedness Index (ENRI) values. This suggests that GVI, when accessible, can enhance positive emotions.
The methodology of multiple linear regression (MLR) significantly differs from that of logistic regression in machine learning modeling. The gradient boosting trees (GBT) algorithm highlighted the beneficial effects of green spaces on emotional wellbeing, findings that were supported by principal component analysis (PCA). Similarly, Huang et al. (Huang et al., 2022) found that both the size and GVI of green spaces are crucial for the positive emotional responses of visitors to urban parks in Nanchang. Sun et al. (2023) also observed that employees exhibit more positive emotions in workplaces (Sun et al., 2023). Ma et al. (2024) with large green spaces and high GVI. Moreover, noted that high-GVI environments can enhance thermal comfort by moderating increases in systolic blood pressure and heart rate, changes that are associated with positive emotional responses to green spaces, as confirmed by (Wen et al., 2023; Yu et al., 2018). Overall, contact with green spaces, whether vertically or horizontally oriented, is important for feeling connected to nature (Velázquez et al., 2019). GBT-based machine learning models can more accurately represent these effects compared to MLR.
4.3 Discrete results between MLR and machine-learning modeling
Two regression systems demonstrated both divergence and similarity in their findings. The most notable divergence was observed with GreenA, which the multiple linear regression (MLR) suggested negatively influenced the perception of positive emotions. However, the Gradient Boosting Tree (GBT) algorithm identified GreenA as having high feature importance for positive emotions. This discrepancy arose from the technical limitations under general linear model (GLM) rules, where GreenA was impacted by its collinearity with the coefficient BtoG. BtoG strongly influenced the positive emotion scores, stemming from its impact on negative emotion scores. Collinearity typically results in high mean squared error (MSE) in regressions (Marill, 2004), and GLM lacks mechanisms to eliminate such errors. Conversely, machine learning models, including GBT, are less affected by multicollinearity due to their complex architectures, which optimize procedures to control or reduce root mean squared error (RMSE), including strategies to exclude multicollinear data (Chan et al., 2022) inputs. This explains why variables like BtoG were not selected for the GBT model. Another divergence involved GVI, which MLR estimated as a driver of positive emotion scores and negatively impacted scores in the GBT model. Although it is possible for highly greened streets to evoke negative emotions, this is less likely to occur frequently, as MLR suggested. The GBT model indicated that while negative emotions could be perceived on high GVI streets, it happened with lower probability compared to positive emotions, leading GBT to assign high feature importance to GVI. This rationale applies similarly to GreenA’s contrasting results in MLR and GBT, showcasing that machine learning models often deploy more objective strategies to handle errors and assess emotional impacts compared to MLR.
4.4 Theoretical base for cases of design
The case of design in our study was generated on the basis of findings and inner relationships between human emotions and perceptions to the nature in parks. These results can have more practical implications than just being an exhibition of modelling results. At the regional scale, our design disagreed with a rule that was about to be recommended that the higher dose of nature in environment the more positive sentiments can be perceived (Liu et al., 2021b; Zhang et al., 2021). Our results, however, showed that regions with high doses of nature in ambient environments can evoke high scores of ENRI, but this accuracy was lower than results found in regions with larger areas on impervious lands. Hence, in the meaning of urban planning high dose of nature should be considered more in the design of built environment if positive sentiments were achieved for most of visitors. This can be explained by the SRT theory as people living in cities tended to attract more mental stresses; hence they may perceive higher restorativeness when facing the nature compared to those living in remote rural regions. Secondly, studies on horizontal planes of GBS appeared to demonstrate that a large area of nature can precondition the perception of positive emotions (Huang et al., 2022; Liu et al., 2021b; Nasrabadi et al., 2023; Stamps and Naser, 1997). In design, however, the visible parts of green nature can function to elicit positive emotions rather than a large and flat space with low occupation of visible view by greeneries. This is important for landscape architecture to arrange the trade-off of touchable nature in greeneries between horizontal and vertical planes. This can reflect outcomes ruled by the ART theory, which asserted that only the touchable nature can attract and recover attention. Finally, the ratio of visible green in landscape was indicated to be a stronger facet in the design to attract positive emotions rather than other types of nature. This can be referred to by policymakers to consider a higher use of trees with large canopies along streets and large urban wetland parks should not be encouraged actually.
4.5 Limitations of this study
Our study has three limitations. Firstly, Changsha lacks significant elevation variation, which may explain why elevation did not influence human emotions in urban parks. Studies in other cities have suggested that elevation can impact park visitors’ emotions (Li et al., 2022b; Wang and Zhou, 2024; Zhang et al., 2021). Further work is essentially needed to repeat our study in more cities as variances may impact results found in a single city through varied cultural and environmental factors among different cities. Therefore, conducting our study in a different city might reveal elevation effects on emotions. Secondly, the emotion scores were assessed using a methodology previously employed in various studies (Garau et al., 2024; Otamendi-Urroz et al., 2023), that have been validated and passed tests in our study. This methodology was not perfect because our data were collected in a summertime and parks’ tourism may be limited to a special set of emotions at this time of year. More time courses or seasons are suggested to be tested in further works to promote the power of usage. Thirdly, we found that machine-learning algorithms could predict emotion scores with determinant coefficients over 50%, a threshold acceptable for predictive studies. Even so, the employment of deep learning algorithms may face challenges from overfit. Nevertheless, the RMSE and MSE values were often higher than 0.1, suggesting that increasing the data input could help minimize systematic errors. That is why we showed and compared predictive results and mapped results together to show similarities of results indicated by GBT and MLR. Future studies should explore more machine-learning models to optimize these regressions. Additionally, we designed a landscape embedding natural elements using the OpenArt AI tool. This approach was not widely accepted, indicating that it might be more effective to compare AI-designed landscapes with those designed using traditional artistic methods.
5 Conclusion
In pursuit of a sustainable GBS landscape that enhances perceived emotions in urban parks, we moved beyond traditional multiple linear regression (MLR) and applied selected machine-learning algorithms. The machine-learning GBT regression, validated through PCA, proved superior to MLR. It highlighted the significant influence of green space connectivity on positive emotions and the impact of impervious surfaces on negative sentiments. The results demonstrated that landscapes promoting positive emotions typically featured high Green View Index (GVI) along streets bordered by large, open green spaces. As used for cases of planning and designing, built environment in municipal areas on impervious surfaces can be employed for inducing more positive sentiments of visitors due to perceptions of more closeness with nature. Large areas of green and blue spaces may not be so needed for people who were seeking for restorative environments. High dose of blue space in the nature and high occupation of sight view were strongly suggested to inducing stronger positive sentiments.
Data availability statement
The raw data supporting the conclusions of this article will be made available by the authors, without undue reservation.
Ethics statement
The studies involving humans were approved by School of Humanities and Arts, Hunan International Economics University (Reference code: 20240122UFI). The studies were conducted in accordance with the local legislation and institutional requirements. The ethics committee/institutional review board waived the requirement of written informed consent for participation from the participants or the participants’ legal guardians/next of kin because Consented orally by volunteers.
Author contributions
SZ: Conceptualization, Data curation, Formal Analysis, Funding acquisition, Investigation, Methodology, Resources, Software, Validation, Visualization, Writing–original draft. JR: Conceptualization, Funding acquisition, Resources, Supervision, Validation, Writing–review and editing.
Funding
The author(s) declare that financial support was received for the research, authorship, and/or publication of this article. This study was financially funded by Hunan Provincial Education Department (grant number: 23B0861).
Acknowledgments
Authors acknowledge Zhanhua Cao for his assistance in visualization and machine-learning. AI is used to generate design image synthesizing findings in this study.
Conflict of interest
The authors declare that the research was conducted in the absence of any commercial or financial relationships that could be construed as a potential conflict of interest.
Publisher’s note
All claims expressed in this article are solely those of the authors and do not necessarily represent those of their affiliated organizations, or those of the publisher, the editors and the reviewers. Any product that may be evaluated in this article, or claim that may be made by its manufacturer, is not guaranteed or endorsed by the publisher.
Supplementary material
The Supplementary Material for this article can be found online at: https://www.frontiersin.org/articles/10.3389/fenvs.2024.1453010/full#supplementary-material
References
An, B. Y., Wang, D., Liu, X. J., Guan, H. M., Wei, H. X., and Ren, Z. B. (2019). The effect of environmental factors in urban forests on blood pressure and heart rate in university students. J. For. Res. 24 (1), 27–34. doi:10.1080/13416979.2018.1540144
Andreucci, M. B., Russo, A., and Olszewska-Guizzo, A. (2019). Designing urban green blue infrastructure for mental health and elderly wellbeing. Sustainability 11 (22), 6425. doi:10.3390/su11226425
Bagga, P. J., Patel, K. M., Makhesana, M. A., Sirin, S., Khanna, N., Krolczyk, G. M., et al. (2023). Machine vision-based gradient-boosted tree and support vector regression for tool life prediction in turning. Int. J. Adv. Manuf. Technol. early view 126, 471–485. doi:10.1007/s00170-023-11137-2
Cameron, R. W. F., Brindley, P., Mears, M., McEwan, K., Ferguson, F., Sheffield, D., et al. (2020). Where the wild things are! Do urban green spaces with greater avian biodiversity promote more positive emotions in humans? Urban Ecosyst. 23 (2), 301–317. doi:10.1007/s11252-020-00929-z
Chan, J. Y., Leow, S. M., Bea, K. T., Cheng, W. K., Phoong, S. W., Hong, Z.-W., et al. (2022). Mitigating the multicollinearity problem and its machine learning approach: a review. Mathematics 10 (8), 1283. [Online]. doi:10.3390/math10081283
Chen, C. H., and Guo, P. (2022). Can indoor residents perceive green and blue spaces in communities as posted sentiments? A verification in nanchang. Forests 13 (9), 1421. doi:10.3390/f13091421
Chen, C. X., Li, H. W., Luo, W. J., Xie, J. H., Yao, J., Wu, L. F., et al. (2022). Predicting the effect of street environment on residents' mood states in large urban areas using machine learning and street view images. Sci. Total Environ. 816, 151605. doi:10.1016/j.scitotenv.2021.151605
Chen, L., Lu, Y., Sheng, Q., Ye, Y., Wang, R., and Liu, Y. (2020). Estimating pedestrian volume using Street View images: a large-scale validation test. Comput. Environ. Urban Syst. 81, 101481. doi:10.1016/j.compenvurbsys.2020.101481
Cityscapes Dataset (2023). Semantic understanding of urban street scenes. Available at: https://www.cityscapes-dataset.com/(Accessed August 12, 2023).
Dawson, L., Elbakidze, M., van Ermel, L. E. K., Olsson, U., Ongena, Y. P., Schaffer, C., et al. (2023). Why don't we go outside? Perceived constraints for users of urban greenspace in Sweden. Urban For. and Urban Green. 82, 127865. doi:10.1016/j.ufug.2023.127865
Dawson, L., Elbakidze, M., Yamelynets, T., van Ermel, L. E. K., Johansson, K. E., and Schaffer, C. (2024). Urban greenspace for social integration: which types of greenspace do new-Swedes prefer and why? Urban For. and Urban Green. 95, 128310. doi:10.1016/j.ufug.2024.128310
Du, H. Y., Cai, Y. L., Zhou, F. Q., Jian, H., Jiang, W. Y., and Xu, Y. Q. (2019). Urban blue-green space planning based on thermal environment simulation: a case study of Shanghai, China. Ecol. Indic. 106, 105501. doi:10.1016/j.ecolind.2019.105501
El-Hokayem, L., De Vita, P., Usman, M., Link, A., and Conrad, C. (2023). Mapping potentially groundwater-dependent vegetation in the Mediterranean biome using global geodata targeting site conditions and vegetation characteristics. Sci. Total Environ. 898, 166397. doi:10.1016/j.scitotenv.2023.166397
Fang, X. Y., Qi, Y., Hedblom, M., Gao, T., and Qiu, L. (2024). Do soundscape perceptions vary over length of stay within urban parks? J. Outdoor Recreat. Tourism-Research Plan. Manag. 45, 100728. doi:10.1016/j.jort.2023.100728
Fu, H. P., Liu, J., Dong, X. T., Chen, Z. L., and He, M. (2024). Evaluating the sustainable development goals within spatial planning for decision-making: a major function-oriented zone planning strategy in China. Land 13 (3), 390. doi:10.3390/land13030390
Garau, E., Requena-Mullor, J. M., Quintas-Soriano, C., López-Rodríguez, M. D., Otamendi-Urroz, I., Oyarzabal, M., et al. (2024). A methodological approach for integrating human emotions in protected areas management: insights from SE Spain. Landsc. Urban Plan. 244, 104988. doi:10.1016/j.landurbplan.2023.104988
Guan, H. M., Wei, H. X., Hauer, R. J., and Liu, P. (2021). Facial expressions of Asian people exposed to constructed urban forests: accuracy validation and variation assessment. Plos One 16 (6), e0253141. doi:10.1371/journal.pone.0253141
Hao, N. Y., Li, X. Z., Han, D. P., and Nie, W. B. (2024). Quantifying the impact of street greening during full-leaf seasons on emotional perception: guidelines for resident well-being. Forests 15 (1), 119. doi:10.3390/f15010119
He, Q., Wang, Y., Qiu, Q., Su, Y., Wang, Y., Wei, H. X., et al. (2023b). Joint effects of air PM2.5 and socioeconomic dimensions on posted emotions of urban green space visitors in cities experiencing population urbanization: a pilot study on 50 cities of East China. Sci. Total Environ. 861, 160607. doi:10.1016/j.scitotenv.2022.160607
He, Q., Wang, Y., Qiu, Q., Su, Y., Wei, H. X., and Li, J. Y. (2023a). Posted sentiments toward experiences in degraded forests are shaped jointly by landscape structure and microclimate. Ecosyst. Health Sustain. 9, 0004. doi:10.34133/ehs.0004
Helbich, M., Yao, Y., Liu, Y., Zhang, J. B., Liu, P. H., and Wang, R. Y. (2019). Using deep learning to examine street view green and blue spaces and their associations with geriatric depression in Beijing, China. Environ. Int. 126, 107–117. doi:10.1016/j.envint.2019.02.013
Hoang, N. D., and Tran, X. L. (2021). Remote sensing-based urban green space detection using marine predators algorithm optimized machine learning approach. Math. Problems Eng. 2021, 1–22. doi:10.1155/2021/5586913
Holy-Hasted, W., and Burchell, B. (2022). Does public space have to be green to improve well-being? An analysis of public space across Greater London and its association to subjective well-being. Cities 125, 103569. doi:10.1016/j.cities.2022.103569
Hong, S. K., Lee, S. W., Jo, H. K., and Yoo, M. (2019). Impact of frequency of visits and time spent in urban green space on subjective well-being. Sustainability 11 (15), 4189. doi:10.3390/su11154189
Huang, S. Y., Zhu, J. J., Zhai, K. B., Wang, Y., Wei, H. X., Xu, Z. H., et al. (2022). Do emotional perceptions of visible greeneries rely on the largeness of green space? A verification in nanchang, China. Forests 13 (8), 1192. doi:10.3390/f13081192
Kanelli, A. A., Vardaka, M. L., Malesios, C., Katima, Z. J., and Kalantzi, O. I. (2024). Can campus green spaces Be restorative? A case study from Tanzania. Sustainability 16 (3), 1094. doi:10.3390/su16031094
Kaplan, S., and Kaplan, R. (1989). The experience of nature: a psychological perspective. New York, USA: Cambridge University Press.
Lauwers, L., Leone, M., Guyot, M., Pelgrims, I., Remmen, R., Van den Broeck, K., et al. (2021). Exploring how the urban neighborhood environment influences mental well-being using walking interviews. Health and Place 67, 102497. doi:10.1016/j.healthplace.2020.102497
Lee, J., Park, B. J., Tsunetsugu, Y., Kagawa, T., and Miyazaki, Y. (2009). Restorative effects of viewing real forest landscapes, based on a comparison with urban landscapes. Scand. J. For. Res. 24 (3), 227–234. doi:10.1080/02827580902903341
Lehmler, S., Föerster, M., and Frick, A. (2023). Modelling green volume using sentinel-1,-2, PALSAR-2 satellite data and machine learning for urban and semi-urban areas in Germany. Environ. Manag. 72 (3), 657–670. doi:10.1007/s00267-023-01826-9
Li, H. Y., Peng, J. X., Jiao, Y., and Ai, S. S. (2022b). Experiencing urban green and blue spaces in urban wetlands as a nature-based solution to promote positive emotions. Forests 13 (3), 473. doi:10.3390/f13030473
Li, H. Y., Wang, X. G., Wei, H. X., Xia, T. T., Liu, M. N., and Ai, S. S. (2022a). Geographical distribution and driving meteorological forces of facial expressions of visitors in urban wetland parks in eastern China. Front. Earth Sci. 10, 781204. doi:10.3389/feart.2022.781204
Li, Y. S., and Guo, C. Y. (2023). Random logistic machine (RLM): transforming statistical models into machine learning approach. Commun. Statistics-Theory Methods early view 53, 7517–7525. doi:10.1080/03610926.2023.2268767
Liu, P., Liu, M. N., Xia, T. T., Wang, Y. T., and Guo, P. (2021b). The relationship between landscape metrics and facial expressions in 18 urban forest parks of northern China. Forests 12 (12), 1619. doi:10.3390/f12121619
Liu, P., Liu, M. N., Xia, T. T., Wang, Y. T., and Wei, H. X. (2021a). Can urban forest settings evoke positive emotion? Evidence on facial expressions and detection of driving factors. Sustainability 13 (16), 8687. doi:10.3390/su13168687
Liu, Y., Cao, Z., Wei, H., and Guo, P. (2024). Optimizing spatial distribution of retail shops against neighborhood tree canopy shade using big data extracted from streetscape. Land 13 (8), 1249. [Online]. doi:10.3390/land13081249
Long, Y., and Liu, L. (2017). How green are the streets? An analysis for central areas of Chinese cities using Tencent Street View. PLOS ONE 12 (2), e0171110. doi:10.1371/journal.pone.0171110
Ma, X. Y., Du, M., Deng, P., Zhou, T. H., and Hong, B. (2024). Effects of green walls on thermal perception and cognitive performance: an indoor study. Build. Environ. 250, 111180. doi:10.1016/j.buildenv.2024.111180
Mao, B., Liang, F., Li, Z. Z., and Zheng, W. Q. (2022). Microclimates potentially shape spatial distribution of facial expressions for urban forest visitors: a regional study of 30 parks in north China. Sustainability 14 (3), 1648. doi:10.3390/su14031648
Marill, K. A. (2004). Advanced statistics: linear regression, Part II: multiple linear regression. Acad. Emerg. Med. 11 (1), 94–102. doi:10.1197/j.aem.2003.09.006
Methorst, J., Rehdanz, K., Mueller, T., Hansjürgens, B., Bonn, A., and Böhning-Gaese, K. (2021). The importance of species diversity for human well-being in Europe. Ecol. Econ. 181, 106917. doi:10.1016/j.ecolecon.2020.106917
Mo, Z., Li, X., Zhai, Y., Men, Y., Tang, Y., Qiao, J., et al. (2023). Reliability and validity of a questionnaire measuring knowledge, attitude and practice regarding “oil, salt and sugar” among canteen staff. Sci. Rep. 13 (1), 20442. doi:10.1038/s41598-023-47804-3
Mora-Pérez, M., Guillén-Guillamón, I., and López-Jiménez, P. A. (2015). Computational analysis of wind interactions for comparing different buildings sites in terms of natural ventilation. Adv. Eng. Softw. 88, 73–82. doi:10.1016/j.advengsoft.2015.06.003
Nasrabadi, M. T., Morassafar, S., Pourzakarya, M., and Dunning, R. (2023). Investigating the impacts of green spaces planning on social sustainability improvement in Tehran, Iran: a SWOT-AHP analysis. Local Environ. 28 (5), 681–697. doi:10.1080/13549839.2023.2169914
OpenArt (2024). OpenArt free for creating scratch: model, prompt, create. OpenArt. Available at: https://openart.ai/create (Accessed June 13, 2024).
Otamendi-Urroz, I., Quintas-Soriano, C., Martín-López, B., Expósito-Granados, M., Alba-Patiño, D., Rodríguez-Caballero, E., et al. (2023). The role of emotions in human–nature connectedness within Mediterranean landscapes in Spain. Sustain. Sci. 18 (5), 2181–2197. doi:10.1007/s11625-023-01343-y
Paiva, P. C. P., Paiva, H. N. d., Oliveira Filho, P. M. d., Lamounier, J. A., Ferreira, E. F. e., Ferreira, R. C., et al. (2014). Development and validation of a social capital questionnaire for adolescent students (SCQ-AS). PLOS ONE 9 (8), e103785. doi:10.1371/journal.pone.0103785
Rajan, S. C., Athira, K., Jaishanker, R., Sooraj, N. P., and Sarojkumar, V. (2019). Rapid assessment of biodiversity using acoustic indices. Biodivers. Conservation 28 (8-9), 2371–2383. doi:10.1007/s10531-018-1673-0
Roy, J., Some, S., Das, N., and Pathak, M. (2021). Demand side climate change mitigation actions and SDGs: literature review with systematic evidence search. Environ. Res. Lett. 16 (4), 043003. doi:10.1088/1748-9326/abd81a
Rustamov, J., Rustamov, Z., and Zaki, N. (2023). Green space quality analysis using machine learning approaches. Sustainability 15 (10), 7782. doi:10.3390/su15107782
Sekertekin, A., Abdikan, S., and Marangoz, A. M. (2018). The acquisition of impervious surface area from LANDSAT 8 satellite sensor data using urban indices: a comparative analysis. Environ. Monit. Assess. 190 (7), 381. doi:10.1007/s10661-018-6767-3
Sou, H. D., Kim, P. R., Hwang, B., and Oh, J. H. (2021). Diurnal and seasonal variations of particulate matter concentrations in the urban forests of saetgang ecological park in seoul, korea. Land 10 (11), 1213. doi:10.3390/land10111213
Stamps, A. E., and Naser, J. L. (1997). Design review and public preferences: effects of geographical location, public consensus, sensation seeking, and architectural styles. J. Environ. Psychol. 17 (1), 11–32. doi:10.1006/jevp.1996.0036
Sun, Y., Ma, X. T., Liu, Y. F., and Meng, L. Q. (2023). Salary satisfaction of employees at workplace on a large area of planted land. Land 12 (11), 2075. doi:10.3390/land12112075
Szabo, M. D. R., Dumitras, A., Mircea, D. M., Doroftei, D., Sestras, P., Boscaiu, M., et al. (2023). Touch, feel, heal. The use of hospital green spaces and landscape as sensory-therapeutic gardens: a case study in a university clinic. Front. Psychol. 14, 1201030. doi:10.3389/fpsyg.2023.1201030
Tache, A. V., Popescu, O. C., and Petrisor, A. I. (2023). Conceptual model for integrating the green-blue infrastructure in planning using geospatial tools: case study of bucharest, Romania metropolitan area. Land 12 (7), 1432. doi:10.3390/land12071432
Talal, M. L., and Gruntman, M. (2023). Urban nature visitation, accessibility, and impact of travel distance for sustainable cities. Sci. Rep. 13 (1), 17808. doi:10.1038/s41598-023-44861-6
Ulrich, R. S., Simons, R. F., Losito, B. D., Fiorito, E., Miles, M. A., and Zelson, M. (1991). Stress recovery during exposure to natural and urban environments. J. Environ. Psychol. 11 (3), 201–230. doi:10.1016/s0272-4944(05)80184-7
Velázquez, J., Anza, P., Gutiérrez, J., Sánchez, B., Hernando, A., and García-Abril, A. (2019). Planning and selection of green roofs in large urban areas. Application to Madrid metropolitan area. Urban For. and Urban Green. 40, 323–334. doi:10.1016/j.ufug.2018.06.020
Velázquez, J., Gülçin, D., Vogt, P., Rincón, V., Hernando, A., Gutiérrez, J., et al. (2022). Planning restoration of connectivity and design of corridors for biodiversity conservation. Forests 13 (12), 2132. doi:10.3390/f13122132
Vöelker, S., and Kistemann, T. (2015). Developing the urban blue: comparative health responses to blue and green urban open spaces in Germany. Health and Place 35, 196–205. doi:10.1016/j.healthplace.2014.10.015
Walter, M., Bagozzi, B. E., Ajibade, I., and Mondal, P. (2023). Social media analysis reveals environmental injustices in Philadelphia urban parks. Sci. Rep. 13 (1), 12571. early view edition. doi:10.1038/s41598-023-39579-4
Wang, L., and Zhou, C. (2024). Evaluation of perceptions using facial expression scores on ecological service value of blue and green spaces in 61 parks in guizhou. Sustainability 16 (10), 4108. [Online]. doi:10.3390/su16104108
Wang, R. Y., Grekousis, G., Maguire, A., McKinley, J. M., Garcia, L., Rodgers, S. E., et al. (2023a). Examining the spatially varying and interactive effects of green and blue space on health outcomes in Northern Ireland using multiscale geographically weighted regression modeling. Environ. Res. Commun. 5 (3), 035007. doi:10.1088/2515-7620/acc3e1
Wang, X. P., Meng, L. Q., Liu, Y. F., and Wei, H. X. (2023b). Facial expressions of urban forest visitors jointly exposed to air pollution and regional climate. Forests 14 (8), 1571. doi:10.3390/f14081571
Wei, H., Hauer, R. J., Sun, Y., Meng, L., and Guo, P. (2022a). Emotional perceptions of people exposed to green and blue spaces in forest parks of cities at rapid urbanization regions of East China. Urban For. and Urban Green. 78, 127772. doi:10.1016/j.ufug.2022.127772
Wei, H., Zhang, J., Xu, Z., Hui, T., Guo, P., and Sun, Y. (2022b). The association between plant diversity and perceived emotions for visitors in urban forests: a pilot study across 49 parks in China. Urban For. and Urban Green. 73, 127613. doi:10.1016/j.ufug.2022.127613
Wei, H. X., Hauer, R. J., and Guo, S. L. (2021a). Daytime dynamic of spontaneous expressions of pedestrians in an urban forest park. Urban For. and Urban Green. 65, 127326. doi:10.1016/j.ufug.2021.127326
Wei, H. X., Hauer, R. J., and He, X. Y. (2021b). A forest experience does not always evoke positive emotion: a pilot study on unconscious facial expressions using the face reading technology. For. Policy Econ. 123, 102365. doi:10.1016/j.forpol.2020.102365
Wei, H. X., Hauer, R. J., and Zhai, X. Q. (2020b). The relationship between the facial expression of people in university campus and host-city variables. Appl. Sciences-Basel 10 (4), 1474. doi:10.3390/app10041474
Wei, H. X., Ma, B. Q., Hauer, R. J., Liu, C. Y., Chen, X., and He, X. Y. (2020a). Relationship between environmental factors and facial expressions of visitors during the urban forest experience. Urban For. and Urban Green. 53, 126699. doi:10.1016/j.ufug.2020.126699
Wen, Y., Gu, X. R., Deng, W. P., Zou, Q., Hu, Y., Yan, Q., et al. (2023). The effects of dynamic and static forest bathing (Shinrin-yoku) on physiological and psychological health in males and females. Forests 14 (8), 1592. doi:10.3390/f14081592
Wu, L. J., Dong, Q. D., Luo, S. X., Jiang, W. Y., Hao, M., and Chen, Q. B. (2021). Effects of spatial elements of urban landscape forests on the restoration potential and preference of adolescents. Land 10 (12), 1349. doi:10.3390/land10121349
Xiang, Y., Hedblom, M., Wang, S., Qiu, L., and Gao, T. (2022). Indicator selection combining audio and visual perception of urban green spaces. Ecol. Indic. 137, 108772. doi:10.1016/j.ecolind.2022.108772
Xin, B., Zhu, C., Geng, J., and Liu, Y. (2024). Emotional perceptions of thermal comfort for people exposed to green spaces characterized using streetscapes in urban parks. Land 13 (9), 1515. [Online]. doi:10.3390/land13091515
Xu, H. Q. (2010). Analysis of impervious surface and its impact on urban heat environment using the normalized difference impervious surface index (NDISI). Photogrammetric Eng. Remote Sens. 76 (5), 557–565. doi:10.14358/pers.76.5.557
Yu, C. P., Lee, H. Y., and Luo, X. Y. (2018). The effect of virtual reality forest and urban environments on physiological and psychological responses. Urban For. and Urban Green. 35, 106–114. doi:10.1016/j.ufug.2018.08.013
Zhang, J., Yang, Z., Chen, Z., Guo, M. Y., and Guo, P. (2021). Optimizing urban forest landscape for better perceptions of positive emotions. Forests 12 (12), 1691. doi:10.3390/f12121691
Zhang, J., Yang, Z., Sun, Y. X., Xu, Z. H., Hui, T. F., and Guo, P. (2023). Experiencing urban forests for mitigation of negative emotions of people exposed to seasonal PM2.5 in Northeast China. J. For. Res. 34 (5), 1245–1261. doi:10.1007/s11676-022-01595-x
Keywords: sustainable development goals, urban forest, green and blue spaces, sustainable infrastructure, ecological function
Citation: Zhong S and Ren J (2024) Evaluation on nature-connected environment in building embedded landscape: theory, detection, and case design. Front. Environ. Sci. 12:1453010. doi: 10.3389/fenvs.2024.1453010
Received: 22 June 2024; Accepted: 18 November 2024;
Published: 28 November 2024.
Edited by:
Alessandro Crociata, University of Studies G. d’Annunzio Chieti and Pescara, ItalyReviewed by:
Javier Velázquez, Universidad Católica de Ávila, SpainPaul Sestras, Technical University of Cluj-Napoca, Romania
Florin Ioras, Buckinghamshire New University, United Kingdom
Copyright © 2024 Zhong and Ren. This is an open-access article distributed under the terms of the Creative Commons Attribution License (CC BY). The use, distribution or reproduction in other forums is permitted, provided the original author(s) and the copyright owner(s) are credited and that the original publication in this journal is cited, in accordance with accepted academic practice. No use, distribution or reproduction is permitted which does not comply with these terms.
*Correspondence: Jiao Ren, cmVuamlhbzA4MjhAMTYzLmNvbQ==
 Shu Zhong
 Jiao Ren*