 Camila I. Donatti1,2*
 Nora Moraga-Lewy3Josephat Nyongesa4Maureen Mwanzia4Janet Edmond3Giacomo Fedele5
- 1Betty and Gordon Moore Center for Science, Conservation International, Arlington, VA, United States
- 2Department of Biological Sciences, Northern Arizona University, Flagstaff, AZ, United States
- 3Center for Communities and Conservation, Conservation International, Arlington, VA, United States
- 4Kenya Country Program, Conservation International, Nairobi, Kenya
- 5Center for Natural Climate Solutions, Conservation International, Arlington, VA, United States
African grasslands provide benefits for human communities but are negatively impacted by climate change. Climate impacts, combined with human population growth, can increase competition and conflict among humans and wildlife. Grassland restoration, a type of Nature-based Solution for climate adaptation, can improve farmers’ livelihoods by increasing the availability of water and pasture for livestock during drought events. Grassland restoration can also potentially help farmers adapt to climate change by providing human security benefits through a reduction in conflicts, which can also reduce consequent retaliatory measures on wildlife. However, those connections have not been widely explored. This paper assesses whether grassland restoration can reduce human-wildlife and social conflicts in Kenya. We collected information on conflicts using household surveys implemented over 16 months in a total of 1,567 households in Chyulu Hills when grassland restoration was also implemented. Results showed that 88.9% of the households interviewed experienced human-wildlife conflicts and 32% experienced social conflicts. There was a negative and significant correlation between the area restored in each site and both the number of human-wildlife conflicts and the number of social conflicts, showing that conflicts decrease as restoration increases. We also used time as a proxy for restoration, as areas restored and restoration activities increased through time. We did not find a decrease in human-wildlife conflicts over time, but we did find an overall decrease in social conflicts over time, as well as a reduction in the feeling of insecurity. However, not all households behave in the same way. Households led by women experienced a higher number of social conflicts compared to households led by men. Likewise, a higher number of households led by women had a perception of insecurity compared to households led by men. The results of this study provides recommendations for future projects, stakeholders, policy and decisions makers: a) to continue tracking conflicts in Chyulu Hills to understand the connections between grassland restoration and conflicts in the long-term, b) to identify and scale-up measures to mitigate human-wildlife conflicts considering the multiple conflict-causing species, including humans, and c) to consider the needs, perceptions and interests of women in designing strategies to mitigate conflicts.
Introduction
African grasslands provide several biodiversity, climate mitigation and socio-economic benefits, including the habitat for a large diversity of animals and plant species, retention of soil carbon, forage for livestock and tourism opportunities, contributing to people’s livelihoods (Shackleton et al., 2005; Matsika et al., 2013; Ferner et al., 2018; Kalvelage et al., 2020; Mbaabu, et al., 2020). Those benefits provided by grasslands are jeopardized by climate change as more intense and frequent droughts affect ecosystem resilience (Buisson et al., 2019). The impacts of climate change reduce the availability of water and fodder for livestock and wildlife, lead to the encroachment of woody species (Midgley and Bond, 2015), increase the prevalence of cattle diseases and the risk of mortality of local breeds, creating an environment less suitable for cattle (Uddin and Kebreab, 2020), disrupting livelihoods (Uddin and Kebreab, 2020) and greatly contributing to the climate vulnerability of pastoralists (López-i-Gelats et al., 2012). Resource scarcity and insecurity due to climate change have impacted peace over the last few decades (Kuusaana and Bukari, 2015; Akov, 2017; Adams et al., 2023), putting people and wildlife in competition for resources (Nyhus et al., 2005) and potentially increasing the possibility of conflict both among people and between people and wildlife (Crawford, 2015; UNDP, 2023).
Nature-based Solutions are actions that aim to restore, protect and manage ecosystems to help address societal challenges (UNEA, 2022). Grassland restoration, a type of Nature-based Solution for climate adaptation, can improve farmers’ livelihoods by increasing the availability of water and pasture for livestock during drought events. As African grasslands maintain 60% of the livestock produced in Kenya and support 70% of all the wildlife that is found outside protected areas (Mwangi, 2015), grassland restoration can lead to a healthy interaction between community members and between people and wildlife. Grassland restoration can potentially reduce the movement of pastoralists to access water and fodder for livestock, minimizing conflicts with other pastoralists looking for the same resources. Grassland restoration can also reduce the attacks of wildlife on crops and livestock, and the consequent retaliatory killings of wildlife, minimizing conflicts between humans and wildlife. Therefore, this type of Nature-based Solution can potentially help farmers adapt to climate change by providing human security benefits through a reduction in conflicts.
Even though several studies have been conducted to understand the drivers of human-wildlife and social conflicts in Africa (e.g., Makindi et al., 2014; Mekonen, 2020; Linuma et al., 2022; Zumo, 2024) there is limited information on the connections between grassland restoration activities and the frequency of social and human-wildlife conflicts. If grassland restoration can improve water and pasture for livestock and wildlife, especially during drought events, it is expected that restoration activities could help minimize both human-wildlife and social conflicts due to the increased availability of resources. The reduction in conflicts due to grassland restoration would lead to positive outcomes for both wildlife and humans. Wildlife would be less likely to suffer retaliatory measures due to the reduced impacts of wildlife on humans’ lives and livelihoods. Humans would be more likely to have healthy interactions with other members of their communities due to sufficient food and water resources for all.
This paper aims to understand the potential of grassland restoration in providing an overlooked but critical climate adaptation benefit: human security and peace, by reducing human-wildlife and social conflicts. The paper assesses whether grassland restoration, a type of Nature-based Solution for climate change adaptation, can reduce conflicts between Maasai people and wildlife and conflicts among members of Maasai communities. We collected information on conflicts using household surveys implemented in Chyulu Hills, Kenya, over 16 months when grassland restoration was also implemented. Our hypotheses were that both human-wildlife conflicts and social conflicts would be negatively associated with the area of grassland restored, and would reduce through time, which was considered a proxy for grassland restoration in our study. We also hypothesized that human-wildlife conflicts and social conflicts would increase during the months with less rainfall, as droughts can increase competition among people and between people and wildlife, thereby increasing human-wildlife and social conflicts.
Methods
Study area
The study was conducted in Chyulu Hills, south-eastern Kenya, where human-wildlife and social conflicts were monitored in indigenous Maasai communities using household surveys. The surveys were done in 4 periods between September 2022 and October 2023, coinciding with the implementation of an existing project, which is restoring 11,000 ha of African grasslands. Restoration sites were selected based on community agreements and on potential for restoration through a stakeholder workshop conducted as part of the project in January 2020.
Chyulu Hills host iconic wildlife, including the African elephant (Loxodonta africana), and the Black rhino (Diceros bicornis). The Climate Risk Profile for Makueni County (MoALF, 2016), where Chyulu Hills is located, lists it as one of the most climate vulnerable areas in the country. Increases in the frequency and intensity of drought events have occurred in the past 30 years, which has led to low water availability and the dominance of less palatable grasses for cattle. The area is expected to experience even greater changes in the next 30 years, as the temperature is expected to increase (MoALF, 2016) and continue to impact the livelihoods of pastoralists due to low cattle productivity and due to disturbances in the harvesting storage and processing of cattle products.
Human-wildlife conflicts occur frequently in Kenya (Mukeka et al., 2020), as about 70% of Kenya’s wildlife are found on private and communal lands outside protected areas (Mwangi, 2015). Human-wildlife conflicts have been occurring as a response to less water availability and less palatable grass, and to the movement of wild animals from national parks into farmlands. Those conflicts have commonly involved African elephants, baboons (Papio spp.) and blue monkeys (Cercopithecus mitis), buffalos (Syncerus caffer), lions (Panthera leo), hippopotamus (Hippopotamus amphibius) and the spotted hyena (Crocuta crocuta) (Mukeka et al., 2020, IUCN, 2023). Human-wildlife conflicts in the region have been common, with an average of 2,000 per year, with people injured, dead or felt threatened representing 44% of them (Mukeka et al., 2018; Mukeka et al., 2020). Other common types of conflicts in the study area include livestock death from wildlife attacks, wildlife injuries or deaths when people retaliate, and damages to business or infrastructure by wildlife. Limited grassland resources have also been leading to social conflicts over access to livestock grazing areas and farmlands.
Literature review
We conducted a literature review to identify indicators and metrics to track human-wildlife and social conflicts, the specific types of conflicts that have been reported, and the methodology that could be implemented to track those conflicts. In March 2022, we used the web of science to find papers using the key words “indicators, human-wildlife conflicts, methods, Africa.” We identified 82 papers that had their abstracts reviewed. Of those, 53 were read and 33 presented information that helped us design our methodology to collect data. In the same month, we conducted a search in google scholar using the terms “indicators, social conflicts, methods, Africa.” We identified 50 papers that had their abstracts reviewed. Of those, 22 presented relevant information. Based on the information extracted from the literature review (Table 1), we opted to gather information about communities’ perceptions on the frequency, types and magnitude of human-wildlife and social conflicts using household surveys (Supplementary Annex S1).
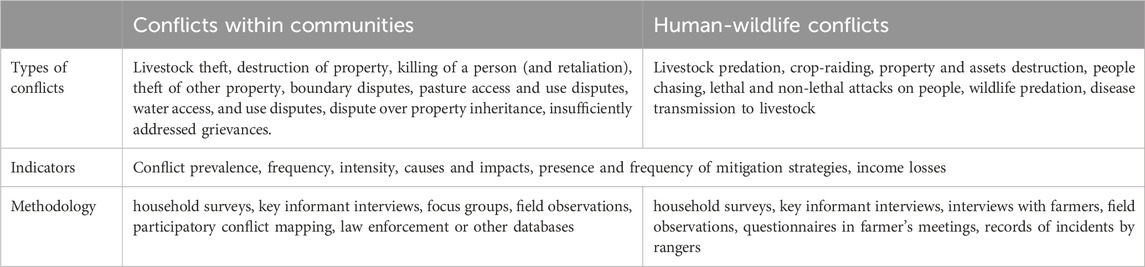
Table 1. Types of human-wildlife conflicts and social conflicts, indicators and methodology used to track those conflicts found in the literature review.
Human-wildlife and social conflicts
Human-wildlife conflicts assessed in this study included crop raiding by wildlife, livestock killing by wildlife, damages to assets and properties by wildlife and lethal and non-lethal attacks on humans by wildlife. Even though those conflicts can lead to retaliatory killing, we did not collect that information to protect the people that we interviewed as this is an illegal activity. We did however, collect information on other strategies implemented by household members to mitigate human-wildlife conflicts.
Social conflicts assessed in this study included damages to assets or properties by other members of the community, injuries due to physical conflict with other members of the community, as well as crops damages and thefts and livestock killings and thefts by other members of the community. We also assessed perceptions on whether conflicts with other members of the community could affect livestock productivity or health, and on whether livestock productivity decreased from lost access to water or grazing resources due to the imposition of a physical barrier, due to fear of violence during livestock movement or due to restricted migration or movement of livestock. We also assessed perceptions on whether conflicts with other members of the community had damaged social and/or economic relationships or resulted in a feeling of insecurity. We also collected information on strategies used to mitigate social conflicts.
Household survey sample
The household survey was conducted in two group ranches: Mbirikani and Kuku. Each group ranch had two sites: Loosikitok and Ilchalai in Mbirikani, and Kanzi and Motikanju in Kuku. At the time of the survey preparations, the total number of households in the 4 sites was 938. Loosikitok constituted of 320 households, which represents 34% of the total number of households in the area, Ilchalai comprised of 408 households, which represents 43% of the total number of the households, Kanzi had 163 households, which represents 17% of the total number of households, while Motikanju comprised of 47 households, representing 6% of the total number of households in the area.
The sample size necessary to get a sufficient representation of the population in those 4 sites was derived using:
With 5% margin of error (confidence interval) that the answers would reflect the views of the population and with 95% confidence level that the sample size accurately sampled the population, meaning that we have 95% confidence that the actual mean will fall within our confidence interval. A standard deviation of 0.5 that we expected 50% variation among the responses.
Based on those calculations, about 385 households needed to be surveyed out of the 938 in the area. To ensure that each site was well represented, we sampled each site according to the proportion of the total households they represented in the study area. The number of households was then rounded off to suit the number of enumerators that conducted the surveys in each site (Table 2). Given that a high proportion of households had to be surveyed several times, we opted to conduct the surveys in 4 time periods, conducted every 3–4 months, between September 2022 and October 2023, instead of monthly surveys to minimize the burden of household members.
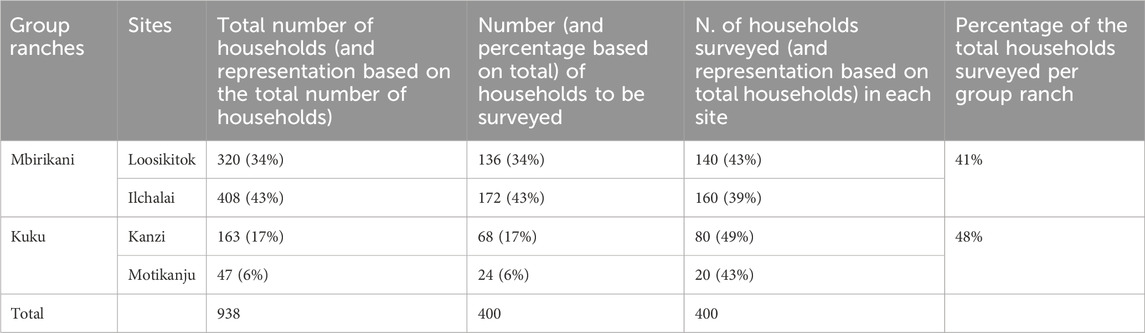
Table 2. Total number of households and number of households surveyed in each site.
We used a systematic sampling method to select the households to be interviewed on each site, using the interval of one from the list of households in the area. Most of the households were interviewed more than once. We implemented the survey with either the heads of households or the spouses of household heads in 4 periods: period 1 = September 2022 (to capture perceptions of conflicts between June and September 2022), period 2 = March 2023 (to capture perceptions of conflicts between November and March 2023), period 3 = July 2023 (to capture perceptions of conflicts between April and July 2023), and period 4 = October 2023 (to capture perceptions between August and October 2023).
Grassland restoration
In degraded African grasslands, there is high competition for resources due to the limited water and pasture for both livestock and wildlife, increasing the chances of encounters among wildlife, people and livestock and the possibility of conflicts. With grassland restoration, there is more space and resources for both livestock and wildlife, decreasing the chances of encounters with wildlife and the possibility of human-wildlife conflicts. Likewise, grassland restoration could keep the wildlife species far from households, reducing the consumption of crops and the predation of livestock. The same rationale can be used for social conflicts. Grassland restoration could reduce the chances of social conflicts due to more space and resources available for communities to raise livestock (Schilling et al., 2012; Okumu et al., 2017; Seter et al., 2018), reducing the chances of conflicts among members of the community. Therefore, our hypothesis was that the number and frequency of human-wildlife and social conflicts would decrease as restoration would take place.
This study builds on a project that aimed to restore 11,000 hectares of grassland in the same 4 sites where household surveys were conducted. At the time of the surveys, the restoration project was implementing grassland restoration practices for climate mitigation, including managing livestock in accordance with restoration plans, pruning encroaching bushes, sourcing seeds from existing seed banks and re-seeding degraded areas. The restoration project started in October 2021. The project staff collected information on the area restored (in hectares) in each of the 4 sites over time. Area restored per site and by each period when the household surveys took place was used in data analyses (see below).
Data analysis
We compared the mean number of human-wildlife conflicts and social conflicts per household among the 4 periods when we conducted the surveys, as well as between households led by men and women, using Kruskal-Wallis test. We compared the occurrence of human-wildlife conflicts and social conflicts among the 4 periods when we conducted the surveys, as well as between households led by men and women, using Fisher test. We tested the associations between the number of conflicts and area restored in each site, between the number of strategies to mitigate conflicts and area restored in each site, and between the number of conflicts and rainfall using Pearson’s correlations. Statistical analyses were done using R (https://www.r-project.org/). The significance level was assessed at 0.05 unless otherwise stated.
To check whether conflicts would vary depending on rainfall, we used the Climate Hazards Group InfraRed Precipitation with Station data (CHIRPS) to assess rainfall data (http://chg.geog.ucsb.edu/data/chirps/) for the study area. We calculated the monthly mean rainfall for the study area for the period of June 2022 to October 2023 using the function Zonal statistics in QGIS. We summed the mean rainfall values for the months that comprised each one of the 4 time periods when we conducted the surveys and used those values in the correlations.
Results
Households surveyed and characteristics of the communities
The total number of households interviewed, combining all 4 periods, was 1,567. The total number of households surveyed in each period was: 368 in September 2022, 400 in March 2023, 399 in July 2023, and 400 in October 2023. Most of the households we interviewed raised livestock (96% of the interviewed households) and some of them produced crops (28% of the interviewed households), primarily beans (56.1% of the households that produced crops), maize (41.3% of households that produced crops), and tomato (18.7% of the households that produced crops). Most interviewed households were led by men (86.9%), most of them raised livestock (87%), a smaller percentage grew crops (28.9%) or produced crops and raised livestock (26.9%). Most of the households led by women raised livestock (92.6%), a smaller percentage produced crops (22.5%), or produced crops and raised livestock (14%).
Frequency of human-wildlife conflicts
Of the total households that we interviewed, 88.9% experienced human-wildlife conflicts during the interview period. There was a significant and negative association between the number of human-wildlife conflicts reported by household members and the grassland area restored in each site (t = −3.7719, df = 1,565, p-value < 0.001, cor = −0.09). There were significant differences in the mean number of human-wildlife conflicts per household through time (Kruskal-Wallis chi-squared = 171.71, df = 3, p-value < 0.01), with the highest number of conflicts happening in period 2 (between November 2022 and March 2023) (Figure 1).
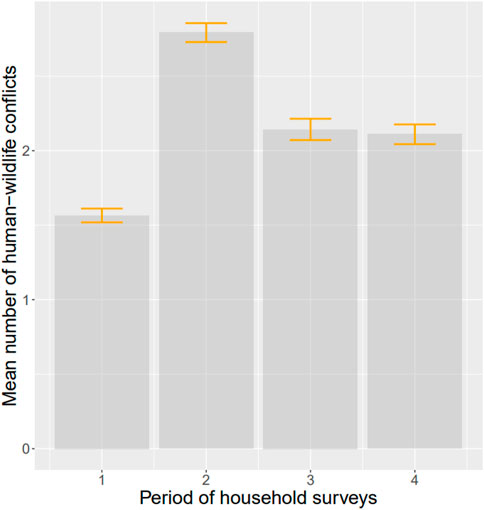
Figure 1. Mean number of human-wildlife conflicts per household in the different periods when the surveys were conducted (1 = September 2022, to capture perceptions of conflicts between June and September 2022; 2 = March 2023, to capture perceptions of conflicts between November and March 2023; 3 = July 2023, to capture perceptions of conflicts between April and July 2023; and 4 = October 2023, to capture perceptions between August and October 2023).
Of the total interviewed households, 23% had at least one member experiencing non-lethal attacks by wildlife. The most common species involved in those conflicts included elephants (77.19% of the non-lethal attacks recorded during the surveys), giraffes and spotted hyenas (8.7% each). There was a significant difference in the mean proportion of household members that experienced non-lethal attacks by wildlife in the 4 periods (Kruskal-Wallis chi-squared = 48.316, df = 3, p-value < 0.001), and that proportion was higher in period 2 (between November 2022 and March 2023) and in period 4 (between August and October 2023). There was a positive and significant association between the number of households that have experienced non-lethal attacks by wildlife and the different time periods when the surveys took place, being higher between November 2022 and March 2023 and August and October 2023 (Supplementary Table S1).
A little over 66% of the households interviewed experienced property items damaged by wildlife. Most common property items damaged by wildlife included trees (49.9%), fences (41.7%), and bomas (40.6%). There was a significant difference in the mean number of items damaged by wildlife per household in the different periods (Kruskal-Wallis chi-squared = 134.25, df = 3, p-value < 0.001), with the highest number recorded in period 4 (between August and October 2023). There was a positive and significant association between the number of households that have experienced property damage by wildlife and the different time frames (p-value < 0.001), with a higher proportion of households experiencing property items damaged by wildlife in period 2 (between November and March 2023) (Supplementary Table S1).
Of the interviewed households that produced crops (n = 439), 74% experienced crop damage by wildlife. There was a positive and significant association between the proportion of households that have experienced crop damages by wildlife and the period when the surveys took place (p-value < 0.001), with a higher proportion of households reporting this type of conflict in period 2 (between November 2022 and March 2023) (Supplementary Table S1). Fifty four percent of the households that raised livestock and for which we have information about livestock predation (n = 1,155) (please note that we only added this question in the second round of surveys) reported livestock predation by wildlife. There was a positive and significant association between the proportion of households that experienced livestock predation by wildlife and the period of the survey (p-value < 0.001), with the higher proportion of households reporting this type of conflict in period 2 (between November 2022 and March 2023) (Supplementary Table S1).
Perceived causes of crop and property damages by wildlife
Environmental-related issues were perceived as the main causes of property destruction and crop damage by most of the interviewed households. The main perceived causes of crop damage by wildlife were droughts (29%), limited food and/or water for wildlife (26.7%), lack of specific land use zonation (10.6%) and lack of fences (6.5%). The main perceived causes of property damage by wildlife were droughts (35.5%), limited food and/or water for wildlife (34.8%), overlap of wildlife routes with other land uses (8.1%) and increase in wildlife population (4.8%).
Strategies implemented by household members to mitigate human-wildlife conflicts over time
There was a negative and significant association between the number of mitigation strategies implemented by households to address human-wildlife conflicts and the area restored in each site (t = −2.6644, df = 1,565, p-value < 0.01, cor = −0.067). There was an association between the proportion of households that implemented human-wildlife conflicts and period that the surveys took place (p-value < 0.001), with the highest proportion of households implementing mitigation strategies in period 2 (between November 2022 and March 2023). The mean number of mitigation strategies implemented per household differed according to the period of the household surveys (Kruskal-Wallis chi-squared = 37.909, df = 3, p-value < 0.001), with the highest number recorded in the period 4 (between August and October 2023). Table 3 shows the perceived effectiveness of each mitigation strategy by household members.
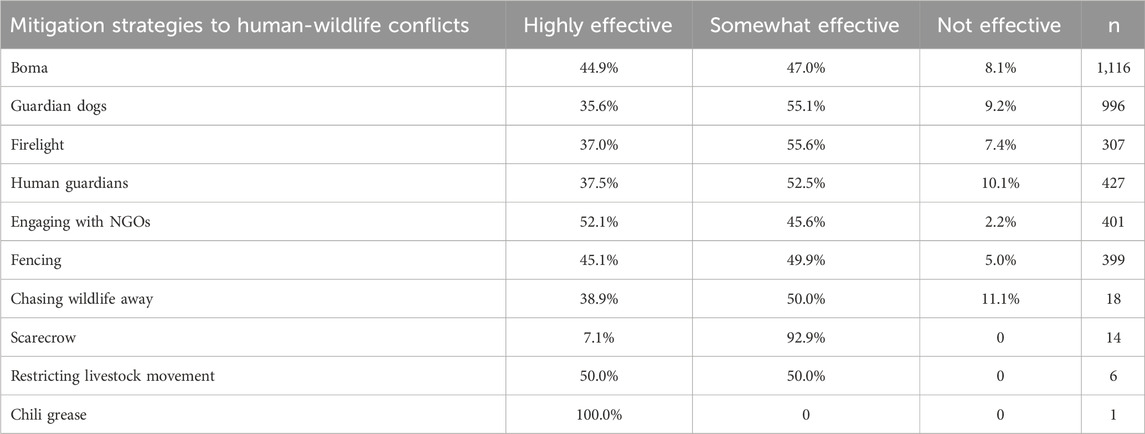
Table 3. Types of strategies used to mitigate human-wildlife conflicts in interviewed households, the perceived level of effectiveness in mitigating human-wildlife conflicts and the number of households that used each specific strategy.
Frequency of human-wildlife conflicts in households led by women and men
There was not a significant difference in the mean number of human-wildlife conflicts reported in households led by women and led by men (Kruskal-Wallis chi-squared = 1.9781, df = 1, p-value = 0.1596) and there was no association between the proportion of households that have experienced human-wildlife conflicts and the gender of the household head. There was not a significant difference in the mean proportion of household members that experienced non-lethal attacks by wildlife between households led by men or women, nor a significant association between the proportion of households that have experienced non-lethal attacks by wildlife and the gender of the household. There was not a significant difference in the mean number of items damaged by wildlife in households led by women and men, nor a significant association between the number of households that have experienced property damage by wildlife and the gender of the household head. Likewise, there was not a significant association between the number of households that had experienced crop damage by wildlife and the head of the household. There was, however, a significant association between the proportion of households that experienced livestock predation by wildlife and the head of the household (p-value < 0.001), with a higher proportion of households led by men experiencing livestock predation by wildlife, compared to households led by women (Supplementary Table S3).
Number of strategies implemented by households led by women and men to mitigate human-wildlife conflicts
The mean number of mitigation strategies implemented per household to mitigate human-wildlife conflicts differed according to the gender of the household head (Kruskal-Wallis chi-squared = 31.75, df = 1, p-value < 0.001), with the highest number recorded in households led by men. There was no association between the proportion of households that implemented human-wildlife conflicts and gender of the household head. Figure 2 shows the percentage of households led by men and women that implemented each strategy to mitigate human-wildlife conflicts.
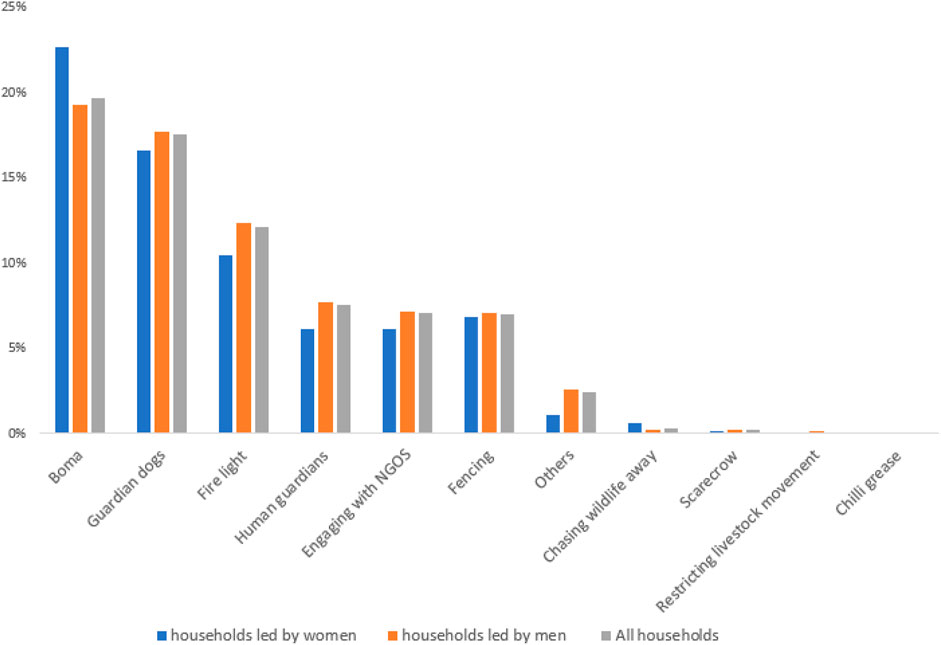
Figure 2. Percentage of each strategy used by households led by women and household led by men to mitigate human-wildlife conflicts.
Frequency of social conflicts
Social conflicts were experienced by 32% of the households that we interviewed. There was a negative and significant association between the mean number of social conflicts reported by household members and the grassland area restored in each site (t = −2.4029, df = 1,565, p-value < 0.05, cor = −0.06). The mean number of social conflicts per household varied depending on the period of the survey (Kruskal-Wallis chi-squared = 30.29, df = 3, p-value < 0.001), with the number being lowest in period 4 (between August and October 2023) (Figure 3). There was an association between the proportion of households that experienced social conflicts and the period when the household surveys took place (p-value < 0.001) with the highest proportion of households reporting social conflicts in period 2 (between November 2022 and March 2023), and the lowest in period 4 (between August and October 2023).
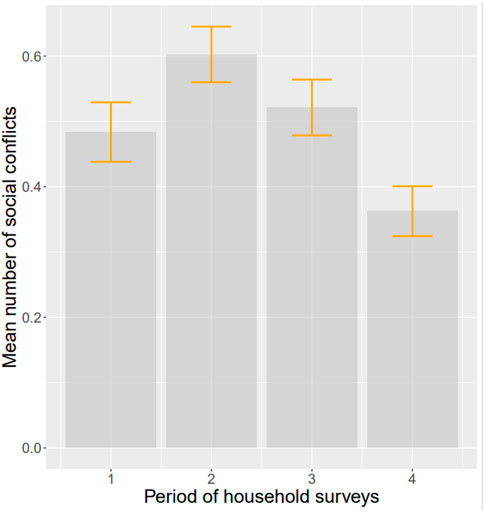
Figure 3. Mean number of social conflicts per household in the different periods when the surveys were conducted (1 = September 2022, to capture perceptions of conflicts between June and September 2022; 2 = March 2023, to capture perceptions of conflicts between November and March 2023; 3 = July 2023, to capture perceptions of conflicts between April and July 2023; and 4 = October 2023, to capture perceptions between August and October 2023).
Of the households interviewed, 17.6% experienced property items damaged due to social conflicts. The mean number of property items damaged by people per household differed depending on the period of the surveys (Kruskal-Wallis chi-squared = 15.193, df = 3, p-value < 0.001), being the highest in period 3 (between April and July 2023) and lowest in period 4 (August to October 2023). There was an association between the proportion of households that have experienced any property items damaged by people and the period when the survey took place (p-value < 0.05), being the highest in period 3 (between April and July 2023) and lowest in period 4 (between August to October 2023) (Supplementary Table S2).
The number of households that had members injured by community members outside the household was low (3.4%) and was lowest in the last period of the interviews (August to October 2023). There was a positive and significant association between the proportion of households that have had members injured due to conflicts with members of the community and the different periods (p-value < 0.001), with those types of conflicts being lowest in period 4 (between August to October 2023) (Supplementary Table S2). Of the households that produce crops, 25.5% experienced crop damage by people. The mean number of times a household experienced crop damage by people decreased over time, with the lowest value recorded in the last period of household surveys (between August and October 2023) (Kruskal-Wallis chi-squared = 11.603, df = 2, p-value < 0.001) (Supplementary Table S2). Please note that this information was not collected during the first period of the interviews.
Of the 439 households that produced crops, 13.7% experienced crop theft by people. The average number of times a household experienced crop theft by people did not statistically differ across the different periods. However, there was a significant association between the proportion of households that had experienced crop theft by people and the period of the survey (p-value < 0.05), being highest in the period 3 (between April and July of 2023) and lowest during the last period (between August and October of 2023) (Supplementary Table S2). The mean number of times a household experienced crop destruction by people decreased over time, with the lowest value recorded in the last round of surveys (Kruskal-Wallis chi-squared = 7.7864, df = 2, p-value < 0.05) (Supplementary Table S2).
Of the households that raised livestock, and for those that we collected that information (n = 1,155) only 4% experienced livestock theft by people. The mean number of times a household experienced livestock theft by people did not vary based on the period of the surveys. However, there was a significant association between the proportion of households that had experienced livestock theft by people and the period of the survey (p-value < 0.05), with similar proportions in periods 2 and 3 and a decrease in the latest period (between August and October of 2023) (Supplementary Table S2). The mean number of times a household experienced livestock killing by people varied based on the period of the surveys (Kruskal-Wallis chi-squared = 7.7864, df = 2, p-value < 0.05), being higher in periods 2 and 3, and lowest in period 4. There was a significant association between the proportion of households that had experienced livestock killing by people and the period of the survey (p-value < 0.05), with similar proportions in period 3 and a decrease in the latest period (between August and October of 2023) (Supplementary Table S2).
Impacts of social conflicts on livestock productivity and relationships
Of the households that raised livestock, 13.3% experienced impacts on the productivity of livestock due to imposition of physical barriers. The mean number of times a household experienced a decreased in the productivity of livestock due to imposition of physical barriers decreased over time (Kruskal-Wallis chi-squared = 28.913, df = 3, p-value < 0.001) (Figure 4A). Of the households that raised livestock, 14.2% experienced impacts on the productivity of livestock due to fear of violence during livestock migration or movement. The mean number of times a household experienced that fear of violence decreased over time (Kruskal-Wallis chi-squared = 37.295, df = 3, p-value < 0.001) (Figure 4B). Of the households that raised livestock, 13.5% experienced impacts on the productivity of livestock due to restricted migration. The mean number of times a household experienced that impact decreased over time (Kruskal-Wallis chi-squared = 34.411, df = 3, p-value = 1.622e-07) but the value in the first period of surveys was the only one statistically higher than the other periods (Figure 4C).
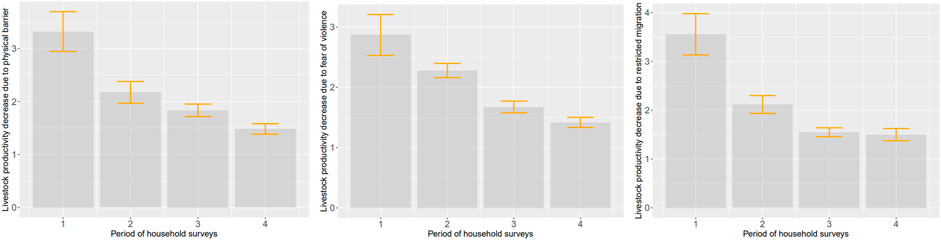
Figure 4. Mean number of times a household experienced a decrease in livestock productivity due to a physical barrier imposed by other community member. Mean number of times a household experienced a decrease in livestock productivity due to fear of violence during livestock migration or movement. Mean number of times a household experienced a decrease in livestock productivity due to restricted migration imposed by other community members in the different periods when the surveys were conducted (1 = September 2022, to capture perceptions of conflicts between June and September 2022; 2 = March 2023, to capture perceptions of conflicts between November and March 2023; 3 = July 2023, to capture perceptions of conflicts between April and July 2023; and 4 = October 2023, to capture perceptions between August and October 2023).
Of the households interviewed, 13.5% experienced weakened or damaged intercommunal or social relationships due to conflicts with other members of the community. The was a positive association between the proportion of households that perceived weakened or damaged intercommunal or social relationships due to conflicts with other members of the community and the period of the survey (p-value < 0.001), and the proportion of households that perceived those changes varied over time, being lowest in the last period of surveys (August to October of 2023). A little over 11% of households have experienced loss of longstanding economic relationships due to conflicts with other members of the community. There was a positive association between the proportion of households that perceived such losses and the time of the survey (p-value < 0.001), and the lowest proportion of households that have experienced such loss recorded in the last period of household surveys (August to October 2023).
Feeling of insecurity
There was an association between the proportion of households that expressed a feeling of insecurity and the period of the household surveys (p-value < 0.001), with a decrease in the perception of insecurity by household members over time. There was also an association between the occurrence of human-wildlife conflicts and the feeling of insecurity (p-value < 0.001) and between the occurrence of social conflicts and the feeling of insecurity reported by households (p-value < 0.001). There were associations between the use of mitigation strategies to address human-wildlife conflicts and the feeling of insecurity (p-value < 0.001) and between the use of mitigation strategies to address social conflicts and the feeling of insecurity (p-value < 0.05).
Perceived causes of injuries and property damages by other members of the community
The main perceived causes of property damage by other members of the community were land disputes (26.3%), social disagreements (16.2%), lack of food and/or water (14.7%) and droughts (10.2%). The main perceived causes of injuries by other members of the community were social disagreements (28.3%), lack of food and/or water (20.7%), influences of drugs or alcohol (13.21%) and land disputes (9.4%).
Strategies implemented by household members to mitigate social conflicts over time
There was a negative and significant association between the mean number of mitigation strategies implemented by households to address social conflicts and the area restored in each site (t = −8.282, df = 1,565, p-value < 0.001, cor = −0.2049093). There was an association between the proportion of households that implemented strategies to address social conflicts and the period of the surveys (p-value < 0.001), with the number being highest in the period 2 (November to March 2023) and lowest in the last period of interviews (August to October 2023). However, the mean number of mitigation strategies implemented per household to mitigate social conflicts did not differ across the different periods we conducted the survey. Table 4 shows the perceived effectiveness of each mitigation strategy reported by household members.
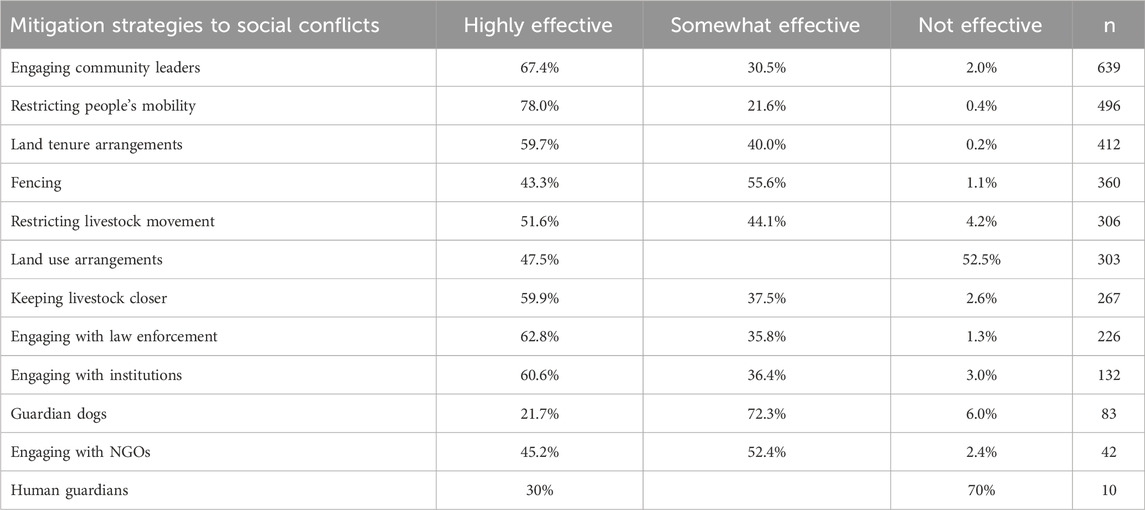
Table 4. Types of strategies used to mitigate social conflicts in interviewed household, the perceived level of effectiveness in mitigating social conflicts and the number of households that used each specific strategy.
Frequency of social conflicts in households led by women and men
The mean number of social conflicts per household varied depending on gender of the household head (Kruskal-Wallis chi-squared = 17.307, df = 1, p-value < 0.001), with a lower number reported in households led by men (Figure 5). There was an association between the proportion of households that experienced social conflicts and gender of the household head (p-value < 0.001), which was also lower in households led by men.
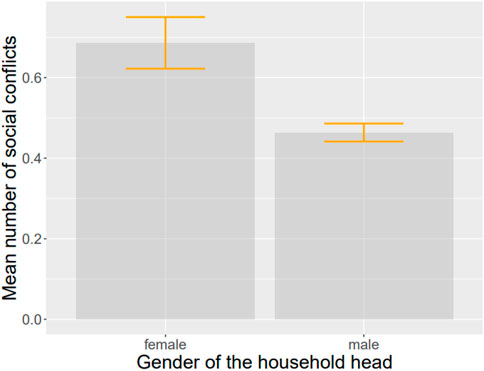
Figure 5. Mean number of social conflicts per household in the different household survey rounds (round 1 = September 2022, to capture perceptions of conflicts between June and September 2022; round 2 = March 2023, to capture perceptions of conflicts between November and March 2023; round 3 = July 2023, to capture perceptions of conflicts between April and July 2023, and round 4 = October 2023, to capture perceptions between August to October 2023).
The mean number of property items damaged by people per household differed depending on gender of the household head (Kruskal-Wallis chi-squared = 16.786, df = 1, p-value < 0.001), being the highest in households led by women. There was an association between the proportion of households that have experienced any property items damaged by people and the gender of the household head (p-value < 0.05), being the highest in households led by women. The was not a significant association between the mean number of households that have had members injured due to conflicts with members of the community and the gender of the household head.
The mean number of times a household experienced crop destruction by people did not vary based on the gender of the household head, nor there was a significant association between the mean number of households that had experienced crop damage by people and the gender of the household head. Likewise, the mean number of times a household experienced crop theft by people did not statistically vary based on the gender of the household head, and there was not a significant association between the proportion of households that had experienced crop theft by people and the gender of the household head.
In contrast, the mean number of times a household experienced livestock killing by people statistically differed based on the gender of the household head (Kruskal-Wallis chi-squared = 7.7829, df = 1, p-value < 0.05), with the number twice as high in households led by women than men. The mean number of times a household experienced livestock theft by people did not vary based on the gender of the household head and there was not a significant association between the proportion of households that had experienced livestock killing by people and the gender of the household head (Supplementary Table S4).
Impacts of social conflicts on livestock productivity and relationships in households led by women and men
The mean number of times households experienced a decrease in livestock productivity due to the imposition of physical barriers varied in households led by women and men (Kruskal-Wallis chi-squared = 3.7976, df = 1, p-value = 0.05133) and the number was higher in households led by women. The mean number of times households experienced a decrease in livestock productivity due to fear of violence during livestock migration or movement did not vary based on the gender of the household head. However, there was an association between the proportion of households that experienced impacts on livestock productivity due to fear of violence and the gender of the household head (p-value < 0.05) with the highest proportion in households led by women. The mean number of times a household experienced a decrease in livestock productivity due to restricted migration did not change based on the gender of the household head. However, there was an association between the proportion of households that experienced impacts on the productivity of livestock due to restricted migration and the gender of the household head (p-value < 0.05), with the highest proportion recorded for households led by women.
There was not a positive association between the proportion of households that perceived weakened or damaged intercommunal or social relationships due to conflicts with other members of the community and the gender of the household head. However, there was a positive association between the proportion of households that perceived loss of longstanding economic relationships due to social conflicts and the gender of the household head (p-value < 0.05), with the highest proportion reported in households led by women.
Feeling of insecurity in households led by women and men
There was a significant association between the proportion of households reporting the feeling of insecurity and the gender of the household head (p-value < 0.05), with a higher proportion of households led by women reporting a feeling of insecurity compared to households led by men.
Number of strategies implemented by households led by women and men to mitigate social conflicts
The mean number of mitigation strategies implemented per household to mitigate social conflicts differed according to the gender of the household (Kruskal-Wallis chi-squared = 3.5833, df = 1, p-value =0.05), with a higher number of mitigation strategies being implemented in households led by men. Figure 6 shows the percentage of households led by men and women that implemented each strategy to mitigate social conflicts.
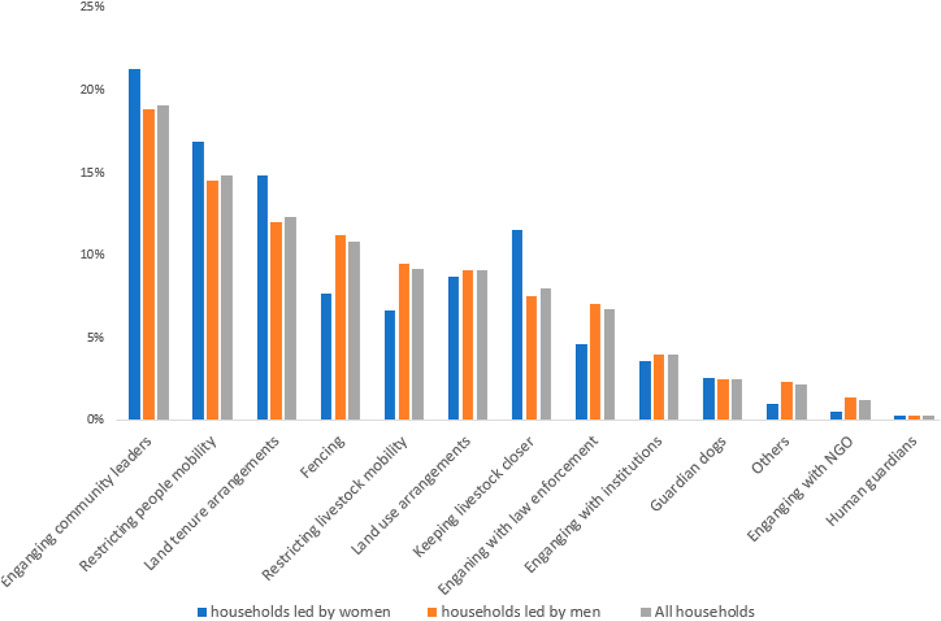
Figure 6. Percentage of each strategy used by households led by women and household led by men to mitigate social conflicts.
Associations between conflicts and strategies implemented to mitigate conflicts
There was a positive and significant correlation between the number of types of human-wildlife conflicts experienced by households and the number of strategies implemented to mitigate conflicts with wildlife (t = 3.899, df = 1,565, p-value < 0.001, cor = 0.09) and between the occurrence of human-wildlife conflicts and the implementation of mitigation strategies to address those types of conflicts (p-value < 0.001). There was not a significant correlation between the number of types of social conflicts perceived and the number of strategies implemented to mitigate conflicts (t = 1.2157, df = 1,565, p-value = 0.2243) but there was a positive association between the occurrence of social conflicts and the implementation of mitigation strategies to address those conflicts (p-value < 0.001).
Association between variables and rainfall
Between the first and the last set of interviews (June 2022 and October 2023), the sum of the average rainfall in the study area was 480 mm (Climate Hazards Group InfraRed Precipitation with Station data CHIRPS). During that period, April and November were the months with most rainfall.
There were positive and significant correlations between rainfall and the number of human-wildlife conflicts per household (t = 11.086, df = 1,565, p-value < 0.001, cor = 0.26), the number of mitigation strategies used to address human-wildlife conflicts (t = 2.2344, df = 1,565, p-value < 0.05, cor = 0.05), the number of social conflicts (t = 3.36, df = 1,565, p-value < 0.001, cor = 0.08), the number of property items damaged by wildlife (t = 3.7721, df = 1,411, p-value < 0.001, cor = 0.09), the number of items damaged by people (t = 2.035, df = 1,565, p-value < 0.05, cor = 0.05), the number of times crops were damaged by people (t = 2.473, df = 103, p-value < 0.05, cor = 0.23) and the number of livestock killing by people (t = 2.8609, df = 35, p-value < 0.01, cor = 0.43). There was a negative and significant correlation between the number of times livestock productivity decreased due to restricted migration and rainfall (t = −2.3593, df = 203, p-value<0.05, cor = −0.16).
However, there were not significant correlations between rainfall and number of mitigation strategies implemented to address social conflicts (t = −0.52452, df = 1,565, p-value = 0.6), the number of times crops were stolen by people (t = 0.48685, df = 53, p-value = 0.6284), the number of times livestock was stolen by people (t = 1.164, df = 36, p-value = 0.2521), the number of times livestock productivity decreased due to the imposition of physical barriers (t = −1.4452, df = 201, p-value = 0.15) and the number of times livestock productivity decreased due to fear of violence during livestock migration or movement (t = 0.042665, df = 214, p-value = 0.966).
Discussion
Human-wildlife conflicts were negatively associated with the area of grassland restoration but did not decrease over time
The number of human-wildlife conflicts reported by the households decreased as the restored areas increased, showing that grassland restoration is likely playing some role in reducing human-wildlife conflicts. We also used time as a proxy for grassland restoration, as areas restored, and restoration activities increased through time. However, we did not find a decrease in human-wildlife conflicts through time as expected. That could be because restoration is taking place in a relatively small area, whereas most of the animals involved with those conflicts (e.g., elephants, lions, buffalos and giraffes) have a large home range, which can reach hundreds of Km2 (Tuqa et al., 2014; Naidoo et al., 2012; Knüsel et al., 2019), potentially limiting the role of the restoration efforts that happen in a small scale on the occurrence and frequency of human-wildlife conflicts. Therefore, there is a need to scale-up and to coordinate, in time and space, restoration interventions to maximize the potential of grassland restoration in reducing human-wildlife conflicts, considering migratory patterns, life-history strategies and spatial behavior of species engaged in those types of conflicts.
We did find, however, that environmental issues (including droughts and limited water and food for wildlife) are perceived by the household members we interviewed as the main causes of conflicts with wildlife, due to the tight connections between the landscape, wildlife, and communities in Chyulu Hills. Due to those tight connections, about 89% of the households we interviewed had experienced human-wildlife conflicts. Elephants were, by far, the animals most involved in non-lethal attacks on humans, followed by giraffes and spotted hyenas. The results are consistent with other studies that reported elephants being the animals more frequently involved in conflicts with humans (Acharya et al., 2016; Gubbi, 2012). Because of their large body size, high food requirements and large home ranges, large herbivores (Lindstedt et al., 1986; Thouless, 1996) have a higher chance to encounter humans when foraging.
Overall, a high number of human-wildlife conflicts was accompanied by a high number of mitigation strategies used to address them. Most of the strategies used to mitigate human-wildlife conflict were considered “somewhat effective” by the household members we interviewed. This is probably because it is difficult to implement a few strategies that can be highly effective in mitigating a variety of types of conflicts (e.g., crop raiding, property damages, livestock predation) caused by a variety of wildlife species (e.g., elephants, giraffes, buffalos).
Social conflicts were negatively associated with the area of grassland restoration and decreased over time
The number of social conflicts reported by the households decreased as the restored areas increased. Likewise, we found an overall decrease in social conflicts and a reduction in the feeling of insecurity over time perceived by the household members we interviewed. Those results are very encouraging as grassland restoration is also likely playing some role in the reduction of social conflicts in our study area. One similarity between human-wildlife conflicts and social conflicts is that environmental-related issues, especially droughts, and limited water and food are perceived as causes of those types of conflicts. That agrees with what has been found in other studies that show that competition over resources is a major driver of social conflicts (Mamuda et al., 2017; Feldt et al., 2020; Lenshie et al., 2020).
Results differed according to the gender of the household head, with households led by women experiencing more social conflicts
Despite observed overall changes in social and human-wildlife conflicts through time and/or with restoration activities, households led by women and men are experiencing conflicts differently. There was not a significant difference in the number of human-wildlife conflicts perceived in households led by women from those perceived in households led by men and no significant association between the occurrence of human-wildlife conflicts and the gender of the household. The only exception was a significant association between the proportion of households that have experienced livestock predation by wildlife and the gender of the household, with a higher proportion of households led by men experiencing livestock predation. This could be because households led by men had on average, three times more livestock compared to households led by women, which could lead to a higher chance of livestock being preyed upon.
This similarity in the human-wildlife conflicts perceived by households led by women and men are expected, given that wildlife species do not likely make any distinguishment between households led by men from those led by women. Despite not experiencing a higher number of human-wildlife conflicts, households led by men implemented a higher number of mitigation strategies to deal with human-wildlife conflicts compared to households led by women. That may give some sort of advantage for households led by men as a higher number of mitigation strategies could better protect those households from a variety of types of human-wildlife conflicts.
Even though there were no significant differences in the number of human-wildlife conflicts experienced by household led by men and women, there were significant differences in social conflicts between households led by men and households led by women. Households led by women experienced more social conflicts when compared to households led by men, including the number of property items damaged by other members of the community and livestock killings by other members of the community. There were also significant associations between the gender of the household head and the proportions of households that experienced impacts on livestock productivity due to fear of violence and due to restrictions in migration. In both cases, a higher proportion of households led by women reported those compared to households led by men.
Despite perceiving more social conflicts, households led by women did not implement more mitigation strategies to address those types of conflicts. This perception of higher social conflicts by households led by women, combined with a lower number of strategies implemented to mitigate conflicts, could explain the higher proportion of households led by women that shared a feeling of insecurity, compared to the number of households led by men. A high number of social conflicts and low number of mitigation strategies implemented in households led by women compared to households led by men could represent a disadvantage for households led by women. Future strategies and measures implemented in the area to mitigate human-wildlife and social conflicts should take that information into account to ensure that households led by men and women are going to be equally supported when conflict-mitigating actions take place.
Rainfall as a key factor in human-wildlife conflicts and in social conflicts
Our data shows that the number of human-wildlife conflicts, the number of strategies to address those conflicts, as well as livestock predation, crop raiding, property damage and non-lethal attacks on humans by wildlife were more common during the rainy season. Those results are different from what we hypothesized, as droughts can increase competition and, therefore, conflicts between people and wildlife, but aligned with what other studies have shown. Mukeka et al. (2019) found that crop raiding peaked in the late wet season in the Masai Mara region of Narok County, Kenya, when crops mature. This is one of the explanations for the higher crop raiding and for the highest proportion of households that have experienced crop raiding during the rainy season.
Similarly, we found that livestock predation was higher in the rainy season and that is when natural prey density is lowest, and therefore difficult to find and catch, primarily due to their migration patterns, with carnivores then turning to livestock as their main prey during the rainy season (Patterson et al., 2004; Ogutu et al., 2008; Bhola et al., 2012; Mukeka et al., 2019). Reduced wild prey base (Karani et al., 1995) and large home ranges can lead to predators turning on to domestic livestock (Treves and Karanth, 2003). Livestock predation has also been shown to increase during the rainy season in the Masai Mara region of Narok County (Mukeka et al., 2019; Kolowski and Holekamp, 2006) and in Tsavo in Kenya (Patterson et al., 2004).
Rainfall also impacted the number of social conflicts. We found that the total number of social conflicts, the number of items damaged by people, the number of times crops were damaged by people and the number of livestock killings by people were all positively and significantly associated with rainfall. This is different from what we would expect, as droughts could increase competition for areas amongst pastoralists and were considered important drivers of conflicts according to community members. Some studies on the connections between changes in climatic conditions and increased risk of conflict found that excess precipitation could be responsible for raising violence (Klomp and Bulte, 2013; Salehyan and Hendrix, 2014; Theisen, 2012; Witsenburg and Adano, 2009). One explanation for the increased frequency of social conflicts during the rainy season is that rainfall would increase grassland conditions for a brief time, after an excessively dry period, attracting a high number of pastoralists to those areas that could confront over available resources.
Conclusion
The negative associations between the area of grassland restored and both the number of human-wildlife conflicts and social conflicts are very encouraging as those associations show that the number of conflicts can potentially decrease with grassland restoration. Furthermore, decreases in both social conflicts and in the feeling of insecurity over time are also important results as grassland restoration may likely be playing a role in reducing social conflicts and the overall feeling of insecurity perceived by households. Even though, in general, conflicts have been more common during the rainy season, Maasai communities in the study area are experiencing conflicts all year round. Therefore, strategies to improve the lives of communities, without negatively affecting the landscape and wildlife, should be implemented all year round and target the root causes of conflicts in different seasons. In addition to finding a positive association between grassland restoration and the reduction in conflicts, our study sheds light into a critical issue: the differences in the number of conflicts experienced by households led by women and by households led by men. The significantly higher number of social conflicts experienced by households led by women, combined with the lower number of mitigation strategies implemented to address conflicts in those households, are concerning. Therefore, future conflict-mitigation actions should consider those gender differences to be effective.
Despite the importance of this study in assessing the connections between grassland restoration and conflicts, it has some limitations. First, we only have 16 months of data, and therefore, tracking conflicts should continue in the area to understand long-term patterns, especially concerning the role of grassland restoration in the observed changes. Second, the information we asked refers to a set of conflicts and mitigation strategies we have identified previously. Therefore, other types of conflicts and mitigation strategies may have been happening in the area and should be explored. However, many insights were gained regarding human-wildlife and social conflicts in the Chyulu Hills, Kenya, that could be occurring in other places with similar settings. Third, household surveys do not proper capture retaliatory measures on wildlife. Therefore, types of human-wildlife conflicts that have negative outcomes to wildlife should be assessed using a different methodology or through government databases (e.g., from Kenya Wildlife Service).
The results of this study provides recommendations for future projects, stakeholders, policy and decisions makers: 1) to continue to track conflicts in Chyulu Hills to better understand the connections between grassland restoration and conflicts in the long-term, and to identify key strategies that can effectively minimize both human-wildlife conflicts and social conflicts; 2) to identify measures to mitigate human-wildlife conflicts considering the multiple conflict-causing species, including humans, and spatial heterogeneity in the intensity and predominant outcome of conflicts; 3) to urgently address social conflicts in households led by women, which are the most impacted by those types of conflicts; 4) to strongly consider the needs, perceptions and interests of women while designing strategies to mitigate human-wildlife conflicts and social conflicts and 5) to scale-up and to coordinate, in time and space, restoration interventions to potentially reduce human-wildlife conflicts by improving the land to wildlife species involved in those types of conflicts, especially to those with large body sizes and home ranges.
Data availability statement
The dataset used in this study can be found in Harvard Dataverse “Household surveys to assess human-wildlife conflicts and social conflicts in Chyulu Hills, Kenya”: https://doi.org/10.7910/DVN/L8JM6M.
Ethics statement
The studies involving humans were approved by Theresa Buppert, Conservation International, Alli Cruz, Conservation International, Patricia Petty, Conservation International and Margot Wood, Conservation International. The studies were conducted in accordance with the local legislation and institutional requirements. The participants provided their consent to participate in this study.
Author contributions
CD: Conceptualization, Formal Analysis, Funding acquisition, Investigation, Methodology, Project administration, Visualization, Writing–original draft, Writing–review and editing, Data curation. NM-L: Formal Analysis, Investigation, Methodology, Visualization, Writing–original draft. JN: Conceptualization, Formal Analysis, Funding acquisition, Investigation, Methodology, Supervision, Visualization, Writing–original draft, Writing–review and editing. MM: Formal Analysis, Investigation, Methodology, Supervision, Visualization, Writing–original draft. JE: Conceptualization, Funding acquisition, Investigation, Methodology, Visualization, Writing–original draft, Writing–review and editing. GF: Conceptualization, Funding acquisition, Investigation, Methodology, Visualization, Writing–original draft, Writing–review and editing.
Funding
The author(s) declare that financial support was received for the research, authorship, and/or publication of this article. The authors declare that financial support from The Global EbA Fund was received for the research and publication of this article (grant number 304_1_039). The Global EbA Fund is a catalytic funding mechanism for supporting innovative approaches to EbA to create enabling environments for its mainstreaming and scaling up. The fund is financed by International Climate Initiative (IKI) of the German Federal Ministry for the Environment, Nature Conservation, Nuclear Safety and Consumer Protection (BMUV) and co-managed by the International Union for Conservation of Nature (IUCN) and partners.
Acknowledgments
The authors are grateful for the support of The Global EbA Fund (grant number 304_1_039). The fund is financed by International Climate Initiative (IKI) of the German Federal Ministry for the Environment, Nature Conservation, Nuclear Safety and Consumer Protection (BMUV) and co-managed by the International Union for Conservation of Nature (IUCN) and partners.
Conflict of interest
The authors declare that the research was conducted in the absence of any commercial or financial relationships that could be construed as a potential conflict of interest.
Publisher’s note
All claims expressed in this article are solely those of the authors and do not necessarily represent those of their affiliated organizations, or those of the publisher, the editors and the reviewers. Any product that may be evaluated in this article, or claim that may be made by its manufacturer, is not guaranteed or endorsed by the publisher.
Supplementary material
The Supplementary Material for this article can be found online at: https://www.frontiersin.org/articles/10.3389/fenvs.2024.1431316/full#supplementary-material
References
Acharya, K. P., Paudel, P. K., Neupane, P. R., and Kohl, M. (2016). Human-wildlife conflicts in Nepal: patterns of human fatalities and injuries caused by large mammals. PLoS One 11 (9), e0161717. doi:10.1371/journal.pone.0161717
Adams, E. A., Thill, A., Kuusaana, E. D., and Mittag, A. (2023). Farmer-herder conflicts in sub-saharan Africa: drivers, impacts and resolution and peacebuilding strategies. Environ. Res. Lett. 18, 123001. doi:10.1088/1748-9326/ad0702
Akov, E. T. (2017). The resource-conflict debate revisited: untangling the case of farmer–herdsman clashes in the North Central region of Nigeria. Secur. Rev. 26, 288–307. doi:10.1080/10246029.2017.1294088
Bhola, N., Ogutu, J. O., Said, M. Y., Piepho, H.-P., and Olff, H. (2012). The distribution of large herbivore hotspots in relation to environmental and anthropogenic correlates in the Mara region of Kenya. J. Anim. Ecol. 81 (6), 1268–1287. doi:10.1111/j.1365-2656.2012.02000.x
Buisson, E., Le Stradic, S., Silveira, F. A. O., Durigan, G., Overbeck, G. E., Fidelis, A., et al. (2019). Resilience and restoration of tropical and subtropical grasslands, savannas, and grassy woodlands. Biol. Rev. 94, 590–609. doi:10.1111/brv.12470
Crawford, E. (2015). Identifying the enemy: civilian participation in armed conflict. Oxford University Press.
Feldt, T., Karg, H., Kadaouré, I., Bessert, L., and Schlecht, E. (2020). Growing struggle over rising demand: how land use change and complex farmer-grazier conflicts impact grazing management in the Western Highlands of Cameroon. Land Use Policy 95, 104579. doi:10.1016/j.landusepol.2020.104579
Ferner, J., Schmidtlein, S., Guuroh, R. T., Lopatin, J., and Linstädter, A. (2018). Disentangling effects of climate and land-use change on West African drylands’ forage supply. Glob. Environ. Chang. 53, 24–38. doi:10.1016/j.gloenvcha.2018.08.007
Gubbi, S. (2012). Patterns and correlates of human-elephant conflict around a south Indian reserve. Biol. Conserv. 148 (1), 88–95. doi:10.1016/j.biocon.2012.01.046
IUCN (2023). The IUCN red list of threatened species. Version 2023-1. Available at: https://www.iucnredlist.org (Accessed October 20, 2023).
Kalvelage, L., Revilla Diez, J., and Bollig, M. (2020). How much remains? Local value capture from tourism in Zambezi, Namibia. Tour. Geogr. 1, 759–780. doi:10.1080/14616688.2020.1786154
Karani, I. W., Dublin, H. T., and Koehler, G. M. (1995). “Livestock depredation by predators in pastoral areas adjacent to Maasai Mara National Reserve, Kenya,” in Proc 1st international wildlife management congress. Integrating people and wildlife for a sustainable future (Bethseda, United States: The Wildlife Society), 360e363.
Klomp, J., and Bulte, E. (2013). Climate change, weather shocks, and violent conflict: a critical look at the evidence. Agric. Econ. 44, 63–78. doi:10.1111/agec.12051
Knüsel, M. A., Lee, D. E., König, B., and Bond Monica, L. (2019). Correlates of home range sizes of giraffes, Giraffa camelopardalis. Anim. Behav. 149, 143–151. doi:10.1016/j.anbehav.2019.01.017
Kolowski, J. M., and Holekamp, K. E. (2006). Spatial, temporal, and physical characteristics of livestock depredations by large carnivores along a Kenyan reserve border. Biol. Conserv. 128 (4), 529–541. doi:10.1016/j.biocon.2005.10.021
Kuusaana, E. D., and Bukari, K. N. (2015). Land conflicts between smallholders and Fulani pastoralists in Ghana: evidence from the Asante Akim north District (AAND). J. Rural. Stud. 42, 52–62. doi:10.1016/j.jrurstud.2015.09.009
Lenshie, N. E., Okengwu, K., Ogbonna, C. N., and Ezeibe, C. (2020). Desertification, migration, and herder-farmer conflicts in Nigeria: rethinking the ungoverned spaces thesis. Small Wars Insurgencies. 32 1221–1251. doi:10.1080/09592318.2020.1811602
Lindstedt, S. L., Miller, B. J., and Buskirk, S. W. (1986). Home range, time, and body size in mammals. Ecology 67 (2), 413–418. doi:10.2307/1938584
Linuma, O. F., Mahenge, A., Mato, R. R. A. M., and Greenwood, A. D. (2022). Drivers of Human‒wildlife interactions in a co-existence area: a case study of the Ngorongoro conservation area, Tanzania. Discov. Sustain 3, 45. doi:10.1007/s43621-022-00113-7
López-i-Gelats, F., Bartolomé, J., and Rivera-Ferre, M. (2012). “Vulnerability to climate change of Turkana pastoralist of dry savanna,” in New approaches for grassland research in a context of climate and socio-economic changes. Editors Z. Acar, A. López-Francos, and C. Porqueddu (Zaragoza: CIHEAM), 69–72. (Options Méditerranéennes : Série A. Séminaires Méditerranéens; n. 102).
Makindi, S. M., Mutinda, M. N., Olekaikai, N. K. W., Olelebo, W. L., and Aboud, A. A. (2014). Human–wildlife conflicts: causes and mitigation measures in tsavo conservation area, Kenya. Int. J. Sci. Res. 3 (6), 1025–1031.
Mamuda, A., Azom, S. N., Okoli, A. C., and Ugwu, A. C. (2017). The state and farmer-herder conflict in Nigeria: a prima facie evidence from north central Nigeria.
Matsika, R., Erasmus, B. F. N., and Twine, W. C. (2013). Double jeopardy: the dichotomy of fuelwood use in rural South Africa. Energy Policy 52, 716–725. doi:10.1016/j.enpol.2012.10.030
Mbaabu, P. R., Olago, D., Gichaba, M., Eckert, S., Eschen, R., Oriaso, S., et al. (2020). Restoration of degraded grasslands, but not invasion by Prosopis juliflora, avoids trade-offs between climate change mitigation and other ecosystem services. Sci. Rep. 10, 20391. doi:10.1038/s41598-020-77126-7
Mekonen, S. (2020). Coexistence between human and wildlife: the nature, causes and mitigations of human wildlife conflict around Bale Mountains National Park, Southeast Ethiopia. BMC Ecol. 20, 51. doi:10.1186/s12898-020-00319-1
Midgley, G. F., and Bond, W. J. (2015). Future of African terrestrial biodiversity and ecosystems under anthropogenic climate change. Nat. Clim. Chang. 5, 823–829. doi:10.1038/nclimate2753
MoALF (2016). Climate risk profile for Makueni. Kenya county climate risk profile series. Nairobi, Kenya: The Kenya Ministry of Agriculture, Livestock and Fisheries, MoALF.
Mukeka, J. M., Ogutu, J. O., Kanga, E., and Roskaft, E. (2018). Characteristics of human-wildlife conflicts in Kenya: examples of tsavo and Maasai Mara regions. Environ. Nat. Resour. Res. 8 (3), 148–165. doi:10.5539/enrr.v8n3p148
Mukeka, J. M., Ogutu, J. O., Kanga, E., and Roskaft, E. (2019). Human-wildlife conflicts and their correlates in Narok County, Kenya. Glob. Ecol. Conservation 18, e00620. doi:10.1016/j.gecco.2019.e00620
Mukeka, J. M., Ogutu, J. O., Kanga, E., and Roskaft, E. (2020). Spatial and temporal dynamics of human-wildlife conflicts in the Kenya Greater Tsavo Ecosystem. Human-wildlife Interact. 14 (2), 255–272.
Mwangi, D. M. (2015). Grassland and livestock production: the east african case. XXIII Int. Grassl. Congr. New Delhi, India.
Naidoo, R., Du Preez, P., Stuart-Hill, G., Jago, M., and Wegmann, M. (2012). Home on the range: factors explaining partial migration of African buffalo in a tropical environment. PLoS One 7 (5), e36527. doi:10.1371/journal.pone.0036527
Nyhus, P. J., Osofsky, S. A., Ferraro, P., Madden, F., and Fischer, H. (2005). Bearing the costs of human-wildlife conflicts: the challenges of compensation schemes. London: Cambridge University Press, The Zoological Society of London.
Ogutu, J. O., Piepho, H.-P., Dublin, H. T., Bhola, N., and Reid, R. S. (2008). Rainfall influences on ungulate population abundance in the Mara-Serengeti ecosystem. J. Anim. Ecol. 77 (4), 814–829. doi:10.1111/j.1365-2656.2008.01392.x
Okumu, W., Bukari, K. N., Sow, P., and Onyiego, E. (2017). The role of elite rivalry and ethnic politics in livestock raids in Northern Kenya. J. Mod. Afr. Stud. 55 (3), 479–509. doi:10.1017/s0022278x17000118
Patterson, B. D., Kasiki, S. M., Selempo, E., and Kays, R. W. (2004). Livestock predation by lions (Panthera leo) and other carnivores on ranches neighboring Tsavo National Parks, Kenya. Biol. Conserv. 119 (4), 507–516. doi:10.1016/j.biocon.2004.01.013
Salehyan, I., and Hendrix, C. S. (2014). Climate shocks and political violence. Glob. Environ. Change 28, 239–250. doi:10.1016/j.gloenvcha.2014.07.007
Schilling, J., Opiyo, F. E. O., and Scheffran, J. (2012). Raiding pastoral livelihoods: motives and effects of violent conflict in North-Western Kenya. Pastoralism 2 (1), 25. doi:10.1186/2041-7136-2-25
Seter, H., Theisen, O. M., and Schilling, J. (2018). All about water and land? Resource-related conflicts in East and West Africa revisited. GeoJournal 83 (1), 169–187. doi:10.1007/s10708-016-9762-7
Shackleton, C. M., Shackleton, S. E., Netshiluvhi, T. R., and Mathabela, F. R. (2005). The contribution and direct-use value of livestock to rural livelihoods in the Sand River catchment, South Africa. Afr. J. Range Forage Sci. 22, 127–140. doi:10.2989/10220110509485870
Theisen, O. M. (2012). Climate clashes? Weather variability, land pressure, and organized violence in Kenya, 1989–2004. J. Peace Res. 49, 81–96. doi:10.1177/0022343311425842
Thouless, C. R. (1996). Home ranges and social organization of female elephants in northern Kenya. Afr. J. Ecol. 34 (3), 284–297. doi:10.1111/j.1365-2028.1996.tb00623.x
Treves, A., and Karanth, K. U. (2003). Human-carnivore conflict and perspectives on carnivore management worldwide. Conserv. Biol. 17 (6), 1491–1499. doi:10.1111/j.1523-1739.2003.00059.x
Tuqa, J. H., Funston, P., Musyoki, C., Ojwang, G. O., Gichuki, N. N., Bauer, H., et al. (2014). Impact of severe climate variability on lion home range and movement patterns in the Amboseli ecosystem, Kenya. Glob. Ecol. Conservation 2, 1–10. doi:10.1016/j.gecco.2014.07.006
Uddin, M. E., and Kebreab, E. (2020). Review: impact of food and climate change on pastoral industries. Front. Sustain. Food Syst. 4. doi:10.3389/fsufs.2020.543403
UNDP (2023). Mapping of climate security adaptations at community level in the Horn of Africa. Sweden.
Witsenburg, K. M., and Adano, W. R. (2009). Of rain and raids: violent livestock raiding in northern Kenya. Civ. Wars 11, 514–538. doi:10.1080/13698240903403915
Keywords: climate change adaptation, Maasai communities, restoration, conflict-mitigating strategies, African grasslands, human security
Citation: Donatti CI, Moraga-Lewy N, Nyongesa J, Mwanzia M, Edmond J and Fedele G (2025) Grassland restoration impacts human-wildlife and social conflicts in the Chyulu Hills, Kenya. Front. Environ. Sci. 12:1431316. doi: 10.3389/fenvs.2024.1431316
Received: 11 May 2024; Accepted: 06 December 2024;
Published: 18 February 2025.
Edited by:
Nalini Rao, Electric Power Research Institute (EPRI), United StatesReviewed by:
Thomas Göttert, Eberswalde University for Sustainable Development, GermanyM. Arasumani, University of Greifswald, Germany
Copyright © 2025 Donatti, Moraga-Lewy, Nyongesa, Mwanzia, Edmond and Fedele. This is an open-access article distributed under the terms of the Creative Commons Attribution License (CC BY). The use, distribution or reproduction in other forums is permitted, provided the original author(s) and the copyright owner(s) are credited and that the original publication in this journal is cited, in accordance with accepted academic practice. No use, distribution or reproduction is permitted which does not comply with these terms.
*Correspondence: Camila I. Donatti, Y2RvbmF0dGlAY29uc2VydmF0aW9uLm9yZw==