 Xuan-Hien Le
 Chanul Choi
 Song Eu
 Minho Yeon
 Giha Lee
- 1Department of Advanced Science and Technology Convergence, Kyungpook National University, Sangju, Republic of Korea
- 2Faculty of Water Resources Engineering, Thuyloi University, Hanoi, Vietnam
- 3Department of Forest Environment and Conservation, National Institute of Forest Science, Seoul, Republic of Korea
Landslide susceptibility mapping (LSM) is essential for determining risk regions and guiding mitigation strategies. Machine learning (ML) techniques have been broadly utilized, but the uncertainty and interpretability of these models have not been well-studied. This study conducted a comparative analysis and uncertainty assessment of five ML algorithms—Random Forest (RF), Light Gradient-Boosting Machine (LGB), Extreme Gradient Boosting (XGB), K-Nearest Neighbor (KNN), and Support Vector Machine (SVM)—for LSM in Inje area, South Korea. We optimized these models using Bayesian optimization, a method that refines model performance through probabilistic model-based tuning of hyperparameters. The performance of these algorithms was evaluated using accuracy, Kappa score, and F1 score, with accuracy in detecting landslide-prone locations ranging from 0.916 to 0.947. Among them, the tree-based models (RF, LGB, XGB) showed competitive performance and outperformed the other models. Prediction uncertainty was quantified using bootstrapping and Monte Carlo simulation methods, with the latter providing a more consistent estimate across models. Further, the interpretability of ML predictions was analyzed through sensitivity analysis and SHAP values. We also expanded our investigation to include both the inclusion and exclusion of predictors, providing insights into each significant variable through a comprehensive sensitivity analysis. This paper provides insights into the predictive uncertainty and interpretability of ML algorithms for LSM, contributing to future research in South Korea and beyond.
1 Introduction
Landslides are natural disasters that can potentially cause considerable damage to infrastructure facilities, people’s lives, and properties. Therefore, a correct evaluation of landslide susceptibility is of utmost importance for natural hazard management and mitigation (van Westen et al., 2008; Maes et al., 2017). One of the solutions to minimize the negative impacts that landslides may cause is the LSM of vulnerable areas. LSM is the process of identifying areas more susceptible to landslides by analyzing a range of factors, such as geomorphological or geological, that influence the likelihood of landslides (Pardeshi et al., 2013).
Landslides can be categorized according to their causes, for example, shallow landslides, deep-seated landslides, and rockfalls. Different combinations of conditions cause each type of landslide and often require specific approaches to predict susceptibility. For example, shallow landslides are mainly caused by soil erosion, slope instability, and saturation (Jiang and Huang, 2016; Jiang and Huang, 2018; Thang et al., 2022), while deep-seated landslides are usually triggered by the underground movement of soil and rock (Abella and Westen, 2008). The factors that affect landslide susceptibility are diverse and include geological factors (e.g., rock type, soil type, the structure of the rock layers), geomorphological characteristics (e.g., slope angle, aspect, curvature), hydrological factors (e.g., precipitation, drainage, groundwater), or climatic factors (e.g., temperature, vegetation, land use) (Shano et al., 2020). These components have different levels of importance, depending on the type of landslide and location.
Traditional methods for LSM include the analytical hierarchy process (Yalcin, 2008), logistic regression (Ayalew and Yamagishi, 2005), weights of evidence (Islam et al., 2022), and frequency ratio (Aditian et al., 2018; Hoa et al., 2023). These methods often require expert knowledge and the use of qualitative data, which may be difficult to obtain (Reichenbach et al., 2018). Additionally, traditional methods usually have limitations when dealing with large datasets and identifying complicated relationships in the dataset (Liu S. et al., 2023).
ML is an area of artificial intelligence that enables computers to extract information from the input without being specifically instructed (Ghasemian et al., 2022; Le and Le, 2024). It is frequently utilized in various applications, including bias correction (Nguyen et al., 2023) and streamflow prediction (Hien et al., 2023). ML approaches have been increasingly applied in LSM in recent years because of their ability to identify complex relationships in the dataset and make highly accurate predictions (Ado et al., 2022; Huang et al., 2024b). Several types of ML methods have been used in LSM, such as supervised learning (Khalil et al., 2022), unsupervised learning (Fang et al., 2021), and deep learning (Liu M. et al., 2023). Supervised learning is the most prevalent technique for LSM as it uses a labeled dataset in which input and output variables are known. For example, Peethambaran et al. (2020) compared supervised learning algorithms for LSM in part of the Indian Himalayas. Pham et al. (2016) evaluated the landslide susceptibility for the Uttarakhand area of India. They reported that the SVM algorithm outperforms other techniques such as Network Bayesian, Naive Bayes, and Logistic Regression (LR). Merghadi et al. (2020) examined and compared several ML approaches for a study in Algeria. The authors concluded that the RF algorithm provides reliable performance in LSM. Another investigation conducted in Ardanuc, Turkey, by Akinci and Zeybek (2021) confirmed the superiority of ML techniques such as RF, SVM, and LR in generating LSMs compared to traditional statistical methods.
Unsupervised learning has also been used in LSM for risk assessment and management (Zhu et al., 2020). These algorithms are used to identify patterns or areas with similar characteristics and group them. Moreover, they are often used with supervised learning to improve LSM (Liang et al., 2021; Su et al., 2022). Deep learning-based LSM has recently become an increasingly prominent research area (Bui et al., 2020). In the study by Hamedi et al. (2022), they employed a convolutional neural network and long short-term memory to detect landslide-prone locations in the Ardabil area of Iran. Dao et al. (2020) introduced a deep neural network to predict landslide susceptibility in Vietnam’s Muong Lay region based on a record of 217 landslide events collected. The studies listed above have illustrated the advantages of ML algorithms in processing large data sets and making highly accurate predictions, especially in LSM. However, the predictions made by these models are often associated with an uncertainty that needs to be quantified and evaluated (Huang et al., 2022). Furthermore, there have not been many studies on uncertainty analysis of ML algorithms in LSM up to date.
For ML models, uncertainty analysis is an essential step in evaluating their performance and understanding the confidence level of the predictions (Abdar et al., 2021; Mohammadifar et al., 2022). In the context of LSM, the uncertainty of the predictions can be caused by various sources, for instance, different landslide boundaries (Huang et al., 2022), the variability of the input dataset (Gaidzik and Ramírez-Herrera, 2021; Huang et al., 2024a), the complexity of the algorithm, or the limited sample size of the data (Tang et al., 2023). There are several methods for uncertainty analysis of ML algorithms, such as bootstrapping, Monte Carlo simulation, and Bayesian model averaging. Bootstrapping is a resampling strategy that generates numerous samples from the original dataset before fitting the model to each one (Gewerc, 2020). Monte Carlo simulation is a method that produces multiple scenarios by randomly sampling the input variables, and then the model is applied to each scenario (Han et al., 2011). Bayesian model averaging is a method that combines multiple models to produce a final prediction, and the uncertainty is evaluated based on the weights assigned to each model.
This research will concentrate on the uncertainty analysis of ML models using bootstrapping and Monte Carlo approaches. Bootstrapping is a non-parametric method that does not assume any specific probability distribution for the data (James et al., 2013). Monte Carlo simulation is a stochastic method that can handle complex models and non-linear relationships (Grana et al., 2020). These methods provide a way to estimate the uncertainty of the predictions by creating many tests from the data and model. They are two popular uncertainty analysis techniques in ML models (Guo, 2020). Despite this, the comparison of these methods in LSM is still limited. Therefore, the primary motivation of this study is to generate LSMs using various ML models, followed by an in-depth analysis of the uncertainty and interpretability of these models. The following are the specific objectives of this study:
• To develop LSMs using five ML algorithms, including KNN, SVM, RF, XGB, and LGB. These models have been selected based on their diverse methodologies and proven track records in LSM. They are trained on a dataset of landslide occurrences, and their hyperparameters are tuned by Bayesian optimization.
• To benchmark the performance of five models using metrics like accuracy, Kappa coefficient, and F1 score. This benchmarking will serve as a baseline to assess the efficacy of each algorithm.
• To compare the performance of the bootstrapping and Monte Carlo techniques in estimating the uncertainty of the ML models. The investigation into the uncertainty aspect involves a detailed examination of the stability and consistency of model predictions across multiple simulations.
• To conduct a sensitivity analysis of the input variables, determining their individual and combined influence on the model outcomes. This includes assessing the impact of both the inclusion and exclusion of predictors, thus establishing a holistic understanding of their significance.
• To analyze the interpretability of the ML algorithms through SHAP (SHapley Additive exPlanations) values, providing an understanding of individual feature contributions to the model’s decision-making process. This analysis is crucial for explaining the model outcomes and ensuring that the LSMs are transparent and justifiable.
In the study, we selected the Inje area in Gangwon Province of South Korea as the area for LSM and quantification of ML algorithms. Due to the steep mountainous terrain, the Inje area is landslide-prone (Lee et al., 2016). By achieving these objectives, this study aims to improve the reliability and interpretability of ML models in LSM and provide a comprehensive understanding of the roles different predictors play in the model’s predictive capabilities. The findings from this study will contribute valuable insights for the LSM in South Korea and set a precedent for similar studies in the domain of geospatial predictive modeling.
2 Materials and methods
2.1 Data and study area
Inje County is situated in the eastern part of the Korean Peninsula, in Gangwon Province of South Korea. It has a humid continental climate influenced by the monsoons, with hot and wet summers and cold and dry winters (Kadavi et al., 2019). With a total area of 1,172 km2 and a low population density compared to other regions in South Korea, Inje County is surrounded by mountain ranges. It is known to be one of the snowiest areas in the country (Lee C. et al., 2015). The yearly rainfall in the area ranges from 1,300–1,900 mm, primarily concentrated in the mountainous regions (Lee S. et al., 2015). Inje also experiences a wide range of temperatures, with the average temperature ranging from 6.6°C to 13.1°C. January has the lowest average maximum daytime temperature of −1°C, whereas August has the highest average maximum temperature of 23°C.
Characterized by its steep mountainous terrain, Inje County is particularly vulnerable to landslides, which pose significant risks to infrastructure, transportation networks, and local communities (Le et al., 2023). Landslide morphology in this region varies widely, ranging from shallow debris flows on steep slopes to deeper-seated landslides in more stable but geomorphologically sensitive areas (Korea Forest Service, 2021). These landslides are typically triggered by intense rainfall events during monsoon seasons or rapid snowmelt, and their occurrences are exacerbated by the geological composition of the region (Lee et al., 2009), which includes friable sedimentary layers interspersed with more resistant igneous and metamorphic rocks (Lee et al., 2021). This geological variability contributes to differential erosion rates and structural weaknesses that predispose the landscape to slide events. Therefore, LSM for the Inje area is essential in managing and mitigating adverse impacts caused by landslide disasters. Figure 1 depicts the geography of Inje County.
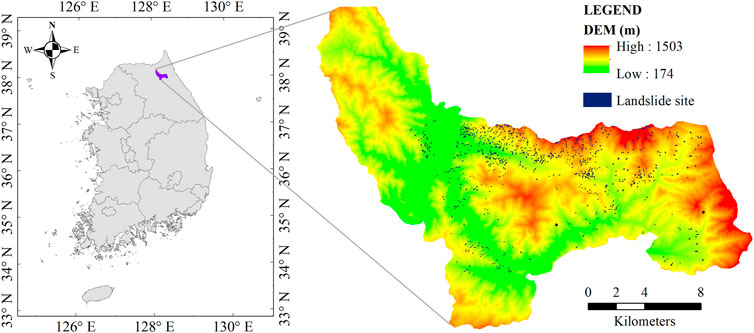
Figure 1. Location of the studied region and distribution of landslide sites.
This investigation utilizes high-resolution geospatial data, with a grid size of 10 m × 10 m, effectively capturing the intricate topographical details crucial for LSM. The study area, spanning dimensions of 3,148 × 2,699 cells, covers a comprehensive range of landslide-prone landscapes in the Inje area. The data sources included ten key parameters that are commonly used to assess landslide potential, as recommended and provided by the National Institute of Forest Science, South Korea. These parameters are described in Table 1. In addition to these factors, landslide occurrence data from 2005 to 2019 were carefully and long-term collected from the database of the Korea Meteorological Administration. The high-resolution raster format of this dataset enables precise identification of landslide sites, ensuring a thorough representation of landslide-prone areas in the study.

Table 1. Information on several factors that cause landslides.
2.2 Data pre-processing
As mentioned, the geospatial dataset of factors that may affect landslide risk in Inje was retrieved based on the recommendation of the National Institute of Forest Science, South Korea. The pre-processing of the landslide and environmental datasets is a multi-stage process. Firstly, the landslide inventory, collated from various sources, including aerial imagery, drone surveys, and field assessments, is rasterized to align with the 10 m × 10 m grid cell size of the environmental factors. This high-resolution approach allows for detailed mapping, where each landslide event is represented across multiple adjacent grid cells, reflecting the actual scale and impact of the event. After rasterization, cells affected by landslides are identified and cataloged. This involves a detailed inventory of landslide occurrences marked on the rasterized grid. The ten factors are then layered onto the digitized landslide data. This process creates a comprehensive dataset, extracting information from all layers for each cell. The last step categorizes these cells as either “landslide” or “non-landslide” based on their properties. These factors are depicted in Figure 2.
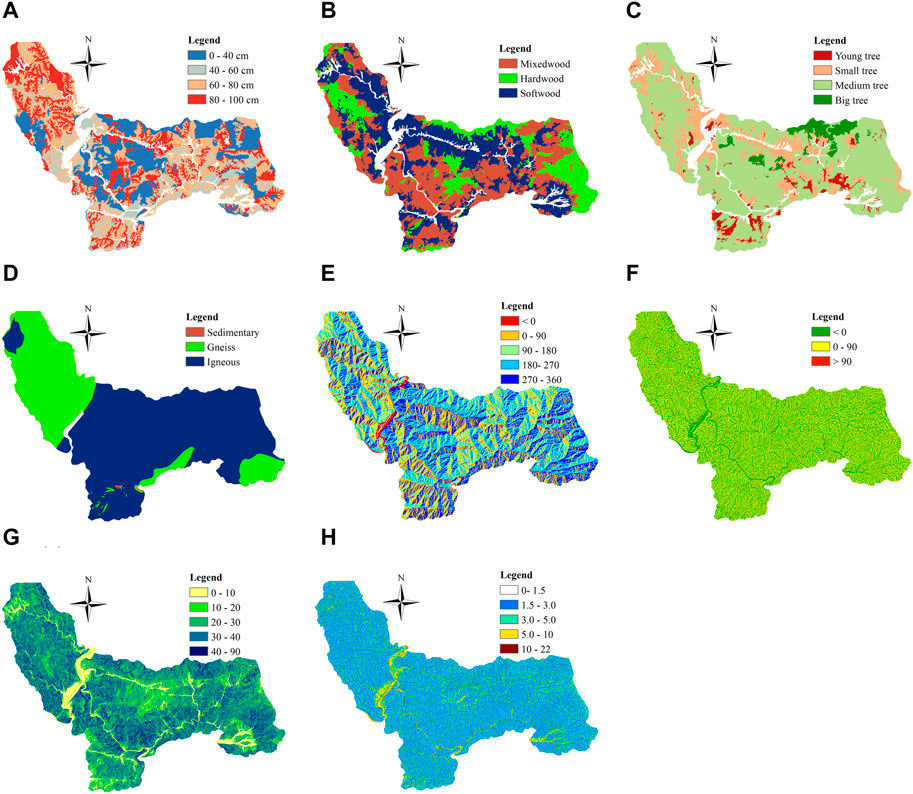
Figure 2. Several variables cause landslides. (A) Soil Depth, (B) Forest Condition, (C) Tree diameter, (D) Bed Rock, (E) Azimuth, (F) Curvature, (G) Slope, (H) TWI.
After the data were processed and analyzed, it revealed that 14,377 grid cells recorded landslide sites, a considerably smaller number than the number of cells that did not record any landslide. This imbalance between the two groups of data is a common issue in practice, which may result in biased techniques that fail to work when applied to the minority group. This is because ML algorithms tend to classify the majority class correctly but ignore the minority class or classify it inaccurately. In order to address this issue and enhance the performance of the ML techniques, we resampled the original data using several methods, like the Tomek Links (Tomek, 1976) and the Near Miss (Zhang and Mani, 2003). The data processing resulted in a final dataset with 28,754 samples (cells), consisting of 14,377 non-landslide samples and 14,377 landslide samples.
The total dataset comprised 28,754 instances, each represented by ten predictive features. These instances are labeled into two classes, indicating the presence (1) or absence (0) of a landslide, which are almost equally distributed. This dataset was partitioned into training and testing subsets with a stratified split of 80% training and 20% testing, resulting in 23,003 instances in the training set and 5,751 in the testing set. Stratification was crucial here to ensure that the class proportions in both subsets accurately mirrored the overall dataset, with approximately equal representation of the two classes (1 and 0) in the testing set (2,876 and 2,875 instances, respectively). This methodological choice is vital for preserving class distribution parity between the training and testing phases, thereby enabling a fair assessment of model performance across both subsets. Before modeling, the feature values were normalized using the MinMaxScaler, ensuring that the feature scaling from 0 to 1 did not introduce bias into the distance computations used in algorithms like KNN and maintained consistency across all models. The models were then trained on the scaled training data and subsequently assessed on the scaled testing data.
2.3 Model selection and tuning
2.3.1 Random Forest
RF is an ensemble algorithm for classification that generates more accurate and robust predictions by integrating the predictions from various decision trees (DTs) (Breiman, 2001). This method is based on creating an ensemble of DTs, and each is constructed using a distinct data sample and a set of input variables selected at random (Tin Kam, 1998). RF produces the final prediction for classification tasks by aggregating the votes given by each DT (see Figure 3A). This approach is powerful, effective, and applicable to various datasets while resisting overfitting. Additionally, RF can handle high-dimensional data and identify non-linear relationships in the data, making it a popular choice for multiple applications.
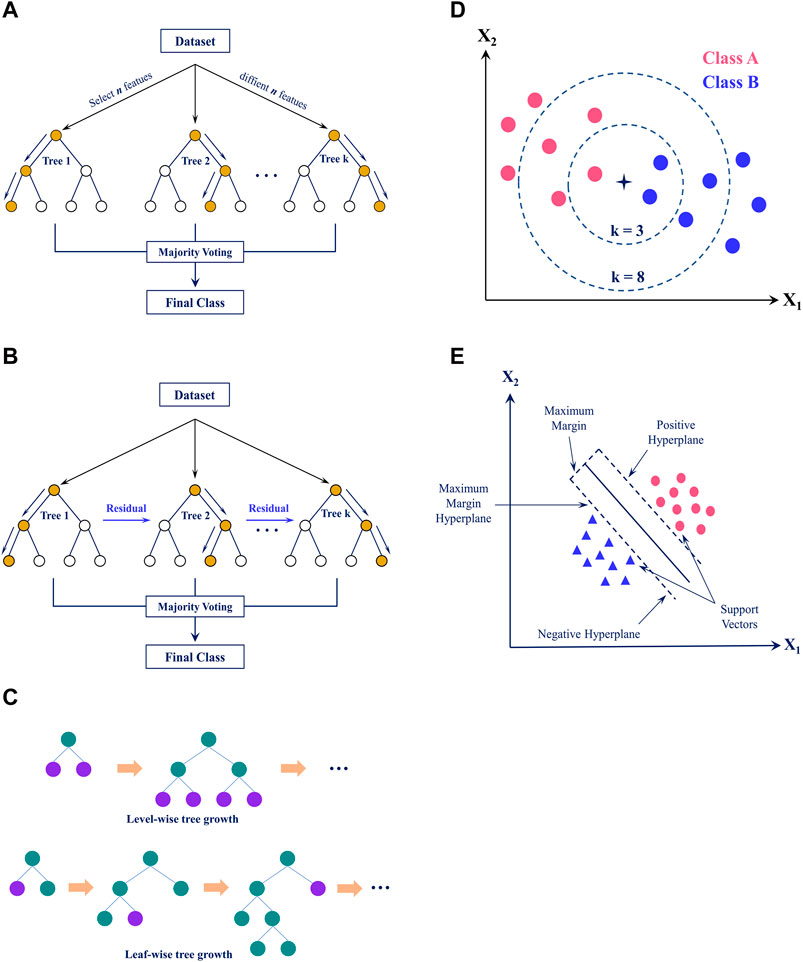
Figure 3. Illustration of five ML algorithms. (A) RF, (B) XGB, (C) LGB, (D) KNN, (E) SVM.
2.3.2 XGB
XGB is a popular gradient-boosting framework that uses DTs as the base model. Its efficiency and scalability suit large, high-dimensional datasets (Chen and Guestrin, 2016). This algorithm incorporates a regularized model formalization to prevent overfitting. It also includes enhancements such as a second-order approximation of the Taylor series of the loss function and weight-based DT pruning (see Figure 3B). These improvements make XGB a powerful tool for various ML tasks, including classification, regression, and ranking. Its ability to handle diverse data types and both categorical and numerical features further adds to its appeal and versatility.
2.3.3 LGB
Similar to the XGB algorithm that employs tree-based learning, LGB is developed to be effective and scalable. It is especially suitable for massive or high-dimensional datasets (Meng et al., 2016). LGB also uses DTs as the base model and builds an ensemble of trees to make predictions. However, LGB introduces several enhancements to the traditional gradient boosting framework, such as using a histogram-based algorithm for faster training and leaf-wise tree growth for better accuracy. LGB applies leaf-wise tree growth in contrast to XGB, which applies level-wise tree growth (Ke et al., 2017) (see Figure 3C). Additionally, LGB can handle categorical features natively and has built-in parallel and GPU computing support. This makes LGB an efficient and powerful tool for various ML tasks, including classification and regression.
2.3.4 KNN
KNN is a classification technique using instance-based learning (Cover and Hart, 1967). The classification of new data is decided based on how similar it is to existing data in the training sample. The algorithm uses the distance metric, such as the Euclidean distance, to determine how far apart the new data point is from each point in the dataset. The K-nearest points are subsequently selected, with K being a user-specified parameter. The group with the highest frequency among the K nearest points is then given the new point (Figure 3D). KNN is a simple approach that is effective across various data. However, when the training data is significant, it may become computationally expensive since the distance between the new point of data and existing points must be calculated. Despite this, KNN remains a popular choice for classification tasks due to its efficiency across diverse input types.
2.3.5 SVM
SVM is a classification technique that tries to identify the optimal decision boundary, or hyperplane, in the feature space for separating classes (Cortes and Vapnik, 1995). It works this by utilizing support vectors, which are data points nearest to the hyperplane, to define the location of the decision boundary (see Figure 3E). SVM produces an evaluation demonstrating the probability of the data falling into one of two classes. Although this algorithm demonstrates versatility and robustness, it may require significant computational resources to process on a large scale.
2.3.6 Hyperparameter tuning using Bayesian optimization
Hyperparameter tuning is one of the crucial processes in developing ML models because it helps to optimize the performance of the algorithms. This procedure aims to identify the most suitable combination of hyperparameters for a given task. This research used Bayesian optimization to tune hyperparameters for five ML models. Bayesian optimization is a probabilistic model-based optimization method that uses Bayesian inference to balance exploration and exploitation in the optimization process (Frazier, 2018). It has been successfully employed to optimize the hyperparameters of five ML algorithms in this study, where the objective was to maximize the classification accuracy of landslide predictions. This method builds a surrogate model, usually a Gaussian Process, to approximate the objective function, which in this case is the accuracy score of a validation set. The surrogate model is updated iteratively as new observations (hyperparameter combinations and their corresponding accuracies) are made.
The Bayesian optimization process involves two main components: the surrogate model and an acquisition function. The surrogate model provides a belief about the objective function (model accuracy) landscape and is updated as new data points are evaluated. The acquisition function guides the selection of the next set of hyperparameters for assessing and balancing exploration of the hyperparameter space (testing new and potentially better regions) and exploitation (refining areas that have shown promise). The probabilistic nature of Bayesian optimization provided a significant advantage in handling the non-linear and non-convex nature of hyperparameter tuning landscapes, ultimately leading to more effective and efficient model tuning compared to grid or random search methods, especially in high-dimensional spaces (Sameen et al., 2020).
In the case of this study, the hyperparameter optimization was conducted separately for each model—KNN, SVM, RF, XGB, and LGB. Each model’s hyperparameters were optimized over specified ranges using the Bayesian optimization framework, which efficiently navigated the high-dimensional space to find optimal settings. The following table (Table 2) presents the details of the optimized hyperparameters for each model:
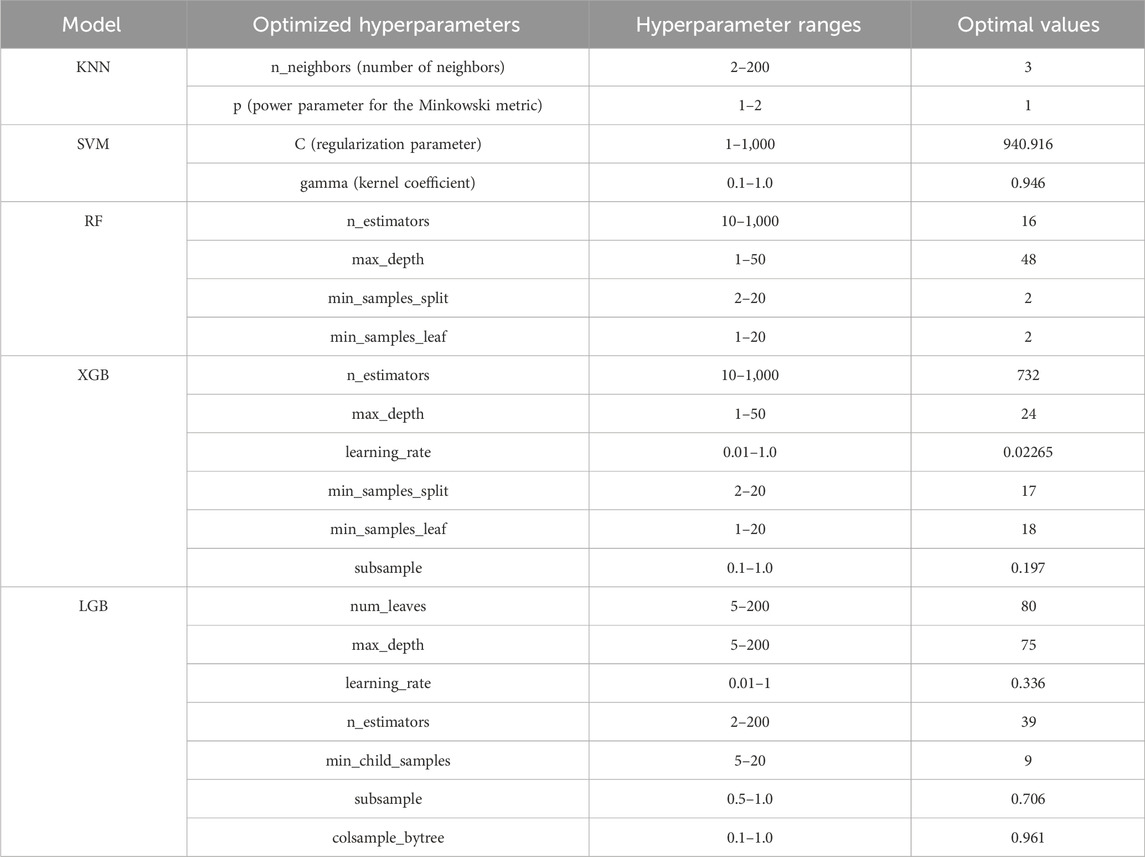
Table 2. Optimized hyperparameters for ML models using Bayesian optimization.
2.4 Bootstrapping and Monte Carlo methods
2.4.1 Bootstrapping method
Bootstrapping is a statistical method that involves generating multiple samples from the original dataset with replacements to estimate the variability of a statistic (Efron and Tibshirani, 1994). This method is commonly used in various ML applications, especially for exploring uncertainty in models sensitive to small training data changes. By analyzing the variability of the predicted results, bootstrapping provides a robust way to evaluate the stability and robustness of the algorithm (Gewerc, 2020). In LSM, bootstrapping can be utilized to estimate the uncertainty in the model predictions by repeatedly sampling the training data and fitting a new model to each sample. For this work, the bootstrapping technique was employed for 1,000 simulations to derive a range of performance metrics and to quantify the overall uncertainty through statistical measures like mean and standard deviation.
2.4.2 Monte Carlo method
The Monte Carlo simulation is a statistical approach for evaluating model uncertainty and sensitivity. This technique generates multiple random simulations from a set of assumptions and analyzes the outputs to understand the variability of the model predictions. The basic idea behind the Monte Carlo method is to simulate the problem of interest using random numbers and then use the results of these simulations to estimate the solution (Brownlee, 2019). This method operates on the assumption that if a sufficient number of random samples are drawn from a given probability distribution, the average of these samples will approach the distribution’s expected value (Guo, 2020). The Monte Carlo simulation is utilized in this work to assess the model uncertainty by generating 1,000 simulations from the input data. This provides a comprehensive understanding of the robustness and stability of the model predictions.
2.5 Evaluation metrics
The assessment measures used for this work include accuracy, Kappa score, and F1 score. Accuracy measures the proportion of correct predictions, while the Kappa score considers the agreement between the forecasts and the actual data. It adjusts for chance agreement and runs from −1 to 1, with 1 indicating an excellent agreement and −1 indicating no agreement beyond chance. The F1 score, on the other hand, is a balance between precision and recall, which measures the model’s capacity to classify positive events while avoiding false positives accurately. These metrics offer a thorough understanding of the model’s effectiveness and are used to compare the results of ML models in LSM. Let TN (true negative), TP (true positive), FN (false negative), and FP (false positive) be the four main components in a confusion matrix. The following is a description of these parameters Eqs 1–3:
Where OA (Observed Agreement) is the proportion of times that the two raters agree on the classifications; EA (Expected Agreement) is the expected agreement between the two raters based on their categories; Precision is the proportion of TP to the total number of TPs and FPs; and Recall is the proportion of TPs to the total number of TPs and FNs.
3 Results and discussion
3.1 Performance of ML algorithms
The effectiveness of ML models in LSM is measured through statistical criteria such as accuracy, Kappa score, and F1 score. These results are listed in Table 3 and visualized in Figures 4, 5.
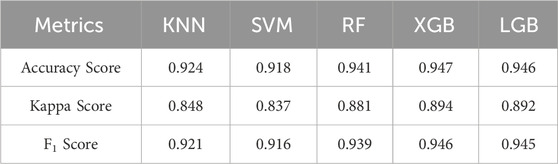
Table 3. Performance statistics of ML algorithms.
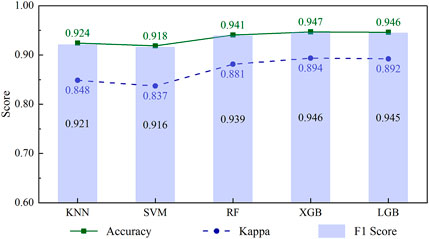
Figure 4. Classification performance of five algorithms.
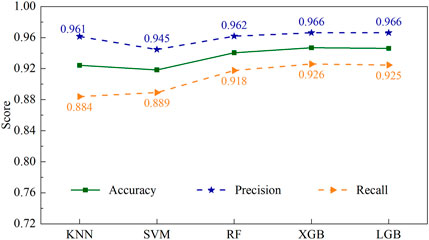
Figure 5. Performance of five algorithms (Precision and Recall values) in terms of landslide class.
From Table 3 and Figure 4, it can be observed that all five algorithms perform well, with accuracy and F1 scores ranging from 0.916 to 0.947, while the Kappa values have a lower range (0.837–0.894). Among algorithms, the highest accuracy value was recorded by XGB and LGB, at 0.947, followed by RF with a score of 0.941. KNN and SVM showed a slightly lower accuracy than the other techniques but were still high at about 0.92. The Kappa score, which measures the agreement between the predictions and the actual observations, depicts that the XGB and LGB algorithms have the highest Kappa score of 0.89, followed by RF with 0.88. The KNN and SVM algorithms have slightly lower values of 0.84. A similar trend is also seen in the case of the F1 score, which is used to evaluate the balance between recall and precision. KNN and SVM exhibit significantly lower performance than the other three models, with values of only about 0.92. XGB, LGB, and RF algorithms demonstrate better effectiveness as their F1 scores are approximately 0.94. The results indicate that all algorithms have high accuracy in classifying landslide events and have a good balance in precision and recall.
Generally, the algorithms used for comparison show their effectiveness, reflected in the reported statistical criteria. The accuracy of all models in classifying landslide risk is higher than 0.92. Besides, it can be seen that tree-based algorithms (XGB, RF, LGB) generally performed better compared to KNN and SVM algorithms. The accuracy score, Kappa score, and F1 score of these models were higher than those of KNN and SVM. Among them, XGB and LGB offer a slight performance advantage over RF; however, the difference in performance is minimal (see Figure 4). This trend suggests that tree-based models may be better suited for classification tasks in this particular scenario. One of the reasons for the improved performance of the tree-based algorithms is their ability to model non-linear relationships and handle missing data more effectively than other algorithms. Additionally, these models often can handle high-dimensional information, making them well-suited for complex datasets.
Figure 5 provides the classification performance of five models in the landslide category. The precision score reflects the algorithm’s ability to correctly recognize the positive cases among all the cases it has labeled as positive. In this case, SVM has the lowest value of 0.945, whereas the remaining models have competitive precision, with values higher than 0.961. A high precision score indicates that the algorithm can accurately identify positive events. In contrast, a low precision score may indicate that the model has a high false positive rate. In addition, the recall score, which measures the algorithm’s ability to identify positives out of all actual positives correctly, exhibits an opposite trend in precision. KNN and SVM have the lower recall scores among the five algorithms. These recall values range from 0.884 for KNN to 0.926 for XGB. A high recall score suggests that the algorithm can capture most positive cases, whereas a low recall score shows that the model has a high false negative rate.
3.2 Comparison of the uncertainty estimates
This study utilized the Monte Carlo and Bootstrapping techniques to estimate statistical values (mean and standard deviation) to measure the uncertainty of five ML algorithms used in LSM. After producing 1,000 predictions for the testing dataset, equivalent to performing 1,000 samplings on the training set for each method, the outcomes are detailed in Table 4 and Figure 6.
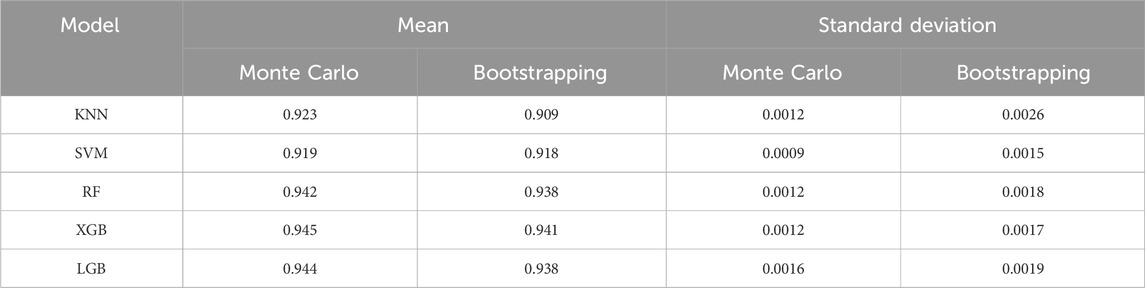
Table 4. Performance statistics of uncertainty estimate methods for accuracy metric.
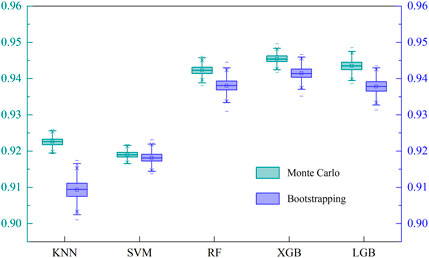
Figure 6. Box plots of methods for estimating the uncertainty of algorithms.
Table 4 presents the performance statistics of five ML algorithms in estimating the uncertainty of LSM using both Monte Carlo and Bootstrapping methods. The results indicate that all five algorithms achieved high mean accuracy scores, ranging from 0.909 to 0.945 for both ways. Specifically, XGB presented the highest mean accuracy of 0.945, followed closely by LGB at 0.944 and RF at 0.942. The KNN and SVM models displayed mean accuracy scores of 0.923 and 0.919, respectively. All the algorithms exhibited relatively low values for the standard deviation, suggesting a limited level of variance in their performance. In particular, SVM had the lowest standard deviation among the five algorithms, standing at 0.0009 for the Monte Carlo method and 0.0015 for the Bootstrapping method. This reflects SVM’s ability to yield more consistent results than the other models. In contrast, KNN presented the highest standard deviation values of 0.0026 for the Bootstrapping method and 0.0012 for the Monte Carlo simulation.
Comparing the results between the two uncertainty estimation methods, it’s evident that the mean accuracy scores produced by the Monte Carlo method are slightly superior for most of the algorithms. Regarding standard deviation, the Monte Carlo method consistently returned lower values than the Bootstrapping method. This indicates that the Monte Carlo simulation might be more adept at producing precise and consistent uncertainty estimates than Bootstrapping. The distinctions between the two methods are further illustrated in Figure 6, where box plots display the statistical data and the distribution of the uncertainty estimations.
In a broader context, although both the Monte Carlo and Bootstrapping methods are utilized for uncertainty analysis, their fundamental mechanisms differ. The Monte Carlo approach relies on random sampling from a defined distribution to generate outputs, whereas Bootstrapping involves resampling directly from the dataset. In terms of consistency and accuracy, the slight edge of the Monte Carlo method in this study may underline its suitability for estimating the uncertainty in LSM.
3.3 Sensitivity analysis
In order to offer a thorough perspective of the importance of predictors and examine their influence on model performance, this study performed a sensitivity analysis of these variables. The importance of predictors is quantified by shuffling their values and observing the impact on model accuracy. This technique is referred to as important for permutation features. The results quantifying the effect of ten input variables for ML algorithms are summarized in Table 5 and Figure 7.
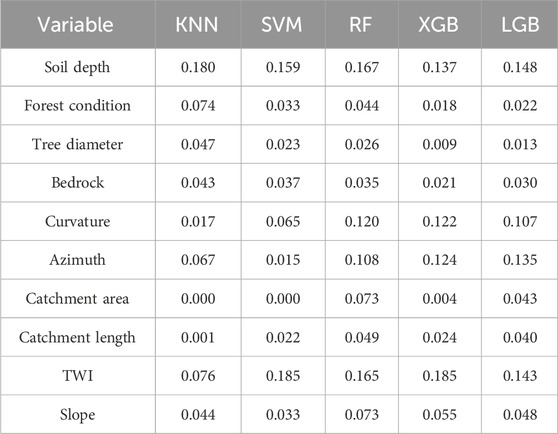
Table 5. The importance of predictors in ML models.
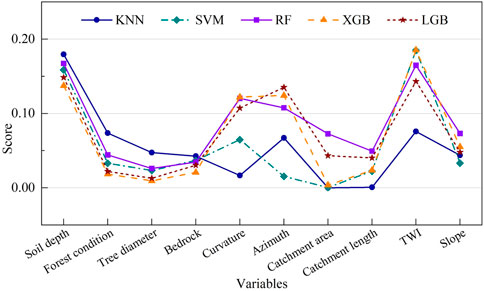
Figure 7. Variable importance of five algorithms.
The numbers in Table 5 and Figure 7 represent the average feature importance calculated from the models during training. The results show that the predictor variables play different roles in each ML algorithm. Soil depth is the most important predictor for algorithms except for SVM and XGB. In the SVM algorithm, Soil depth has a relatively high importance score of 0.159 compared to the other predictors. Meanwhile, in the XGB model, Soil depth ranks second in importance, scoring 0.137. The corresponding values for the KNN, RF, and LGB algorithms are 0.180, 0.167, and 0.148, respectively. Similar to Soil depth, TWI is also a crucial variable that contributes to the effectiveness of ML models. Its importance ranked first among the SVM and XGB algorithms with a value of 0.185 and second in the remaining algorithms (KNN, RF, and LGB) with values ranging from 0.076 to 0.015.
Other variables such as Forest condition, Tree diameter, Bedrock, and Slope also play essential roles in the models, but their importance levels vary. A similar trend can be seen in the case of Curvature and Azimuth, where these predictors contribute significantly to the accuracy of tree-based algorithms compared to KNN and SVM. Both Catchment area and Catchment length have relatively low importance in all algorithms, which suggests that they might not be critical factors in this study area.
A notable discrepancy is observed in the importance assigned to Curvature, particularly in the KNN model. Curvature, which contributes significantly to the accuracy of tree-based algorithms like RF, XGB, and LGB, has a lower impact in the KNN model, scoring only 0.017. This divergence in importance can be attributed to the intrinsic operational differences between the algorithms. KNN’s methodology, which relies on proximity in feature space, does not inherently model complex interactions between features as effectively as tree-based models. Instead, KNN treats distances uniformly across all dimensions unless explicitly weighted, possibly underplaying Curvature’s predictive power, which is sensitive to local changes in topography. In addition, KNN’s performance may be particularly sensitive to the choice of distance metric and the scale of features, which can result in lesser emphasis on curvature if it varies smoothly compared to more abrupt changes in other features.
The experimental results generally reveal that different ML models have varying degrees of sensitivity to various variables. Despite this, several parameters such as Soil depth, TWI, Curvature, and Azimuth have a more pronounced influence on the models, especially tree-based models such as RF, XGB, and LGB. As a result, it is essential to consider various algorithms to obtain an in-depth comprehension of the impact that predictors have on the likelihood of a landslide happening.
3.4 Interpretability of ML models
In addition to the importance of the permutation feature, the interpretability of the ML models was further explored by examining the SHAP values. SHAP values provide a robust framework for interpreting predictions of ML algorithms. They quantify the extent to which each feature contributes to the prediction of a given sample. The impact of features interpreted by SHAP values for each ML algorithm is illustrated in Figure 8 (cases a-e).
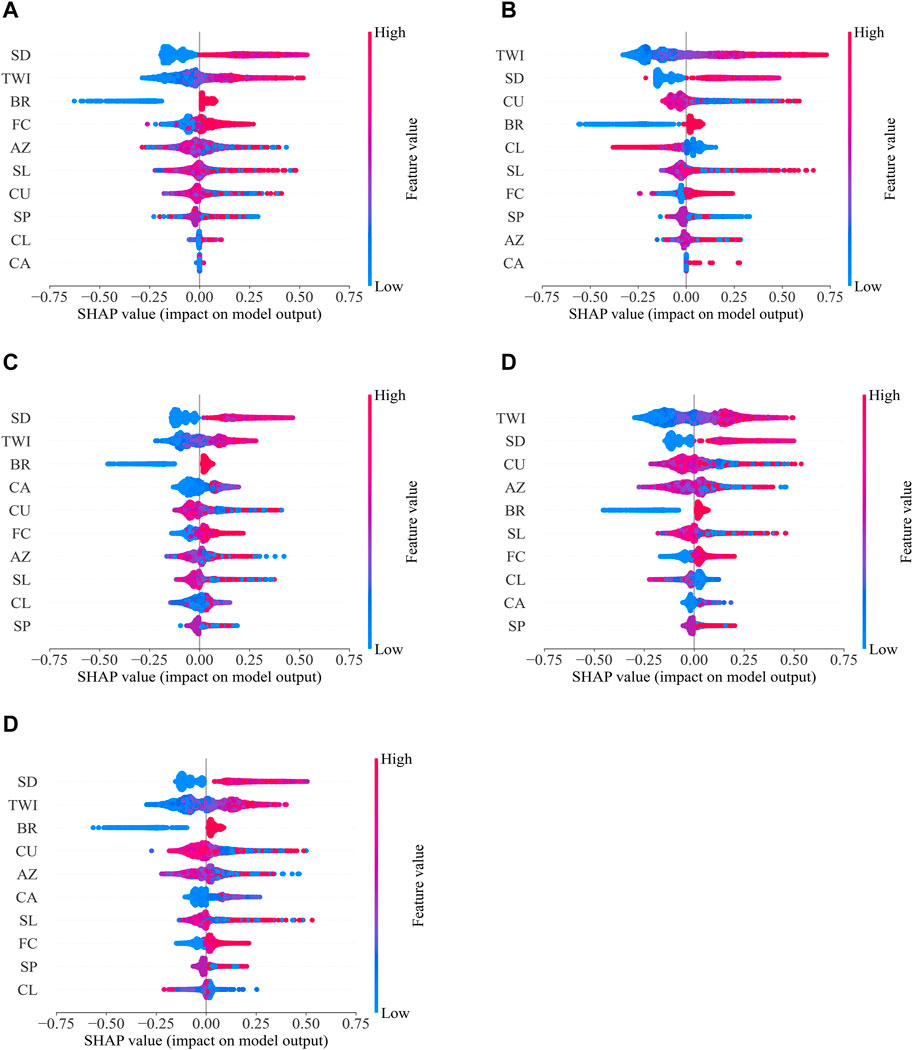
Figure 8. SHAP summary plots for ML algorithms. Features positioned higher on the y-axis will have a more significant influence on the model output. Positive SHAP values, extending to the right, indicate a positive correlation with the model’s prediction likelihood. (A) KNN, (B) SVM, (C) RF, (D) XGB, (E) LGB.
From Figure 8, the distribution range for each feature’s SHAP values reflects the diversity of its impact, with wider spreads indicating more significant variability in influencing the model outcomes. In addition to the findings presented in Subsection 3.3, SHAP values corroborated the considerable influence of specific predictors, such as Soil depth and TWI, across different ML algorithms. However, unlike the average impact scores obtained previously, SHAP values present more nuanced information, revealing the variability and distribution of feature impacts for each prediction. For instance, while Soil depth consistently appeared to be a leading factor in both analyses, SHAP plots uncovered its varying levels of influence across different cases within the models, highlighting its pivotal role in model decisions. Similarly, for features like Curvature and Azimuth, the SHAP plots provided additional insights into their contribution, which were not fully captured by the permutation feature importance scores, especially in their interaction with other variables.
Moreover, the SHAP analysis offered a fresh perspective on the relative importance of features that permutation importance had deemed less influential. Catchment area and C. length, which appeared to have a lesser role in the sensitivity analysis, exhibited instances of higher impact within specific models when observed through the SHAP value plots. In the case of tree-based algorithms such as RF, XGB, and LGB, SHAP values emphasize the non-linear and complex interactions of features in the models, consistent with the observed trends in the importance of permutation.
The detailed analysis through SHAP values not only models understanding but also strengthens confidence in model predictions by shedding light on their reasoning. It also emphasizes the multifaceted nature of model interpretability, where each algorithm uniquely navigates the feature space. It also accentuates the multi-dimensional nature of model interpretability, where each algorithm uniquely navigates the feature space. Therefore, an in-depth and systematic approach is needed to evaluate the model in LSM.
3.5 Assessment of individual predictors on ML models
Building upon the previous analyses, the study explored the intricate dynamics of how individual predictors modulate the performance of five distinct ML algorithms using two independent evaluation methods. The first method involved training ML models with various combinations of predictors, ranging from a single variable to all ten, and using Bayesian optimization to fine-tune the parameters. The comparative Kappa scores for each model are presented in Figure 9. The second method systematically excluded one predictor at a time, retraining and optimizing the models with the remaining variables, with findings summarized in Figure 10. These figures display the Kappa scores, providing insights into the variable significance across different algorithms.
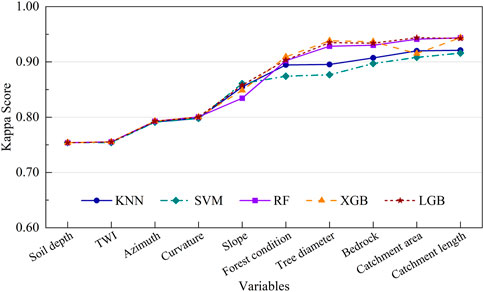
Figure 9. Kappa score analysis across models with individual predictors included. This figure depicts the change in ML model performance when the number of variables is added sequentially from left to right, varying from 1 to 10.
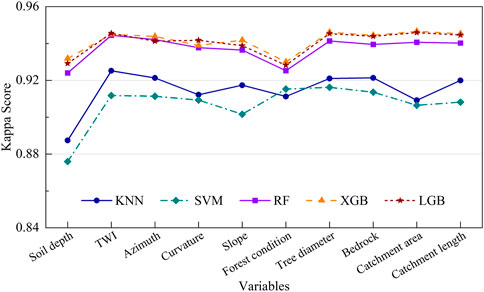
Figure 10. Comparative Kappa scores with individual predictor exclusion in models. This figure evaluates the particular influence of each feature on the model’s overall performance when absent. A low Kappa score means the absent variable has a significant effect and vice versa.
Figure 9 illustrates the Kappa scores obtained when different predictors are added sequentially, offering insights into how the inclusion of each variable enhances model performance. Initially, the Kappa scores for all models were identical when only the Soil depth predictor was included, each scoring 0.754. Adding TWI had a negligible effect, marginally increasing the scores to 0.755. The inclusion of Azimuth and Curvature predictors resulted in a notable increase in Kappa scores across all models, with values reaching approximately 0.793 and 0.801, respectively.
A significant performance leap was observed with the addition of the Slope predictor, where the Kappa scores for KNN and SVM increased to 0.855 and 0.861, respectively, while the RF, XGB, and LGB models showed scores around 0.848 to 0.858. Forest condition further enhanced the Kappa scores, particularly for XGB and RF models, reaching 0.909 and 0.902, respectively. The inclusion of Tree diameter and Bedrock maintained this upward trend, with XGB achieving a high score of 0.938.
However, the inclusion of the C. area predictor caused a notable deviation. While KNN, SVM, RF, and LGB models continued to show improvement or stable Kappa scores, XGB’s Kappa score decreased significantly from 0.938 to 0.915. This decrease can be attributed to the potential multicollinearity or redundancy introduced by the C. area variable, which may have disrupted the interaction effects captured by the XGB model. Such sensitivity to specific variables underscores the complexity of the gradient boosting framework, which constructs additive trees in a sequential manner and can be prone to overfitting with less relevant predictors.
Figure 10 provides an intriguing reverse analysis, demonstrating the impact of the absence of each predictor on the model’s Kappa score. This means the number of predictors in this case is nine compared to the ten predictors considered in our study. When Soil depth was excluded, the Kappa scores remained relatively high across all models, indicating its lesser individual impact than other predictors. The exclusion of TWI and Azimuth showed minimal effects on the overall performance, maintaining high Kappa scores around 0.945 for XGB and LGB models.
Conversely, the exclusion of Slope and F. condition resulted in a more noticeable drop in Kappa scores, especially for the KNN and SVM models. Excluding Tree diameter and Bedrock, which had varying impacts, the XGB model consistently retained high Kappa scores, demonstrating its robustness and ability to leverage remaining predictors effectively.
The most significant observation was the inclusion and exclusion of C. area and C. length. While the inclusion of these predictors adversely affected the XGB model in Figure 9, their exclusion in Figure 10 did not significantly reduce the Kappa scores, suggesting that these variables might introduce noise or redundancy rather than valuable information. This emphasizes the need for careful predictor selection and the potential benefits of feature engineering in optimizing model performance.
The detailed analysis of Figures 9, 10 enhances the understanding of the individual and collective impact of predictors on LSM. It underscores the importance of adopting a holistic view that considers both the inclusion and exclusion of variables, thereby enhancing the robustness and interpretability of ML models. In addition, these findings provide a comprehensive view of the roles that different predictors play in LSM.
3.6 Discussion
The efficacy of ML algorithms in LSM documented in this study confirms the robustness of tree-based methods, particularly RF, LGB, and XGB, over KNN and SVM. This reflects a broader consensus in the field where tree-based algorithms are favored for their capacity to handle complex, non-linear relationships within large-scale geospatial datasets (Kalantar et al., 2020; Merghadi et al., 2020; Solanki et al., 2022).
Incorporating high-resolution data in this research provides a significant advantage over previously utilized lower-resolution datasets in South Korea, leading to more precise delineation of at-risk areas (Panahi et al., 2020). The heightened detail available through high-resolution data enhances the ability of ML models to capture subtle variations in topography and environmental conditions that are crucial for accurate LSM (Lee et al., 2004; Gaidzik and Ramírez-Herrera, 2021).
This study’s integration of quantitative uncertainty assessments using Monte Carlo and Bootstrapping methods contributes to the growing discourse on the need for robust uncertainty quantification in environmental modeling (Nguyen et al., 2021). The consistency and reduced variability in uncertainty estimates achieved through the Monte Carlo simulations particularly enhance the reliability of the LSM results, corroborating the findings from Hien et al. (2024) on the method’s effectiveness in environmental applications. This robust uncertainty quantification is essential for building trust in predictive models and can significantly influence policy decisions related to disaster risk management.
The sensitivity analysis and the assessment of individual predictors reveal that Soil depth and TWI are pivotal in influencing model outputs across all algorithms. These findings resonate with global studies emphasizing the significant role these factors play in determining landslide susceptibility (Nsengiyumva et al., 2019; Chen and Li, 2020). Furthermore, the exploration of predictor importance through both inclusion and exclusion approaches underscores the nuanced contribution of each variable to model performance. For instance, the removal of predictors like C. area and C. length demonstrated their relative dispensability in specific models, which contrasts with their perceived importance in traditional sensitivity analyses. This insight is crucial for optimizing data collection efforts, especially in resource-limited settings where comprehensive data acquisition may not be feasible.
Moreover, the application of SHAP values for interpretative analysis provided a sophisticated tool for understanding the complex dependency patterns between predictors and model outcomes, as suggested by Lundberg and Lee (2017). This technique revealed how features like Curvature and Azimuth impact models differently, offering insights not fully captured by traditional importance scores. These findings echo the necessity for advanced interpretative techniques in LSM, as demonstrated by the complex interdependencies detailed in the model evaluations.
Future studies should consider integrating additional predictive variables, such as soil moisture and land use, which have been identified in recent research as potentially significant in enhancing the accuracy of LSM (Gorsevski et al., 2006; Juliev et al., 2019). Moreover, the exploration of newer ML algorithms and more sophisticated uncertainty quantification methods could further refine the predictive capabilities and reliability of LSM models.
4 Conclusion
This paper systematically compared the performance of five ML algorithms in landslide susceptibility mapping (LSM), demonstrating that tree-based algorithms (XGB, RF, and LGB) outperform KNN and SVM in classification tasks. Tree-based models effectively handle multi-dimensional data and non-linear relationships, making them well-suited for the complex datasets typical of landslide studies.
In addition, this study also evaluated and analyzed the uncertainty of ML algorithms using Monte Carlo and Bootstrapping methods. The Monte Carlo has higher mean accuracy values and a lower standard deviation than the Bootstrapping method. This means the Monte Carlo technique is more stable in estimating the uncertainty of ML models for this study.
Sensitivity analysis and SHAP value interpretations identified key predictors such as Soil depth and TWI as fundamental to accurate landslide prediction. The analysis also highlighted the potential for optimizing models by excluding less influential predictors like Catchment area and C. length, thereby improving model efficiency without significant loss of accuracy.
These findings are significant for advancing LSM methodologies and environmental informatics by providing a framework for integrating high-resolution data and robust uncertainty quantification techniques. The comprehensive approach to model construction and predictor selection emphasized in this study can guide future research efforts, leading to more precise and actionable insights.
This work only exploited a limited number of factors commonly used in LSM. Several other factors can affect landslide susceptibility, such as soil moisture or land use, which have not been considered. Therefore, using more extensive predictor variables in future studies may lead to more accurate predictions.
Data availability statement
The original contributions presented in the study are included in the article/Supplementary Material, further inquiries can be directed to the corresponding authors.
Author contributions
X-HL: Formal Analysis, Writing–original draft, Writing–review and editing. CC: Data curation, Formal Analysis, Writing–original draft. SE: Data curation, Writing–review and editing. MY: Formal Analysis, Writing–original draft. GL: Supervision, Writing–review and editing.
Funding
The author(s) declare that financial support was received for the research, authorship, and/or publication of this article. This research was supported by the Disaster-Safety Platform Technology Development Program of the National Research Foundation of Korea (NRF) funded by the Ministry of Science and ICT (No. 2022M3D7A1090338).
Conflict of interest
The authors declare that the research was conducted in the absence of any commercial or financial relationships that could be construed as a potential conflict of interest.
Publisher’s note
All claims expressed in this article are solely those of the authors and do not necessarily represent those of their affiliated organizations, or those of the publisher, the editors and the reviewers. Any product that may be evaluated in this article, or claim that may be made by its manufacturer, is not guaranteed or endorsed by the publisher.
References
Abdar, M., Pourpanah, F., Hussain, S., Rezazadegan, D., Liu, L., Ghavamzadeh, M., et al. (2021). A review of uncertainty quantification in deep learning: techniques, applications and challenges. Inf. Fusion 76, 243–297. doi:10.1016/j.inffus.2021.05.008
Abella, E. A. C., and Westen, C. J. V. (2008). Qualitative landslide susceptibility assessment by multicriteria analysis: A case study from San Antonio del Sur, Guantánamo, Cuba. Geomorphology 94 (3), 453–466. doi:10.1016/j.geomorph.2006.10.038
Aditian, A., Kubota, T., and Shinohara, Y. (2018). Comparison of GIS-based landslide susceptibility models using frequency ratio, logistic regression, and artificial neural network in a tertiary region of Ambon, Indonesia. Geomorphology 318, 101–111. doi:10.1016/j.geomorph.2018.06.006
Ado, M., Amitab, K., Maji, A. K., Jasińska, E., Gono, R., Leonowicz, Z., et al. (2022). Landslide susceptibility mapping using machine learning: a literature survey. Remote Sens. 14 (13), 3029. doi:10.3390/rs14133029
Akinci, H., and Zeybek, M. (2021). Comparing classical statistic and machine learning models in landslide susceptibility mapping in Ardanuc (Artvin), Turkey. Nat. Hazards 108 (2), 1515–1543. doi:10.1007/s11069-021-04743-4
Ayalew, L., and Yamagishi, H. (2005). The application of GIS-based logistic regression for landslide susceptibility mapping in the Kakuda-Yahiko Mountains, Central Japan. Geomorphology 65 (1), 15–31. doi:10.1016/j.geomorph.2004.06.010
Brownlee, J. (2019). A gentle introduction to Monte Carlo sampling for probability. Available at: https://machinelearningmastery.com/monte-carlo-sampling-for-probability (Accessed September 9, 2023).
Bui, D. T., Tsangaratos, P., Nguyen, V.-T., Liem, N. V., and Trinh, P. T. (2020). Comparing the prediction performance of a Deep Learning Neural Network model with conventional machine learning models in landslide susceptibility assessment. CATENA 188, 104426. doi:10.1016/j.catena.2019.104426
Chen, T., and Guestrin, C. (2016). “XGBoost: a scalable tree boosting system,” in The 22nd ACM SIGKDD International Conference on Knowledge Discovery and Data Mining (San Francisco, California, USA: Association for Computing Machinery).
Chen, W., and Li, Y. (2020). GIS-based evaluation of landslide susceptibility using hybrid computational intelligence models. CATENA 195, 104777. doi:10.1016/j.catena.2020.104777
Cortes, C., and Vapnik, V. (1995). Support-vector networks. Mach. Learn. 20 (3), 273–297. doi:10.1007/BF00994018
Cover, T., and Hart, P. (1967). Nearest neighbor pattern classification. IEEE Trans. Inf. Theory 13 (1), 21–27. doi:10.1109/TIT.1967.1053964
Dao, D. V., Jaafari, A., Bayat, M., Mafi-Gholami, D., Qi, C., Moayedi, H., et al. (2020). A spatially explicit deep learning neural network model for the prediction of landslide susceptibility. CATENA 188, 104451. doi:10.1016/j.catena.2019.104451
Fang, Z., Wang, Y., Niu, R., and Peng, L. (2021). Landslide susceptibility prediction based on positive unlabeled learning coupled with adaptive sampling. IEEE J. Sel. Top. Appl. Earth Observations Remote Sens. 14, 11581–11592. doi:10.1109/JSTARS.2021.3125741
Gaidzik, K., and Ramírez-Herrera, M. T. (2021). The importance of input data on landslide susceptibility mapping. Sci. Rep. 11 (1), 19334. doi:10.1038/s41598-021-98830-y
Gewerc, A. (2020). Bootstrap to quantify uncertainty. Available at: http://www.alangewerc.com/blog/Bootstrap-to-Quantify-Uncertainty (Accessed December 22, 2022).
Ghasemian, B., Shahabi, H., Shirzadi, A., Al-Ansari, N., Jaafari, A., Geertsema, M., et al. (2022). Application of a novel hybrid machine learning algorithm in shallow landslide susceptibility mapping in a mountainous area. Front. Environ. Sci. 10. doi:10.3389/fenvs.2022.897254
Gorsevski, P. V., Gessler, P. E., Boll, J., Elliot, W. J., and Foltz, R. B. (2006). Spatially and temporally distributed modeling of landslide susceptibility. Geomorphology 80 (3), 178–198. doi:10.1016/j.geomorph.2006.02.011
Grana, D., Azevedo, L., and Liu, M. (2020). A comparison of deep machine learning and Monte Carlo methods for facies classification from seismic data. GEOPHYSICS 85 (4), WA41–WA52. doi:10.1190/geo2019-0405.1
Guo, S. (2020). Using Monte Carlo to quantify the model prediction error. Available at: https://towardsdatascience.com/how-to-quantify-the-prediction-error-made-by-my-model-db4705910173 (Accessed September 9, 2023).
Hamedi, H., Alesheikh, A. A., Panahi, M., and Lee, S. (2022). Landslide susceptibility mapping using deep learning models in Ardabil province, Iran. Stoch. Environ. Res. Risk Assess. 36 (12), 4287–4310. doi:10.1007/s00477-022-02263-6
Han, J., Chen, H., and Cao, Y. (2011). “Uncertainty evaluation using Monte Carlo method with MATLAB,” in IEEE 2011 10th International Conference on Electronic Measurement & Instruments, Chengdu, China, October 16–19, 2011 (IEEE), 282–286.
Hien, L. X., Hien, L. T. T., Ho, H. V., and Lee, G. (2024). Benchmarking the performance and uncertainty of machine learning models in estimating scour depth at sluice outlets. J. Hydroinformatics, jh2024297. doi:10.2166/hydro.2024.297
Hien, L. X., Nguyen, D. H., Jung, S., and Lee, G. (2023). Deep neural network-based discharge prediction for upstream hydrological stations: a comparative study. Earth Sci. Inf. 16, 3113–3124. doi:10.1007/s12145-023-01082-9
Hoa, P. V., Tuan, N. Q., Hong, P. V., Thao, G. T. P., and Binh, N. A. (2023). GIS-based modeling of landslide susceptibility zonation by integrating the frequency ratio and objective–subjective weighting approach: a case study in a tropical monsoon climate region. Front. Environ. Sci. 11. doi:10.3389/fenvs.2023.1175567
Huang, F., Li, R., Catani, F., Zhou, X., Zeng, Z., and Huang, J. (2024a). Uncertainties in landslide susceptibility prediction: influence rule of different levels of errors in landslide spatial position. J. Rock Mech. Geotechnical Eng. doi:10.1016/j.jrmge.2024.02.001
Huang, F., Xiong, H., Jiang, S.-H., Yao, C., Fan, X., Catani, F., et al. (2024b). Modelling landslide susceptibility prediction: a review and construction of semi-supervised imbalanced theory. Earth-Science Rev. 250, 104700. doi:10.1016/j.earscirev.2024.104700
Huang, F., Yan, J., Fan, X., Yao, C., Huang, J., Chen, W., et al. (2022). Uncertainty pattern in landslide susceptibility prediction modelling: effects of different landslide boundaries and spatial shape expressions. Geosci. Front. 13 (2), 101317. doi:10.1016/j.gsf.2021.101317
Islam, F., Riaz, S., Ghaffar, B., Tariq, A., Shah, S. U., Nawaz, M., et al. (2022). Landslide susceptibility mapping (LSM) of Swat District, Hindu Kush Himalayan region of Pakistan, using GIS-based bivariate modeling. Front. Environ. Sci. 10. doi:10.3389/fenvs.2022.1027423
James, G., Witten, D., Hastie, T., and Tibshirani, R. (2013). An introduction to statistical learning: with applications in R. Springer.
Jiang, S.-H., and Huang, J. (2018). Modeling of non-stationary random field of undrained shear strength of soil for slope reliability analysis. Soils Found. 58 (1), 185–198. doi:10.1016/j.sandf.2017.11.006
Jiang, S.-H., and Huang, J.-S. (2016). Efficient slope reliability analysis at low-probability levels in spatially variable soils. Comput. Geotechnics 75, 18–27. doi:10.1016/j.compgeo.2016.01.016
Juliev, M., Mergili, M., Mondal, I., Nurtaev, B., Pulatov, A., and Hübl, J. (2019). Comparative analysis of statistical methods for landslide susceptibility mapping in the Bostanlik District, Uzbekistan. Sci. Total Environ. 653, 801–814. doi:10.1016/j.scitotenv.2018.10.431
Kadavi, P. R., Lee, C.-W., and Lee, S. (2019). Landslide-susceptibility mapping in Gangwon-do, South Korea, using logistic regression and decision tree models. Environ. Earth Sci. 78 (4), 116. doi:10.1007/s12665-019-8119-1
Kalantar, B., Ueda, N., Saeidi, V., Ahmadi, K., Halin, A. A., and Shabani, F. (2020). Landslide susceptibility mapping: machine and ensemble learning based on remote sensing big data. Remote Sens. 12 (11), 1737. doi:10.3390/rs12111737
Ke, G., Meng, Q., Finley, T., Wang, T., Chen, W., Ma, W., et al. (2017). “LightGBM: a highly efficient gradient boosting decision tree,” in The 31st International Conference on Neural Information Processing Systems (Long Beach, California, USA: Curran Associates Inc.).
Khalil, U., Imtiaz, I., Aslam, B., Ullah, I., Tariq, A., and Qin, S. (2022). Comparative analysis of machine learning and multi-criteria decision making techniques for landslide susceptibility mapping of Muzaffarabad district. Front. Environ. Sci. 10. doi:10.3389/fenvs.2022.1028373
Korea Forest Service (2021). Landslide information system. Available at: https://sansatai.forest.go.kr/gis/main.do (Accessed February 22, 2023).
Le, X. H., Eu, S., Choi, C., Nguyen, D. H., Yeon, M., and Lee, G. (2023). Machine learning for high-resolution landslide susceptibility mapping: case study in Inje County, South Korea. Front. Earth Sci. 11. doi:10.3389/feart.2023.1268501
Le, X.-H., and Le, T. T. H. (2024). Predicting maximum scour depth at sluice outlet: a comparative study of machine learning models and empirical equations. Environ. Res. Commun. 6 (1), 015010. doi:10.1088/2515-7620/ad1f94
Lee, C., Woo, C., Kim, D., Seo, J., Kwon, H., and Yun, H. (2015a). Development of landslide disaster prevention system in urban living area. Natl. Inst. For. Sci. South Korea.
Lee, C.-J., Park, E.-S., and Yoo, N.-J. (2009). A study on disaster and recovery of landslides at Inje province in Korea. J. Industrial Technol. 29 (A), 9–17.
Lee, G., Le, X. H., Yeon, M., Seo, J., and Lee, C. (2021). Classification of soil creep hazard class using machine learning. J. Korean Soc. Disaster Secur. 14 (3), 17–27. doi:10.21729/ksds.2021.14.3.17
Lee, M. J., Park, I., Won, J. S., and Lee, S. (2016). Landslide hazard mapping considering rainfall probability in Inje, Korea. Geomatics, Nat. Hazards Risk 7 (1), 424–446. doi:10.1080/19475705.2014.931307
Lee, S., Choi, J., and Woo, I. (2004). The effect of spatial resolution on the accuracy of landslide susceptibility mapping: a case study in Boun, Korea. Geosciences J. 8 (1), 51–60. doi:10.1007/BF02910278
Lee, S., Won, J.-S., Jeon, S. W., Park, I., and Lee, M. J. (2015b). Spatial landslide hazard prediction using rainfall probability and a logistic regression model. Math. Geosci. 47 (5), 565–589. doi:10.1007/s11004-014-9560-z
Liang, Z., Wang, C., Duan, Z., Liu, H., Liu, X., and Ullah Jan Khan, K. (2021). A hybrid model consisting of supervised and unsupervised learning for landslide susceptibility mapping. Remote Sens. 13 (8), 1464. doi:10.3390/rs13081464
Liu, M., Liu, J., Xu, S., Chen, C., Bao, S., Wang, Z., et al. (2023a). 3DCNN landslide susceptibility considering spatial-factor features. Front. Environ. Sci. 11. doi:10.3389/fenvs.2023.1177891
Liu, S., Wang, L., Zhang, W., He, Y., and Pijush, S. (2023b). A comprehensive review of machine learning-based methods in landslide susceptibility mapping. Geol. J. 58 (6), 2283–2301. doi:10.1002/gj.4666
Lundberg, S. M., and Lee, S.-I. (2017). “A unified approach to interpreting model predictions,” in The 31st International Conference on Neural Information Processing Systems (NIPS 2017) (Long Beach, California, USA: Curran Associates Inc.).
Maes, J., Kervyn, M., de Hontheim, A., Dewitte, O., Jacobs, L., Mertens, K., et al. (2017). Landslide risk reduction measures: a review of practices and challenges for the tropics. Prog. Phys. Geogr. Earth Environ. 41 (2), 191–221. doi:10.1177/0309133316689344
Meng, Q., Ke, G., Wang, T., Chen, W., Ye, Q., Ma, Z.-M., et al. (2016). A communication-efficient parallel algorithm for decision tree. arXiv. doi:10.48550/arXiv.1611.01276
Merghadi, A., Yunus, A. P., Dou, J., Whiteley, J., ThaiPham, B., Bui, D. T., et al. (2020). Machine learning methods for landslide susceptibility studies: a comparative overview of algorithm performance. Earth-Science Rev. 207, 103225. doi:10.1016/j.earscirev.2020.103225
Mohammadifar, A., Gholami, H., and Golzari, S. (2022). Assessment of the uncertainty and interpretability of deep learning models for mapping soil salinity using DeepQuantreg and game theory. Sci. Rep. 12 (1), 15167. doi:10.1038/s41598-022-19357-4
Nguyen, D., Sadeghnejad Barkousaraie, A., Bohara, G., Balagopal, A., McBeth, R., Lin, M.-H., et al. (2021). A comparison of Monte Carlo dropout and bootstrap aggregation on the performance and uncertainty estimation in radiation therapy dose prediction with deep learning neural networks. Phys. Med. Biol. 66 (5), 054002. doi:10.1088/1361-6560/abe04f
Nguyen, G. V., Le, X. H., Nguyen Van, L., May, D. T. T., Jung, S., and Lee, G. (2023). Machine learning approaches for reconstructing gridded precipitation based on multiple source products. J. Hydrology Regional Stud. 48, 101475. doi:10.1016/j.ejrh.2023.101475
Nsengiyumva, J. B., Luo, G., Amanambu, A. C., Mind’je, R., Habiyaremye, G., Karamage, F., et al. (2019). Comparing probabilistic and statistical methods in landslide susceptibility modeling in Rwanda/Centre-Eastern Africa. Sci. Total Environ. 659, 1457–1472. doi:10.1016/j.scitotenv.2018.12.248
Panahi, M., Gayen, A., Pourghasemi, H. R., Rezaie, F., and Lee, S. (2020). Spatial prediction of landslide susceptibility using hybrid support vector regression (SVR) and the adaptive neuro-fuzzy inference system (ANFIS) with various metaheuristic algorithms. Sci. Total Environ. 741, 139937. doi:10.1016/j.scitotenv.2020.139937
Pardeshi, S. D., Autade, S. E., and Pardeshi, S. S. (2013). Landslide hazard assessment: recent trends and techniques. SpringerPlus 2 (1), 523. doi:10.1186/2193-1801-2-523
Peethambaran, B., Anbalagan, R., Kanungo, D. P., Goswami, A., and Shihabudheen, K. V. (2020). A comparative evaluation of supervised machine learning algorithms for township level landslide susceptibility zonation in parts of Indian Himalayas. CATENA 195, 104751. doi:10.1016/j.catena.2020.104751
Pham, B. T., Pradhan, B., Tien Bui, D., Prakash, I., and Dholakia, M. B. (2016). A comparative study of different machine learning methods for landslide susceptibility assessment: a case study of Uttarakhand area (India). Environ. Model. Softw. 84, 240–250. doi:10.1016/j.envsoft.2016.07.005
Reichenbach, P., Rossi, M., Malamud, B. D., Mihir, M., and Guzzetti, F. (2018). A review of statistically-based landslide susceptibility models. Earth-Science Rev. 180, 60–91. doi:10.1016/j.earscirev.2018.03.001
Sameen, M. I., Pradhan, B., and Lee, S. (2020). Application of convolutional neural networks featuring Bayesian optimization for landslide susceptibility assessment. CATENA 186, 104249. doi:10.1016/j.catena.2019.104249
Shano, L., Raghuvanshi, T. K., and Meten, M. (2020). Landslide susceptibility evaluation and hazard zonation techniques – a review. Geoenvironmental Disasters 7 (1), 18. doi:10.1186/s40677-020-00152-0
Solanki, A., Gupta, V., and Joshi, M. (2022). Application of machine learning algorithms in landslide susceptibility mapping, Kali Valley, Kumaun Himalaya, India. Geocarto Int. 37 (27), 16846–16871. doi:10.1080/10106049.2022.2120546
Su, C., Wang, B., Lv, Y., Zhang, M., Peng, D., Bate, B., et al. (2022). Improved landslide susceptibility mapping using unsupervised and supervised collaborative machine learning models. Georisk Assess. Manag. Risk Eng. Syst. Geohazards 17, 387–405. doi:10.1080/17499518.2022.2088802
Tang, L., Yu, X., Jiang, W., and Zhou, J. (2023). Comparative study on landslide susceptibility mapping based on unbalanced sample ratio. Sci. Rep. 13 (1), 5823. doi:10.1038/s41598-023-33186-z
Thang, N. V., Wakai, A., Sato, G., Viet, T. T., and Kitamura, N. (2022). Simple method for shallow landslide prediction based on wide-area terrain analysis incorporated with surface and subsurface flows. Nat. Hazards Rev. 23 (4), 04022028. doi:10.1061/(ASCE)NH.1527-6996.0000578
Tomek, I. (1976). Two modifications of CNN. IEEE Trans. Syst. Man, Cybern. SMC-6 (11), 769–772. doi:10.1109/TSMC.1976.4309452
van Westen, C. J., Castellanos, E., and Kuriakose, S. L. (2008). Spatial data for landslide susceptibility, hazard, and vulnerability assessment: an overview. Eng. Geol. 102 (3), 112–131. doi:10.1016/j.enggeo.2008.03.010
Yalcin, A. (2008). GIS-based landslide susceptibility mapping using analytical hierarchy process and bivariate statistics in Ardesen (Turkey): comparisons of results and confirmations. CATENA 72 (1), 1–12. doi:10.1016/j.catena.2007.01.003
Zhang, J., and Mani, I. (2003). “KNN approach to unbalanced data distributions: a case study involving information extraction,” in Proceeding of International Conference on Machine Learning (ICML 2003) (Washington, DC: Workshop on Learning from Imbalanced Data Sets.
Keywords: Bayesian optimization, bootstrapping, landslide susceptibility, Monte Carlo, SHAP, uncertainty analysis
Citation: Le X-H, Choi C, Eu S, Yeon M and Lee G (2024) Quantitative evaluation of uncertainty and interpretability in machine learning-based landslide susceptibility mapping through feature selection and explainable AI. Front. Environ. Sci. 12:1424988. doi: 10.3389/fenvs.2024.1424988
Received: 29 April 2024; Accepted: 03 July 2024;
Published: 30 July 2024.
Edited by:
Taskin Kavzoglu, Gebze Technical University, TürkiyeReviewed by:
Faming Huang, Nanchang University, ChinaSubham Roy, University of North Bengal, India
Chong Xu, Ministry of Emergency Management, China
Copyright © 2024 Le, Choi, Eu, Yeon and Lee. This is an open-access article distributed under the terms of the Creative Commons Attribution License (CC BY). The use, distribution or reproduction in other forums is permitted, provided the original author(s) and the copyright owner(s) are credited and that the original publication in this journal is cited, in accordance with accepted academic practice. No use, distribution or reproduction is permitted which does not comply with these terms.
*Correspondence: Giha Lee, bGVlZ2loYUBrbnUuYWMua3I=