- 1School of Finance, Taxation and Public Management, Jiangxi University of Finance and Economics, Nanchang, Jiangxi, China
- 2School of Business, Southwest University, Chongqing, China
Introduction: Industrialization, urbanization, wars, and conflicts have caused farmland abandonment and exacerbated food security issues, posing a major challenge to global food security. Therefore, it is of great significance to monitor the status of crop abandonment in major grain-producing areas. Most of previous studies using remote sensing technology to extract abandoned farmland have small scale and low accuracy, and there was lack of large-scale studies using GF-1 image. Particularly in the Jiangxi Province, as the main grain-producing area of China, the situation of farmland abandonment is still unknown.
Methods: In this paper, GF-1 WFV remote sensing images are used as the main data source. A binary decision tree process based on the object-oriented technology classification and vector similarity function change detection methods are adopted to extract abandoned farmland information in Jiangxi Province during 2020–2022 and to describe its spatial pattern.
Results: The results show that the overall accuracy of GF-1 remote sensing image extraction based on object-oriented technology is 93%, and the Kappa coefficient is 0.89. The abandoned farmland in Jiangxi Province covers an extensive area of 3.41 × 10⁵ hm2, with an abandonment rate of 9.87%. Abandonment is greater in the north and less in the south, with a spatial distribution pattern characterized by sparse coverage in mountainous areas and aggregation in plains areas. Farmland abandonment is most severe in the areas surrounding the northern Poyang Lake Plain, and the degree of farmland abandonment varies significantly among various prefecture cities as well as among different counties. The highest rate of farmland abandonment in prefecture cities was 13.18% and the lowest was 7.13%. The highest rate of farmland abandonment in the county was 24.22%, and the lowest was 1.99%.
Discussion: The results are helpful in understanding the status of abandoned farmland in major grain-producing areas. It is believed they are significant for farmland protection and real-time national food security strategy.
Highlights
• Abandoned farmland rate and area of Jiangxi Province were 9.87% and
• Abandoned farmland in Jiangxi Province is more in the north and less in the south
• Abandoned farmland area has vast variations between cities and counties across the province
• Feasibility of extraction abandoned farmland using GF-1 imagery on large-scale was proved
1 Introduction
Farmland abandonment has been one of the major land use changes worldwide in recent years, and it is also a direct manifestation of farmland marginalization (Liu et al., 2022; Wang et al., 2020; Zheng et al., 2023). The economic benefits of agriculture continue to decline due to the impact of urbanization and industrialization, and many rural labourers are transferred to non-agricultural industries, which eventually leads to the large-scale abandonment of farmland (Wang et al., 2023). Although a reduction in farmland area plays a positive role in ecological restoration (Lasanta et al., 2015), increased biodiversity (Rey Benayas and Bullock, 2012), and regional carbon storage (Henebry, 2009), food security issues such as a decrease in food production (Khanal and Watanabe, 2006), regional food shortages (Feng et al., 2005), and external dependence on food (Kc and Race, 2020) caused by the abandonment of farmland have become increasingly severe. Among them, major grain-producing regions often bear the sole responsibility of supplying the nation and even the world with food. The large-scale abandonment of farmland in these regions poses a significant threat to regional food security, attracting widespread attention from scholars domestically and internationally, as well as from various governments (Wang et al., 2022). Therefore, timely monitoring of the status of farmland abandonment in major grain-producing areas and insight into the spatial distribution of abandoned farmland are crucial for ensuring national food security.
The degree of economic activity strongly affects the generation of and change in abandoned farmland. Historically, Europe has been a hot spot of long-abandoned farmland. During the rise of industrialization, as early as the middle of the 19th century, several scholars studied the phenomenon of farmland abandonment in Western Europe. In the 1990s, due to the economic and political turmoil brought about by the collapse of the Soviet Union, a large amount of abandoned farmland appeared in Central and Eastern Europe, and scholars turned their attention to the spatial monitoring of abandoned farmland in the former Soviet Union. The abandonment of farmland in advanced economies such as in North America also attracted the early attention of academic circles. The existing research of Asia mainly focuses on developed countries, but there are few studies on farmland abandonment in developing Asian countries such as China. Overall, studies on farmland abandonment in developing countries need to be supplemented.
Traditionally, two main methods were used to investigate abandoned farmland: field investigation and remote sensing identification. The field investigation included farmer household surveys and statistical surveys. The advantage of the former is that they can better explore the driving forces and mechanisms of farmland abandonment and play a key role in determining and evaluating the trends of abandonment. However, due to the subjectivity and privacy of farmers and the relatively limited number of survey objects, the survey results may not accurately reflect the actual situation of local farmland abandonment. A statistical survey is generally carried out by government leaders; although the coverage is wide, the processing time is long, the cost of capital is high, and the survey results often have a certain degree of bias. Overall, field investigations have low efficiency, high cost and weak real-time performance and cannot depict the spatial distribution pat-tern of abandoned farmland on a large scale. Remote sensing, on the other hand, has the advantages of low cost and short duration, which can better compensate for the drawbacks of field investigations. In recent years, scholars have used different remote sensing images, mainly from MODIS (Ramírez-Cuesta et al., 2021), Landsat (Wei et al., 2021), Sentinel-2, and GF-1, to extract abandoned farmland. MODIS remote sensing data and Landsat remote sensing data are open-access, with wide coverage and consistent updates and have been widely used in large-scale farmland abandonment research. However, resolution is low, and extraction resolution can be poor. In contrast, Sentinel-2 imagery has high accuracy and is favoured in small-scale study areas. Due to complex image processing and incomplete coverage in some areas, single-source remote sensing images often need to be combined with other remote sensing images. GF-1 is a remote sensing image product from China that can be obtained free of charge and has a simple image processing process. Its WFV product has a wide imaging amplitude and wide coverage area, serving as a new remote sensing data source for monitoring large-scale Earth surface parameters. However, few studies have applied GF-1 images to relevant abandoned farmland research, and whether GF-1 images can be used to extract abandoned farmland on large-scale needs to be verified.
In previous studies, visual interpretation was the traditional method for land recognition of remotely sensed images. Although the traditional visual interpretation can provide more accurate extraction results, it requires researchers to have professional knowledge, is inefficient and strongly subjective, and is not suitable for large-scale identification and extraction. With the advances in remote sensing extraction technology, feature-based recognition has become the main recognition method used currently by scholars (Yu et al., 2024). At present, these methods can be divided into two categories: traditional pixel-based methods and object-oriented image processing methods. The traditional pixel-based methods takes the image pixel as the basic unit and uses the spectral information of the image to extract information. Supervised classification techniques, such as maximum likelihood (ML), minimum distance (MaD) and parallelepiped (Pa), based unsupervised classification techniques, such as ISODATA and K-means, have been widely used in ground class recognition (Jie et al., 2018; Cheng et al., 2018; Qi et al., 2017). However, this approach uses only spectral information as the basis for classification, resulting in a ‘salt and pepper’ effect due to spectral differences within the class, which affects the classification accuracy. The object-oriented recognition method only considers the spectral features of images but also incorporates texture, geometry and spatial features into classification rules, which can greatly improve classification accuracy and effectively avoid the ‘salt and pepper’ effect.
Currently, research on abandoned farmland has made progress in identification, accuracy, and spatial patterns but there is still room for improvement. Firstly, previous studies on abandoned farmland have mainly focused on the medium and micro scale, while few large-scale studies have been conducted. The identification of abandoned farmland based on macro perspective should be further explored. And the issue determining spatial pattern of abandoned farmland on large-scale urgently needs to be addressed urgently. Secondly, there are few studies on abandoned farmland in Chinese main grain-producing areas. As a major grain producing area in China, the quantity and spatial pattern of abandoned farmland in Jiangxi Province are still unclear. Thirdly, previous studies have rarely used Chinese GF-1 images as the main data source on a large scale, and whether GF-1 images can be used to extract abandoned farmland on large-scale needs to be further verified.
Here, Jiangxi Province, which is a major grain-producing area in China, was selected as the research area and GF-1 remote sensing images were used as the main data source to extract large-scale abandoned farmland information. The purpose of this study is as follows: 1) Determining the status of abandoned farmland in Jiangxi Province of China and revealing the spatial pattern of abandoned farmland; 2) Recommending potential driving forces for abandoned farmland; 3) Verifying the feasibility of GF-1 imagery in extraction abandoned farmland on a large scale, and exploring a set of specific processes and methods. The main contributions of this study are as follows: 1) Taking Jiangxi Province of China as an example to carry out large-scale monitoring of abandoned farmland, enriching the scale and empirical cases for the extraction of abandoned farmland; 2) Using China’s GF-1 images as the main data source, this study applied images to the detection of abandoned farmland, broadening the application range of GF-1 images.
2 Study area and data
2.1 Study areas
Jiangxi Province of China is the research area. Jiangxi Province is located in southeast China on the southern bank of the middle and lower reaches of the Yangtze River, between latitudes 24°29′14″ and 30°04′43″ north and longitudes 113°34′18″ and 118°28′56″east. The total area of the province is
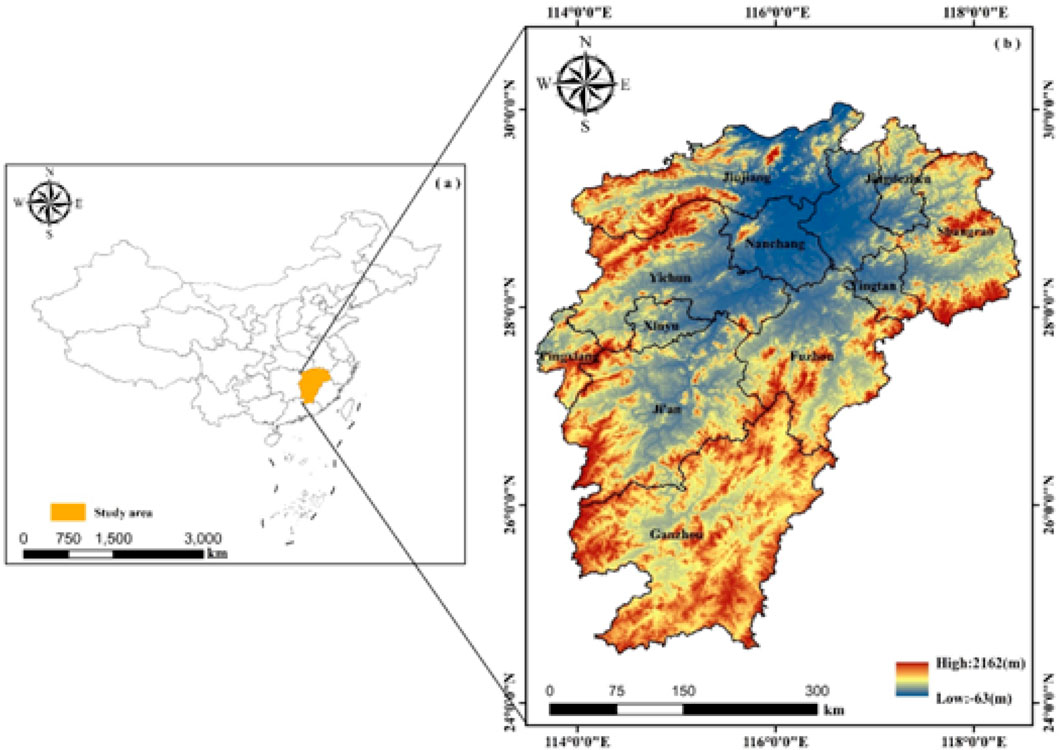
Figure 1. (A) Geographical location of the Jiangxi (orange polygon) in the national context; (B) City boundaries and heights of the Jiangxi Province.
By the end of 2022, the province’s permanent resident population was
2.2 Data source and preprocessing
In this paper, we use GF-1 WFV remote sensing image data with a spatial resolution of 16-m obtained from the China Centre for Resources Satellite Data and Application (http://www.cresda.com). The GF-1 satellite was launched on 26 April 2013 and features two cameras with a 2-m resolution panchromatic sensor/8-m resolution multispectral sensor (PMS) and four cameras with a 16-m resolution multispectral sensor (WFV). The swath width can reach 800 km, and the revisit cycle is 4 days. The other parameters are shown in Supplementary Table S1. In addition, we used 30-m resolution STRM elevation data obtained from the China Geospatial Data Cloud (https://www.gscloud.cn/). China’s administrative boundary data were obtained from the China State Bureau of Surveying and Mapping.
The phenology of local crops should be considered first when selecting the study period. Due to the large area of Jiangxi Province, there are differences in the natural environment, so the crop phenology is not completely consistent, and the planting date is not the same. Rice is the most important crop in Jiangxi Province. Spring is the most important planting season in Jiangxi Province, with spring sowing in March and harvest in June-July. If a farmland is still unsown in April, it will no longer be tilled in the spring. In April, rice is in its early growth stage, with relatively short plant height, allowing it to be easily distinguished from other vegetation. Rice grows quickly, its plant height has already increased significantly by May. At this time, the spectral characteristics of rice are quite similar to those of other vegetation, making it prone to interference from other vegetation types during the classification process. Therefore, we took April as the research period and selected a total of 23 remote sensing images from April 2020 and 2022 (Supplementary Table S2).
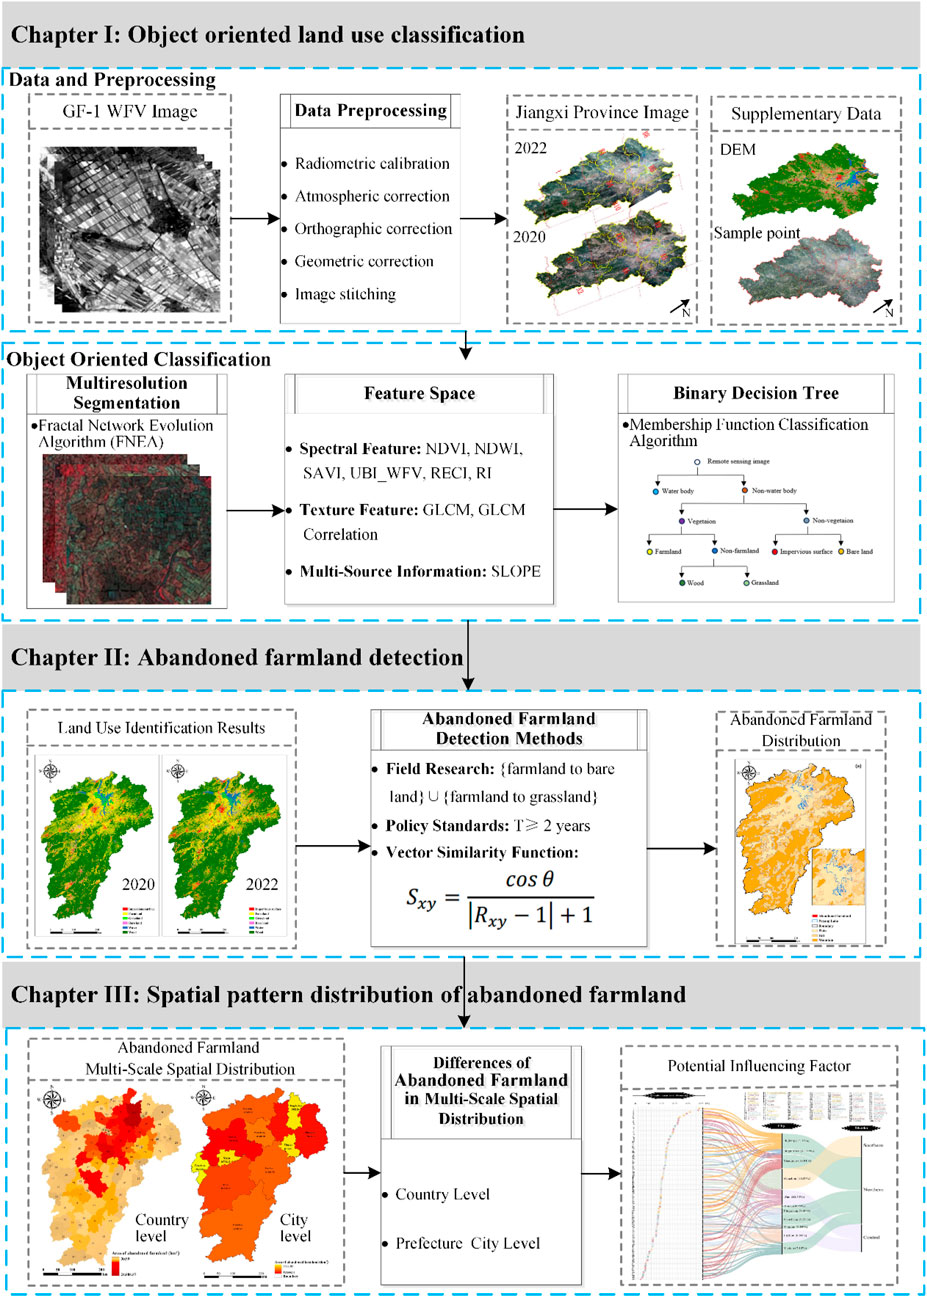
ENVI5.6 software and ArcGIS10.8 software were used for data preprocessing. Radiometric calibration, atmospheric correction, orthographic correction, image stitching and histogram correction were performed with ENVI software. After geometric correction, the image root mean square error is 0.5 pixels. ArcGIS software was used to project elevation data and calculate slope. The workflow for this study is shown in Figure 3.
3 Methods
3.1 Processes of identifying abandoned farmland
Farmland abandonment means that farmers stop farming in a certain period of time, resulting in the farmland being deserted or idle (Ma et al., 2017). Due to the different research fields and research objectives, there is no unified standard for the time judgment threshold of abandoned farmland in academia, which mainly includes multiple judgment thresholds such as single season, 1 year, 2 years and 5 years (Wang et al., 2022; Zhao et al., 2023). However, a single season or year of farmland is likely to be fallow, so these two thresholds are not appropriate (Liu and Song, 2023). Many researches refer to the two-year threshold set by the 2011 the International Symposium on Land Consolidation and Land Storage. This is the same standard of judgment used by the Jiangxi provincial government and other local governments (Luo and Moiwo, 2022). Therefore, this study takes 2 years as the standard to judge the time of farmland abandonment. From the perspective of land cover, many abandoned farmland in previous researches were eventually transformed into grassland, bare land and wood (Fayet et al., 2022; Zhu et al., 2021). Through field investigation, we found that the abandoned farmland in Jiangxi Province was primarily transformed into bare land. Additionally, some bare land was transformed into grassland over time. The policy of returning farmland to grassland is mainly implemented in the north of China, but rarely in the South. Therefore, from the perspective of land cover, we classified the land that was farmland turned into bare land and grassland in 2 years as abandoned farmland. However, returning farmland to wood is an active environmental protection behavior, rather than a negative conversion due to idle farmland. Thus, from the perspective of land cover, we classified the land that was farmland turned into bare land and grassland in 2 years as abandoned farmland.
The identification process in this research is mainly divided into five steps: 1) Based on the object-oriented classification method, the multi-scale segmentation of two periods of GF-1 remote sensing images is carried out to obtain the objects; 2) Using the binary decision tree classification method, the objects of the 2022 remote sensing image are classified to obtain the land use classification results for that year and then conducting an accuracy assessment of the land use classification results for 2022; 3) Using the vector similarity function to detect changed areas and unchanged areas. Based on this, the binary decision tree classification method is applied again to classify the changed areas of 2020 imagery. 4) Merging this result of the changed areas in 2020 with that of the unchanged areas in 2020 which is same as unchanged areas in 2022 land use classification result. 5) Overlaying the land use classification results of 2020 and 2022, we extract the plots that were classified as farmland in 2020 but have changed to bare land and grassland in 2022, designating them as abandoned farmland. The specific identification process is described in the flow chart.
3.2 Object-oriented image analysis technology
The object-oriented classification method makes use of the homogeneity of the spectral and spatial features of image, comprehensively considering their semantic information, shape and texture characteristics and neighboring relations, and combining the basic classification unit (object) of neighboring pixels with similar characteristics. Land classification based on objects can avoid the problems associated with encountering the “same object with different characteristics” and a “foreign object with the same characteristics.” The main steps include multiscale segmentation, classification hierarchy construction, classification rule setting and information extraction. We used eCognition10.3 software to implement object-oriented classification.
3.2.1 Multiresolution segmentation
Multiresolution segmentation is the core of object-oriented classification. To ensure the consistency of image segmentation object boundaries in the two periods, remote sensing images in 2020 and 2022 are segmented at the same time to avoid the generation of undetectable tiny objects in the segmentation process, thus affecting the classification accuracy.
Multiresolution segmentation involves merging objects step by step from bottom to top via the fractal network evolution algorithm (FNEA). This is a growth segmentation method that combines individual pixels into multiple smaller-sized objects and groups them into larger objects by comparing the heterogeneity among objects. The criterion for judging object heterogeneity by eCognition software is that the weighted average heterogeneity of objects should be minimized, which is measured by spectral heterogeneity and shape heterogeneity (Baatz and Schäpe, 2000; Benz et al., 2004). The spectral heterogeneity was represented by the weighted sum of the spectral standard deviations of each band belonging to the object. There are two indexes for evaluating shape heterogeneity: compactness heterogeneity and smoothness heterogeneity. The compactness heterogeneity measures the compactness of an object’s shape. The closer an object’s shape is to a circle or rectangle, the more compact it is and the smaller its compactness heterogeneity. Smoothness heterogeneity indicates the smoothness of an object’s shape. The more fragmented the object boundary is, the less smooth it is and the greater the smoothness heterogeneity.
The segmentation scale and heterogeneity factor weights jointly affect the segmentation results. The fusion value is obtained by weighted calculation of the segmentation scale and heterogeneity factor values and compared with the manually-set fusion threshold to determine whether two adjacent objects are merged (Tong et al., 2012). An inappropriate segmentation scale will affect the segmentation outcome. An excessively large segmentation scale (under-segmentation) will decrease the internal homogeneity of the object, resulting in the confusion of ground objects and affecting the classification accuracy. A segmentation scale that is too small (over-segmentation) will cause an overly fragmented segmentation, and too many objects will reduce the computational classification efficiency. The multilevel segmentation scale method can select different segmentation scales for different land use types to better balance the segmentation accuracy, and the number of segmentation objects and avoid the internal confusion of segmentation objects and fragmentation of segmentation results caused by the use of a single segmentation scale.
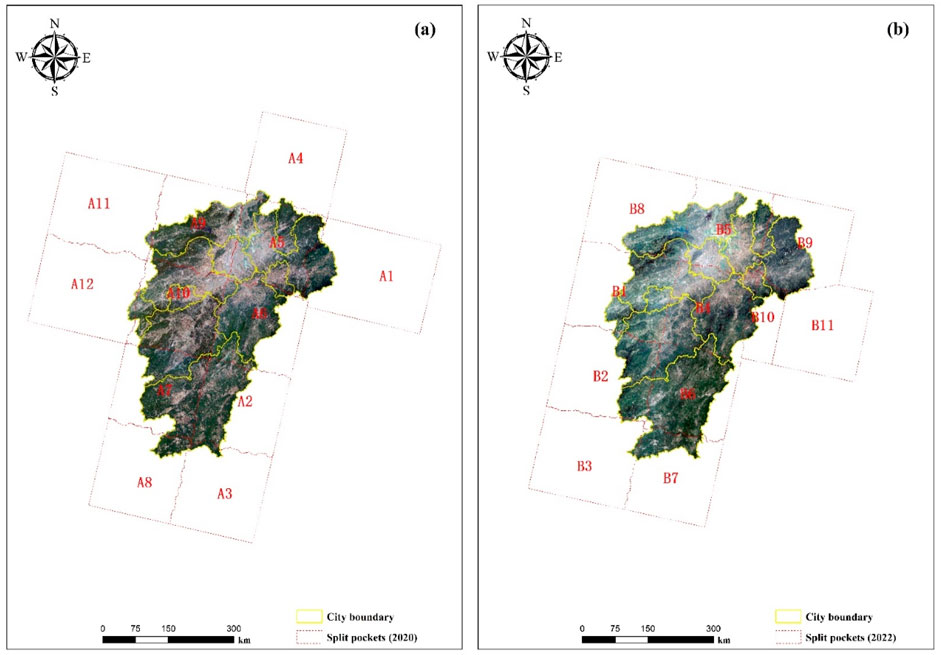
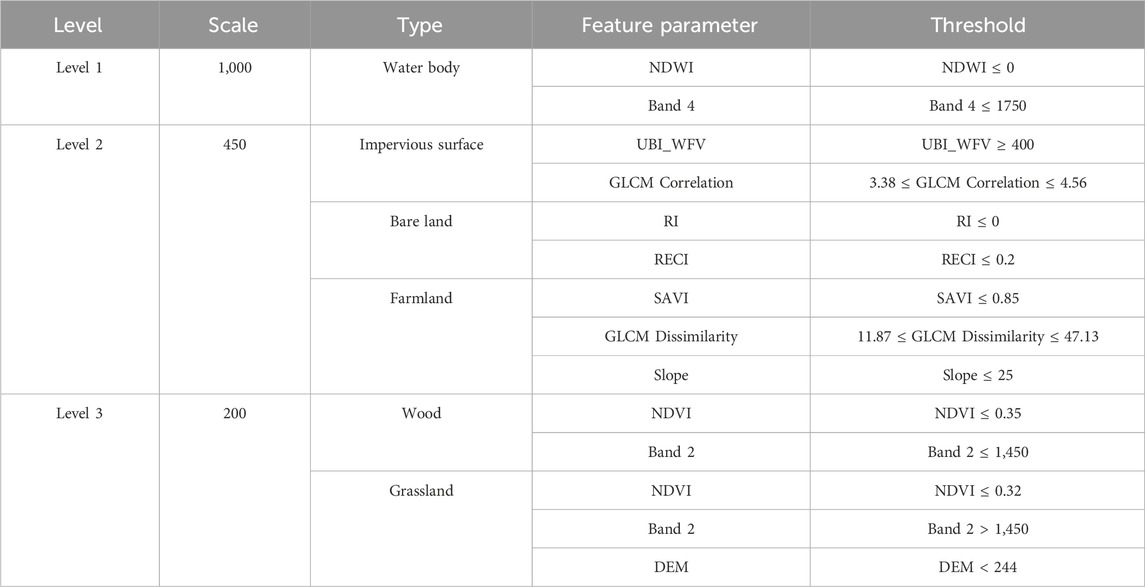
In this paper, the land use types of Jiangxi Province are divided into six categories: farmland, wood, grassland, water, impervious surface and bare land. After extensive tests, the segmentation scale of water body was set to 1,000; that of impervious surfaces and bare land to 450; and that of farmland, grassland and wood to 200. The shape factor weight was set to 0.8 to optimize segmentation. After several repeated attempts, we believe this set of parameters can better reflect the actual situation of uneven terrain and mixed land types in Jiangxi Province (Figure 4).
3.2.2 Classification method based on a binary decision tree
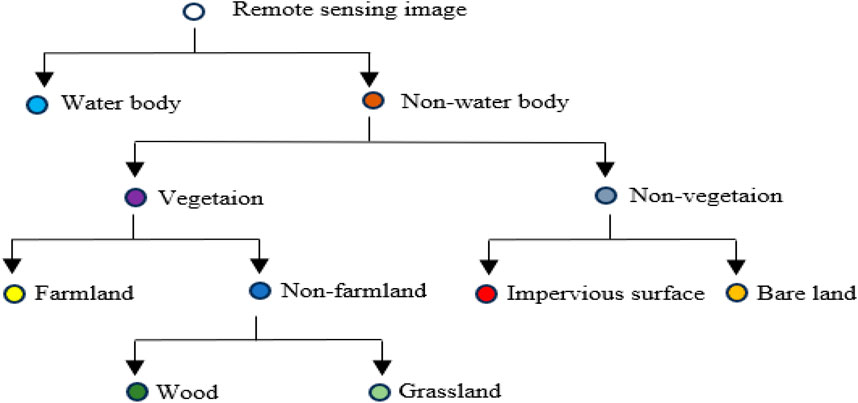
Binary decision tree classification is a multilevel classification method that follows the classification principle from easy to difficult: it involves establishing multiple classification nodes, uses classification characteristics to divide objects into two subsets in each classification node, and classifies them step by step until each subset contains only one land use type. The two subsets under each classification node are complementary and contain all the classification objects of the node. The binary decision tree classification design is flexible and can set a variety of classification feature rules based on different research areas. The selection of threshold values for classification features is relatively simple, and this approach effectively improves classification efficiency. Moreover, this approach can effectively reduce the transmission of classification errors, so it is widely used in land use classification. In this study, the images are first divided into water body and non-water body, then non-water body are subdivided into vegetation areas and non-vegetation areas, then vegetation areas are subdivided into farmland and non-farmland areas while non-vegetation areas are subdivided into impervious surfaces and bare land, and finally non-farmland is subdivided into wood and grassland areas (Figure 5).
3.2.3 Selection of the classification index and determination of the threshold value
The eCognition software provides two classification algorithms: the nearest neighbour classification method and the membership function method. The membership function classification algorithm determines the object category by establishing a classification rule set and setting a classification feature threshold and can distinguish land types with fewer classification features. The nearest neighbour classification method calculates the distance between each object to be classified and the selected sample within the threshold range, which is computationally intensive and leads to low classification efficiency; therefore, this method is difficult to apply to high-resolution and large-scale classification processes. In contrast, the membership function method has higher operational efficiency than the nearest neighbour classification method and can achieve more accurate classification results (Wang et al., 2014; Zhang et al., 2016). The spectral feature is the most important basis for land use identification in previous researches. The principle is to extract land classes by using the discrepancies of different land cover in separate bands. Previous researches have shown that the use of spectral features alone is not enough. It is believed that the extraction effect of land cover information combined with texture features is more effective (Lin and Guo, 2024). Among them, Gray Level CO-Occurrence Matrix (GLCM) is a widely used method to extract texture features. The occurrence frequency of each gray level information contained in the image can be calculated by statistical analysis of the gray level information contained in the image. It can accurately predict and reflect the comprehensive information such as direction, adjacent interval and change amplitude in the gray level of the image (Duan et al., 2022). After several tests and combined with relevant expertise in geoscience, we included the indices of topographic, spectral and geometric texture features into the classification rule set of land classification in the study area (Table 1).
In the Level 1 layer, the near-infrared band value and NDWI are used to extract water information. The near-infrared band value can preliminarily distinguish between water body and non-water body, and the use of the NDWI can eliminate wood shadows from the preliminary water body classification results. At Level 2, the SAVI performs better in terms of farmland extraction, which can be extracted by adjusting the soil regulation coefficient based on the difference in coverage (Equation 1). The GLCM dissimilarity index is a unique grey-level co-occurrence matrix calculated by eCognition software based on texture features that can balance the grey value and variance relationship. The index can be used to evaluate the level differences of objects, and it is effective at extracting farmland. The slope of farmland in Jiangxi Province generally does not exceed 25°, so we used the slope data to further screen the preliminary classification results of farmland. The
In the above equation,
In the above equation,
3.2.4 Accuracy assessment of classification
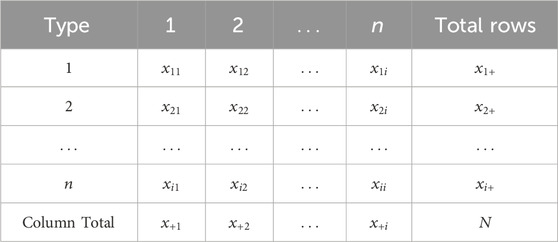
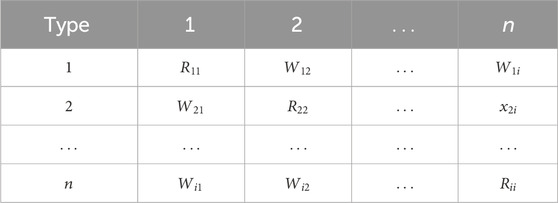
The confusion matrix (CM) is an important index for evaluating the classification accuracy of land use (Yi, 2023). It is a matrix of
Based on the confusion matrix, the accuracy of the classification results can be evaluated. Three indexes, overall accuracy (OA), user accuracy (UA) and the kappa coefficient, were used to evaluate the accuracy (Yi et al., 2023). The overall accuracy represents the ratio of the number of correctly classified samples to the total number of total samples, and the formula is as follows (Equations 3, 4):
In the above formula,
The kappa coefficient was calculated with a discrete multivariate equation. Compared with the overall classification accuracy, which can use only diagonal elements of the confusion matrix for accuracy evaluation, the kappa coefficient can use confusion matrix information to measure classification accuracy more comprehensively (Equation 5). Generally, when the kappa coefficient is less than 0.4, the classification accuracy is considered poor, and when it is between 0.4 and 0.8, the classification accuracy is considered acceptable. The classification results are optimal when the value is greater than 0.8. The formula is as follows:
In the formula,
The validation samples required for accuracy verification generally comes from higher spatial resolution remote sensing image datasets and field visit data (Story and Congalton, 1986). The selection of samples is generally based on stratified random sampling. While ensuring the minimum number of samples for each land use type, the total number of samples is determined according to the area proportion (Bao Pham et al., 2024). In this study, Sentinel-2 remote sensing images were used as reference datasets and sampled via the Google Earth Engine platform. The day of image data used for sampling was consistent with those of GF-1 and the number of sample points is 8,500. In total 366 field investigation samples were selected from Pingxiang, Nanchang, Yichun, and Shangrao prefectures. The spatial distribution of the samples is shown in Supplementary Figure S1.
3.3 Land use change detection methods
The vector similarity function is a widely used land use change detection method, The basic unit of detection can be a pixel or an object. This research takes the object as the basic unit and uses vector similarity function to detect land use change. The principle behind change detection is to divide land use change into two states: change and no change. The vector similarity function locates the object and its spectral feature vector by superposing two remote sensing images; one from the reference period (T1) and the other from the detection period (T2). By setting the threshold of the similarity function, a similarity measurement is carried out on the feature vector of the two periods. If the vector similarity is lower than the set threshold, the object is considered to have changed; otherwise, it has not changed. The angle between vectors and the vector norm are two indicators used to measure the similarity of vectors. The spectral feature vector of an object is regarded as a vector in four-dimensional space. When the angle between two vectors is smaller, the vector norm is closer, and the vectors are more similar (Xue et al., 2009). The formula is as follows (Equations 6–8):
In the formula,
We first used the binary decision tree method to classify the land of remote sensing images of Jiangxi Province in 2022, then took the remote sensing images of 2020 and 2022 as T1 and T2 period images respectively, and created four-dimensional spectral feature vectors using the four bands (B, G, R, and NIR) of GF-1 remote sensing images. By calculating the vector similarity of each object between the two images and taking 0.76 as the similarity threshold, Jiangxi Province was divided into changed areas and unchanged areas. On this basis, we use the binary decision tree method again to classify the changed areas within 2 years, so as to obtain the land use classification results within the changed area in 2020. Since the land use classification results of the unchanged area within 2 years are consistent, we take the land use classification results of the unchanged areas in 2022 as the land use classification results of the unchanged areas in 2020, and then superimpose and merge the results with the land use classification results of the unchanged areas in 2020. The results of land use classification in Jiangxi Province in 2020 were obtained. Supplementary Figure S2 shows the regions with changes over the period 2020–2022 in Jiangxi Province.
4 Results
4.1 Land use classification results
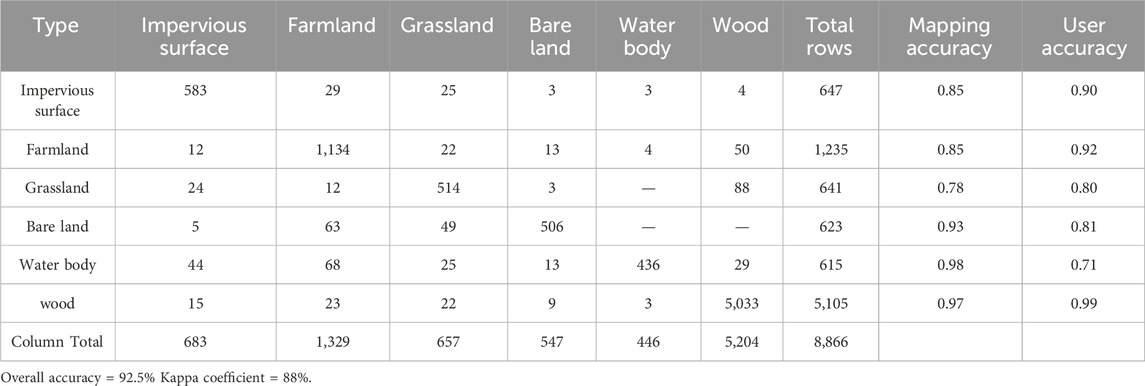
According to the classification results, the approach using the object-oriented method lead to a relatively compact and continuous result, consistent with the actual distribution of ground objects, and there is no “salt and pepper” effect. Accuracy verification evaluates the accuracy of land use classification via quantitative analysis of classification results. After calculation, the overall accuracy of the classification results based on the object-oriented method was 92.5%, and the kappa coefficient was 0.88, indicating high classification accuracy, as shown in Table 4. The mapping accuracy of grassland was the lowest. The main reason for this inconsistency is that some grasslands and woods exhibit similar spectral characteristics, and some grasslands are incorrectly classified as wood. On the other hand, the grasslands in the area around Poyang Lake are interspersed with bare land and water, and their distribution pattern is complex. After the bare land is desertified for a period, a large amount of grass grows and the area assumes the spectral characteristics of grassland. Changes in aquatic grasses in the Poyang Lake complex also interfere with differentiation between grassland and water body, resulting in some adjacent areas being misclassified during the classification process. The user accuracy for water body is the lowest, mainly because the spectral difference between a few paddy fields and water body is very small and because they are spatially close, so the two are easily misclassified. The mapping accuracy of impervious surface, farmland, water body, wood and bare land was greater than that of the other land use types, and the user accuracy of impervious surface, farmland, grassland, bare land and wood was greater. This is due to the appropriate segmentation of object-oriented technology and the supplementation of textural features to the classification indexes. In general, compared with traditional pixel-based classification methods that use only spectral features for classification, object-oriented classification methods can comprehensively use spectral, textural and spatial classification features to achieve classification results with higher overall accuracy, which can meet the requirements of remote sensing classification.
The area of farmland, impervious surface, wood, grassland, water body and bare land is
4.2 Spatial distribution pattern of abandoned farmland
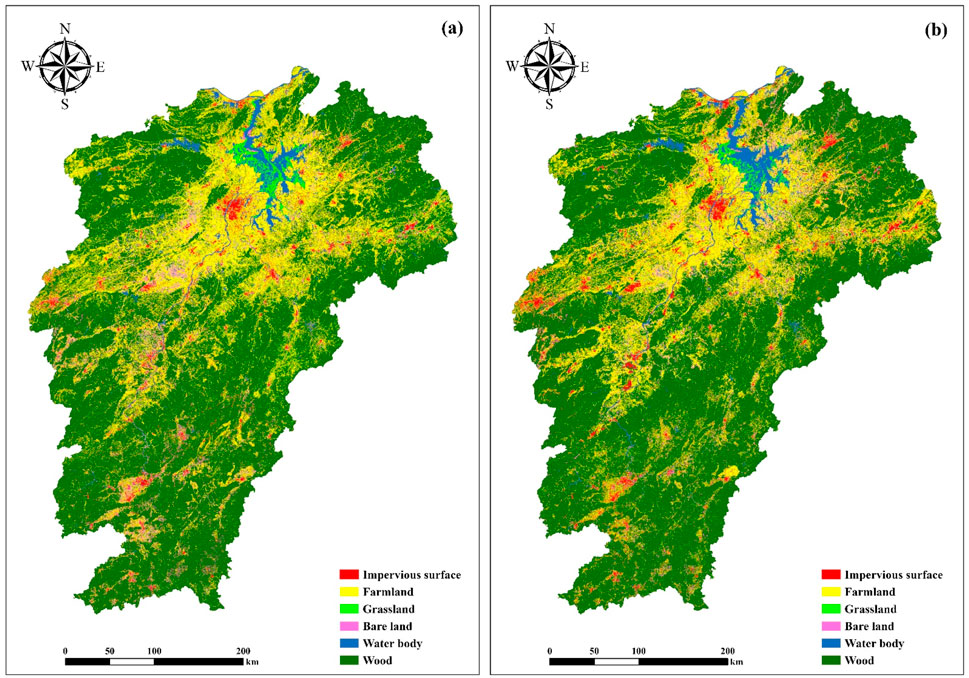
In 2022, the overall spatial distribution pattern of abandoned farmland in Jiangxi Province was more extensive in the north and less so in the south, whereas mountainous areas were sparsely distributed, and plains showed a clustered pattern (Figure 7). The area of abandoned farmland in the province was
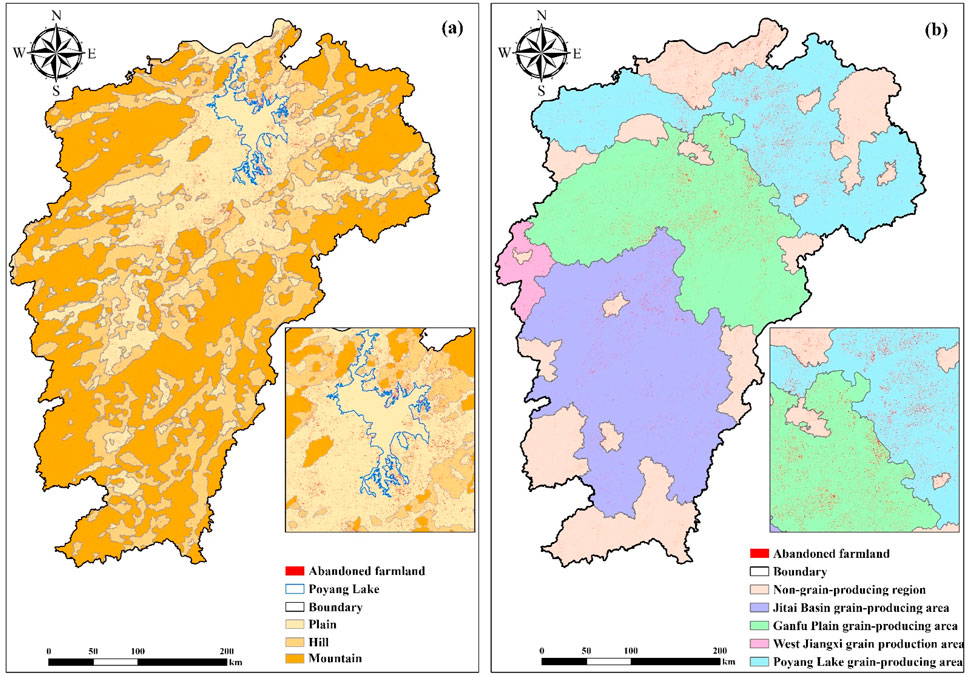
Figure 7. Map of abandoned farmland distribution: (A) distribution map of abandoned farmland based on topography and (B) distribution map of abandoned farmland based on grain production.
4.3 Differences in abandoned farmland among prefecture cities and counties
4.3.1 Differences in abandoned farmland in different cities
The abandoned areas among prefecture cities in Jiangxi Province in 2022 are quite different (Figure 8). Shangrao Prefecture City in the north had the largest area of abandoned farmland (
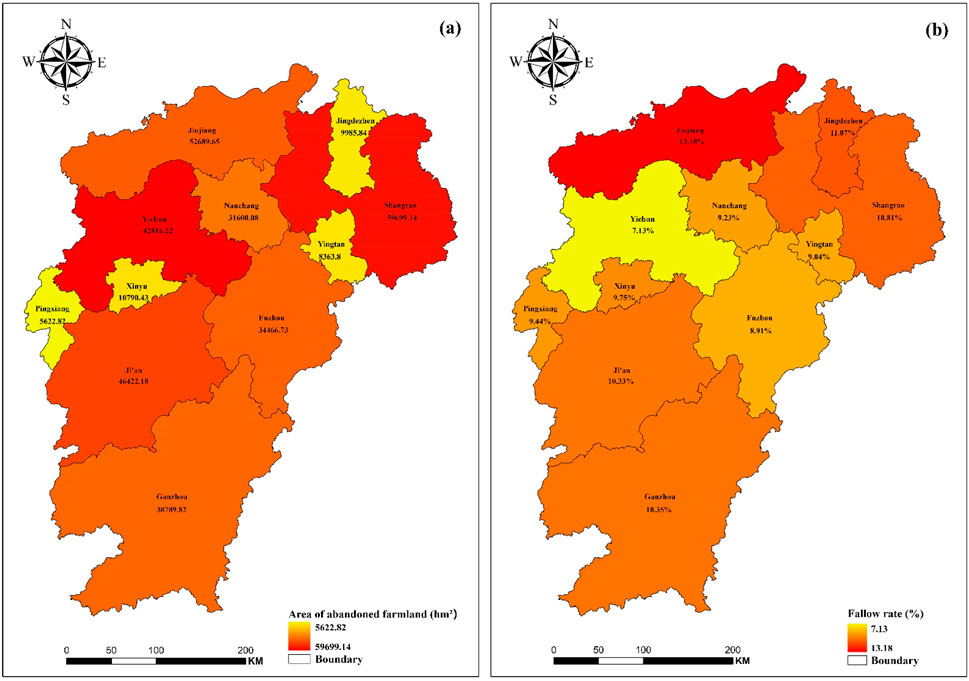
Figure 8. (A) Abandoned farmland area of each Prefecture City in Jiangxi Province, (B) Farmland abandonment rate of each Prefecture City in Jiangxi Province.
4.3.2 Differences in abandoned farmland in different counties
Compared with the difference at the prefecture-city scale, the differences in abandoned farmland at the county scale was more evident (Figure 9). The area of abandoned farmland in each county ranged from
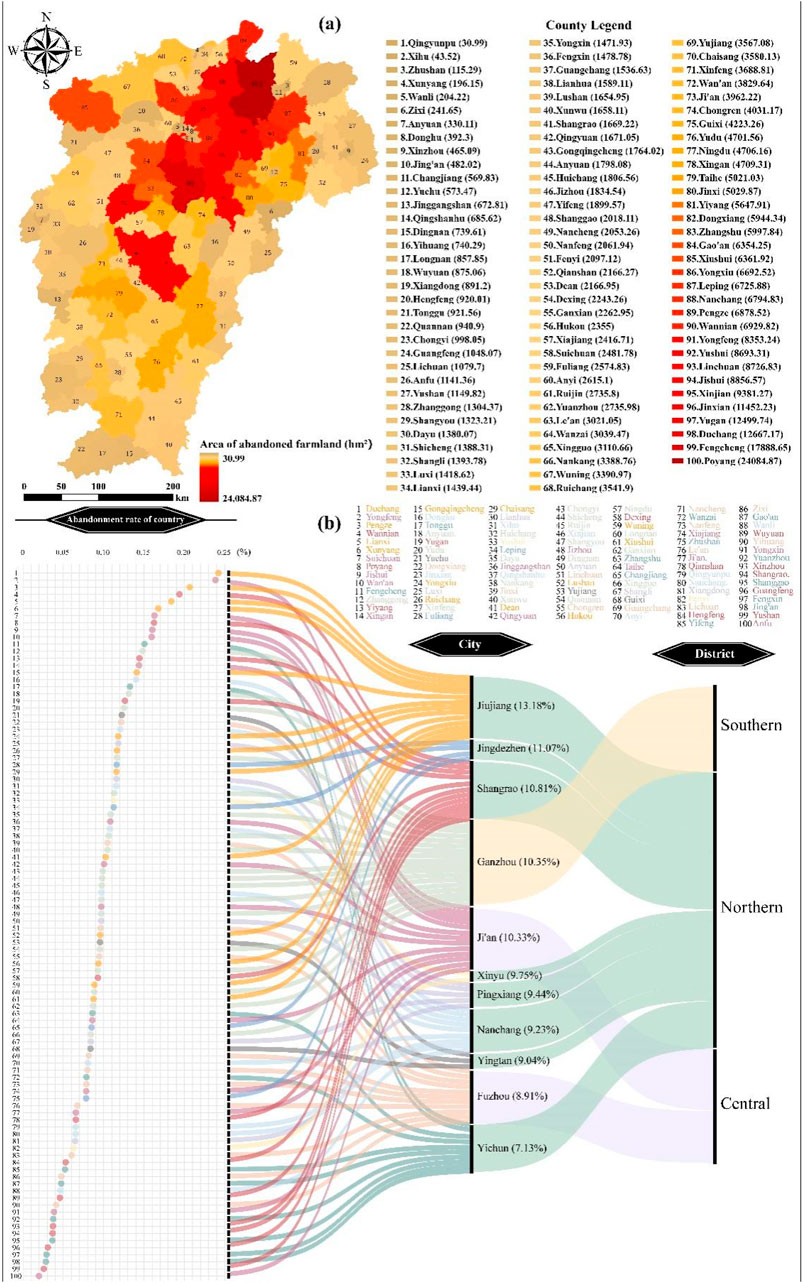
Figure 9. (A) Area of abandoned farmland of each county in Jiangxi Province. (B) Sankey diagram of farmland abandonment rates in counties and their corresponding cities and regions in Jiangxi Province.
Of the 100 counties in the province, 11 had a farmland abandonment rate greater than 15%, and another 15 had a farmland abandonment rate less than 5%. The highest abandonment rate was 24.22% in Duchang County of the Jiujiang Prefecture City. The lowest abandonment rate was in Anfu County of Ji ’an Prefecture City, which was only 1.99%. In addition, Yongfeng (23.85%), Pengze (20.65%), Wannian (19.4%), Lianxi (18.37%), Poyang (16.25%), Xunyang (16.76%), Jishui (16.03%), Suichuan (16.29%), and Wanan (15.94%) had high abandonment rates. Except for the counties of Yongfeng, Jishui, Suichuan and Wan ’an, which are located in the central and southern parts of Jiangxi Province, the other counties are located in the northern Poyang Lake Plain area and its surrounding. The percentage of abandoned farmland was lower in the counties of Shan (2.58%), Jing ’an (2.83%), Fengxin (2.91%), Guangfeng (3.07%), Shanggao (3.65%), Shangrao (3.68%), Xinzhou (3.71%), Yuan Zhou (3.76%) and Yongxin (3.86%). Except for Yongxin County in the middle of Jiangxi Province, the other counties are located in the northern mountains of Jiangxi Province.
In general, at the county scale, the status of abandoned farmland in Jiangxi Province is quite different. The area of abandonment in northern counties is larger than that in southern counties, and the abandonment rate in central counties is greater than that in eastern and western counties. The abandonment rate and area of the counties in the northern Poyang Lake plain region are clearly greater than those in other areas, which is an area severely impacted by farmland abandonment in Jiangxi Province.
5 Discussion
5.1 Classification based on object-oriented technology
The classification based on object-oriented technology can improve the accuracy of land classification on a large scale by using high-resolution remote sensing images. At present, most of the research areas are less than 300
5.2 Influencing factors leading to the status quo of abandoned farmland in Jiangxi Province
Multiple factors are causing the abandonment of farmland, among which the reduction of economic benefit is the root cause. The same characteristics exist in prefecture cities and counties with serious farmland abandonment, including the rising planting cost of farmland, the large outflow of the farmer and the obvious trend of non-agricultural labour transfer (Yu et al., 2022; Ding et al., 2010; Cao et al., 2021; Wang et al., 2023). Rising planting costs squeeze the net income space of farmers, and a large number of farmers choose to go to cities to engage in non-agricultural industries with higher income under the pressure of livelihood, which aggravates the serious degree of farmland abandonment. The change of farmland fragmentation has typical regional characteristics. Poyang Lake area is the most serious area of farmland abandonment in Jiangxi Province, and the degree of farmland fragmentation in this area is much higher than in other areas in recent years (Zheng et al., 2023). The expansion of construction land in this region has intensified the degree of farmland fragmentation, which is not conducive to mechanized farming, limits the improvement of farming efficiency, and increases farmers’ farming intensity, which will hit farmers’ farming willingness and lead to more serious farmland abandonment. Natural disaster is also an important driving factor of farmland abandonment. Under the influence of human activities and climate change, the frequency of drought in the main grain-producing areas of Ganfu Plain has increased significantly in recent years, and the spring drought has become serious. Meanwhile, it is difficult for farmers to obtain the necessary water resources for cultivation and irrigation due to the long-term lack of a well-developed irrigation system, which aggravates the serious degree of farmland abandonment in this region (Yuan et al., 2024). In addition, serious farmland pollution has a general impact on the abandonment of farmland, but the sources of farmland pollution have regional differences. In the main grain-producing areas of Ganfu Plain in central Jiangxi Province and Shangrao prefecture city in northern Jiangxi Province, the main source of farmland pollution is heavy metal emission from industrial activities such as mineral exploitation, while the main cause of farmland pollution in the areas around Poyang Lake is agricultural pollution caused by irrational use of chemical fertilizers and pesticides (Hu et al., 2020; Yuan et al., 2021; Zuo et al., 2023, pp. 2014–2019). Seriously polluted farmland needs a long period of treatment, and due to social security considerations, this part of farmland can only be abandoned until it is completely restored.
5.3 Research limitations and prospects
Although the accuracy of the land cover classification is high, there are still some errors in the classification results because the landscape of Jiangxi Province is too fragmented. There was some subjectivity in setting the threshold, so it is difficult to obtain a perfectly accurate threshold. How to use the relevant factors to build a model and obtain the precise threshold of classification features through machine learning is the goal of future research. Based on 2 years of data, we analysed the spatial pattern of abandoned farmland change in Jiangxi Province and discussed the potential influencing factors. Due to the high cost of obtaining high-resolution images, it is difficult to obtain multiple images from long-term series. In the future, the feasibility of high-resolution image classification of land cover under long time series can be explored through the fusion of multiple remote sensing product data sets, and the long-term dynamic change characteristics and factors influencing abandoned farmland can be further explored.
6 Conclusion
Using Chinese high-resolution GF-1 WFV remote sensing images as the main data source with elevation and slope data, taking Jiangxi Province as the study area, where has complex terrain and a high degree of land fragmentation, this study extracted the abandoned farmland on the large-scale based on object-oriented classification technology. The results showed that large-scale abandoned farmland can be extracted from GF-1 images via combination with object-oriented classification technology. Based on the membership function method, we use a binary decision tree to classify the segmented objects. Although this approach is more complicated than extracting multiple secondary classes from the upper level at one time, the process can use the least common object features for classification according to the easy-to-difficult principal, layer by layer, which can significantly reduce the transmission of errors to improve the classification accuracy.
Our study showed that from 2020 to 2022, the area of abandoned farmland in Jiangxi Province was
Data availability statement
The original contributions presented in the study are included in the article/Supplementary Material, further inquiries can be directed to the corresponding author.
Author contributions
YaL: Conceptualization, Investigation, Resources, Software, Writing–original draft. YiL: Software, Validation, Writing–original draft. XT: Funding acquisition, Supervision, Writing–review and editing.
Funding
The author(s) declare that financial support was received for the research, authorship, and/or publication of this article. This work was supported by the National Natural Science Foundation of China – “Study on the Livelihood Transformation and livelihood Capital Reconstruction of Relocated Farmers in contiguous destitute areas”, No. 42161034.
Conflict of interest
The authors declare that the research was conducted in the absence of any commercial or financial relationships that could be construed as a potential conflict of interest.
Publisher’s note
All claims expressed in this article are solely those of the authors and do not necessarily represent those of their affiliated organizations, or those of the publisher, the editors and the reviewers. Any product that may be evaluated in this article, or claim that may be made by its manufacturer, is not guaranteed or endorsed by the publisher.
Supplementary material
The Supplementary Material for this article can be found online at: https://www.frontiersin.org/articles/10.3389/fenvs.2024.1423868/full#supplementary-material
References
Baatz, M., and Schäpe, A. (2000). “Multiresolution Segmentation: an optimization approach for high quality multi-scale image segmentation,” in Angewandte geographische informationsverarbeitung XII Editors J. Strobl, T. Blaschke, and G. Griesebner (Springer: Cham), 12–23.
Bao Pham, Q., Ajim Ali, S., Parvin, F., Van On, V., Mohd Sidek, L., Đurin, B., et al. (2024). Multi-spectral remote sensing and GIS-based analysis for decadal land use land cover changes and future prediction using random forest tree and artificial neural network. Adv. Space Res. 74, 17–47. doi:10.1016/j.asr.2024.03.027
Benz, U. C., Hofmann, P., Willhauck, G., Lingenfelder, I., and Heynen, M. (2004). Multi-resolution, object-oriented fuzzy analysis of remote sensing data for GIS-ready information. Remote Sens., Integration Geodata Imag. Automated Refinement Update Spatial Databases 58, 239–258. doi:10.1016/j.isprsjprs.2003.10.002
Cao, M., Lin, Z., Peng, L., Tian, Q., and Xu, J. (2021). The dynamics of farmers’ livelihoods in the lakeside area of Poyang Lake and its influencing factors. J. Jiangxi Norm. Univ. Soc. Sci. Edit. 45, 103–110. doi:10.16357/j.cnki.issn1000-5862.2021.01.15
Cao, M., Liu, G., and Zhang, X. (2007). “An object-oriented approach to map wetland vegetation:a case study of yellow river delta,” in 2007 IEEE International Geoscience and Remote Sensing Symposium. Presented at the 2007 IEEE International Geoscience and Remote Sensing Symposium, 4585–4587. doi:10.1109/igarss.2007.4423878
Cheng, S., Cao, S., Cao, G., Han, J., Han, G., and Wu, F. (2018). Comparisons of supervised classification methods for land cover based on high spatial resolution remote sensing images in Shaliu River basin of Qinghai Lake. Bull. Soil Water Conserv. 38, 261–268+353. doi:10.13961/j.cnki.stbctb.2018.05.042
Chouari, W. (2021). Contributions of multispectral images to the study of land cover in wet depressions of eastern Tunisia. J. Remote. Sens. 24, 443–451. doi:10.1016/j.ejrs.2020.11.003
Dibs, H., Idrees, M. O., and Alsalhin, G. B. A. (2017). Hierarchical classification approach for mapping rubber tree growth using per-pixel and object-oriented classifiers with SPOT-5 imagery. J. Remote. Sens. 20, 21–30. doi:10.1016/j.ejrs.2017.01.004
Ding, H., Luo, F., and Jiang, L. (2010). Interpretation on engagement economy and construction of increased-revenue mode for farmers. Huazhong Agric. Univ. Soc. Sci. Ed., 43–47. doi:10.13300/j.cnki.hnwkxb.2010.05.018
Duan, M., Song, X., Liu, X., Cui, D., and Zhang, X. (2022). Mapping the soil types combining multi-temporal remote sensing data with texture features. Comput. Electron. Agric. 200, 107230. doi:10.1016/j.compag.2022.107230
Fayet, C. M. J., Reilly, K. H., Van Ham, C., and Verburg, P. H. (2022). What is the future of abandoned agricultural lands? A systematic review of alternative trajectories in Europe. Land Use Policy 112, 105833. doi:10.1016/j.landusepol.2021.105833
Feng, Z., Yang, Y., Zhang, Y., Zhang, P., and Li, Y. (2005). Grain-for-green policy and its impacts on grain supply in West China. Land Use Policy 22, 301–312. doi:10.1016/j.landusepol.2004.05.004
Hu, B., Shao, S., Ni, H., Fu, Z., Hu, L., Zhou, Y., et al. (2020). Current status, spatial features, health risks, and potential driving factors of soil heavy metal pollution in China at province level. Environ. Pollut. 266, 114961. doi:10.1016/j.envpol.2020.114961
Jie, L., Li, Y., Wang, Y., and Zhao, Q. (2018). Panchromatic remote sensing image classification combining maximum likelihood algorithm and Polya urn model. Bull. Surv. Mapp., 36–43+49. doi:10.13474/j.cnki.11-2246.2018.0107
Kc, B., and Race, D. (2020). Outmigration and land-use change: a case study from the middle hills of Nepal. Land 9, 2. doi:10.3390/land9010002
Khanal, N. R., and Watanabe, T. (2006). Abandonment of agricultural land and its consequences. Mt. Res. Dev. 26, 32–40. doi:10.1659/0276-4741(2006)026[0032:aoalai]2.0.co;2
Lasanta, T., Nadal-Romero, E., and Arnáez, J. (2015). Managing abandoned farmland to control the impact of re-vegetation on the environment. The state of the art in Europe. Environ. Sci. Policy 52, 99–109. doi:10.1016/j.envsci.2015.05.012
Lin, Y., and Guo, J. (2024). Fuzzy geospatial objects − based wetland remote sensing image Classification: a case study of Tianjin Binhai New area. Int. J. Appl. Earth Obs. Geoinformation 132, 104051. doi:10.1016/j.jag.2024.104051
Liu, B., and Song, W. (2023). Mapping abandoned cropland using Within-Year Sentinel-2 time series. CATENA 223, 106924. doi:10.1016/j.catena.2023.106924
Liu, B., Song, W., and Sun, Q. (2022). Status, trend, and prospect of global farmland abandonment research: a bibliometric analysis. Int. J. Environ. Res. Pub. He. 19, 16007. doi:10.3390/ijerph192316007
Luo, K., and Moiwo, J. P. (2022). Rapid monitoring of abandoned farmland and information on regulation achievements of government based on remote sensing technology. Environ. Sci. Policy 132, 91–100. doi:10.1016/j.envsci.2022.02.019
Ma, L., Li, M., Ma, X., Cheng, L., Du, P., and Liu, Y. (2017). A review of supervised object-based land-cover image classification. ISPRS-J. Photogramm. Remote Sens. 130, 277–293. doi:10.1016/j.isprsjprs.2017.06.001
Qi, Y., Pei, L., Zhang, Z., Wei, X., and Wang, X. (2017). The study of remote sensing image analysis method based on fuzzy ISODATA clustering. Sci. Surv. Mapp. 42, 139–146. doi:10.16251/j.cnki.1009-2307.2017.07.023
Ramírez-Cuesta, J. M., Minacapilli, M., Motisi, A., Consoli, S., Intrigliolo, D. S., and Vanella, D. (2021). Characterization of the main land processes occurring in Europe (2000-2018) through a MODIS NDVI seasonal parameter-based procedure. Sci. Total Environ. 799, 149346. doi:10.1016/j.scitotenv.2021.149346
Rey Benayas, J. M., and Bullock, J. M. (2012). Restoration of biodiversity and ecosystem services on agricultural land. Ecosystems 15, 883–899. doi:10.1007/s10021-012-9552-0
Rizayeva, A., Nita, M. D., and Radeloff, V. C. (2023). Large-area, 1964 land cover classifications of Corona spy satellite imagery for the Caucasus Mountains. Remote Sens. Environ. 284, 113343. doi:10.1016/j.rse.2022.113343
Story, M., and Congalton, R. G. (1986). Accuracy assessment: a user’s perspective. Photogramm. Eng. Remote Sens. 52, 397–399. doi:10.1016/0031-0182(86)90068-4
Tong, H., Maxwell, T., Zhang, Y., and Dey, V. (2012). A supervised and fuzzy-based approach to determine optimal multi-resolution image segmentation parameters. Photogramm. Eng. Remote Sens. 78, 1029–1044. doi:10.14358/pers.78.10.1029
Wang, C., Wang, A., Wang, J., Wang, R., and Jiang, Z. (2014). Coastal zone land use information extraction based on objectoriented classification method. J. Nat. Resour. 29, 1589–1597. doi:10.11849/zrzyxb.2014.09.013
Wang, K., Sun, J., Zhang, J., and Qi, Y. (2022). Spatiotemporal variation of seasonal abandoned farmland in the Western Guanzhong Plain of Shaanxi based on GEE. J. Northwest A. F. Univ. 50, 106–115. doi:10.13207/j.cnki.jnwafu.2022.10.011
Wang, Y., Li, J., and Kong, X. (2022). What drives land abandonment in core grain-producing areas? Evidence from China. Int. J. Environ. Res. Pub. He. 19, 5090. doi:10.3390/ijerph19095090
Wang, Y., Li, X., Xin, L., and Tan, M. (2020). Farmland marginalization and its drivers in mountainous areas of China. Sci. Total Environ. 719, 135132. doi:10.1016/j.scitotenv.2019.135132
Wang, Y., Yang, A., and Yang, Q. (2023). The extent, drivers and production loss of farmland abandonment in China: evidence from a spatiotemporal analysis of farm households survey. J. Clean. Prod. 414, 137772. doi:10.1016/j.jclepro.2023.137772
Wei, Z., Gu, X., Sun, Q., Hu, X., and Gao, Y. (2021). Analysis of the spatial and temporal pattern of changes in abandoned farmland based on long time series of remote sensing data. Remote Sens. 13, 2549. doi:10.3390/rs13132549
Xue, L., Ning, S., and Wang, Y. (2009). Segment-based land use change detection using the similarity of vector. Remote. Inf., 7–10+19. doi:10.3969/j.issn.1000-3177.2009.06.002
Yang, W., Zhang, Y., Yi, X., and Wang, J. (2016). Construction of ratio build - up index for GF- 1 image. Remote Sens. Nat. Resour. 28, 35–42. doi:10.6046/gtzyyg.2016.01.06.04
Yi, W. (2023). Forest Swamp information extraction and accuracy evaluation based on multispectral remote sensing images of Sentinel-2. J. Shandong Agric. Univ. Nat. Sci. Ed. 54, 490–494. doi:10.3969/j.issn.1000-2324.2023.04.002
Yi, X., Jiang, W., Ling, Z., Wang, X., and Deng, Y. (2023). Evaluation and fusion of global 10 m land cover data in first batch of Chinese wetland cities. Natl. Remote. Sens. Bull. 27, 1334–1347. doi:10.11834/jrs.20233058
Yu, D., Lin, Z., Yang, X., and Zheng, H. (2022). The study on the transformation and sustainability of farmers’ livelihoods in suburban industrial villages: a case of Xinzhou Village and Xijiang Village in Nanchang. J. Jiangxi Norm. Univ. Soc. Sci. Edit. 46, 426–433. doi:10.16357/j.cnki.issn1000-5862.2022.04.15
Yu, Q., Hu, Q., Wu, H., and Wu, W. (2024). View from above: farmland infrastructure and its impacts on agricultural landscapes. Innov. Geosci., 100107–100113. doi:10.59717/j.xinn-geo.2024.100107
Yuan, X., Xue, N., and Han, Z. (2021). A meta-analysis of heavy metals pollution in farmland and urban soils in China over the past 20 years. J. Environ. Sci. 101, 217–226. doi:10.1016/j.jes.2020.08.013
Yuan, Y., Ye, X., Liu, T., and Li, X. (2024). Spatio-temporal characteristics of integrated drought in Poyang Lake basin based on multi-source remote sensing data. Resour. Environ. Yangtze Basin. 33, 214–227. doi:10.11870/cjlyzyyhj202401018
Zhang, S., Chen, J., and Gong, J. (2016). Object-oriented classification based on C5.0 algorithm. Sci. Surv. Mapp. 41, 117–121+125. doi:10.16251/j.cnki.1009-2307.2016.06.025
Zhang, Y., Chen, Y., Xue, Y., and Lin, J. (2019). Construction of urban built-up index oriented to GF-1 WFV image. Geomat. Spat. Inf. Technol. 42, 84–88.
Zhao, X., Wu, T., Wang, S., Liu, K., and Yang, J. (2023). Cropland abandonment mapping at sub-pixel scales using crop phenological information and MODIS time-series images. Comput. Electron. Agric. 208, 107763. doi:10.1016/j.compag.2023.107763
Zheng, Q., Ha, T., Prishchepov, A. V., Zeng, Y., Yin, H., and Koh, L. P. (2023). The neglected role of abandoned cropland in supporting both food security and climate change mitigation. Nat. Commun. 14, 6083–6113. doi:10.1038/s41467-023-41837-y
Zheng, X., Chen, Z., and Wei, X. (2023). The impact of construction land expansion on the landscape fragmentation of cultivated land in the Poyang Lake ecological economic zone. Agri. Resour. Environ., 1–15. doi:10.13254/j.jare.2023.0285
Zhu, X., Xiao, G., Zhang, D., and Guo, L. (2021). Mapping abandoned farmland in China using time series MODIS NDVI. Sci. Total Environ. 755, 142651. doi:10.1016/j.scitotenv.2020.142651
Keywords: abandoned farmland, object-oriented technology, GF-1, spatial pattern, China
Citation: Liang Y, Liang Y and Tu X (2024) Identification and spatial pattern analysis of abandoned farmland in Jiangxi Province of China based on GF-1 satellite image and object-oriented technology. Front. Environ. Sci. 12:1423868. doi: 10.3389/fenvs.2024.1423868
Received: 26 April 2024; Accepted: 11 November 2024;
Published: 20 November 2024.
Edited by:
Jun Li, China University of Mining and Technology, ChinaReviewed by:
Wei Zhao, Chinese Academy of Sciences (CAS), ChinaYongsheng Wang, Chinese Academy of Sciences (CAS), China
Copyright © 2024 Liang, Liang and Tu. This is an open-access article distributed under the terms of the Creative Commons Attribution License (CC BY). The use, distribution or reproduction in other forums is permitted, provided the original author(s) and the copyright owner(s) are credited and that the original publication in this journal is cited, in accordance with accepted academic practice. No use, distribution or reproduction is permitted which does not comply with these terms.
*Correspondence: Xiaosong Tu, dHV4aWFvc29uZ0BqeHVmZS5lZHUuY24=
 Yang Liang1
 Xiaosong Tu