 Zhiping Guo1
 Chaohua Xiong1,2*
- 1School of Economics and Management, Guangxi University of Science and Technology, Liuzhou, China
- 2School of Civil Engineering and Architecture, Guangxi University of Science and Technology, Liuzhou, China
Introduction:: At different times, China has pursued different carbon emission reduction targets, so it is crucial to develop a reasonable and flexible allocation scheme for Chinese carbon emissions quotas, referred to as Chinese Emission Allowance (CEA), in order to achieve carbon reduction goals. As important responsible entities for carbon reduction, each province needs to rely on a well-designed CEA allocation scheme to help achieve their emission reduction goals.
Methods:: Therefore, based on the utility perspective, this paper constructs allocation principles and methods to formulate the inter-provincial CEA allocation scheme for China in 2030. Specifically, the entropy method, SBM model, improved variable weight function, and ARIMA time series model are sequentially adopted to simulate the re-allocation scheme, examine its rationality, and develop CEA allocation schemes under different principles.
Results and Discussion:: The following conclusions are drawn: 1) The allocation scheme formulated based on historical emission simulation methods, industry benchmark methods, and other current CEA allocation methods has certain irrationality, and future CEA allocation should not follow the original methods; 2) The improved variable weight function is better suited for allocation in CEA than the current original allocation method. The allocation scheme developed under this method, which balances fairness and efficiency principles, is more appropriate for the actual reduction of carbon emissions in China.
1 Introduction
From 2007 to 2022, China has consistently been the world’s largest emitter of carbon dioxide and the largest consumer of energy. This underscores China’s significant responsibility in addressing climate change and, at the same time, facing substantial pressure for carbon emission reduction. In response, China has decided to implement a series of measures to reduce carbon emissions, with the most crucial being the establishment of a nationwide carbon emissions trading market. The fundamental logic of its operation is to convert carbon emission targets into corresponding CEA totals, initially allocated to various provinces nationwide and then further distributed by each province to specific key emission units. However, due to differences among Chinese provinces in terms of industrial distribution, economic development stages, and emission reduction technologies, the issue of imbalanced carbon emissions among provinces has become particularly prominent (Cong et al., 2022). Consequently, there are varying demands for CEA among provinces. If these demands can be met to different extents, it can enhance the enthusiasm of provinces for carbon reduction, facilitating the overall carbon reduction efforts in China. Therefore, to promote the orderly development of the national carbon emissions trading market (Lin and Huang, 2022) and accelerate the achievement of the “dual-carbon” goals, it is necessary to formulate a reasonable CEA allocation plan that caters to the diverse needs of each province.
In previous studies regarding CEA allocation, the majority of scholars tend to focus on studying CEA allocation schemes from a shallow path perspective, directly investigating CEA allocation schemes under different allocation principles and methods. This is because the formulation of allocation plans requires appropriate allocation principles as allocation guidelines (Zhao and Yang, 2022), using a rational allocation method as the allocation tool. While some literature (Wang and Ge, 2022) provides important references for specific CEA allocation plans, there are still issues such as the complexity of implementing allocation methods. In order to better formulate CEA allocation schemes, some scholars have started conducting research from a deep path perspective, which involves constructing allocation principles and methods from different perspective, including supply and demand, output, and other viewpoints (Wang et al., 2019; Ll et al., 2022). The rationality of the CEA allocation scheme mainly lies in its ability to meet the needs of various provinces for CEA. In economics, “utility” is generally used to represent the degree to which a subject’s demand is satisfied by a product, that is, the “satisfaction” (LIESIO and VILKKUMAA, 2021). Therefore, the extent to which the allocated CEA can meet the needs of each province can be measured using “utility”. Moreover, the level of utility in CEA allocation directly affects the implementation of carbon reduction efforts. However, currently, there are very few scholars conducting in-depth research from the utility perspective. Additionally, with changes in climate and the Chinese context, carbon reduction targets also change. The different carbon reduction targets can be understood as the need to consider CEA allocation based on different allocation principles. Therefore, the question of “which allocation method should be used to flexibly and simply formulate CEA allocation schemes” remains unanswered.
Therefore, in order to develop a CEA allocation scheme that can meet the needs of various provinces in China and comply with the requirements of carbon emission reduction targets, this paper aims to conduct in-depth research and develop a future CEA allocation scheme. Specifically, we will construct distribution principles and methods from a utility perspective to formulate a reasonable inter-provincial CEA allocation scheme for China in 2030. On one hand, we will construct fairness and efficiency principles based on the “utility” indicator in the distribution principles. On the other hand, in the allocation method, this paper uses a variable weight function to construct the objective function of maximizing the utility of CEA allocation, improves the variable weight function, and thus flexibly formulates the Chinese CEA allocation scheme under different allocation principles. This will help achieve the dual carbon targets, facilitate carbon emission reduction work, provide a new, simple, and flexible CEA allocation scheme, and enhance the enthusiasm and compliance rate of provinces as responsible entities for carbon emission reduction.
Consequently, this article’s innovation mainly lies in two aspects. Firstly, it innovates the research perspective by constructing allocation principles and methods based on the utility perspective to develop a reasonable CEA allocation scheme that meets the needs of various provinces. This not only provides a new approach for studying CEA allocation schemes but also broadens the research perspective in the field of resource allocation. Secondly, it innovates the research methods by proposing a method of improving the variable weight function for CEA allocation, which involves using corresponding weighting functions under different principles. This enriches the CEA allocation schemes and provides a flexible and simple method for formulating and adjusting CEA allocation schemes based on changes in carbon emission reduction targets.
The remaining structure of this article includes a review and summary of relevant literature in Part 2, an introduction of the methods and data used to develop specific CEA allocation schemes in Part 3, an analysis of the results in Part 4, and a conclusion of the research findings, as well as an explanation of shortcomings and future research directions in Part 5.
2 Literature review
In the context of carbon emission reduction, CEA allocation has become a current research hotspot in the field of carbon. Based on the review of relevant literature, it is found that due to different research paths, it can be categorized into two types. The first is the shallow path, which directly investigates CEA distribution plans under different allocation principle (Dong et al., 2018; Zhang et al., 2023) and allocation methods (Zhang and Hao, 2017; LIESIO and VILKKUMAA, 2021). The second is the deep path, which starts by studying allocation principles and methods from different perspectives and then delves into CEA distribution plans. As this paper chooses to study CEA distribution plans along the deep path, a comprehensive review of relevant literature under different research perspectives in this approach is conducted. Furthermore, the text proposes a novel methodology that can cater to the requirements of diverse regions and create adaptable CEA allocation strategies. It endeavors to incorporate utility-based value functions into CEA allocation. Therefore, a focused review of existing research involving allocation methods and variable weighting functions is also carried out.
2.1 Research perspective
While only a small portion of the literature currently delves into the deep pathways of studying CEA allocation issues, in recent years, this approach has gained increasing attention from scholars exploring it from various perspectives. Li et al. (2022), based on a supply-demand perspective, proposed a dynamic adjustment scheme that utilizes price feedback as a response signal. This scheme aims to rapidly reduce the supply risk of CEA. The price mechanism, which is influenced by supply and demand, itself embodies the principles of fair and efficient distribution. Wang et al. (2019), based on an output perspective, constructed a CEA allocation model using the production levels of various sectors as constraint conditions. Using production levels as constraint conditions reflects the consistency of CEA allocation with production levels, embodying the principle of feasibility (Fang et al., 2019).
The utility perspective essentially represents the demand perspective, but there is a lack of scholars considering this issue from a utility perspective. The level of CEA allocation utility directly affects the implementation of carbon emission reduction efforts. One important reason for this may be that the utility assigned to CEA is the satisfaction that each province obtains from the allocation of CEA. Specifically, it can be understood as whether the allocated CEA meets the province’s demand for carbon emissions reduction, and whether it brings about certain benefits. However, quantifying this satisfaction is challenging and comes with a strong subjective component.
2.2 Allocation methods
In terms of allocation methods, there are four broad categories: indicator method, optimization method, game theory method, and hybrid method. Tian et al. (2022) utilized the entropy value method and expert survey method to construct a comprehensive indicator-based allocation of CEA based on historical data, demand, contribution, and other factors. The optimization method, specifically the Data Envelopment Analysis (DEA) model, has been widely used in recent years. Cui et al. (2021) optimized the allocation of CEA in various provinces in China using the ZSG-DEA model. As CEA allocation involves balancing and negotiating the interests of multiple parties, some scholars have considered using game theory methods to achieve the best carbon emission reduction effect. Yao et al. (2023) developed a stochastic game-theoretic model based on existing game theory models and analyzed its feasibility for carbon quota allocation. However, due to the subjectivity in indicator selection, the inconstancy of weight assignment, and the opacity of the game process in these three methods, more scholars choose to use a hybrid method for CEA allocation. Zhao and Yang (2022) proposed a new allocation framework that combines the DEA model with Genetic Algorithm (GA) in a dual-level allocation scheme (DLA-GA). Wang and Ge (2022) also studied the allocation of CEA from multiple dimensions using the entropy value method and the Modified Fixed Cost Allocation Model.
From the above literature, it can be observed that scholars, whether focusing on distribution principles or distribution methods, tend to consider multiple aspects when studying CEA distribution schemes, aiming to obtain more reasonable distribution plans. However, due to the changes in carbon reduction goals, governments need to adjust CEA distribution schemes promptly. Different carbon reduction targets are often reflected in ways guided by different distribution principles. This makes the question of “which distribution method should be adopted to flexibly and simply formulate CEA distribution plans” an urgent issue that needs to be addressed.
2.3 Variable weight function
The weighting function is generated based on the concept of weighting, which was proposed by Li and HAO (2014) after conducting research on other studies. This concept takes into account the significance of fundamental factors and the balance of conditions to enhance the objectivity in selecting indicators. Additionally, a more practical and adaptable index-type state weighting vector was also established. This research offers the possibility of utilizing weighting functions to develop CEA allocation plans based on different principles. Moreover, Yu (2018) demonstrated that weighting functions are defined and constructed based on utility indicators in decision-making problems. Therefore, Moradian and Kia (2021) used a variable weight function for resource allocation in their study on generators. In recent years, weighting concepts and functions have been commonly adopted in evaluation fields. For instance, Liu et al. (2018), Li et al. (2023) and others utilized them to evaluate the vulnerability of countries and food import risks, respectively. Furthermore, improved the variable weight function is extensively implemented in this area. Wu et al. (2023) improved the existing weighting models used to assess the risk of water inrush in coal seam floor, as determining weighting parameters was cumbersome.
While previous studies have attempted to apply variable weighting ideas and functions to various fields, there is limited research applying them to the field of CEA allocation. Therefore, this paper attempts to construct distribution principles and methods based on the utility perspective, utilizing variable weighting functions. It builds an objective function that maximizes the utility of CEA allocation in China, solves for variable weighting parameters under different allocation principles, and formulates CEA allocation plans under different principles based on an improved variable weight function. Additionally, considering the difficulty of expressing other allocation principles, such as feasibility, in utility form, this paper mainly formulates CEA allocation plans for fairness, efficiency, and fairness-efficiency principles in China for the year 2030, with a subsequent analysis to determine the final allocation plan.
3 Methods and data
3.1 Methods
This paper investigates the 2030 inter-provincial CEA allocation scheme in China based on the utility perspective, the specific details are shown in Figure 1. Firstly, taking the year 2020 as an example, the entropy method is employed to simulate the current inter-provincial allocation method of China’s CEA and formulate allocation plan. Secondly, the SBM (Slacks-Based Measure) model is utilized to examine whether there is any irrationality in the current allocation scheme. Thirdly, if no irrationality is found, the original allocation method will be continued for the year 2030. However, If there are any unreasonable aspects, try using a method of improving the variable weight function. From the utility perspective, a CEA objective function is constructed using improvement of the variable weight function. Different weight parameters β values are obtained, and then, based on the ARIMA time series model predicting the total CEA quantity in 2030, various allocation schemes for inter-provincial CEA are formulated using the variable weight parameters β and an improved variable weight function.
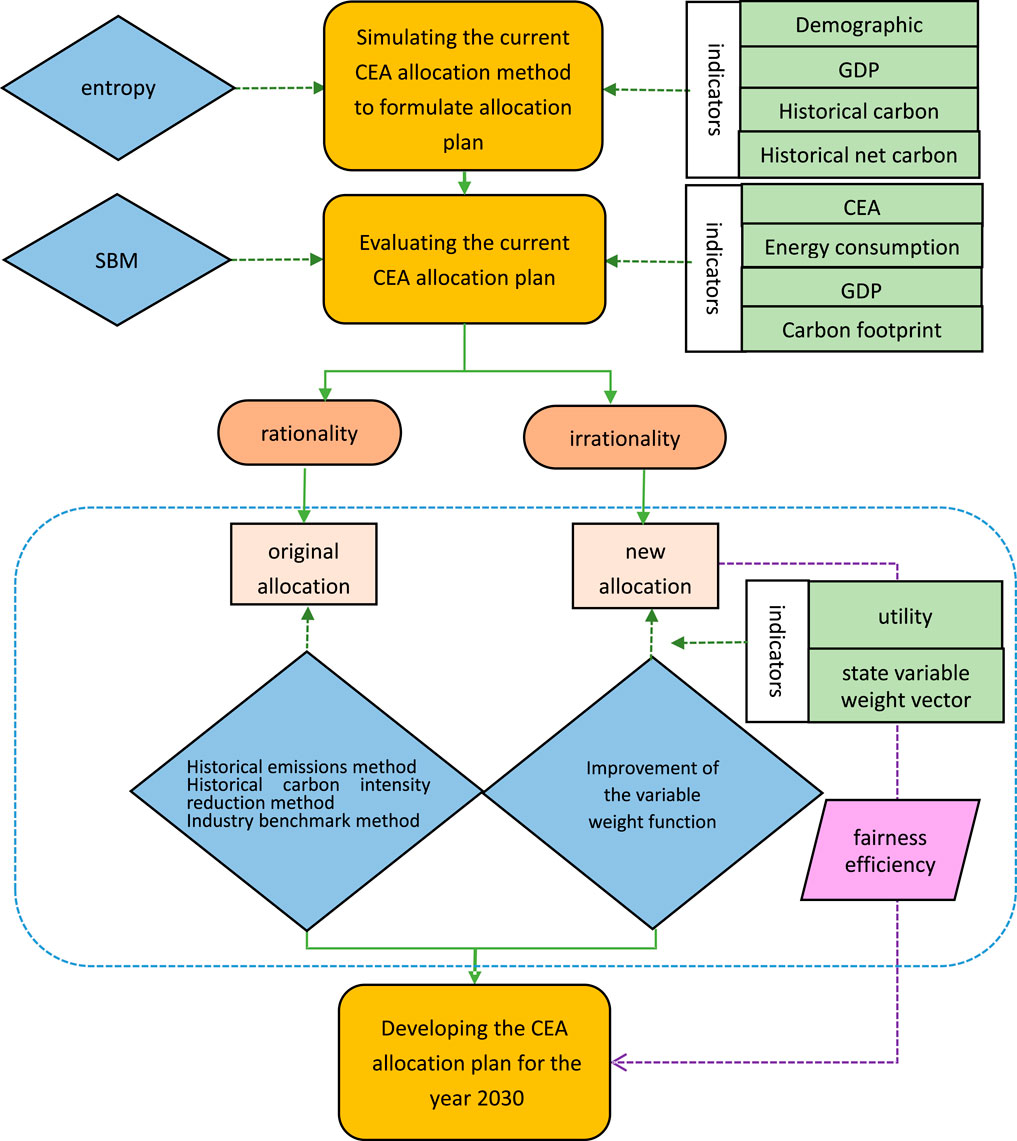
Figure 1. Research framework.
3.1.1 Developing and simulate the current allocation plan for CEA
3.1.1.1 Entropy method
According to the framework, the first issue addressed in this paper is to examine whether the current inter-provincial CEA allocation scheme in China has any irrationality. To do so, taking the year 2020 as an example, the entropy method is initially employed to simulate the current CEA allocation method and formulate an allocation scheme. Subsequently, the SBM model is utilized to scrutinize this allocation scheme. Due to the current distribution methods in China, which mainly include historical emission methods, historical carbon intensity reduction methods, and industry baseline methods, they are all, in fact, based on the distribution of CO2 emission. Therefore, this paper draws inspiration from Li’s study on the allocation of CEA in the cities of the BOHAI Economic Rim. Li et al. (2021a) used CO2-related indicators, namely, population, GDP, historical CO2, and historical cumulative net CO2 emissions. The entropy method is then applied to allocate CEA, making the allocation scheme more closely aligned with the current practical CEA allocation scheme. Formulas 1–7 are provided for specific cases, where i denotes provinces (i = 1,2,30, as defined in the following text), and j denotes indicators (j = 1,2,30, as defined in the following text).
Normalize the indicators by defining Zij as the normalized value of Pij, where Pij represents the value of indicator j in province i:
To calculate the entropy value of a given indicator, denoted by nij, we need to first determine the share of that indicator in the total sum of all provinces’ values for that indicator. This share is represented by yij.
Calculate the weight, rj, for each indicator j:
Build composite index hi:
Calculate the weight wi of province i:
Finally, the allocated amount of DEA for each province should be calculated, using C2020 as the total CEA amount in 2020.
3.1.1.2 SBM model
The SBM model, as one of the DEA (Data Envelopment Analysis) models, not only calculates the input-output ratio of input variables but also considers the redundancy of input variables. Therefore, by taking the allocated CEA as the input variable, the SBM model can assess whether the current CEA allocation scheme has issues of wastefulness based on its redundancy. It is worth noting that this is to examine the rationality of the current allocation scheme, not to optimize it. The SBM formula is represented as (3.8), where xio denotes the input variable, yro represents the expected output, bko represents the non-expected output, and si represents redundancy. Since data for the Tibet region is missing, this paper considers a total of 30 Decision Making Unit (DMU), and with the assistance of the DEARUN software, the redundancy of CEA for each province is calculated.
3.1.2 Formulating a new allocation plan for CEA in 2030
This paper endeavors to allocate CEA via a novel approach, where utility is first constructed as the basis for distribution principles, followed by the construction of a distribution method through utility and weight functions. Subsequently, improving the variable weight function. Finally, the ARIMA model was employed to forecast the total CEA in China for 2030. Developing a provincial inter-regional CEA allocation scheme for China in 2030.
3.1.2.1 Constructing allocation principles
As this article adopts a deep-path study of the distribution scheme of China’s CEA, the distribution principles are constructed based on utility, with a primary focus on fairness, efficiency, and a combination of both fairness and efficiency. Therefore, drawing inspiration from indicators used to measure income distribution fairness, the Gini Coefficient of individual utility is selected as the indicator to measure the fairness of CEA distribution. When the Gini Coefficient is 0, fairness is maximized. Based on the research of other scholars (MORADIAN H and KIA, 2021) using variable weight functions in resource allocation domains, the mean of individual utility is chosen as the main indicator to measure the efficiency of CEA distribution. Finally, using Matlab software and the FMINCON function for optimization, the variable weight parameters corresponding to fairness and efficiency values under different conditions are calculated. Ultimately, by computing the ratio of efficiency loss to fairness loss, the variable weight parameters under different distribution principles are determined. The specific formula is given by (Equation 9), where F represents fairness, E represents efficiency, FF is the optimal solution for fairness, EE is the optimal solution for efficiency, WF is the fairness loss, WE is the efficiency loss, and ρ is the ratio of fairness to efficiency loss.
Among them:
3.1.2.2 The variable weight function
As this paper adopts a utility-based perspective to construct allocation methods, it utilizes a variable weight function to formulate the objective function for maximizing CEA allocation utility, and thus, establishes a new allocation approach. The CEA objective function is primarily composed of the variable weight function and individual utility (Equation 10), where the variable weight function is represented as the normalized Hardarmard product of the constant weight vector and the state weight vector (Equation 11). The state weight vector is crucial for achieving a reasonable CEA distribution. In CEA allocation issues, governments typically focus more on provinces with higher carbon emissions. Traditional methods, such as allocating based on historical emissions, tend to indirectly encourage provinces with higher historical emissions. However, the state weight vector in the variable weight function considers the variation in weight status, enhancing the importance of smaller entities in decision-making. Therefore, the choice of the state weight vector is critical.
In Equation 10, U represents the total utility, vi represents the variable weighting function, and ui denotes individual utility.
In Equation 11, Wi denotes the constant weight vector and Si(x) represents the state variable weight vector.
Commonly, there are three types of state weighting vectors, and the specific choice needs to be considered from the perspective of balancing force values. While the importance of individuals with smaller utility is increased using the weighting function, it is also undesirable for the weights after weighting to be overly concentrated on individuals with the smallest state values. Therefore, the first two forms of weighting vectors are not suitable for application in the CEA distribution problem. On the contrary, exponential-type weighting vectors can reflect different degrees of balancing force by setting different weighting parameters. Leveraging these weighting parameters, flexibility in the distribution of CEA among provinces can be achieved. Hence, this paper mainly chooses to use this type of weighting vector to establish the weighting function for CEA distribution.
(1) The empirical formula:
(2) Additive equilibrium functions:
(3) Exponential form:
The weighting function not only needs to determine the state weighting function but also define the constant weight as an indicator. Considering two aspects, on the one hand, due to significant differences in actual carbon emissions among provinces, their demand for CEA also varies. Only when demand is not considered, should the constant weights be equal among provinces, but this is obviously not suitable for CEA distribution. On the other hand, the size of the constant weight also reflects the importance assigned by decision-makers to individuals. As mentioned earlier, the government usually emphasizes provinces with higher carbon emissions due to considerations of the magnitude of emission reduction pressure. Therefore, this paper chooses to use the mean of the actual carbon emissions (Di) of each province in the past 5 years as the constant weight for each province, as shown in Equation 12.
In addition, quantifying individual utility is necessary for constructing the CEA objective function, which reflects the impact of CEA distribution on each province, i.e., the satisfaction generated by each province with the allocated CEA. Although surplus CEA can be traded on the carbon emission trading platform to obtain some income with positive benefits (Zhao et al., 2022), the remaining CEA cannot be stored in the long term to offset future carbon emissions. Additionally, an excess of remaining CEA can lead to lower carbon emission permit prices, reducing income from selling. Therefore, CEA exhibits diminishing marginal utility. Hence, a marginal utility diminishing parameter p ∈ (0,1) is introduced. This parameter is challenging to directly obtain, but when using the SBM model, GDP and carbon emissions are considered as expected and non-expected outputs, respectively. Thus, the mean value of the ratio of GDP to carbon emissions in recent years is chosen as the value of the marginal utility p, i.e., the ratio of expected output to non-expected output. Therefore, the specific formula for individual utility is as shown in Equation 13, where ui represents the utility function for each province, xi is the actual CEA obtained, ci is the CEA input-output ratio for each province, m is the total CEA in 2020, and p = 0.8.
So, by substituting the exponential weight vector into Equation 11, we obtain Equation 14. Substituting this into Equation 10 and combining it with Equation 13, we get the final CEA objective function based on the weight function, as shown in Equation 15. The constraint is that the sum of the CEA obtained by the 30 provinces in China, excluding Tibet, must not exceed the total CEA for the country, denoted as m.
3.1.2.3 Improvement of the variable weight function
Based on the formulas related to the CEA fairness efficiency loss ratio and objective function, the value of the weight parameter β is obtained by comparing the efficiency principle, fairness principle, and the principle of fairness and efficiency. While the weighting function in the fairness distribution can also be used as a weight for predicting the CEA distribution, it is essential to consider that in the original weighting function, the β parameter is inversely proportional to the weighting function. Additionally, small changes in β can lead to a considerable change in the state weighting vector, causing a severe two-level differentiation of the weighting function, which does not align with the principle of fair distribution from the perspective of distribution differences. Therefore, in calculating the distribution under the fairness principle, the original weighting function formula is adjusted to the form of Wi × [1 - Si(X)]. For the principles of fairness and efficiency, both their weighting functions should be used, leading to the issue of the weights of the two. If a uniform weight of 0.5 is adopted, it is meaningless. However, as this study obtains the β values for fairness and efficiency separately in the second step, an attempt is made to use the respective β values’ proportions as weights. Given that the efficiency parameter proportion is generally smaller, multiplying it with the corresponding β value helps avoid the problem of significant differences in distribution. Therefore, the final formula for predicting CEA distribution is as shown in Equation 16.
3.1.2.4 ARIMA forecast of total CEA
In order to predict the total carbon emissions in China for the year 2030, a basic analysis revealed a linear correlation between GDP and time. Therefore, for predicting the total carbon emissions, this study opted to use the most widely-used model in time series forecasting - ARIMA, to forecast the GDP in 2030. Furthermore, taking into account the significant pressure China faces in reducing carbon emissions, this study set the target for reducing carbon intensity at 60%.The formula is presented as (3.17), where M represents the predicted CEA total, and I represents carbon intensity.
3.2 Data
In this study, a sequential approach involving the entropy method, SBM model, weighting function, ARIMA time series model, and improved weighting function is employed. The indicators used include population, GDP, historical CO2 emissions, net cumulative CO2 emissions, and total energy consumption. The net cumulative CO2 emissions refer to the deduction of plant-absorbed CO2 from the CO2 emissions. Specifically, data on population, GDP, total energy consumption, and vegetation area are obtained from the “Statistical Yearbook” of each province. Historical CO2 emissions are calculated using the accounting method proposed by Cong et al. (2014), utilizing the IPCC (2006) method specified in the “National Greenhouse Gas Emission Inventory Guidelines.” This involves calculating the sum of the latest specified emissions in the three carbon emission scopes, resulting in the actual carbon emissions for each province. The specific accounting data are derived from the “China Energy Statistical Yearbook,” “General Guidelines for Comprehensive Energy Consumption Calculation,” and the China Carbon Accounting Database (CEADs), among other sources.
4 Results and analysis
4.1 The current CEA allocation plan needs adjustment
Figure 2 depicts the simulation results of the current inter-provincial CEA allocation in China using the entropy method. As shown in the figure, provinces such as Guangdong, Shandong, Jiangsu, and Shanghai receive more CEA. This is mainly attributed to the higher population, GDP, and CO2 emissions in the eastern regions. However, the relatively low forest and vegetation areas result in increased net CO2 emissions. On the other hand, provinces like Inner Mongolia and Qinghai, with lower populations and extensive forest and grassland areas, absorb a significant amount of CO2, leading to lower net emissions and consequently receiving fewer CEA. Although there are some differences compared to the distribution of CEA reported in the “First Compliance Cycle Report of the National Carbon Emission Trading Market” released in 2022, this is mainly because the mentioned report only covers the allocation of CEA in the power generation industry. However, data from other sources, such as “Review and Outlook of China’s Carbon Market,” show consistency with the results obtained through the entropy method. Therefore, it can be generally considered that this study accurately simulates the current inter-provincial CEA allocation in China using the entropy method.
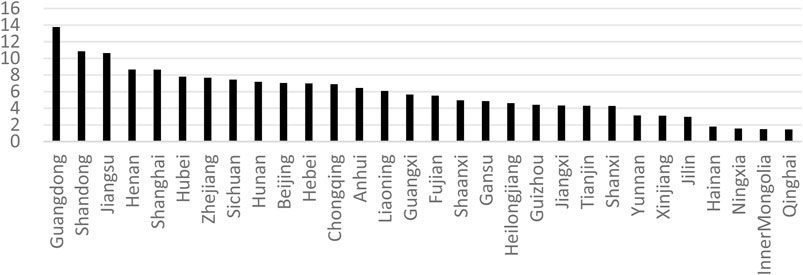
Figure 2. Current CEA allocation scheme.
Table 1 provides an examination of the distribution results. Firstly, it is evident that among the 30 provinces, only Beijing, Guangdong, Jiangsu, Inner Mongolia, Qinghai, and Ningxia had zero redundancy in their 2020 CEA allocations. Secondly, provinces such as Guangi, Shanxi, Liaoning, and Gansu exhibited higher redundancy in their CEA allocations. Additionally, Shandong ranked first in the quantity of CEA obtained in 2020, but its redundancy was as high as 2.96. This is primarily due to its elevated historical carbon emissions and a GDP gap compared to regions like Guangdong and Jiangsu. It indicates a substantial degree of waste in Shandong’s CEA allocation, suggesting a need for a reduction in the allocated CEA amount. These findings underscore the significant issue of waste in the inter-provincial distribution of CEA. Therefore, the future allocation of CEA among Chinese provinces should not continue based on the current distribution scheme and requires adjustment.
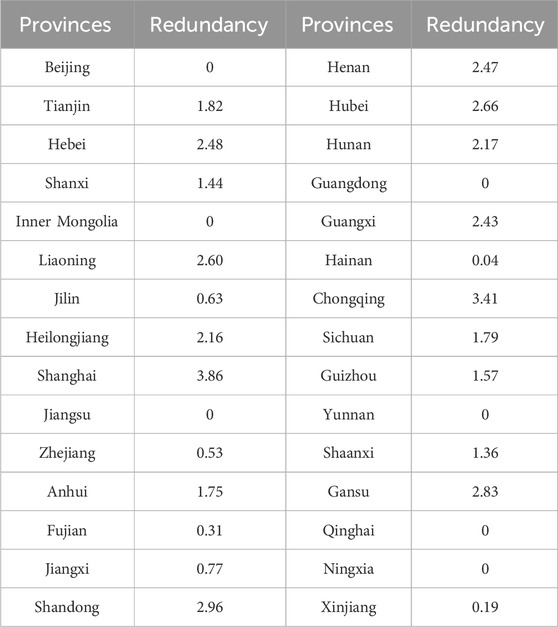
Table 1. The redundancy of CEA for each province.
4.2 The new allocation plan for CEA in 2030
4.2.1 The variable weighting parameter β
To flexibly and conveniently adjust the CEA distribution scheme under different allocation principles, this study utilized the FMINCON function in Matlab to determine the values of variable weight parameters for which the Gini Coefficient and mean utility of each province were obtained under different conditions of fairness and efficiency, as shown in Figure 3. Overall, as the variable weight parameter gradually increased, the fluctuation amplitude of CEA distribution fairness remained relatively small, while efficiency showed a strict decreasing trend after β = 4. Specifically, from a fairness perspective, when β = 17, the Gini Coefficient of utility was minimized. A smaller Gini Coefficient indicates a more equitable distribution. Therefore, this β value is considered the variable weight parameter for fairness orientation. Additionally, since the Gini Coefficient at this point is 0.27, it implies that achieving absolute fairness in CEA distribution is challenging regardless of the value of the variable weight parameter; what can be achieved is relative fairness in distribution. From an efficiency standpoint, when β = one to four, the mean utility was consistently 174.25, the maximum value. However, based on the analysis of the current distribution scheme, there is significant waste in inter-provincial CEA distribution. Therefore, individual provinces should not receive excessively large amounts of CEA. Consequently, this study chose β = 1 as the variable weight parameter for efficiency orientation. It was also observed that the maximum value of mean utility coincided with the total CEA distribution in China, indicating a certain relationship between the efficiency of CEA distribution and its total allocation.
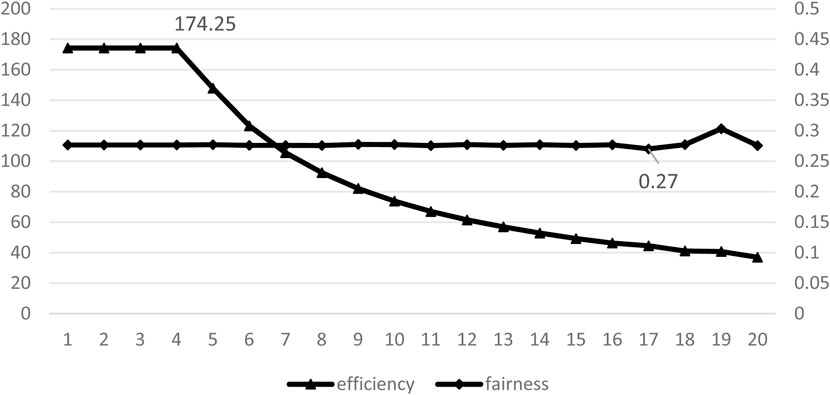
Figure 3. Equity and Efficiency of CEA Allocation under Different β
As this paper explores the CEA allocation scheme considering both fairness and efficiency principles, further determination of the β values was conducted by calculating the efficiency-fairness loss ratio using Formula 9, with specific results illustrated in Figure 4. Although there is a certain range of fluctuations in the efficiency-fairness loss ratio, the overall trend indicates an increase with the growth of β values. On the one hand, according to this figure, it is evident that when β = 1, the ratio is 0. In this scenario, an increase in fairness loss does not lead to a reduction in efficiency loss, emphasizing that a β value of one is preferred when efficiency is the guiding principle. Similarly, when β = 17, the ratio approaches infinity, signifying that an increase in efficiency loss cannot reduce fairness loss. This situation represents the optimal scenario for fairness. On the other hand, considering that 4 = 0 and 5 = 5.92, there must be a∈(4,5), where a = 1. Therefore, when <β < 5, efficiency loss exceeds fairness loss, and as β increases, more efficiency loss is required to achieve a reduction in fairness loss. When 4<β<a, efficiency loss is less than fairness loss, and an increase in β results in a greater reduction in fairness loss with less efficiency loss. Thus, based on the dual principles of fairness and efficiency, the β value should be a, and after further calculation, when a = 4.35, β equals 1. Therefore, β = 4.35 is the preferred β value that balances fairness and efficiency principles.
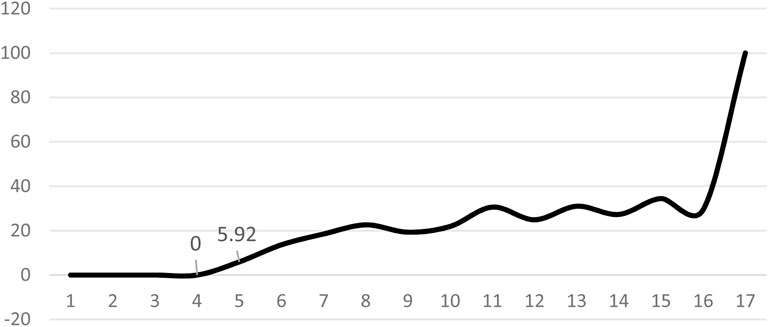
Figure 4. Efficiency to equity loss ratio.
4.2.2 Total CEA in 2030
Based on the ARIMA model used to forecast the 2030 GDP and subsequently applying Formula 17, the calculated total CEA for the year 2030 is 210.73 billion tons. The results differ from the study by GE (2021), mainly due to variations in the chosen reduction rate of carbon intensity. In comparison to the calculation of 253 billion tons by Fang et al. (2018), although some discrepancies exist, it might be attributed to their fixation of GDP growth rate at 6%, resulting in a higher GDP forecast and, consequently, a relatively higher final prediction. However, in reality, the growth rate of GDP is unlikely to remain constant. Therefore, the projected total CEA for China in 2030 in this study appears reasonably justified.
4.2.3 Distributional schemes under different principles
Since the variable weighting parameter β under different allocation principles has been determined, assuming that the total China’s CEA in 2030 is 210.73 billion tons, the allocation scheme for inter-provincial CEA in China in 2030 can be predicted using Formula 16. The allocation schemes guided by different allocation principles are shown in Figures 5–7. Horizontally, there are significant differences in CEA distribution schemes under different principles, especially between those guided by efficiency and fairness. Under the efficiency principle, most CEA is allocated to remote areas such as Inner Mongolia, Qinghai, and Yunnan. Conversely, under the fairness principle, economically developed provinces such as Guangdong, Shanghai, and Beijing receive more CEA, with Guangdong receiving the highest. This may be because under the efficiency principle, the variable weighting parameters are smaller, and remote provinces like Inner Mongolia, due to their lower historical carbon emissions in 2020, receive more CEA even with lower demand. In contrast, provinces with higher population, GDP, and historical CO2 emissions like Guangdong, Shanghai, and Beijing receive more CEA under the fairness principle due to their larger historical emissions and larger variable weighting parameters.
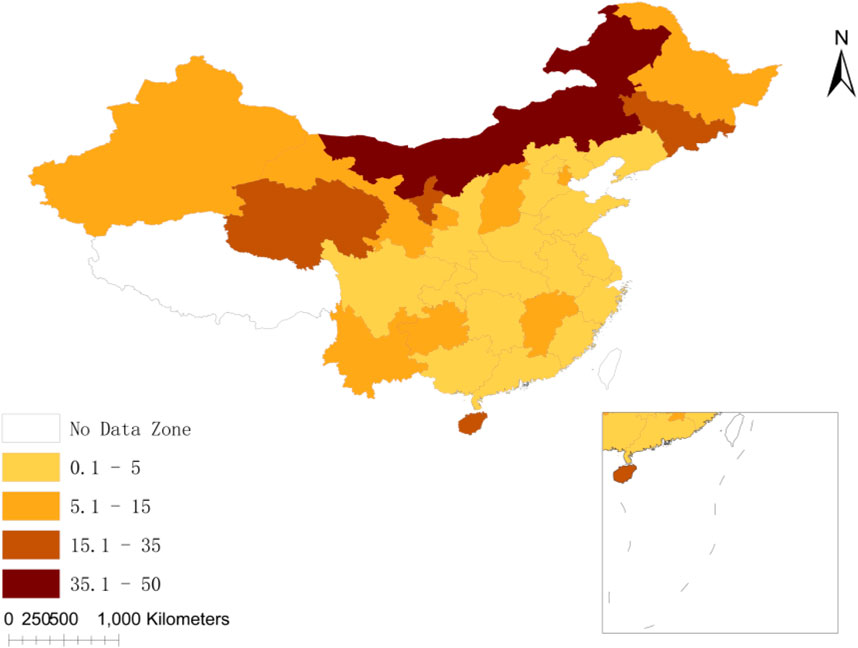
Figure 5. Allocation plan under efficiency principle.
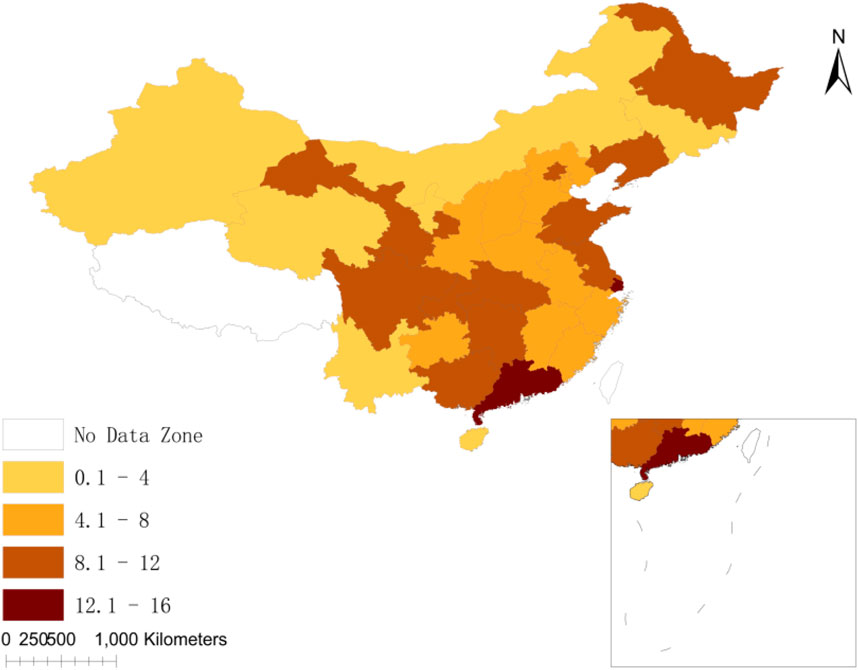
Figure 6. Allocation plan under equity principle.
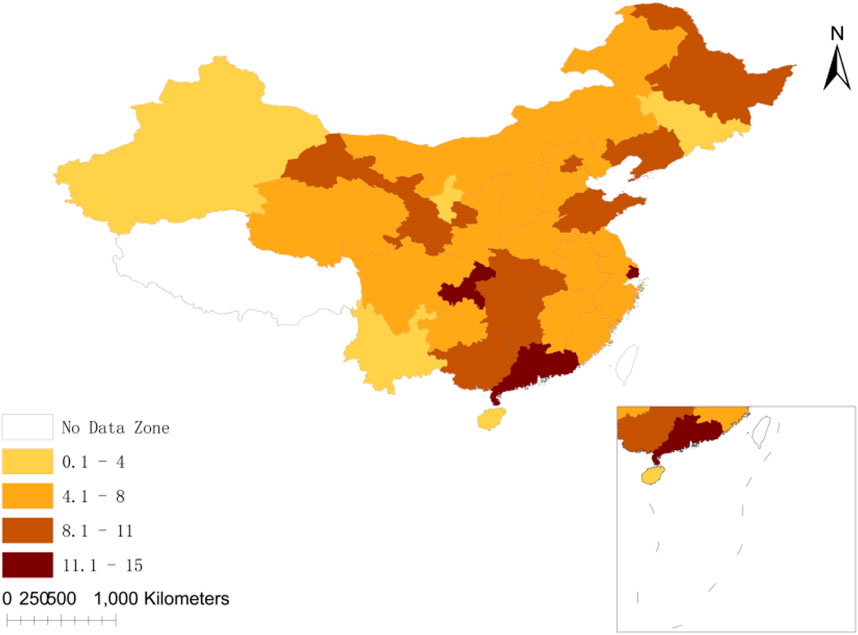
Figure 7. Allocation plan under Equity and Efficiency principle.
From a vertical perspective, under the guidance of the efficiency principle, there is a significant disparity in CEA allocation between Inner Mongolia and Guangdong. Inner Mongolia, Qinghai, and other regions receive a substantial amount of CEA. However, as mentioned earlier, the utility of excess CEA diminishes over time. The surplus CEA cannot be stored for an extended period, and even if sold in the carbon market, the oversupply may lead to a reduction in carbon prices. Therefore, the surplus CEA may not bring additional benefits to these provinces. In contrast, the eastern regions receive only a small portion of CEA, which is insufficient to meet their carbon emission needs for economic development. Notably, Guangdong receives almost no CEA, which appears to be unreasonable. This distribution scheme may lead to dissatisfaction among provinces receiving fewer CEA, hindering the progress of China’s carbon reduction tasks. Therefore, the implementation of such a distribution scheme requires careful consideration.
Under the guidance of the fairness principle, the disparity in CEA among provinces noticeably decreases, with economically developed eastern regions receiving more CEA than the central and western regions. This observation broadly validates Dong’s research findings, indicating a transfer of China’s CEA from the central and western regions with lower input-output ratios to the eastern regions with higher input-output ratios (Dong et al., 2018). However, in this scheme, due to the small variations in the weight function, the distribution is still primarily based on traditional historical CO2 emissions. This makes it challenging to address the issue of asymmetric disclosure of carbon emission information among provinces. Additionally, according to the results of the SBM, there is limited incentive for remote provinces with minimal CEA redundancy. Regions like Inner Mongolia, Qinghai, and Hainan experience only marginal increases in CEA, highlighting certain shortcomings in this distribution scheme.
In the distribution scheme that simultaneously considers both the principles of fairness and efficiency, it reasonably addresses this issue by appropriately increasing the CEA for provinces with less redundancy. Moreover, for provinces with excessive CEA redundancy, such as Shandong, their CEA increment is reduced to minimize the wastage of carbon quotas, as illustrated in Figure 8. While this scheme may impose significant emission reduction pressure on provinces like Jiangsu and Henan, it results in CEA surpluses for regions like Inner Mongolia and Qinghai. The government can formulate policies related to CEA cooperation based on these surpluses. Scholars like Li et al. (2021b) advocate strengthening regional cooperation, allowing for more flexible nationwide CEA distribution and fostering collaboration between eastern and central-western provinces. From a comprehensive perspective, as shown in Figure 7, CEA distribution in this scheme still favors eastern provinces over western provinces, consistent with the findings of Li et al. (2021a) in inter-provincial CEA allocation results. Southern provinces also receive more CEA than northern provinces, with CEA concentrated in southern provinces such as Shanghai, Guangzhou, and Chongqing. Kong et al. (2019), in studying the distribution of CEA, obtained similar allocation results.
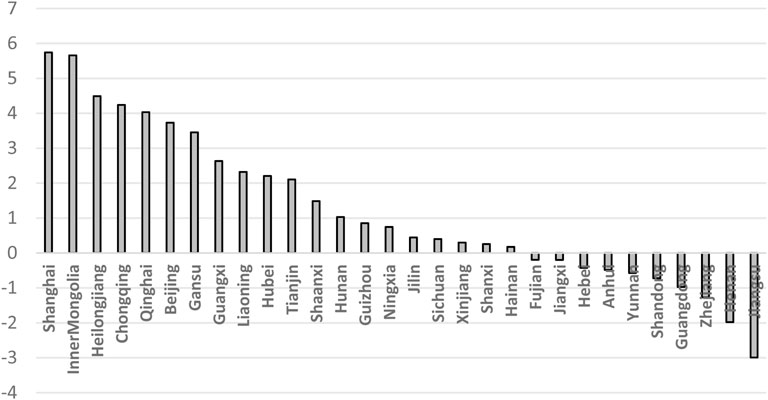
Figure 8. Cea value added.
After a detailed analysis of the three principles-based distribution schemes mentioned above, it becomes evident that the variable weight function can be applied to the CEA distribution problem, and the result of the improved variable weight function is reasonable. However, distribution schemes based solely on the efficiency principle or the fairness principle have their own shortcomings, so this article does not recommend using them for the distribution of China’s CEA in 2030. In comparison to these two distribution schemes, the scheme guided by both fairness and efficiency principles may be more suitable for the distribution of inter-provincial CEA in China by 2030. This is because the latter not only maximizes the utility of CEA distribution but also aligns with the carbon emission demands of each province. It significantly boosts the enthusiasm of provinces to reduce emissions, providing robust support for achieving the “peak carbon” target.
5 Conclusion
In order to achieve China’s goal of reaching peak carbon emissions by 2030, it is necessary to ensure the fair distribution of CEA. However, the current CEA allocation scheme has its limitations. Therefore, this paper aims to propose a new allocation method that takes into account the specific needs of each province while also allowing for flexible and simplified adjustments to inter-provincial CEA allocations based on various allocation principles.
The final study has two main conclusions. Firstly, using the entropy method to simulate the current inter-provincial CEA allocation method in China and formulating the current allocation scheme based on this, the study found that the scheme has shortcomings in terms of inefficiency and waste. Therefore, the CEA allocation should not be distributed according to the original method. Secondly, the improved variable weight function is a more suitable distribution method for resource allocation than the current original allocation method. Under this method, the CEA allocation scheme that balances fairness and efficiency principles is more suitable for the inter-provincial CEA allocation in China in 2030. This is because most CEA not only allocate to economically developed and high carbon-emitting provinces, but also to provinces with previously high CEA input-output ratios. These findings not only enrich the CEA allocation scheme but also expand the application of variable weight functions in the field of resource allocation. They also provide a premise and guarantee for the smooth operation of the carbon emission trading market, and more importantly, provide a new method for China to flexibly formulate and adjust CEA allocation schemes.
Certainly, there are some limitations in this study. On the one hand, this article allocates CEA from the perspective of utility, but only investigates two distribution principles, fairness and efficiency, without studying other distribution principles such as feasibility and sustainability. Therefore, future research could explore constructing other distribution principles using the metric of “utility” to make CEA distribution more in line with the needs of future carbon emissions. On the other hand, the paper uses 2020 carbon emission and carbon quota data to predict the 2030 CEA distribution scheme, and these data are currently not directly obtainable. The inaccuracy of the data will undoubtedly impact the calculation results, yet existing carbon databases suffer from issues such as poor data timeliness and significant variations in results due to different statistical methods. To enhance the precision of future research related to carbon, efforts can be directed towards developing standardized methods for measuring carbon emissions and establishing a comprehensive carbon data repository across multiple dimensions.
Data availability statement
The original contributions presented in the study are included in the article/supplementary material, further inquiries can be directed to the corresponding author.
Author contributions
ZG: Writing–original draft, Writing–review and editing. CX: Writing–review and editing.
Funding
The author(s) declare that financial support was received for the research, authorship, and/or publication of this article.
Acknowledgments
We are particularly grateful for the financial support from the Doctoral Foundation of Guangxi University of Science and Technology, grant number 21Z58; the Science and Technology Project of Guangxi, grant number AD23026136; Central Guided Local Science and Technology Development Funding Project, grant number 2022SRZ0101.
Conflict of interest
The authors declare that the research was conducted in the absence of any commercial or financial relationships that could be construed as a potential conflict of interest.
Publisher’s note
All claims expressed in this article are solely those of the authors and do not necessarily represent those of their affiliated organizations, or those of the publisher, the editors and the reviewers. Any product that may be evaluated in this article, or claim that may be made by its manufacturer, is not guaranteed or endorsed by the publisher.
References
Cong, J., Pei, Y. J., Xu, T., Zhao, Y., Ren, L., Schwarz, P., et al. (2022). How does the carbon market impact the economy-energy-environment system in resource-based regions of China? Empirical evidence from Shanxi Province. J. Clean. Prod. 376, 134218. doi:10.1016/j.jclepro.2022.134218
Cong, J., Xuemin, L. I. U., and Xueru, ZHAO (2014). Boundary definition of urban carbon emission accounting and its measurement method. China Population-Resources Environ. 24 (4), 19–26. doi:10.3969/j.issn.1002-2104.2014.04.004
Cui, X., Zhao, T., and Wang, J. (2021). Allocation of carbon emission quotas in China’s provincial power sector based on entropy method and ZSG-DEA. J. Clean. Prod. 284, 124683. doi:10.1016/j.jclepro.2020.124683
Deqing, L. I., and Feilong, H. A. O. (2014). Variable weights multifactor decision making based on linguistic factor state values. Syst. Eng. Theory Pract. 034 (001), 176–181. doi:10.3969/j.issn.1000-6788.2014.01.021
Dong, F., Long, R., Yu, B., Wang, Y., Li, J., Wang, Y., et al. (2018). How can China allocate CO2 reduction targets at the provincial level considering both equity and efficiency? Copenhagen Accord pledge. Resour. Conservation Recycl. 130, 31–43. doi:10.1016/j.resconrec.2017.11.011
Fang, K. Z. Q. L. Y., Zhang, Q., Long, Y., Yoshida, Y., Sun, L., Zhang, H., et al. (2019). How can China achieve its intended nationally determined contributions by 2030? A multi-criteria allocation of China's carbon emission allowance. Appl. Energy 241, 380–389. doi:10.1016/j.apenergy.2019.03.055
Fang, K., Zhang, Q., Ye, R., and Zhou, Y. (2018). Allocating China's carbon emission allowance to the provincial quotas in the context of the Paris Agreement. Acta Sci. Circumstantiae 38 (3), 1224–1234. doi:10.13671/j.hjkxxb.2017.0402
Ge, F. W. X., and Ge, X. (2021). Inter-provincial responsibility allocation of carbon emission in China to coordinate regional development. Environ. Sci. Pollut. Res. 29 (29), 7025–7041. doi:10.1007/s11356-021-16097-2
IPCC (2006). IPCC Guidelines for national greenhouse gas inventories[R]. Geneva, Switzerland: Intergovernmental Panel on Climate Change.
Kong, Y., Zhao, T., Yuan, R., and Chen, C. (2019). Allocation of carbon emission quotas in Chinese provinces based on equality and efficiency principles. J. Clean. Prod. 211, 222–232. doi:10.1016/j.jclepro.2018.11.178
Liesiö, J., and Vilkkumaa, E. (2021). Nonadditive multiattribute utility functions for portfolio decision analysis. Operations Res. 69 (6), 1886–1908. doi:10.1287/opre.2020.2046
Lin, B., and Huang, C. (2022). Analysis of emission reduction effects of carbon trading: market mechanism or government intervention? Sustain. Prod. Consum. 33, 28–37. doi:10.1016/j.spc.2022.06.016
Li, P., Chang, Z., and Chen, W. (2023). Risk state evaluation model for China's food import using G1-LS and variable weight SPA based on bottom-line thinking. Kybernetes 53, 2749–2774. ahead-of-print (ahead-of-print). doi:10.1108/k-10-2022-1426
Liu, Y., Zhou, C., Li, L., Su, L., and Zhang, Y. (2018). Fragile states metric system: an assessment model considering climate change. Sustainability 10 (6), 1767. doi:10.3390/su10061767
Li, Y., Li, Z., Jiang, J., and Song, Y. (2022). Coping with the liquidity crisis: a new dynamic quota readjustment scheme for carbon markets. Environ. Geochem. Health 44 (9), 3035–3055. doi:10.1007/s10653-021-01199-0
Li, Z., Chen, H., Wang, J., and Zhao, T. (2021b). Optimal allocation of CO2 emission quotas at the city level in Bohai Rim Economic Circle based on multi-objective decision approach. Environ. Sci. Pollut. Res. 28 (43), 60798–60817. doi:10.1007/s11356-021-14841-2
Li, Z., Zhao, T., Wang, J., and Cui, X. (2021a). Two-step allocation of CO2 emission quotas in China based on multi-principles: going regional to provincial. J. Clean. Prod. 305, 127173. doi:10.1016/j.jclepro.2021.127173
Moradian, H., and Kia, S. S. (2021). Cluster-based distributed augmented Lagrangian algorithm for a class of constrained convex optimization problems. Automatica 129, 109608. doi:10.1016/j.automatica.2021.109608
Tian, M., Hu, Y., Wang, H., and Li, C. (2022). Regional allowance allocation in China based on equity and efficiency towards achieving the carbon neutrality target: a composite indicator approach. J. Clean. Prod. 342, 130914. doi:10.1016/j.jclepro.2022.130914
Wang, B. J., Zhao, J. L., and Wei, Y. X. (2019). Carbon emission quota allocating on coal and electric power enterprises under carbon trading pilot in China: mathematical formulation and solution technique. J. Clean. Prod. 239, 118104. doi:10.1016/j.jclepro.2019.118104
Wang, F., and Ge, X. (2022). Inter-provincial responsibility allocation of carbon emission in China to coordinate regional development. Environ. Sci. Pollut. Res. 29 (5), 7025–7041. doi:10.1007/s11356-021-16097-2
Wu, Y., Lin, Y., Xiong, H., Liu, Y., and Wang, X. (2023). Evaluation of water breakout risk of coal seam bottom plate based on improved variable weight model. China Coal Geol. 35 (03), 17–23. doi:10.3969/j.issn.1674-1803.2023.03.03
Yao, H., Xiang, Y., Gu, C., and Liu, J. (2023). Peer-to-peer coupled trading of energy and carbon emission allowance: a stochastic game-theoretic approach. IEEE Internet Things J. 11, 24364–24375. doi:10.1109/jiot.2023.3325966
Yu, G., Fei, W., and Li, D. (2018). A compromise-typed variable weight decision method for hybrid multiattribute decision making. IEEE Trans. Fuzzy Syst. 27 (5), 861–872. doi:10.1109/tfuzz.2018.2880705
Zhang, Y., and Hao, J. (2017). Carbon emission quota allocation among China's industrial sectors based on the equity and efficiency principles. Ann. Operations Res. 255 (1-2), 117–140. doi:10.1007/s10479-016-2232-2
Zhang, Z., Liu, Y., and DU, Z. (2023). CO2 emission allocation for urban public buildings considering efficiency and equity: an application at the provincial level in China. Buildings 13 (6), 1570. doi:10.3390/buildings13061570
Zhao, B., Sun, L., and Gao, S. (2022). Effects of government regulations on under-reporting of carbon emission transfers by enterprises in supply chains. Sustainability 14 (15), 9269. doi:10.3390/su14159269
Keywords: CEA, utility, variable weight function, improving allocation methods, allocation principles
Citation: Guo Z and Xiong C (2024) Allocating inter-provincial CEA in China based on the utility perspective --a method for improving the variable weight function. Front. Environ. Sci. 12:1408970. doi: 10.3389/fenvs.2024.1408970
Received: 06 June 2024; Accepted: 27 August 2024;
Published: 25 September 2024.
Edited by:
Jiachao Peng, Wuhan Institute of Technology, ChinaCopyright © 2024 Guo and Xiong. This is an open-access article distributed under the terms of the Creative Commons Attribution License (CC BY). The use, distribution or reproduction in other forums is permitted, provided the original author(s) and the copyright owner(s) are credited and that the original publication in this journal is cited, in accordance with accepted academic practice. No use, distribution or reproduction is permitted which does not comply with these terms.
*Correspondence: Chaohua Xiong, OTM1Nzg2NzUzQHFxLmNvbQ==