
94% of researchers rate our articles as excellent or good
Learn more about the work of our research integrity team to safeguard the quality of each article we publish.
Find out more
ORIGINAL RESEARCH article
Front. Environ. Sci., 12 February 2024
Sec. Environmental Informatics and Remote Sensing
Volume 12 - 2024 | https://doi.org/10.3389/fenvs.2024.1330295
 Andrew B. Carr1*
 Mark A. Trigg1
 Alemseged Tamiru Haile2
 Mark V. Bernhofen3
 Abel Negussie Alemu2,4
 Tilaye Worku Bekele2,4Claire L. Walsh5
Introduction: Cities located in lower income countries are global flood risk hotspots. Assessment and management of these risks forms a key part of global climate adaptation efforts. City scale flood risk assessments necessitate flood hazard information, which is challenging to obtain in these localities because of data quality/scarcity issues, and the complex multi-source nature of urban flood dynamics. A growing array of global datasets provide an attractive means of closing these data gaps, but their suitability for this context remains relatively unknown.
Methods: Here, we test the use of relevant global terrain, rainfall, and flood hazard data products in a flood hazard and exposure assessment framework covering Addis Ababa, Ethiopia. To conduct the tests, we first developed a city scale rain-on-grid hydrodynamic flood model based on local data and used the model results to identify buildings exposed to flooding. We then observed how the results of this flood exposure assessment changed when each of the global datasets are used in turn to drive the hydrodynamic model in place of its local counterpart.
Results and discussion: Results are evaluated in terms of both the total number of exposed buildings, and the spatial distribution of exposure across Addis Ababa. Our results show that of the datasets tested, the FABDEM global terrain and the PXR global rainfall data products provide the most promise for use at the city scale in lower income countries.
Flood risk is an acute and growing problem in the cities of the global south. Often, hydraulic infrastructure and its maintenance is inadequate in these population centres (Lumbroso, 2020), and people living in these environments are more vulnerable to floods (Rentschler et al., 2022). The rapid and poorly regulated urbanisation occurring in these cities is increasing runoff on account of land use changes, and is also resulting in a greater number of people settling and properties being constructed in flood prone areas (e.g., Egbinola et al., 2017). Furthermore, the increasing occurrence of extreme rainfall intensities associated with climate change is elevating flood hazard in many places (Martel et al., 2021).
Flood risk assessments often rely on hydrodynamic models to map hazard, understand flood impacts, and explore interventions to mitigate risks (Lamb et al., 2009; Cai et al., 2019; Molinari et al., 2019). However, modelling flood hazard at the city scale is challenging, in part because of the need to consider multiple sources of flooding often present in cities. Urban infrastructure also presents a key challenge; data on the many fine scale features that exert strong controls on flow hydraulics is often scant, and representing their geometric and operational characteristics at scale is often unfeasible. One solution to the challenge of representing multiple sources of flooding is to use a direct rain-on-grid modelling approach where rainfall is applied directly to each grid cell of a 2D domain (Yu et al., 2016; UK Environment Agency, 2019). Runoff volumes are computed in each cell and are routed dynamically over the model terrain. Direct rain-on-grid modelling has been applied for over a decade now but has become more prevalent in recent years largely due to advances in computational power (Ryan et al., 2022), and is still regarded as relatively new compared to traditional approaches that model hydrology and hydraulics separately. Direct rain-on-grid modelling enables fluvial, pluvial, and tidal (where applicable) sources of flooding to be represented in an efficient manner. These models are primarily driven by topography and rainfall data, and as such these data form the critical inputs into the model. However, the global south suffers from a scarcity of these data, with local digital elevation models (DEMs) and rainfall data often being unavailable or limited in their coverage (van de Giesen et al., 2014; Hawker et al., 2018). These data gaps are increasingly being filled with global datasets.
The term global datasets refers to datasets with global or near global spatial coverage, which are partly or wholly derived from remotely sensed observations from Earth observation satellites. Global datasets have been used for some time now to study flood risk at large scales (Komi et al., 2017; Lindersson et al., 2020), as exemplified by the establishment of global flood models (GFMs) over the last decade or so. GFMs harness several global datasets to model and map flood hazard globally (Ward et al., 2015; Bernhofen et al., 2018). Similarly, satellite imagery is now being harnessed to construct historical flood extent maps with global coverage (Tellman et al., 2021). Such global hazard maps provide a consistent modelling approach and data, enabling objective flood risk management decisions to be made by those operating across multiple countries (Trigg et al., 2016). As global datasets and their derivative hazard maps improve in resolution and accuracy, they are increasingly being used in data scarce situations and at smaller (sub-national) scales including the city scale. One well documented example is the emergency response to Cyclones Idai and Kenneth in Mozambique in 2019, which used global flood extent maps from Fathom and the high resolution settlement layer to predict flood exposure at the district scale (Emerton et al., 2020). Global data such as terrain or precipitation are also being used by complementing them with local data at the sub-basin scale (Haile et al., 2016); the city scale (Sayers and Partners, 2019; McClean et al., 2020); and the infrastructure scale (Golder Associates, 2021). At these local scales, the spatial resolution and accuracy of global datasets is relatively low, and their use in assessing flood risk poses important questions about the efficacy of doing so. Research into this is ongoing (see for example,: Domeneghetti, 2016; Ekeu-wei and Blackburn, 2018; Schumann et al., 2018; Courty et al., 2019; Fleischmann et al., 2019; Kettner et al., 2019; Li et al., 2022); and needs to continue as new global datasets emerge and see use in a wide range of scales and situations.
This study aims to evaluate the suitability of relevant global datasets for mapping flood hazard in support of city-scale flood risk assessments in data scarce, low to middle income contexts. Specifically, we use global rainfall and terrain data to drive a flood hazard model then test the resulting hazard maps in a city-wide flood exposure assessment. We also test a GFM hazard map product in the exposure assessment. To conduct the tests, we first developed a city-scale rain-on-grid hydrodynamic flood model based on local data and used the model results to identify buildings exposed to flooding. We then observed how the results of this flood exposure assessment change when each of the global datasets are used in turn to drive the hydrodynamic model in place of the local dataset, and when the GFM flood hazard product is used instead of our flood hazard model output. Results are evaluated in terms of both the total number of exposed buildings, and the spatial distribution of exposure across the study area. Sensitivity analyses were also run on the key hydrodynamic model parameters that are uncertain, to place the results of the global dataset tests into the context of the uncertainties that are inherent in flood hazard modelling.
We test two global terrain datasets: the FABDEM (Forest And Buildings removed Copernicus DEM) (Hawker et al., 2022) and the MERIT (Multi-Error-Removed Improved-Terrain) DEM (Yamazaki et al., 2017). The FABDEM–derived from the Copernicus Global 30 m DEM (Copernicus, 2021)—is the first global digital elevation model (DEM) with forests and buildings removed at a 30 m resolution. It has been shown to be more accurate than other global DEMs, has a higher resolution than most global DEMs, and is therefore expected to improve flood hazard and risk estimates in data scarce areas that were previously reliant on other global DEMs (Hawker et al., 2022). However, little research has been done to assess its performance when used to model flood hazard or assess risk. The MERIT DEM–derived from the Shuttle Radar Topography Mission (SRTM) v3 (Farr et al., 2007) below N60°—has seen extensive use in flood hazard modelling at various scales and has been well tested (Chen et al., 2018; Tavares da Costa et al., 2019; Uuemaa et al., 2020). Following its release it was generally accepted as being the most appropriate freely available global bare Earth DEM product to use in flood hazard modelling (Hawker et al., 2018; Minderhoud et al., 2019; Rentschler et al., 2022). We experiment with it here as it provides important context for evaluating the FABDEM and other global datasets. We did not consider the ALOS PALSAR RTC DEM product because the source elevation data for this product is SRTM (or the USGS National Elevation Dataset where available), and the 12.5 m resolution of this DEM does not reflect the underlying resolution of the source elevation data (Alaska Satellite Facility, 2015).
The rainfall dataset we test is the global rainfall intensity duration frequency (IDF) dataset known as Parametrized eXtreme Rain (PXR), produced by Courty et al. (2019b). This Global IDF dataset is derived from the European Centre for Medium-Range Weather Forecasts Fifth Generation Re-Analysis (ERA5) (Hersbach et al., 2020). ERA5 is a gridded dataset constructed from the assimilation of historical weather predictions with observational data. It has global coverage, a 0.25° (approximately 31 km) spatial resolution, and covers the period from 1950 until present with a 1-h temporal resolution. ERA5 has been shown to outperform other rainfall reanalysis products (McClean et al., 2021) and may represent the preferential source of precipitation data for estimating flood hazard in many data scare situations. Several GFMs use climate reanalysis products as their source of rainfall data (Trigg et al., 2021), and whilst the relatively coarse resolution of ERA5 limits its ability to characterise localised rainfall processes such as convective storms (Reder et al., 2022), it has been shown to provide useful flood risk information when applied at the catchment and city scales (see Cantoni et al., 2022; Mercogliano et al., 2022). Whilst the direct use of ERA5 to simulate historical flood events has been explored, the PXR IDF dataset has not, despite its potential utility in flood hazard and risk assessment.
A fourth dataset we test is a GFM flood extent map product. GFMs came into existence over a decade ago with a primary purpose of helping our understanding of the global distribution of flood risk. They have since undergone several iterations of development, and some GFMs are now considered to be potentially useful as national scale flood maps (Bernhofen et al., 2022). Whilst GFMs do not provide the level of detail of the national scale flood maps typically available in high income countries, they have shown some value when used to assess flood risk within individual countries down to the district scale (Emerton et al., 2020) or across refugee camps (Bernhofen et al., 2023). Testing GFMs at the sub-national scale has been limited however. Here, we test flood extent maps produced by the Fathom 2.0 GFM (Sampson et al., 2015; Fathom, 2019), which at the time of writing is generally considered to be amongst the most locally relevant of the GFMs due to its relatively high 1 arc second spatial resolution and its relatively small minimum river size of 50 km2 upstream drainage area (Trigg et al., 2021).
Our test case is Addis Ababa–the capital city of Ethiopia. Addis Ababa experiences many of the flood risk problems and challenges typically faced by the cities of the global south. Flooding here in August 2006 is regarded as the most severe in Ethiopian history, killing an estimated 647 people and leaving around 200,000 people homeless (De Risi et al., 2020). The population of Addis Ababa is around 5 million people, a number that is growing by around 3.8% annually largely on account of rural to urban migration (Shouler et al., 2021; Dusseau et al., 2023). The city is exposed to both fluvial and pluvial floods, and climate change projections show that flood hazard will increase in the future due to more frequent extreme rainfall (Birhanu et al., 2016; USAID, 2017). Urban expansion onto floodplains combined with sub-standard drainage systems and waste management practices is increasing the level of flood exposure here, and many properties in the city are highly vulnerable to floods because of the poor quality of their construction (World Bank, 2015). The frequency with which people and properties are exposed to flooding in Addis Ababa is also high; this is typical of cities in lower income countries that have little or no formal flood defences (Rentschler et al., 2022) and makes Addis Ababa a suitable test case for global datasets in lower income contexts. Addis Ababa experiences a warm and temperate climate with two rainy seasons: the primary one (Kiremt) falls from June to September; and a secondary one (Belg) occurs from mid-February to April (Bekele et al., 2022). The average annual rainfall is 1184mm; roughly equal to that in the Scottish city of Glasgow. Temperatures are on average 16°C, and average maximum and minimum temperatures are 22.9 and 10.2°C respectively (Shouler et al., 2021).
The 2D flood hazard modelling was carried out using the United States Hydrologic Engineering Center’s River Analysis System (HEC-RAS) software, Version 6 (Brunner, 2020b). Our 2D model domain covers the entire Akaki River catchment upstream of the Aba Samuel Reservoir (Figure 1); the city of Addis Ababa is situated entirely within this catchment. The water surface elevation of the Aba Samuel Reservoir forms the downstream boundary condition of the model. We adopted the diffusion wave solver in HEC-RAS and used the 2D sub-grid capability in HEC-RAS. As such, in our model we use a 5 m resolution DEM whilst adopting a variable model resolution of 50 m for river channels and floodplains and 200 m elsewhere. The DEM was obtained from the Ethiopian Geospatial Information Institute, and was generated from aerial photogrammetry using a ground sampling distance of 25 cm. The DEM has a reported vertical accuracy of 50 cm (Bekele et al., 2022). We removed off-terrain features including vegetation, buildings, bridges, and other anthropogenic objects from the DEM using the WhiteboxTools remove off-terrain objects tool (Lindsay, 2018). Other inputs to the reference model include the 10 m resolution WorldCover product developed from Sentinel satellite imagery (Zanaga et al., 2021), which we use to define the spatial distribution of hydraulic roughness. Manning’s n roughness coefficient values were assigned to the various WorldCover land cover types based on average values given in Brunner (2020a). WorldCover was also used in conjunction with a 250 m resolution map of Hydrologic Soil Groups (HYSOGs250 m) (Ross et al., 2018) to define the spatial distribution of the US soil conservation service (SCS) curve number values (CN), this being the model’s infiltration rate parameter. CN values were obtained from TR-55 (USDA, 1986). These model inputs are depicted in Figure 1 and summarised in Table 1.
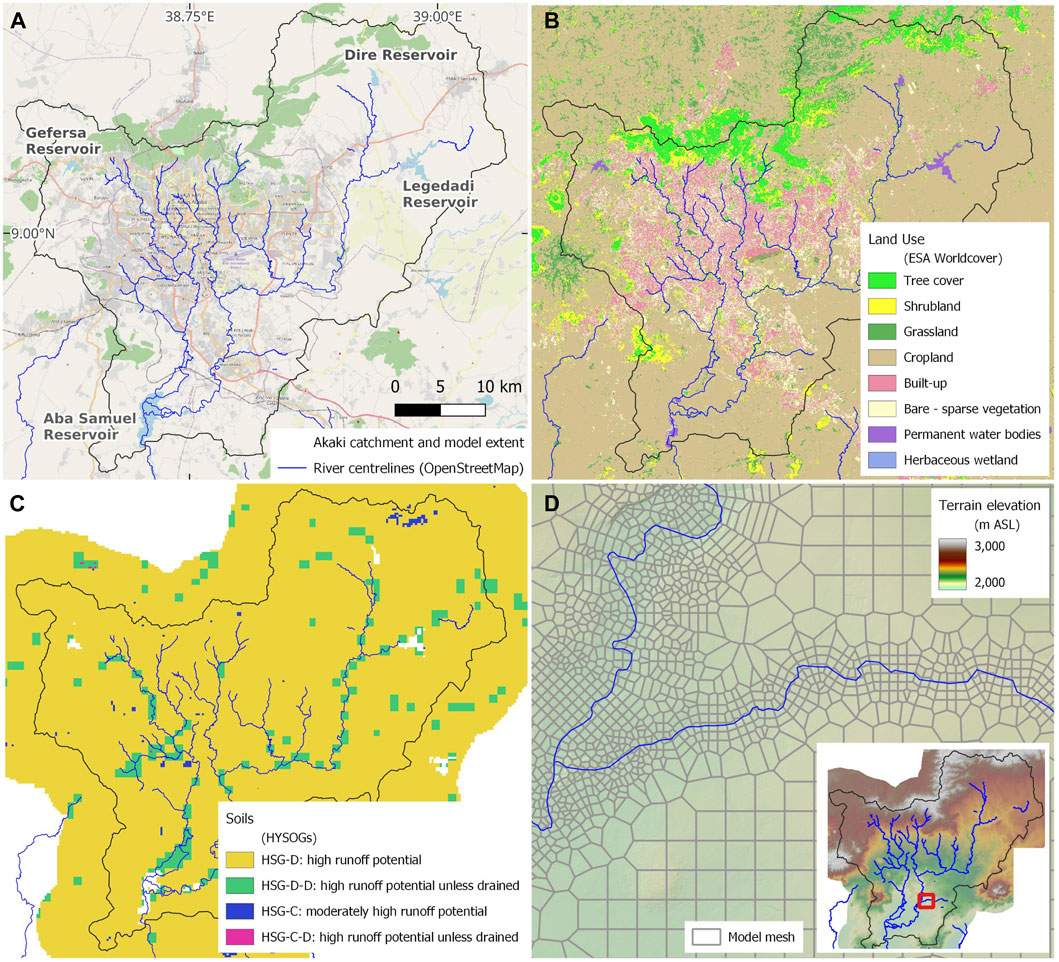
FIGURE 1. Hydrodynamic model details: (A) Location plan with background mapping and river centrelines from OpenStreetMap (OpenStreetMap contributors, 2022); (B) Worldcover (Zanaga et al., 2021) input land cover data used to define spatial distribution of hydraulic roughness and infiltration rates; (C) Hydrologic soil groups from HYSOGs (Ross et al., 2018) used to define spatial distribution of infiltration rates; (D) Unstructured model mesh overlaying input terrain data.
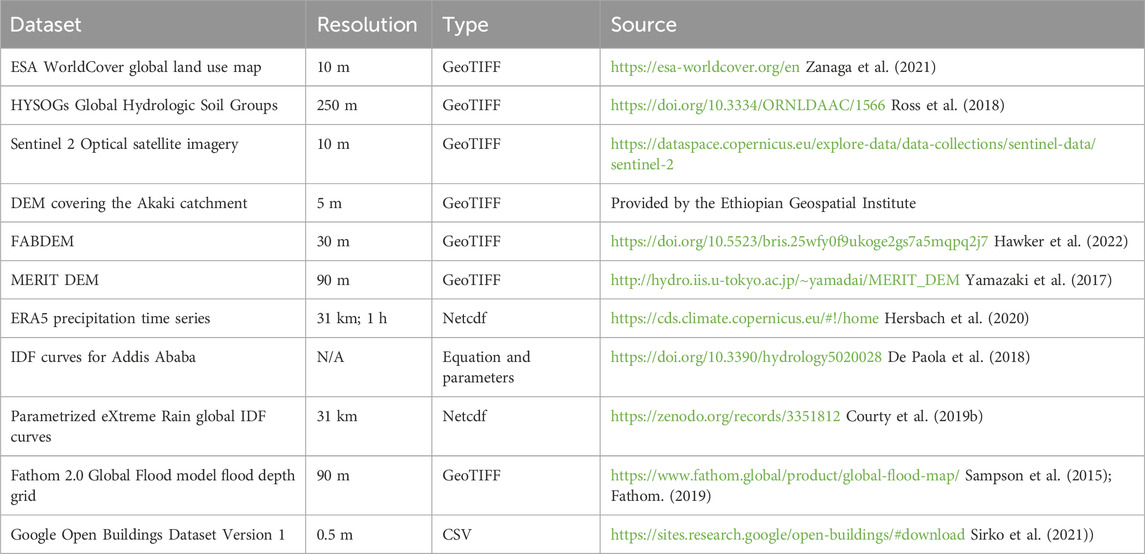
TABLE 1. Summary of datasets used in this study.
Stormwater runoff within the Akaki catchment is managed to some degree by local drainage systems not captured by the DEM. When modelling urban flood hazard at large scales, instead of explicitly modelling these drainage systems it is common to represent them in a simplified manner by applying a drainage removal rate (DRR) to the model (e.g., Scottish Environment Protection Agency, 2018; Xing et al., 2022). DRRs essentially remove rainfall depths from the model at a rate equal to the level of service provided by the drainage system. DRR values were determined using the approach detailed in van Leuwen et al. (2019) who cite Horrit et al. (2009), which was developed for large scale flood hazard mapping undertaken in the United Kingdom. The approach utilises a modified version of the Rational Method and its application here is set out in the Supplementary Material. We calculated DRR values of 8.6 mm/h and 1.8 mm/h for urban and rural areas respectively. These DRR values incorporate the assumption that the urban drainage systems will partially block and operate at 50% of their assumed hydraulic capacity. It is known that blockage of drainage systems due to inadequate waste management practices plays a significant role in urban flooding in Addis Ababa (Birhanu et al., 2016; Adugna et al., 2019).
As a hydrodynamic model validation exercise, a flood event captured by satellite imagery on 6 September 2017 was simulated and the modelled flood extent compared with observations. The historical event model simulation was driven by spatially and temporally varied precipitation data from ERA5. Model initial conditions were prescribed in the form of a water surface elevation (WSE) grid covering the 2D domain. The WSE values used for the initial conditions were generated from a preliminary model run that simulated the average daily flow observed (gauged) on the Big Akaki River during the wet season months of August and September. These initial conditions represent three reservoirs in the upstream part of the catchment (Gefersa, Legedadi, and Dire) as full, thus assuming they provide no flood attenuation, an assumption corroborated in a discussion we held with the reservoir operators from the Addis Ababa Water and Sewerage Authority (AAWSA, personal communication, 2023).
Satellite imagery capturing the lower Akaki river inundating was acquired at approximately 07:30 UCT on 6 September 2017 by the Sentinel 2 optical instrument. We processed the optical imagery by calculating the modified normalised difference water index (MNDWI), which enhances the visibility of open water whilst diminishing built-up area features (Xu, 2006). The result is shown in Figure 2. We then analysed the differences between the modelled and observed flood extents by calculating three performance metrics, details of which are given in the results section. Subsequent comparison of the observed flood extent and modelled statistical floods showed that the observed flood was a relatively minor one (smaller extents than the 1-in-5 years modelled flood extent).
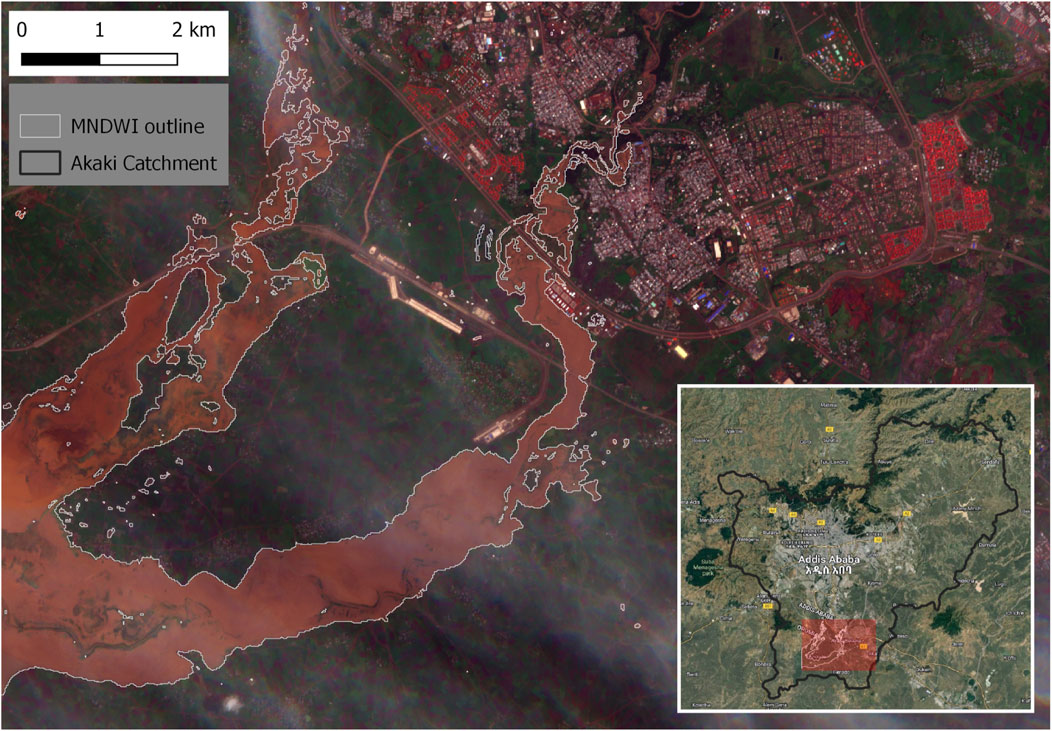
FIGURE 2. Sentinel 2 image of lower Akaki river flooding on 6 September 2017, downloaded from US Geological Survey Earth Explorer website: https://earthexplorer.usgs.gov/. Calculated MNDWI extent overlaid on top of satellite image.
Once the model was validated, we used it to estimate the number of properties in Addis Ababa that are exposed to the 1-in-5 and 1-in-100 years rainfall events. These statistical rainfall events were chosen to test both low and high-frequency flood events, and were derived from rainfall IDF information for Addis Ababa derived from in situ rain gauge data (De Paola et al., 2018). The temporal storm profile was generated using a 24 h duration HEC-HMS frequency-based hypothetical storm (Scharffenberg et al., 2018). The rainfall events were applied uniformly across the model domain, and the same initial conditions as those used for the historical event simulations were prescribed. The flood extents resulting from these statistical rainfall event simulations were then intersected with the Google Open Buildings Dataset Version 1 (Sirko et al., 2021) to identify all exposed buildings. This dataset contains building footprints from 50 cm satellite imagery, covering the entire African continent, and provides a confidence score to indicate how likely each feature is a building (this score was not used in our assessment process). South Asia, South-East Asia, Latin America and the Caribbean have also since been added to the latest version (V3) of Google Open Buildings. Finally, the spatial distribution of exposure across the study area is mapped by using a heatmap renderer to convert the exposed building points to a 100 m resolution exposure density raster. The entire flood exposure assessment process is depicted in Figure 3.
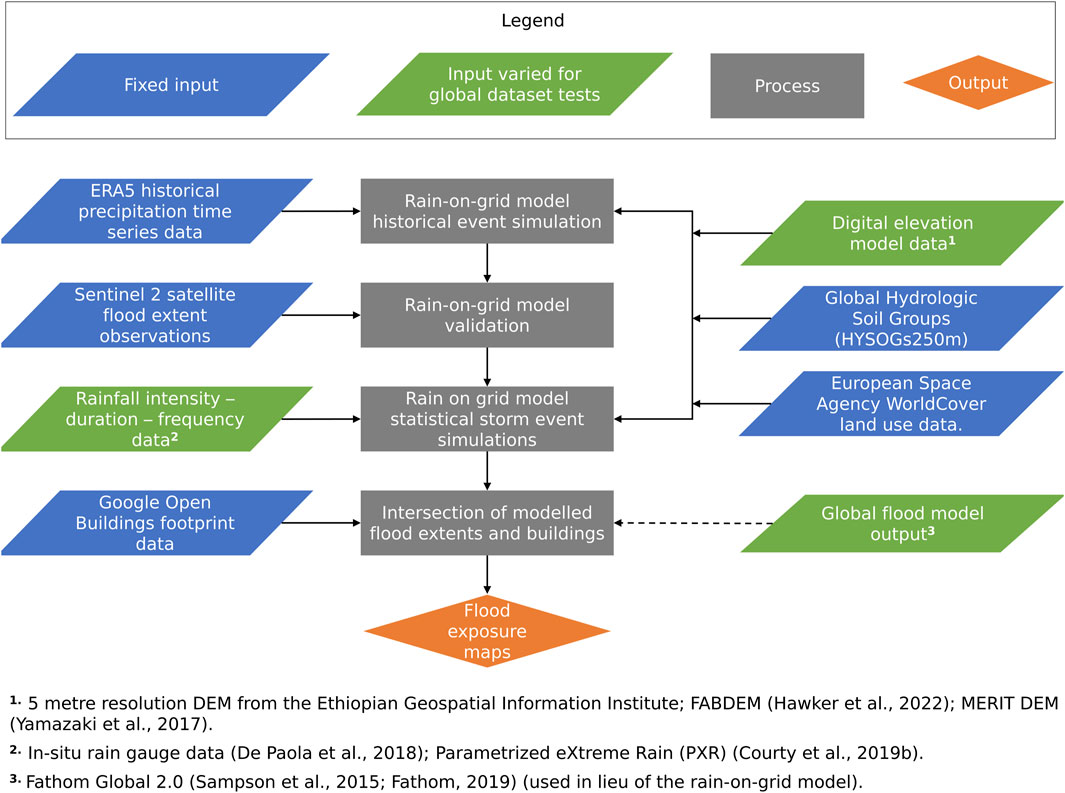
FIGURE 3. Flow chart showing the flood hazard and exposure assessment process used in this study.
To test the global terrain and rainfall datasets, we repeated the flood hazard modelling and exposure assessment described in the previous sub-section but sequentially replaced one of the reference model (RM) inputs with a global dataset. To run the hydrodynamic model with each of the global DEMs, each DEM was first augmented with river channel bathymetry information. Bathymetry is generally absent from global DEMs and when they are used in flood modelling it is common to add bathymetry to account for the important role that channels play in flood hydraulics (Sampson et al., 2015; Neal et al., 2021). In data scarce contexts the bathymetry usually needs to be estimated in the absence of observations. We followed this practice to test the global DEMs in this context in a credible manner. To augment the MERIT DEM and FABDEM with bathymetry, we estimate bathymetry by applying hydraulic geometry (HG) theory combined with Manning’s equation. HG theory relates channel width and depth to bank full discharge using power law relationships (Leopold and Maddock, 1953; Gleason, 2015), and has been used extensively to estimate bathymetry in data scarce situations (Neal et al., 2012; Schumann et al., 2013; Yamazaki et al., 2013; Fleischmann et al., 2019). HG is often supplemented with some basic open channel flow hydraulic analysis to calculate channel depth. In many cases this involves applying Manning’s equation and assuming uniform flow conditions (e.g., Sampson et al., 2015), and we adopt this approach here. All channels with an upstream drainage area of 10 km2 or above are added, based on previous research suggesting that 30 m resolution global DEMs can define river channels with upstream areas as small as this (Annis et al., 2019; Bernhofen et al., 2021). Details of the procedure used are given in the Supplementary Material.
To run the hydrodynamic model with the PXR IDF dataset we replaced the gauge-based rainfall depths with depths from the PXR IDF curves. The storm temporal profile was then generated in the same way as described previously. The GFM test was conducted by combining the Fathom 2.0 fluvial and pluvial flood depth grids and converting the resulting depth grid into a flood extent map, which was then used to estimate flood exposure in lieu of our hydrodynamic model results.
In addition to the four global dataset tests, we also conducted five sensitivity tests on the RM. This involved re-running the RM using upper and lower bound values of key model parameters that are uncertain or subjective, and seeing how sensitive the flood exposure results are to this ambiguity. The parameters tested include the SCS CN values used to compute runoff; the DRR used to model urban drainage; Manning’s n hydraulic roughness values; the minimum exposure depth threshold value; and the choice of method used to downscale results from the computational grid resolution to the DEM resolution. CN values were varied by ± 20%, reflecting the range in minimum and maximum textbook values for a given land cover type (USDA, 1986). The DRR value was reduced to 0 and increased to 25 mm/h in urban areas, representing assumptions of 100% blockage and a level of service (LoS) of 1-in-10 years (Keaney and Jaegerfelt Mouritsen, (2015) provide accounts of some big cities in middle income countries upgrading drainage systems to this LoS in recent years). Manning’s n was varied by ± 30% as this is the typical degree of variation between minimum and maximum textbook values for a given surface (e.g., Arcement and Schneider, 1984). A review of reported minimum inundation exposure depth threshold values yielded values between zero (UK Environment Agency, 2019), to 200 mm (BMT Group Ltd, 2019), hence we adopt this range. Finally, we use two methods of downscaling from the computational grid resolution to the DEM resolution: 1) interpolating the sloping water surface within computational grid cells using values at 2D cell corners only; 2) interpolating the sloping water surface using values at cell corners and face centres, and weighting water surface elevations by face depths so that deep faces have more effect than shallow faces. Method 2) produces considerably smaller flooded areas than method 1). Either of these methods can be used in HEC-RAS.
The results of the model validation exercise for flood extent are shown in Figure 4. The flooded area subjected to validation was constrained to the area downstream of the urban area of Addis Ababa where clouds were absent and, to avoid issues known to occur when extracting inundation extents of minor flood events from satellite imagery in urban areas (Tanim et al., 2022). We also removed an area immediately upstream of the Aba Samuel reservoir from the validation, as initial model sensitivity tests showed flooding in this area was sensitive to the modelled downstream boundary condition. Furthermore, we excluded minor tributaries entering the main rivers along the validation reaches because the resolution of the satellite images is too coarse to detect inundation along these small tributaries.
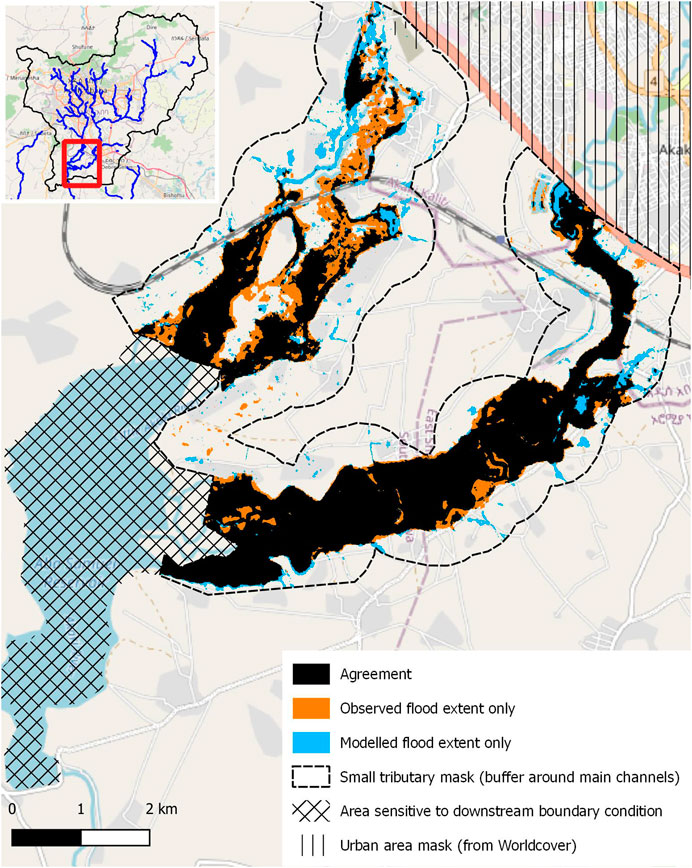
FIGURE 4. Hydrodynamic model validation with optical image observed on 6 September 2017. Background mapping from OpenStreetMap (OpenStreetMap contributors, 2022).
Generally, there is good agreement between the model and observations, particularly on the Big Akaki river, demonstrating that the model is producing a reasonable reconstruction of the flood inundation dynamics. The modelled flood extents show little bias (just 4% underprediction), give an 81% hit rate (proportion of the observed flood captured by the model), and the critical success index (CSI)—the fraction of the combined modelled and observed flood extent that is correct–is 73%. There are some notable differences in the inundation patterns on the Little Akaki; misrepresentation of terrain and river infrastructure in the model is likely to be part of the reason for this. The remotely sensed inundation patterns are also not error free and will contribute to the disagreement in inundation patterns to some extent. We explored improving model performance by calibrating the friction and infiltration parameters, but doing so did not result in any meaningful improvement in model performance: whilst it reduced the bias, it also reduced the CSI score by a commensurate amount.
The exposure building estimates resulting from the Global dataset tests are shown in Figure 5, along with the model sensitivity tests results. Additional hydraulic results including flood extent and depth statistics are provided in Section 5 of the Supplementary Material. The RM produces building exposure estimates of 44,544 and 77,320 for the 1-in-5 and 1-in-100 years return period flood events, respectively. When any one of the global datasets is introduced into the flood hazard modelling process, the exposure estimates increase. The magnitude of this increase varies for each test and tends to be greater for the 1-in-5 than the 1-in-100 years event in relative terms (the global flood hazard model test being a notable exception). The percentage increases in exposure relative to the RM, for the 1-in-5 and 1-in-100 years events are, respectively: 25% and 24% for the FAB DEM test; 135% and 75% for the MERIT DEM test; 50% and 38% for the global IDF test; and 25% and 156% for the GFM test.
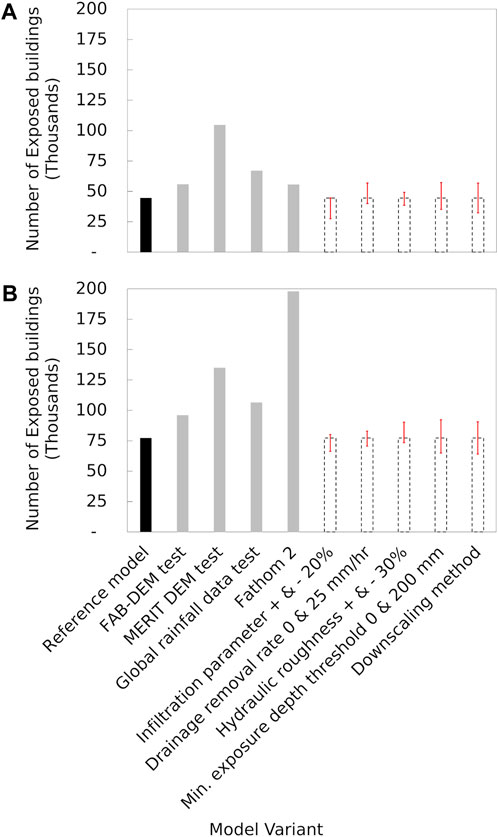
FIGURE 5. Number of exposed buildings resulting from the RM, global dataset tests, and model parameter sensitivity tests: (A) 1-in-5 years; (B) 1-in-100 years.
Of the five sensitivity tests, the 1-in-5 years CN parameter test results vary by a maximum of 38% relative to the RM exposure, which is the largest deviation of all tests. The CN values are the product of the HYSOGs and Worldcover global datasets. Whilst we are not testing these specific datasets in this study, the CN sensitivity test results indicate a need to do so. The HYSOGs data in particular has a relatively coarse 250 m spatial resolution and would benefit from being tested given others are now using at this scale (e.g., 3SPROSPECT, 2021; Rivosecchi and Singh, 2023). The 1-in-5 years results of the DRR, minimum depth threshold, and downscaling method tests all deviate from the RM by up to 28%, whilst the hydraulic roughness test runs vary by no more than 13%. When compared to the 1-in-5 years results, 1-in-100 years sensitivity test results consistently show less variation relative to the RM, but they are similar in their absolute magnitude. Some of these uncertainties are mitigated where models are calibrated and the parameters can be adjusted to reduce the difference between model results and observations. However, drainage removal rate, minimum flood depth threshold, and the downscaling method are not calibration parameters and modellers should take note of how much the model results can deviate depending on the choices made with these.
Figure 6 shows the heatmap raster maps depicting the spatial distribution of buildings exposed to the 1-in-5 and 1-in-100 years events, for the RM results and each of the global dataset tests. The spatial prioritisation of interventions is a fundamental part of flood risk management, and it is therefore important to assess the spatial distribution of exposure as well as the total number of exposed assets. The RM heatmaps identify a clear exposure hotspot to the southwest of the city, and a site visit to this area in March 2023 verified that widespread inundation of properties has occurred in this area. The heatmaps produced from the global dataset tests diverge from the RM heatmap to varying degrees. The FABDEM increases the exposure to some degree along numerous river reaches across the domain and as a result is unable to define the southwestern hotspot for the 1-in-5 years event. The southwestern hotspot is well defined for the FAB DEM 1-in-100 years scenario. Using the MERIT DEM increases exposure significantly across the model domain for both flood events, and it is unable to define the southwestern hotspot. Global rainfall has no discernible effect on the distribution of exposure as would be expected given rainfall is applied uniformly in the model. The GFM heatmap does not clearly identify the southwestern hotspot for either flood event because it introduces commensurate degrees of exposure along several of the watercourses.
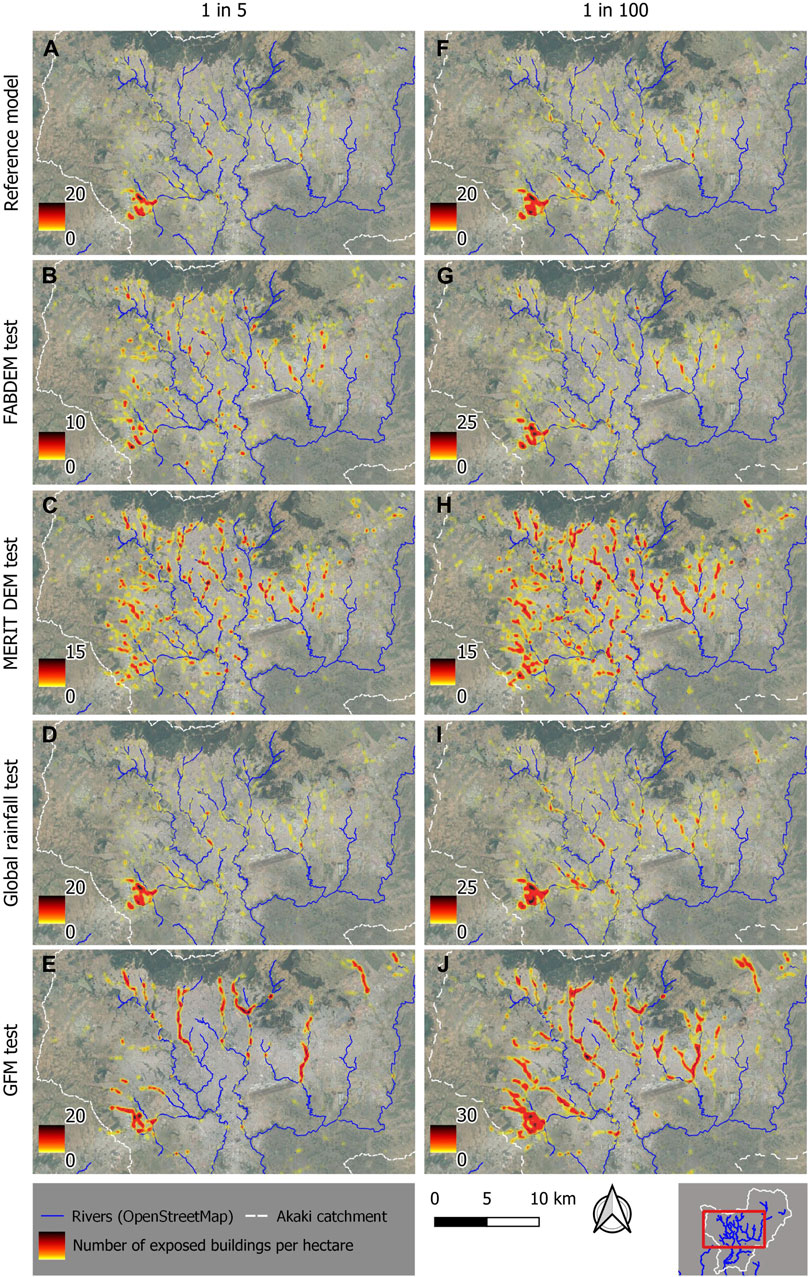
FIGURE 6. Heatmaps showing spatial distribution of building exposure to 1-in-5 years (A-E); and 1-in-100 years (F-J) storm events. Heatmap symbology minimum and maximum values are set individually for each map deliberately, to allow each map to define the spatial distribution of exposure as clearly as possible. Background Map data: Google, Maxar Technologies, Airbus.
Each dataset overestimates flood exposure to a varying degree. One would expect this to be the case for the global DEMs, as reducing the DEM resolution will always produce larger flood extents, assuming a consistent vertical accuracy (Saksena and Merwade, 2015). When using FABDEM this overestimation is relatively small and is well within the hydrodynamic model’s sensitivity to uncertain parameters. In contrast, the MERIT DEM produces a much larger overestimation far greater than the model’s sensitivity, which is broadly in line with the findings of others (McClean et al., 2020). This result clearly supports the assertion that FABDEM will significantly improve flood hazard and risk estimates in data scarce situations. The 1-in-100 years exposure heatmaps produced using FABDEM also conform much closely to the RM and represent a significant improvement on those produced using the MERIT DEM. To place these results in context, the RM is based on a 5 m DEM from photogrammetry, which is comparable to DEMs used in national scale flood maps produced for some higher income countries (Sayers et al., 2020; Bates et al., 2021). However, the 1-in-5 years FABDEM heatmaps show a limited improvement over the MERIT heatmaps and are unable to replicate the spatial patterns of flood exposure predicted by the RM. The deterioration of the FABDEM results for high-frequency floods may be because the inundation associated with high-frequency events is less extensive, i.e., it is more localised and sensitive to topographic approximations such as the omission of flood defences and hydraulic structures; as noted by others (Quinn et al., 2019; Hawker et al., 2020). The practice of augmenting global DEMS with bathymetry may also play a role in their poor performance in modelling high-frequency floods. Estimating bathymetry by assuming uniform flow does not allow for gradually varied flow conditions such as backwater effects that exist along natural channel systems, meaning channel depths will be underestimated and inundation overestimated in these areas. The tendency to over-predict exposure for more frequent flood events is a recognised limitation of GFMs and their constituent data. Efforts to address this are ongoing: Neal et al. (2021) demonstrated that bathymetry estimation using a gradually varied flow solver instead of Manning’s equation for uniform flow can remove the bias in modelled water surface elevation associated with backwater effects. Zhao et al. (2023) developed a novel machine learning-based approach for estimating flood defence standards and demonstrated its utility in improving the representation of flood defences in large scale flood modelling. Such advances are already being used in continental scale modelling (Bates et al., 2021), and they will be adopted in future versions of GFMs. The extent to which they improve GFM high-frequency flood predictions, particularly in low income contexts, remains to be seen.
Using the global IDF dataset increased the number of exposed buildings by a similar magnitude to the more sensitive of the parameter uncertainty tests (infiltration; minimum exposure depth threshold value; downscaling method), and can therefore be regarded as a considerable component of the overall uncertainty of the hydrodynamic modelling process. However, when these results are viewed in the context of the wider flood risk assessment process, the overestimation is relatively small in magnitude. For example, Merz and Thieken (2009) found that flood risk estimates for a relatively data-rich western European city had maximum uncertainties of around −50% and +100%. The vulnerability component of risk (i.e., the relationship between flood hazard magnitude and flood receptor susceptibility) is often the dominant source of uncertainty (Winter 2017; Sarailidis 2023). In lower income countries where data on vulnerability relationships is particularly scarce, risk assessment uncertainties have been shown to exceed a factor of three (Englhardt et al., 2019; Bernhofen et al., 2022). As noted in the results section, the rainfall is not spatially varied and therefore it does not significantly affect the spatial distribution of exposure in our test. The results show that the global IDF curves are appropriate for assessing city scale flood risk. However, as the behaviour of ERA5 is thought to vary across climatic regions (Gleixner et al., 2020), further testing in other regions is needed to make these findings globally applicable. Contrary to the overestimation shown by our results, others have found that ERA5 tends to underestimate flood hazard and exposure (McClean et al., 2021). The overestimation seen here may be the result of the approach used to derive IDF relationships from ERA5, whereby the IDF extreme value distribution parameters are scaled relative to event duration (refer to Courty et al., 2019b for further details).
The Fathom 2.0 GFM results show the GFM more than doubles the 1-in-100 years exposure, which is significant even within the context of the wider flood risk assessment process. Interestingly the GFM produces 1-in-5 years exposure estimates that are relatively close to the RM results. This inconsistent magnitude of variation between the GFM and the RM across return periods could be due to differences in the rainfall data used by the two models, or differences between the two models in their approach used representing urban drainage. Distinctions in model computational grid size and geometry, and in the approximations of the shallow water equations employed by the HEC-RAS model and the Fathom model will also play some role in these differences. The heatmaps for both events show that the GFM introduces large amounts of exposure along several watercourses in the study area, preventing a clear definition of the southwestern hotspot for either return period. This undermines its use in any form of city-scale prioritisation study. The elevated exposure along the smaller channels is likely because the bathymetry of these river channels has not been added to the GFM (minimum river size added is 50 km2—see Trigg et al., 2021). Compared to the MERIT DEM results, the GFM does a better job of showing the extent of exposure in the hotspot area, which is interesting given the GFM uses the MERIT DEM.
In summary, our results caution against assessing flood risk at the city scale using the Fathom 2.0 GFM or the other GFMs that have been documented in scientific literature in recent years (Yamazaki et al., 2011; Winsemius et al., 2013; Rudari et al., 2015; Sampson et al., 2015; Dottori et al., 2016; Ward et al., 2020; Zhou et al., 2021). As has been well noted by others (Sampson et al., 2015; Schumann and Bates, 2018), global DEM quality is regarded as a key limitation of GFMs. Our FABDEM testing here suggests that GFMs should improve considerably by using this DEM over MERIT, and Fathom have recently done this in the latest upgrade to their GFM version 3.0 (Hawker et al., 2023). Representing the bathymetry of smaller rivers would also seemingly improve the prospect of using future GFMs at the city scale. As GFMs continue to be enhanced with new methods and datasets, and computational advances enable resolution to be refined, researchers will need to continue benchmarking these models and the datasets they are using in an objective manner so that they can be used appropriately.
Having considered only one set of geographic and climatic conditions and used only a limited set of local data for validation, it is important to note that the generalisability of our findings is somewhat limited. Further research is needed to sample a wide range of geographic and climatic conditions and utilise a diverse array of local datasets for validation, which will enhance the generalisability of findings around global datasets. Nonetheless, for those interested in broad-scale flood risk assessment in similar low income, data scarce contexts, there are some practical implications:
• FABDEM provides a viable substitute for local terrain data for flood hazard modelling and should be used in preference to SRTM-derived elevation products. However, users should be mindful that global DEMs will generally tend to overpredict total flood extent and exposure.
• In the absence of local rainfall data, The PXR IDF dataset can be useful for prioritisation studies requiring a comparative assessment of flood exposure across a study area.
• Application of these global datasets and GFMs are best restricted to more extreme flood events such as the 1-in-100 years event. If high-frequency floods are to be assessed, particular caution should be exercised when using global datasets; for these events it becomes even more important to verify global hazard information with local observations and knowledge.
• Based on a workshop held in Addis Ababa in which the results of this study were presented to interested parties, the flood exposure maps that resulted from using FABDEM and PXR IDF data can be of use to practitioners and risk managers. Specifically, representatives from the Fire and Disaster Risk Management Commission, the Ethiopian meteorological institute, and the Ethiopian Construction and Works Corporation indicated that the exposure maps provided new insights into the spatial distribution of flood exposure across the city, and that the information would be useful for emergency response planning.
• Whilst our findings show that certain global datasets can be used credibly to assess flood exposure at the city scale, it is important to reiterate that these findings are specific to low-income settings where little or no physical flood defence or river engineering infrastructure exists. It is also worth noting that the scope of application of global datasets investigated here excludes more local reach or structure scale assessments; the design of individual mitigation measures; or the use of flood depth information for assessment of damages or mitigation scheme options.
This study evaluates the suitability of relevant global datasets for mapping flood hazard in support of city-scale flood risk assessments in data scarce, low to middle income contexts. Specifically, we test the use of FABDEM and MERIT DEM, the PXR global rainfall IDF dataset, and the Fathom 2.0 GFM in assessing flood exposure across Addis Ababa, Ethiopia. We find that FABDEM clearly outperforms the MERIT DEM. MERIT overestimated 1-in-100 years exposure by 75%; this figure was just 25% with FAB DEM, which is less deviation than that arising from the hydrodynamic model sensitivity tests. FABDEM also did a far better job of mapping the spatial distribution of exposure and matched closely the local 5 m DEM from photogrammetry used in the reference model. However, this finding does not hold for frequent flood events where inundation is more localised and sensitive to topographic approximations. The 1-in-5 years FABDEM flood exposure map does not match the reference model well, and is similar to that produced by the MERIT DEM. We therefore conclude that FABDEM is suitable for assessing flood risk at the city scale, but only flood risks associated with relatively low-frequency floods. The global IDF dataset also holds promise for assessing city scale flood risk associated with both low and high-frequency floods. Its use in place of in situ rainfall data elevated exposure estimates by a maximum of 50%, which is small relative to the overall uncertainty associated with the wider flood risk assessment process (particularly the vulnerability component of risk). However, more work is needed to generalise these findings by testing the global datasets in a range of geographic and climatic conditions and using a more diverse set of local data for validation. The Fathom 2.0 GFM we tested was unable to define the spatial distribution of exposure, which precludes its use at the city scale. However, we anticipate that by making use of FABDEM, the latest generation of GFMs will provide hazard information associated with low-frequency flood events that is relevant to city scale assessments in lower income countries. Further research will be needed to test new GFMs and other global datasets that continue to emerge to give users a sense of their limitations.
The datasets and HEC-RAS model presented in this study can be found in online repositories. The names of the repository/repositories and accession number(s) can be found below: Direct link: https://doi.org/10.5518/1428. The repository name is: Research Data Leeds.
AC: Formal Analysis, Investigation, Methodology, Software, Visualization, Writing–original draft. MT: Conceptualization, Project administration, Supervision, Writing–review and editing. AH: Conceptualization, Resources, Supervision, Writing–review and editing. MB: Data curation, Software, Writing–review and editing. AA: Project administration, Resources, Writing–review and editing. TB: Project administration, Resources, Validation, Writing–review and editing. CW: Conceptualization, Funding acquisition, Resources, Writing–review and editing.
The author(s) declare financial support was received for the research, authorship, and/or publication of this article. This work was funded by the UK Research and Innovation’s Global Challenges Research Fund (GCRF) through the Water Security and Sustainable Development Hub (Grant No. ES/S008179/1).
The authors declare that the research was conducted in the absence of any commercial or financial relationships that could be construed as a potential conflict of interest.
All claims expressed in this article are solely those of the authors and do not necessarily represent those of their affiliated organizations, or those of the publisher, the editors and the reviewers. Any product that may be evaluated in this article, or claim that may be made by its manufacturer, is not guaranteed or endorsed by the publisher.
The Supplementary Material for this article can be found online at: https://www.frontiersin.org/articles/10.3389/fenvs.2024.1330295/full#supplementary-material
Adugna, D., Lemma, B., Jensen, M. B., and Gebrie, G. S. (2019). Evaluating the hydraulic capacity of existing drain systems and the management challenges of stormwater in Addis Ababa, Ethiopia. J. Hydrology Regional Stud. 25, 100626. doi:10.1016/j.ejrh.2019.100626
Alaska Satellite Facility (2015). PALSAR RTC DEM information. Available from: https://asf.alaska.edu/information/palsar-rtc-dem-information/ (Accessed August 28, 2022).
Annis, A., Nardi, F., Morrison, R. R., and Castelli, F. (2019). Investigating hydrogeomorphic floodplain mapping performance with varying DTM resolution and stream order. Hydrological Sci. J. 64 (5), 525–538. doi:10.1080/02626667.2019.1591623
Arcement, G. J., and Schneider, V. R. (1984). Guide for selecting Manning’s roughness coefficients for natural channels and flood plains - metric version. Available from: https://static1.squarespace.com/static/55c211c8e4b06ea5799e6c03/t/5602fc54e4b01dadee166e55/1443036244638/GuideForSelectingManningsRoughnessCoefficients.pdf.
Bates, P. D., Quinn, N., Sampson, C., Smith, A., Wing, O., Sosa, J., et al. (2021). Combined modeling of US fluvial, pluvial, and coastal flood hazard under current and future climates. Water Resour. Res. 57 (2), 1–29. doi:10.1029/2020wr028673
Bekele, T. W., Haile, A. T., Trigg, M. A., and Walsh, C. L. (2022). Evaluating a new method of remote sensing for flood mapping in the urban and peri-urban areas: applied to Addis Ababa and the Akaki catchment in Ethiopia. Nat. Hazards Res. 2 (2), 97–110. doi:10.1016/j.nhres.2022.03.001
Bernhofen, M. V., Blenkin, F., and Trigg, M. A. (2023). Unknown risk: assessing refugee camp flood risk in Ethiopia. Environ. Res. Lett. 18 (6), 064041. doi:10.1088/1748-9326/acd8d0
Bernhofen, M. V., Cooper, S., Trigg, M., Mdee, A., Carr, A., Bhave, A., et al. (2022). The role of global data sets for riverine flood risk management at national scales. Water Resour. Res. 58 (4), 1–25. doi:10.1029/2021wr031555
Bernhofen, M. V., Trigg, M. A., Sleigh, P. A., Sampson, C. C., and Smith, A. M. (2021). Global flood exposure from different sized rivers. Nat. Hazards Earth Syst. Sci. 21 (9), 2829–2847. doi:10.5194/nhess-21-2829-2021
Bernhofen, M. V., Whyman, C., Trigg, M. A., Sleigh, P. A., Smith, A. M., Sampson, C. C., et al. (2018). A first collective validation of global fluvial flood models for major floods in Nigeria and Mozambique. Environ. Res. Lett. 13 (10), 104007. doi:10.1088/1748-9326/aae014
Birhanu, D., Kim, H., Jang, C., and Park, S. (2016). Flood risk and vulnerability of Addis ababa city due to climate change and urbanization. Procedia Eng. 154, 696–702. doi:10.1016/j.proeng.2016.07.571
BMT Group Ltd (2019). Catchment based flood mitigation and planning. Available from: https://www.tuflow.com/media/4971/201906-catchment-based-flood-mitigation-and-planning-flood-and-coast-uk.pdf.
Brunner, G. W. (2020a). HEC-RAS 2D modeling user’s manual version 6. (CPD-68A). https://www.hec.usace.army.mil/software/hec-ras/documentation/HEC-RAS%205.0%202D%20Modeling%20Users%20Manual.pdf.
Brunner, G. W. (2020b). HEC-RAS hydraulic reference manual. us army corps of engineers, hydrologic engineering center. 6(CPD-69). https://www.hec.usace.army.mil/software/hec-ras/documentation/HEC-RAS%205.0%20Reference%20Manual.pdf.
Cai, T., Li, X., Ding, X., Wang, J., and Zhan, J. (2019). Flood risk assessment based on hydrodynamic model and fuzzy comprehensive evaluation with GIS technique. Int. J. Disaster Risk Reduct. 35, 101077. doi:10.1016/j.ijdrr.2019.101077
Cantoni, E., Tramblay, Y., Grimaldi, S., Salamon, P., Dakhlaoui, H., Dezetter, A., et al. (2022). Hydrological performance of the ERA5 reanalysis for flood modeling in Tunisia with the LISFLOOD and GR4J models. J. Hydrology Regional Stud. 42, 101169. doi:10.1016/j.ejrh.2022.101169
Chen, H., Liang, Q., Liu, Y., and Xie, S. (2018). Hydraulic correction method (HCM) to enhance the efficiency of SRTM DEM in flood modeling. J. Hydrology 559, 56–70. doi:10.1016/j.jhydrol.2018.01.056
Copernicus (2021). Copernicus DEM - global and European digital elevation model. https://spacedata.copernicus.eu/collections/copernicus-digital-elevation-model.
Courty, L. G., Soriano-Monzalvo, J. C., and Pedrozo-Acuña, A. (2019). Evaluation of open-access global digital elevation models (AW3D30, SRTM, and ASTER) for flood modelling purposes. J. Flood Risk Manag. 12, 1–14. doi:10.1111/jfr3.12550
Courty, L. G., Wilby, R. L., Hillier, J. K., and Slater, L. J. (2019b). Intensity-duration-frequency curves at the global scale. Environ. Res. Lett. 14 (8), 084045. doi:10.1088/1748-9326/ab370a
De Paola, F., Giugni, M., Pugliese, F., Annis, A., and Nardi, F. (2018). GEV parameter estimation and stationary vs. non-stationary analysis of extreme rainfall in African test cities. Hydrology 5 (2), 28. doi:10.3390/hydrology5020028
De Risi, R., Jalayer, F., De Paola, F., Carozza, S., Yonas, N., Giugni, M., et al. (2020). From flood risk mapping toward reducing vulnerability: the case of Addis Ababa. Nat. Hazards 100 (1), 387–415. doi:10.1007/s11069-019-03817-8
Domeneghetti, A. (2016). On the use of SRTM and altimetry data for flood modeling in data-sparse regions. Water Resour. Res. 52 (4), 2901–2918. doi:10.1002/2015wr017967
Dottori, F., Salamon, P., Bianchi, A., Alfieri, L., Hirpa, F. A., and Feyen, L. (2016). Development and evaluation of a framework for global flood hazard mapping. Adv. Water Resour. 94, 87–102. doi:10.1016/j.advwatres.2016.05.002
Dusseau, D., Gassert, K., Hollander, J., Jacobsen, K., Naegele, A., Schwalm, C., et al. (2023). Climate risk assessment: Addis ababa, Ethiopia. Available from: https://woodwellclimate.org/.
Egbinola, C. N., Olaniran, H. D., and Amanambu, A. C. (2017). Flood management in cities of developing countries: the example of Ibadan, Nigeria. J. Flood Risk Manag. 10 (4), 546–554. doi:10.1111/jfr3.12157
Ekeu-wei, I. T., and Blackburn, G. A. (2018). Applications of open-access remotely sensed data for flood modelling and mapping in developing regions. Available from: http://www.mdpi.com/2306-5338/5/3/39.
Emerton, R., Cloke, H., Ficchi, A., Hawker, L., de Wit, S., Speight, L., et al. (2020). Emergency flood bulletins for Cyclones Idai and Kenneth: a critical evaluation of the use of global flood forecasts for international humanitarian preparedness and response. Int. J. Disaster Risk Reduct. 50, 101811. doi:10.1016/j.ijdrr.2020.101811
Englhardt, J., De Moel, H., Huyck, C. K., De Ruiter, M. C., Aerts, J. C. J. H., and Ward, P. J. (2019). Enhancement of large-scale flood risk assessments using building-material-based vulnerability curves for an object-based approach in urban and rural areas. Nat. Hazards Earth Syst. Sci. 19 (8), 1703–1722. doi:10.5194/nhess-19-1703-2019
Farr, T. G., Rosen, P. A., Caro, E., Crippen, R., Duren, R., Hensley, S., et al. (2007). The Shuttle radar topography mission. Rev. Geophys. 45 (2), RG2004. doi:10.1029/2005rg000183
Fathom (2019). Fathom-global 2.0. Available from: https://www.fathom.global/product/global-flood-map/ (Accessed April 11, 2021).
Fleischmann, A., Paiva, R., and Collischonn, W. (2019). Can regional to continental river hydrodynamic models be locally relevant? A cross-scale comparison. J. Hydrology 3, 100027. doi:10.1016/j.hydroa.2019.100027
Gleason, C. J. (2015). Hydraulic geometry of natural rivers: a review and future directions. Prog. Phys. Geogr. 39 (3), 337–360. doi:10.1177/0309133314567584
Gleixner, S., Demissie, T., and Diro, G. T. (2020). Did ERA5 improve temperature and precipitation reanalysis over East Africa? Atmosphere 11 (9), 996–1019. doi:10.3390/atmos11090996
Golder Associates (2021). Satellite-based rainfall data closing meteorological data gaps. Available from: https://www.golder.com/insights/satellite-based-rainfall-data-closing-meteorological-data-gaps/ (Accessed October 18, 2022).
Haile, A. T., Tefera, F. T., and Rientjes, T. (2016). Flood forecasting in Niger-Benue basin using satellite and quantitative precipitation forecast data. Int. J. Appl. Earth Observation Geoinformation 52, 475–484. doi:10.1016/j.jag.2016.06.021
Hawker, L., Bates, P., Neal, J., and Rougier, J. (2018). Perspectives on digital elevation model (DEM) simulation for flood modeling in the absence of a high-accuracy open access global DEM. Front. Earth Sci. 6, 1–9. doi:10.3389/feart.2018.00233
Hawker, L., Neal, J., Savage, J., Kirkpatrick, T., Zylberberg, Y., Groeger, A., et al. (2023). Evaluating the next generation of global flood models in the Central Highlands of Vietnam. Nat. Hazards Earth Syst. Sci. Discuss. doi:10.5194/nhess-2023-93
Hawker, L., Neal, J., Tellman, B., Liang, J., Schumann, G., Doyle, C., et al. (2020). Comparing earth observation and inundation models to map flood hazards. Environ. Res. Lett. 15 (12), 124032. doi:10.1088/1748-9326/abc216
Hawker, L., Uhe, P., Paulo, L., Sosa, J., Savage, J., Sampson, C., et al. (2022). A 30 m global map of elevation with forests and buildings removed. Environ. Res. Lett. 17 (2), 024016. doi:10.1088/1748-9326/ac4d4f
Hersbach, H., Bell, B., Berrisford, P., Hirahara, S., Horányi, A., Nicolas, J., et al. (2020). The ERA5 global reanalysis. Q. J. R. Meteorological Soc. 149, 1999–2049. doi:10.1002/qj.3803
Horrit, M., Shaad, K., and Gill, E. (2009). Sewer capacity and infiltration analysis. Internal Technical Note (WBSWFR/TN3). Bristol, United Kingdom: UK Environment Agency.
Keaney, M., and Jaegerfelt Mouritsen, P. (2015). CITIES100: 100 solutions for climate action in cities. Available from https://issuu.com/sustainia/docs/cities100.
Kettner, A., Schumann, G., and Tellman, B. (2019). The push toward local flood risk assessment at a global scale. Eos 100, 19–21. doi:10.1029/2019eo113857
Komi, K., Neal, J., Trigg, M. A., and Diekkrüger, B. (2017). Modelling of flood hazard extent in data sparse areas: a case study of the Oti River basin, West Africa. J. Hydrology Regional Stud. 10, 122–132. doi:10.1016/j.ejrh.2017.03.001
Lamb, R., Crossley, M., and Waller, S. (2009). A fast two-dimensional floodplain inundation model. Proc. Institution Civ. Eng. Water Manag. 162 (6), 363–370. doi:10.1680/wama.2009.162.6.363
Leopold, L. B., and Maddock, T. J. (1953). The hydraulic geometry of stream channels and some physiographic implications. Available from https://pubs.usgs.gov/publication/pp252.
Li, C., Dash, J., Asamoah, M., Sheffield, J., Dzodzomenyo, M., Gebrechorkos, S. H., et al. (2022). Increased flooded area and exposure in the White Volta river basin in Western Africa, identified from multi-source remote sensing data. Sci. Rep. 12 (1), 3701–3713. doi:10.1038/s41598-022-07720-4
Lindersson, S., Brandimarte, L., Mård, J., and Di Baldassarre, G. (2020). A review of freely accessible global datasets for the study of floods, droughts and their interactions with human societies. WIREs Water 7 (3), 1–20. doi:10.1002/wat2.1424
Lindsay, J. B. (2018). A new method for the removal of off-terrain objects from LiDAR-derived raster surface models. Available from: https://www.researchgate.net/publication/323003064_A_new_method_for_the_removal_of_off-terrain_objects_from_LiDAR-derived_raster_surface_models (Accessed October 18, 2022).
Lumbroso, D. (2020). Flood risk management in Africa. J. Flood Risk Manag. 13 (3), 1–5. doi:10.1111/jfr3.12612
Martel, J.-L., Brissette, F. P., Lucas-Picher, P., Troin, M., and Arsenault, R. (2021). Climate change and rainfall intensity–duration–frequency curves: overview of science and guidelines for adaptation. J. Hydrologic Eng. 26 (10), 1–18. doi:10.1061/(asce)he.1943-5584.0002122
McClean, F., Dawson, R., and Kilsby, C. (2020). Implications of using global digital elevation models for flood risk analysis in cities. Water Resour. Res. 56 (10). doi:10.1029/2020wr028241
McClean, F., Dawson, R., and Kilsby, C. (2021). Intercomparison of global reanalysis precipitation for flood risk modelling. Hydrology Earth Syst. Sci. Discuss., 1–13. doi:10.5194/hess-2021-153
Mercogliano, P., Rianna, G., Reder, A., Raffa, M., Padulano, R., Essenfelder, A., et al. (2022). Flood risk indicators for European cities from 1989 to 2018. Copernicus climate change service (C3S) climate data store (CDS). Available from: https://cds.climate.copernicus.eu/cdsapp#!/dataset/sis-european-risk-flood-indicators (Accessed October 18, 2022).
Merz, B., and Thieken, A. H. (2009). Flood risk curves and uncertainty bounds. Nat. Hazards 51 (51), 437–458. doi:10.1007/s11069-009-9452-6
Minderhoud, P. S. J., Coumou, L., Erkens, G., Middelkoop, H., and Stouthamer, E. (2019). Mekong delta much lower than previously assumed in sea-level rise impact assessments. Nat. Commun. 10 (1), 3847–3913. doi:10.1038/s41467-019-11602-1
Molinari, D., De Bruijn, K. M., Castillo-Rodríguez, J. T., Aronica, G. T., and Bouwer, L. M. (2019). Validation of flood risk models: current practice and possible improvements. Int. J. Disaster Risk Reduct. 33, 441–448. doi:10.1016/j.ijdrr.2018.10.022
Neal, J., Hawker, L., Savage, J., Durand, M., Bates, P., and Sampson, C. (2021). Estimating River channel bathymetry in large scale flood inundation models. Water Resour. Res. 57 (5), 1–22. doi:10.1029/2020wr028301
Neal, J., Schumann, G. J. P., and Bates, P. (2012). A subgrid channel model for simulating river hydraulics and floodplain inundation over large and data sparse areas. Water Resour. Res. 48 (11), 1–16. doi:10.1029/2012wr012514
OpenStreetMap contributors (2022). OpenStreetMap contributors. Data retrieved from http://overpass-turbo.eu/.
Quinn, N., Bates, P. D., Neal, J., Smith, A., Wing, O., Sampson, C., et al. (2019). The spatial dependence of flood hazard and risk in the United States. Water Resour. Res. 55 (3), 1890–1911. doi:10.1029/2018wr024205
Reder, A., Raffa, M., Padulano, R., Rianna, G., and Mercogliano, P. (2022). Characterizing extreme values of precipitation at very high resolution: an experiment over twenty European cities. Weather Clim. Extrem. 35, 100407. doi:10.1016/j.wace.2022.100407
Rentschler, J., Salhab, M., and Jafino, B. A. (2022). Flood exposure and poverty in 188 countries. Nat. Commun. 13 (1), 3527–3611. doi:10.1038/s41467-022-30727-4
Rivosecchi, A., and Singh, M. (2023). Small island city flood risk assessment: the case of kingston, Jamaica. WaterSwitzerl. 15 (22), 3936. doi:10.3390/w15223936
Ross, C. W., Prihodko, L., Anchang, J., Kumar, S., Ji, W., and Hanan, N. P. (2018). Data Descriptor: HYSOGs250m, global gridded hydrologic soil groups for curve-number-based runoff modeling. Sci. data 5, 180091. doi:10.1038/sdata.2018.91
Rudari, R., Silvestro, F., Campo, L., Rebora, N., Boni, G., and Herold, C. (2015). Improvement of the global flood model for the GAR 2015. https://irrigation.sindh.gov.pk/files/books/IMPROVEMENT%20OF%20THE%20GLOBAL%20FLOOD%20MODEL%20FOR%20THE%20GAR%202015.pdf.
Ryan, P., Syme, B., Gao, D. S., and Collecutt, G. (2022). Direct rainfall hydraulic model validation in: hydrology and water Resources symposium. Available from: https://www.tuflow.com/media/7545/2022-direct-rainfall-hydraulic-model-validation-ryan-et-al-hwrs.pdf.
Saksena, S., and Merwade, V. (2015). Incorporating the effect of DEM resolution and accuracy for improved flood inundation mapping. J. Hydrology 530, 180–194. doi:10.1016/j.jhydrol.2015.09.069
Sampson, C. C., Smith, A. M., Bates, P. D., Neal, J. C., Alfieri, L., and Freer, J. E. (2015). A high-resolution global flood hazard model. Water Resour. Res. 51, 7358–7381. doi:10.1002/2015wr016954
Sayers, P., Horritt, M., Carr, S., Kay, A., Mauz, J., Lamb, R., et al. (2020). Third UK climate change risk assessment (CCRA3): future flood risk. Available from: https://www.ukclimaterisk.org/independent-assessment-ccra3/research-supporting-analysis/.
Sayers and Partners (2019). Georgetown, Guyana: disaster risk and climate change vulnerability assessment. A report for the inter-American development bank produced in association with vivid economics and aether. Available from: http://www.sayersandpartners.co.uk/guyana-ccra.html.
Scharffenberg, B., Bartles, M., Brauer, T., Fleming, M., and Karlovits, G. (2018). Hydrologic modeling system user’s manual. Available from: https://www.hec.usace.army.mil/software/hec-hms/documentation/HEC-HMS_Users_Manual_4.3.pdf.
Schumann, G. J. P., and Bates, P. D. (2018). The need for a high-accuracy, open-access global DEM. Front. Earth Sci. 6, 1–5. doi:10.3389/feart.2018.00225
Schumann, G. J. P., Brakenridge, G. R., Kettner, A. J., Kashif, R., and Niebuhr, E. (2018). Assisting flood disaster response with earth observation data and products: a critical assessment. Remote Sens. 10 (8), 1230–1319. doi:10.3390/rs10081230
Schumann, G. J. P., Neal, J. C., Voisin, N., Andreadis, K. M., Pappenberger, F., Phanthuwongpakdee, N., et al. (2013). A first large-scale flood inundation forecasting model. Water Resour. Res. 49 (10), 6248–6257. doi:10.1002/wrcr.20521
Scottish Environment Protection Agency (2018). Flood modelling guidance for responsible authorities. Available from: https://www.sepa.org.uk/media/219653/flood_model_guidance_v2.pdf.
Shouler, M., Ellis, L., Bruebach, K., and Rawoot, S. (2021). Addis ababa city characterisation report. City Water Resil. Approach.
Sirko, W., Kashubin, S., Ritter, M., Annkah, A., Bouchareb, Y. S. E., Dauphin, Y., et al. (2021). Continental-scale building detection from high resolution satellite imagery. Google Res., 1–15. doi:10.48550/arXiv.2107.12283
3SPROSPECT (2021). 1D-2D flood modelling for the labasa by-pass Project, Fiji. Fiji geospatial information management council website. Available from: http://www.fgimc.gov.fj/Documents/3.2021/1.FebUF/4.3SProspect_1D-2DFloodModellingLabasa.pdf (Accessed January 10, 2024).
Tanim, A. H., McRae, C. B., Tavakol-davani, H., and Goharian, E. (2022). Flood detection in urban areas using satellite imagery and machine learning. WaterSwitzerl. 14 (7), 1140. doi:10.3390/w14071140
Tavares da Costa, R., Mazzoli, P., and Bagli, S. (2019). Limitations posed by free DEMs in watershed studies: the case of river Tanaro in Italy. Front. Earth Sci. 7 (June). doi:10.3389/feart.2019.00141
Tellman, B., Sullivan, J. A., Kuhn, C., Kettner, A. J., Doyle, C. S., Brakenridge, G. R., et al. (2021). Satellite imaging reveals increased proportion of population exposed to floods. Nature 596 (7870), 80–86. doi:10.1038/s41586-021-03695-w
Trigg, M. A., Bernhofen, M., Marechal, D., Alfieri, L., Dottori, F., Hoch, J., et al. (2021). “Global flood models,” in Global drought and flood: observation, modeling, and prediction, geophysical monograph 265. Editors H. Wu, D. Lettenmaier, Q. Tang, and P. J. Ward (Hoboken, New Jersey, United States: John Wiley and Sons, Ltd), 181–200.
Trigg, M. A., Birch, C. E., Neal, J., Bates, P. D., Smith, A., Sampson, C. C., et al. (2016). The credibility challenge for global fluvial flood risk analysis. Environ. Res. Lett. 11 (9), 094014. doi:10.1088/1748-9326/11/9/094014
UK Environment Agency (2019). What is the risk of flooding from surface water map? Available from: https://www.gov.uk/government/publications/flood-maps-for-surface-water-how-they-were-produced.
USAID (2017). Climate change risk profile: Ethiopia. Fact Sheet. https://www.usaid.gov/sites/default/files/2023-03/2022-USAID-Ethiopia-Climate-Change-Country-Profile.pdf.
USDA (1986). Technical release 55. Available from: https://www.nrcs.usda.gov/Internet/FSE_DOCUMENTS/stelprdb1044171.pdf.
Uuemaa, E., Ahi, S., Montibeller, B., Muru, M., and Kmoch, A. (2020). Vertical accuracy of freely available global digital elevation models (Aster, aw3d30, merit, tandem-x, srtm, and nasadem). Remote Sens. 12 (21), 3482–3523. doi:10.3390/rs12213482
van de Giesen, N., Hut, R., and Selker, J. (2014). The trans-african hydro-meteorological observatory (TAHMO). WIREs Water 1 (4), 341–348. doi:10.1002/wat2.1034
van Leuwen, Z., Gill, E., Hunter, N., and Blazey, N. (2019). Improving surface water flood mapping: estimating local drainage rates. Available from: https://assets.publishing.service.gov.uk/media/603660e18fa8f5480ff52477/Improving_surface_water_flood_mapping_-_estimating_local_drainage_rates_-_report.pdf.
Ward, P. J., Jongman, B., Salamon, P., Simpson, A., Bates, P., De Groeve, T., et al. (2015). Usefulness and limitations of global flood risk models. Nat. Clim. Change. 5 (8), 712–715. doi:10.1038/nclimate2742
Ward, P. J., Winsemius, H. C., Kuzma, S., Bierkens, M. F. P., Bouwman, A., Moel, H.De, et al. (2020). Aqueduct floods methodology. Washington, D.C., United States: World Resources Institute, 1–28.
Winsemius, H. C., Van Beek, L. P. H., Jongman, B., Ward, P. J., and Bouwman, A. (2013). A framework for global river flood risk assessments. Hydrology Earth Syst. Sci. 17 (5), 1871–1892. doi:10.5194/hess-17-1871-2013
World Bank (2015). Addis ababa, Ethiopia: enhancing enhansing urban resilience, Resilient Cities Program, 1–46.
Xing, Y., Shao, D., Liang, Q., Chen, H., Ma, X., and Ullah, I. (2022). Investigation of the drainage loss effects with a street view based drainage calculation method in hydrodynamic modelling of pluvial floods in urbanized area. J. Hydrology 605 (200), 127365. doi:10.1016/j.jhydrol.2021.127365
Xu, H. (2006). Modification of normalised difference water index (NDWI) to enhance open water features in remotely sensed imagery. Int. J. Remote Sens. 27 (14), 3025–3033. doi:10.1080/01431160600589179
Yamazaki, D., De Almeida, G. A. M., and Bates, P. D. (2013). Improving computational efficiency in global river models by implementing the local inertial flow equation and a vector-based river network map. Water Resour. Res. 49 (11), 7221–7235. doi:10.1002/wrcr.20552
Yamazaki, D., Ikeshima, D., Tawatari, R., Yamaguchi, T., O’Loughlin, F., Neal, J., et al. (2017). A high-accuracy map of global terrain elevations. Geophys. Res. Lett. 44 (11), 5844–5853. doi:10.1002/2017gl072874
Yamazaki, D., Kanae, S., Kim, H., and Oki, T. (2011). A physically based description of floodplain inundation dynamics in a global river routing model. Water Resour. Res. 47 (4). doi:10.1029/2010wr009726
Yu, D., Yin, J., and Liu, M. (2016). Validating city-scale surface water flood modelling using crowd-sourced data. Environ. Res. Lett. 11 (12), 124011. doi:10.1088/1748-9326/11/12/124011
Zanaga, D., Van De Kerchove, R., De Keersmaecker, W., Souverijns, N., Brockmann, C., Quast, R., et al. (2021). ESA WorldCover 10 m 2020 v100. https://developers.google.com/earth-engine/datasets/catalog/ESA_WorldCover_v100.
Zhao, G., Bates, P. D., Neal, J., and Yamazaki, D. (2023). Flood defense standard estimation using machine learning and its representation in large-scale flood hazard modeling. Water Resour. Res. 59 (5), 1–21. doi:10.1029/2022wr032395
Keywords: floods, cities, global datasets, rain-on-grid model, hydraulic model, risk
Citation: Carr AB, Trigg MA, Haile AT, Bernhofen MV, Alemu AN, Bekele TW and Walsh CL (2024) Using global datasets to estimate flood exposure at the city scale: an evaluation in Addis Ababa. Front. Environ. Sci. 12:1330295. doi: 10.3389/fenvs.2024.1330295
Received: 30 October 2023; Accepted: 29 January 2024;
Published: 12 February 2024.
Edited by:
Yong Q. Tian, Central Michigan University, United StatesReviewed by:
Anang Widhi Nirwansyah, Muhammadiyah University of Purwokerto, IndonesiaCopyright © 2024 Carr, Trigg, Haile, Bernhofen, Alemu, Bekele and Walsh. This is an open-access article distributed under the terms of the Creative Commons Attribution License (CC BY). The use, distribution or reproduction in other forums is permitted, provided the original author(s) and the copyright owner(s) are credited and that the original publication in this journal is cited, in accordance with accepted academic practice. No use, distribution or reproduction is permitted which does not comply with these terms.
*Correspondence: Andrew B. Carr, YS5iLmNhcnJAbGVlZHMuYWMudWs=
Disclaimer: All claims expressed in this article are solely those of the authors and do not necessarily represent those of their affiliated organizations, or those of the publisher, the editors and the reviewers. Any product that may be evaluated in this article or claim that may be made by its manufacturer is not guaranteed or endorsed by the publisher.
Research integrity at Frontiers
Learn more about the work of our research integrity team to safeguard the quality of each article we publish.