
94% of researchers rate our articles as excellent or good
Learn more about the work of our research integrity team to safeguard the quality of each article we publish.
Find out more
ORIGINAL RESEARCH article
Front. Environ. Sci., 10 January 2024
Sec. Atmosphere and Climate
Volume 11 - 2023 | https://doi.org/10.3389/fenvs.2023.1303152
This article is part of the Research TopicCrucial Air Quality, Atmospheric Environment, and Climate Change in Low- and Middle-Income CountriesView all 8 articles
 Pongsakon Punpukdee1
 Ekbordin Winijkul1*
 Pyae Phyo Kyaw1
 Salvatore G. P. Virdis2Wenchao Xue1
 Thi Phuoc Lai Nguyen1
In the recent years, concentration of fine particulate matter that are 2.5 microns or less in diameter (PM2.5) in Thailand has consistently exceeded the national ambient air quality standard. Currently, the measurement of PM2.5 concentration relies on air quality monitoring stations operated by the Pollution Control Department of Thailand (PCD). However, these stations are insufficient, particularly in rural areas, where agricultural open burning are major sources of pollution after harvesting period. This study aims to enhance the monitoring of PM2.5 concentration by leveraging cost-effective technologies. We propose the integration of satellite data, specifically Aerosol Optical Depth (AOD) from Multi-Angle Atmospheric Correction (MAIAC) product and Himawari-8 satellites, with the Weather Research and Forecasting Model (WRF) data, to provide supplementary data to the ground-based monitoring. Hourly 5 × 5 km2 AOD data from Himawari-8 were downscaled to a high-resolution of 1 × 1 km2, leveraging the AOD distribution pattern of the concurrent MAIAC product using eXtreme Gradient Boosting (XGBoost) model. Notably, during Thailand’s rainy season (May to August), the study observed a relative reduction in the training model’s R-square value. This phenomenon is attributed to temporal discrepancies between Himawari-8 and the MAIAC products during this period. The predictive models of PM2.5 concentrations with the identification of pertinent variables through Pearson’s correlation analysis and recursive feature elimination, driven by the robust XGBoost model. Subsequently, the downscaled AOD, wind speed, temperature, and pressure were identified as predictors for the estimation of hourly PM2.5 concentration. This comprehensive approach enabled the projection of PM2.5 levels across Thailand, encompassing over 600,000 grids at 1 × 1 km2 resolution. The developed models, thus, offer a valuable tool for robust and high-resolution PM2.5 concentration estimation, presenting significant implications for air quality monitoring and management in Thailand.
In recent decades, the global community has experienced a growing concern over the emission of air pollution resulting from human activities, such as transportation, industry, biomass burning. The World Health Organization (WHO) reported in 2014 that air pollution was accountable for approximately 7 million premature deaths worldwide (Amnuaylojaroen et al., 2020). Prolonged exposure to elevated levels of air pollution poses diverse health risks, with a particular emphasis on the impact of PM2.5 (fine particulate matter with a diameter of 2.5 micron or less), a significant air pollutant that profoundly affects human health and wellbeing (Lelieveld et al., 2013; Amnuaylojaroen et al., 2019). PM2.5 possesses the ability to deeply penetrate the respiratory tract and enter the lungs, leading to impaired lung function and the exacerbation of medical conditions such as asthma and heart disease (Tsai et al., 2000; Vichit-Vadakan et al., 2001; Jinsart et al., 2002).
Southeast Asia, notably during dry season, faces recurrent annual air pollution problems predominantly attributed to biomass combustion (Yin et al., 2019). The extensive burning of biomass and other human activities have substantially contributed to the deterioration of air quality in Southeast Asia (Lee et al., 2018; Lee et al., 2019). Furthermore, unfavorable meteorological and geographical conditions also contribute to the air pollution challenges experienced in this region. Northern Thailand, in particular, characterized by its mountainous areas and surrounding rice fields, encounters escalating issues compounded by traffic congestion and the practice of burning stubble prior to the rainy season. As a result, air pollution is accumulated in narrow valleys (Oanh et al., 2006; Amnauylawjarurn et al., 2010; Oanh and Leelasakultum, 2011; Lee et al., 2019).
To measure the concentration of fine particulate matter or PM2.5, it commonly relies on ambient air quality monitoring stations. However, these methods possess inherent limitations (such as costs of the equipment, monitoring and maintenance, availability of technical staffs) and may not provide comprehensive coverage of air quality across all areas (Qu et al., 2017). Consequently, estimating fine particulate matter concentration in the area with limited monitoring stations has emerged as a critical area of research. Estimation methods for PM2.5 concentration can be broadly categorized into two types: those based on ground-level monitors and those that utilize satellite-based data. Ground-level monitor-based estimation approaches encompass techniques, such as land use regression models, generalized additive mixed models, hierarchical models, and geostatistical interpolation. On another hand, satellite-based estimation methods depend on remote sensing techniques (Qu et al., 2017; Zhang G. et al., 2018). Integrating remote sensing data from satellites, such as AOD with local measurement of meteorological parameters is increasingly being adopted in air quality monitoring practices (Hoff and Christopher, 2009). Machine learning and statistical models are frequently combined with satellite data to estimate PM2.5 concentrations at a finer spatial resolution (Zhang T. et al., 2018; Joharestani et al., 2019; Xie et al., 2019; Yao et al., 2019; Yang et al., 2020). Previous studies have attempted to capture the relationship between PM2.5 and satellite-retrieved AOD data using regression models (Bai et al., 2016; Yao et al., 2019). Random forest (RF) and XGBoost have been employed to predict PM2.5 levels in many studies (Hu et al., 2017; Xiao et al., 2018).
Previous studies have predominantly concentrated on estimating ground-level PM2.5 concentrations using AOD from different satellites. Specifically, a spatial resolution of 10 × 10 km2 MODIS AOD has conventionally been employed to derive ambient concentrations of PM2.5 on regional scales (Ma et al., 2014; Kong et al., 2016). Recently, a 3 × 3 km2 MODIS AOD has been applied to delve into finer spatial details at urban levels, contributing to population-based PM2.5 exposure and health effect studies (Xie et al., 2015). Moreover, most PM2.5 estimations are typically presented at spatial resolutions of 3–10 km2 to provide air quality in the study areas (Hongthong et al., 2022). The AOD from the MAIAC product represents a cutting-edge technique that combines pixel and image-based processing with time series analysis. The high-resolution (1 × 1 km2) AOD dataset minimizes spatiotemporal heterogeneities, thereby enhancing the overall accuracy of ground-level PM concentration estimates (Lyapustin et al., 2011). Another notable AOD product is Himawari-8 AOD, providing a high temporal resolution AOD product which is useful for investigating diurnal variations in air pollution with a spatial-temporal resolution of 5 × 5 km2. Recent research in China has started estimating real-time hourly ground-level PM2.5 using the Himawari-8 AOD product (Chen J. et al., 2019; Sun et al., 2021; Xu et al., 2021). However, few studies have been conducted in Thailand, where air quality monitoring stations are limited (Peng-in et al., 2022).
In Thailand, prior studies have predominantly focused on estimating PM2.5 concentrations in specific regions, particularly in Chiang Mai province and the Northern region. The estimation of PM2.5 concentrations in Chiang Mai province utilized AOD data from MODIS with a spatial resolution of 10 × 10 km2 and meteorological data from Thailand’s Pollution Control Department through a multiple linear regression model. However, the study faced limitations related to low spatial resolution and the constrained spatial distribution of meteorological data from air quality monitoring stations (Kanabkaew, 2013). Other studies have also centered on estimating PM2.5 concentrations based on the AOD of the MODIS-Terra platform, which provides a spatial resolution of 10 × 10 km2. These studies employed multiple or multivariate linear regression techniques for PM2.5 concentration estimation (Kanabkaew, 2013; Wei et al., 2019; Amnuaylojaroen, 2022; Wongnakae et al., 2023). Another AOD product used for estimating particulate matter is the MAIAC product, offering a higher spatial resolution than other products. Hongthong et al. (2023) utilized this product to estimate PM10 concentration in some provinces of Northern Thailand, using the data to assess the attributed respiratory disease burden. However, this study identified limitations in predicting PM10 concentration, attributed to the availability of weather data only at monitoring stations and the MAIAC-AOD being available only once per day (Hongthong et al., 2023).Additionally, predicting PM2.5 is challenging as it is influenced by different factors, including weather conditions and environmental seasonality, all of which can significantly affect the regression models used for prediction (Amnuaylojaroen, 2022). In this study, our focus was to develop the method to enhance the spatial and temporal resolutions of AOD using products from two satellites, and incorporating weather parameters from the WRF to improve ground-level PM2.5 estimation in Thailand. This study holds significance not only in elucidating the high-resolution spatial distribution of PM2.5 concentration on an hourly basis, but also in its potential applications, such as solar energy assessment (Luo et al., 2019), aerosol data assimilation (Zhang et al., 2021).
The study was conducted to estimate hourly 1 × 1 km2 PM2.5 concentration over Thailand. Figure 1 illustrates the study area, including the locations of ambient air quality monitoring stations used in this study. These ambient air quality monitoring stations are operating by the Thailand Pollution Control Department (PCD). Across the region, there are 73 monitoring stations that monitor different air quality parameters, i.e., carbon monoxide, nitrogen oxide, sulfur dioxide, ozone, and particulate matter (PM2.5 and PM10), as well as weather parameters, including wind speed, wind direction, relative humidity, and temperature from 2018 to 2021. However, it should be noted that not all pollutant and meteorological parameters are measured at every station.
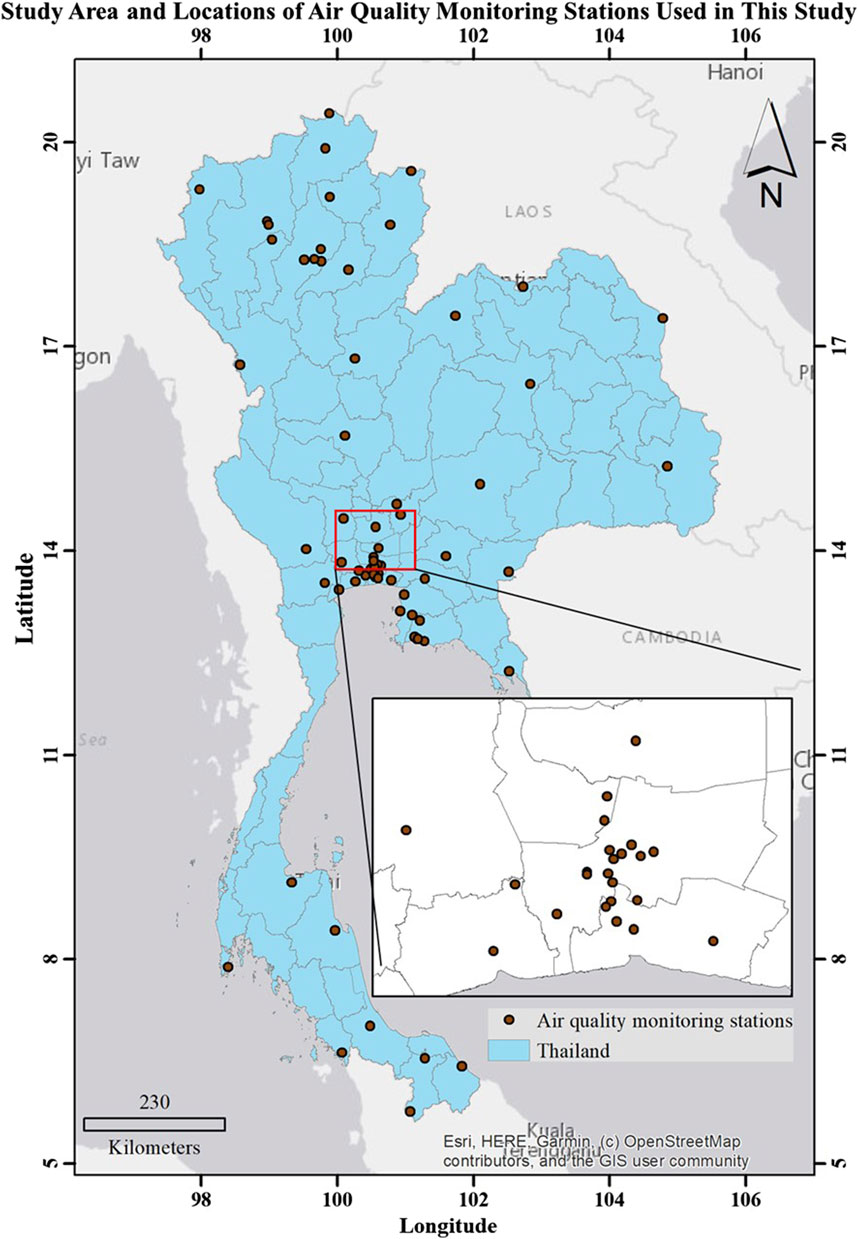
FIGURE 1. Study area and locations of air quality monitoring stations used in this study.
Data in this study were collected from four sources as follows:
The first dataset used in this study was the AOD from the Himawari-8 satellite, known for its remarkable ability to capture full-disk observations at 10-min intervals. It is also renowned for its precise detection and mapping of volcanic ash and aerosols, as indicated in previous studies (Marchese et al., 2018; Gao et al., 2021; Fu et al., 2023). The study used the spatial of 5 × 5 km2 and a temporal resolution of 1 h, making them suitable for our research purposes for hourly monitoring data.
The second dataset, Multi-Angle Atmospheric Correction (MAIAC), derives its data from the Moderate Resolution Imaging Spectroradiometer (MODIS). This algorithm relies on time series analysis to determine spectral surface reflectance, a critical factor in aerosol retrieval. MAIAC’s AOD retrievals have played a pivotal role in estimating ground-level PM distributions and supporting epidemiological studies on air pollution, as highlighted in existing research (Xiao et al., 2017). For our study, we utilized a spatial resolution of 1 × 1 km2 and a temporal resolution of 1 day.
The third data was hourly average PM2.5 concentration from 2018 to 2021 which were collected from 69 ambient air quality monitoring stations operated by PCD (69 stations from all 73 stations have PM2.5 monitoring equipment). From all 69 monitoring stations, 23 monitoring stations were in Bangkok Metropolitan Region. There were 10 stations in central Thailand, 5 stations in northeast Thailand, 9 stations in east Thailand, 14 stations in north Thailand and 8 stations in south Thailand.
Lastly, meteorological data were extracted from the WRF model provided by the Thai Meteorological Department (TMD). The WRF data includes weather parameters, such as air pressure, temperature, wind speed, wind direction, accumulated rainfall. These parameters were averaged on an hourly basis and had a spatial resolution of 6 × 6 km2.
In conclusion, data collected in this study are summarized in Table 1.
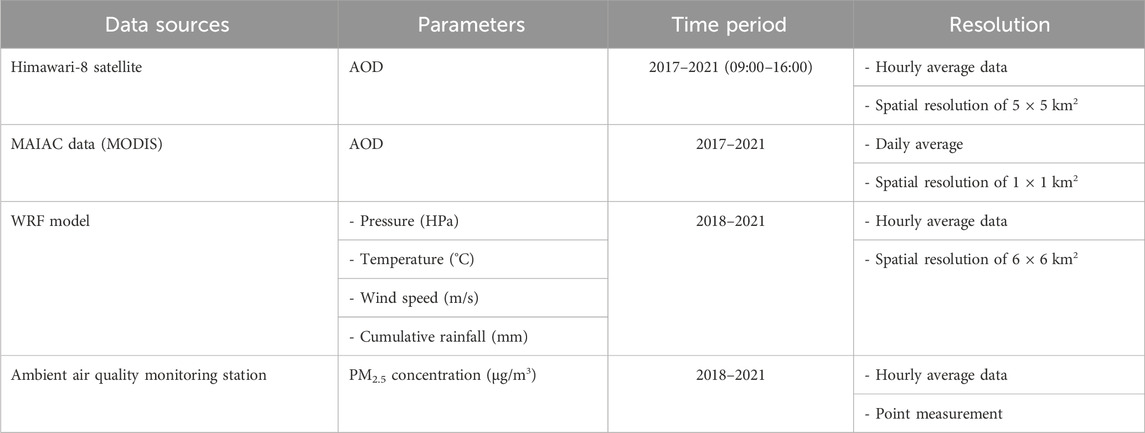
TABLE1. Summary of Data Collection in this Study.
This study used Python programming to process the data. The main workflow encompassed downscaling hourly Himawari-8 AOD data from 5 × 5 km2 to 1 × 1 km2 resolution. Then, machine learning models were employed to predict PM2.5 concentration using downscaled AOD and meteorological parameters. Figure 2 shows the workflow in this study.
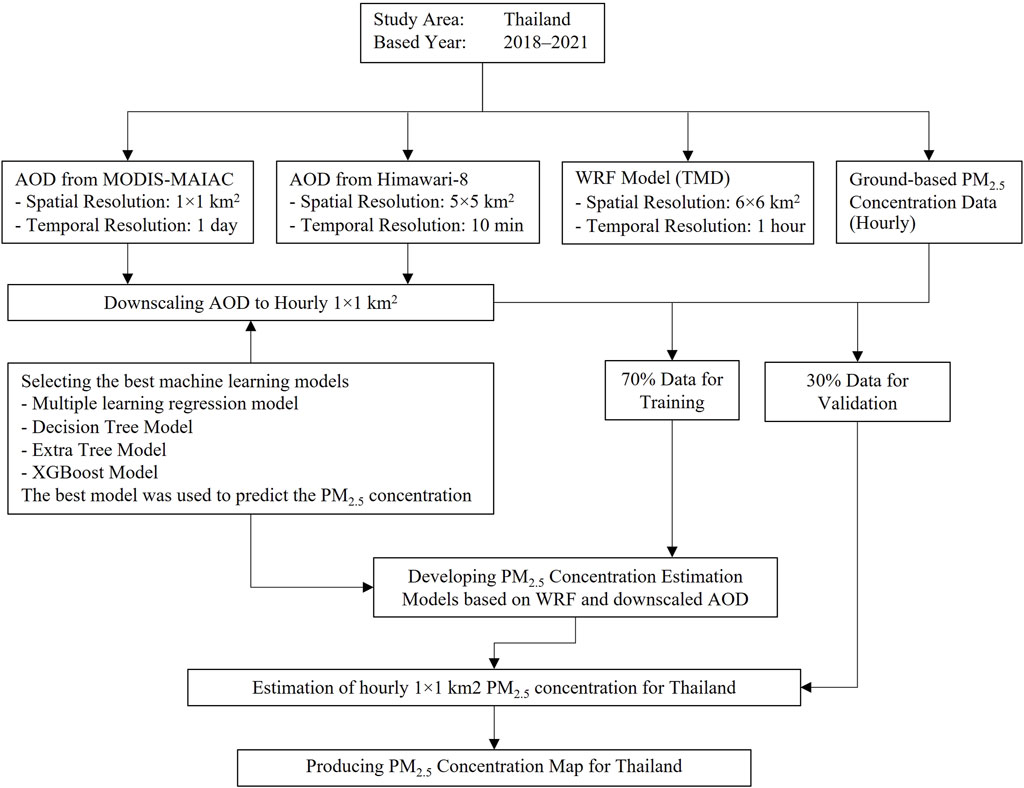
FIGURE 2. Overall methodology of the study.
Aerosol Optical Depth from Himawari-8 with a spatial resolution of 5 × 5 km2 and temporal resolution of 1 h from 9:00 to 16:00 were downloaded in the format of netCDF. To process the data, the rioxarray library in Python was employed to convert the data format into a raster format. Additionally, the geopandas library was used to extract the data and save it in a CSV file for further analysis.
The MAIAC data, obtained from the MODIS sensors on Terra and Aqua satellites. The product used in this study is MCD19A2, which is provided in TIFF file format with a daily average and a spatial resolution of 1 × 1 km2. To process the data, Python’s rasterio library was utilized to extract the relevant information. Subsequently, the geopandas library was employed to save the extracted data in a CSV file format, enabling further analysis of the data.
The WRF model data, acquired from the Thai Meteorological Department, is provided in CSV file format. In this study, the pandas and geopandas libraries were employed to extract the data and save it into a CSV file with a format consistent with the Himawari-8 and MAIAC data. This standardized format allows seamless integration and further analysis of the data, enabling efficient utilization in this study.
In the course of this investigation, five distinct machine learning algorithms were scrutinized, with the optimal model subsequently chosen for the downscaling of AOD and the formulation of a PM2.5 prediction model. The five machine learning models under consideration include.
Recursive Feature Elimination (RFE) is a crucial feature selection technique employed to identify and remove the weakest features within a dataset. Its primary objective is to determine the optimal set of features for a given dataset (Granitto et al., 2006; Yan and Zhang, 2015). RFE iteratively eliminates features until the desired number of features remains. The ranking of features is assessed by the RFE model, which systematically removes features during each iteration to address issues like collinearity and dependencies in the model (Ketu, 2022).
Multiple Linear Regression (MLR) is a widely used statistical model for investigating the relationship between a continuous response variable and one or more predictor variables, which can be either continuous or categorical. MLR is a parametric model that assumes a normal distribution, constant variance, and a linear relationship between the response and predictor variables (Buya et al., 2023).
The decision tree algorithm is represented as a tree structure, which can be binary or non-binary. Each non-leaf node corresponds to an attribute test, and every branch represents an attribute’s possible outcomes within specified boundaries. Leaf nodes contain categorical values. The process of the decision tree involves classifying characteristic attributes starting from the root node and evaluating their values based on the selected output branches until a leaf node is reached, which determines the final category (Srivastava et al., 1999). To bring order to unstructured data and regularize the dataset, three common methods are employed in support of decision trees: information gain, gain ratio, and Gini impurity (Zuo et al., 2020).
The Extra-trees model is also a tree-based ensemble learning method based on the bagging technique and construct from multiple decision trees, where each tree is generated by bootstrap sampling from the training dataset (Breiman, 2001; Hu et al., 2017; Chen et al., 2018), but introduces additional randomness in selecting features and splitting the points from all data samples in the tree-building process (Geurts et al., 2006; Wei et al., 2020; Wei et al., 2021).
XGBoost is a gradient-boosting technique that improves performance and speed using a tree-based ensemble machine learning algorithm (Chen and Guestrin, 2016). Gradient boosting minimizes the loss function by sequentially adding weak learners via gradient descent optimization. This approach relies on three fundamental components: a loss function to measure predictive accuracy, a weak learner that may not classify perfectly but is better than random guessing, and an additive model that progressively integrates decision trees (Chen T. et al., 2019).
In this study, machine learning models were utilized to merge AOD data obtained from two satellites, Himawari-8 and MAIAC, aiming to achieve AOD products with enhanced spatial and temporal resolutions. The MAIAC data provides high spatial resolution, but was available only once per day. Conversely, the Himawari-8 data provides hourly AOD products, but low spatial resolution of 5 × 5 km2. To reconcile these differences, the hourly Himawari-8 AOD data from 9:00 to 16:00 was downscaled from 5 × 5 km2 to 1 × 1 km2 using Python programming, aligned with the center point of the MAIAC product.
Hourly high spatial resolution AODs from two satellites generated from the downscaling method (section 2.5) with meteorological data from WRF model were used to develop models to estimate hourly PM2.5 concentration during the study period (2018–2021). The developed models were separated by month. Machine learning models explored to predict PM2.5 concentration in this study were linear regression, decision tree regressor, extra tree regressor, random forest regressor and extreme gradient boosting regressor models. Available data were divided into a 70% training set and a 30% validation set for model development and evaluation, respectively.
This study utilized machine learning models to estimate PM2.5 concentrations in the study area during 2018–2021, incorporating inputs from hourly AOD and WRF results. The performance of the PM2.5 estimation models was assessed by comparing the model outputs with the ground-based PM2.5 concentrations from PCD’s monitoring stations using statistical parameters, including r-square, mean absolute error, and root mean square error. The evaluation criteria for each statistical parameter can be found in Table 2.
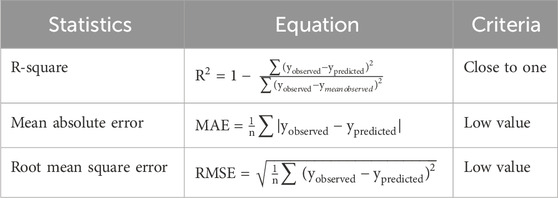
TABLE 2. Statistical methods and criteria for checking model performance.
The validated models were used with Python programming libraries to estimate hourly PM2.5 concentration in a 1 × 1 km2 grid over Thailand.
Data completeness analysis was conducted for AOD data from Himawari-8 and MAIAC, meteorological data from WRF model, and PM2.5 concentration data from PCD. The results are summarized in Table 3.
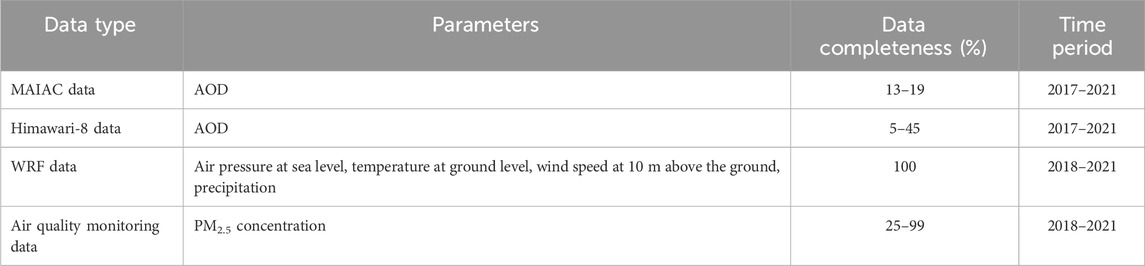
TABLE 3. Completeness of AOD, meteorological and PM2.5 concentration data.
From Table 3, AOD data from MAIAC and Himawari were available between 5% and 45% of the total data during 2017–2021 due to cloud cover. PM2.5 concentration data obtained from air quality monitoring stations is available between 25% and 99% from 69 stations during 2018–2021 due to availability of PM2.5 monitoring equipment, data screening, potential equipment issues, etc. In contrast, meteorological data from WRF model data show 100% completeness (air pressure, temperature, wind speed, and accumulated rainfall) from 2018 to 2021. Therefore, this study used the data available based on the hours that data were complete to train the PM2.5 concentration estimation models.
The hourly pattern of PM2.5 concentrations remained remarkably consistent on an annual basis. From December to April of every year, the hourly PM2.5 concentrations consistently rise to very high levels. These cycles of elevated PM2.5 concentrations occur consistently on an annual basis, with the specific duration of high concentrations varying slightly from one region to another. Figure 2 shows hourly PM2.5 concentration monitored by 69 air quality monitoring stations around Thailand (average by region—BMR, central, north, northeast, east and south).
The WRF data, sourced from the TMD, underwent rigorous validation against hourly average meteorological data from each air quality monitoring station operated by the PCD throughout Thailand from 2018 to 2021. The received WRF data has a spatial resolution of 6 × 6 km2 and a temporal resolution of 1 h. The validation process for TMD-WRF revealed the following results: a correlation coefficient (R) of 0.7 for temperature, 0.5 for wind speed, and 0.1 for pressure and precipitation. While the correlation coefficients for pressure and precipitation were relatively low, our primary focus in this study lies on developing the methodology based on the available data in Thailand. Thus, with improvements in the WRF prediction data provided by the TMD, the estimation of PM2.5 concentration is expected to enhance significantly.
This study employed various machine learning models, including linear regression, decision tree, extra tree regression, and extreme gradient boosting models, to downscaling 5 × 5 km2 AOD measurements from Himawari-8 to 1 × 1 km2 using AOD pattern from MAIAC. The training dataset consisted of approximately 8.5–250 million data points (differences based on data availability in each month), while the testing dataset contained around 3 to 102 million data points. The R2 values for both training and testing ranged from 0.04 to 0.58 (Figure 3). Notably, the R2 value was found to be lowest during the rainy seasons (June to August) due to the time gap between Himawari-8 and MAIAC data, which the satellite path time changes during this period. Additionally, number of available data for training and testing during rainy season was lower compared to other seasons. However, the results demonstrated that the three models, excluding linear regression, exhibited similar performance in downscaling the AOD data to 1 × 1 km2. In this study, the extreme gradient boosting regressor model (XGBRegressor) was chosen to downscale AOD due to its less resource requirement (processing time). Moreover, the XGBRegressor is the ensemble learning technique that was developed based on many models including the decision tree model to help reducing overfitting that can lead to more stable and accurate predictions. Moreover, XGB has outperformed various statistical models in previous studies (Gupta and Christopher, 2009; Xiao et al., 2018).
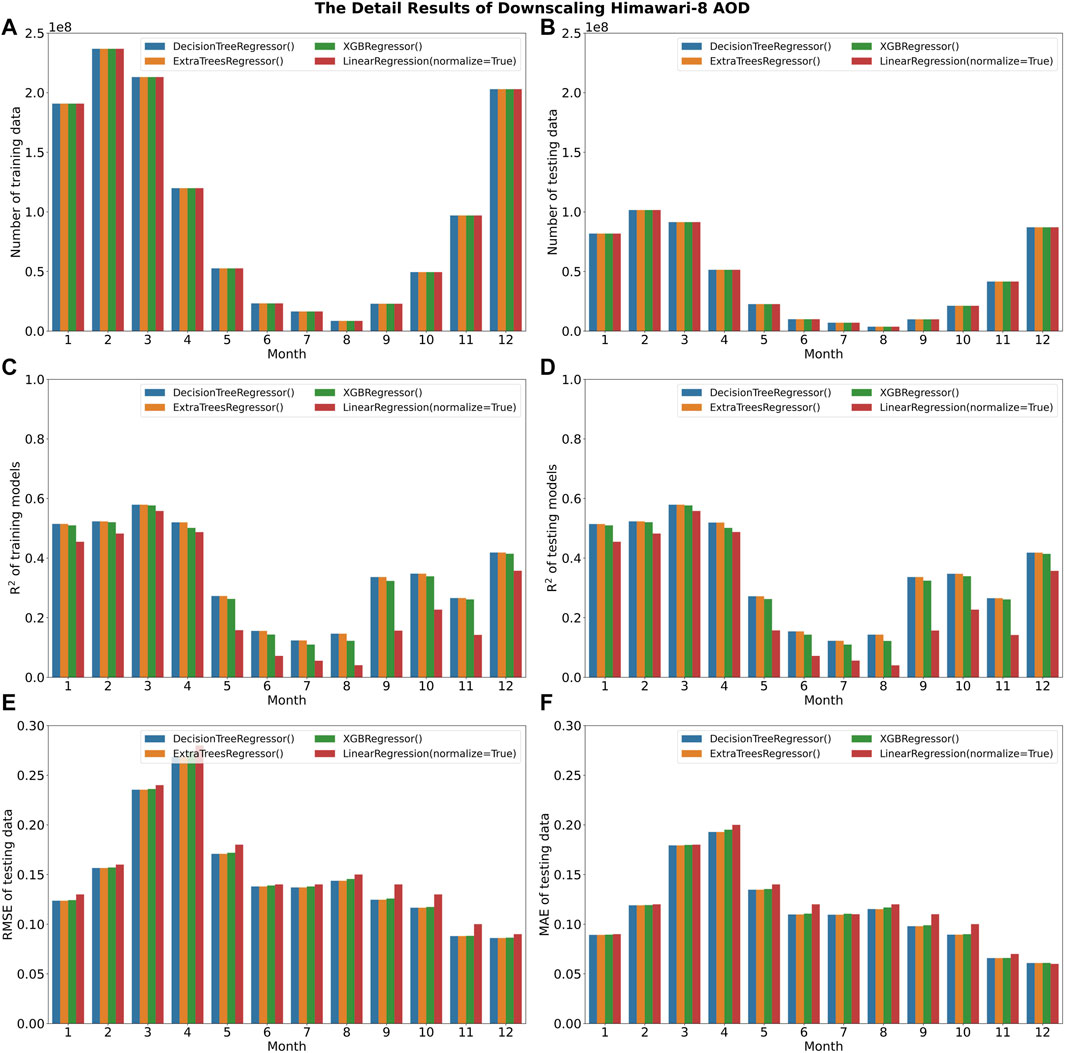
FIGURE 3. Model Performances of the Downscaling AODs: (A) Number of training data (B) Number of testing data (C) R2 of training models (D) R2 of testing models (E) RMSE of testing data (F) MAE of testing data.
After obtaining the downscaling models, the Python programming was used to downscale AOD, as presented in Figure 4.
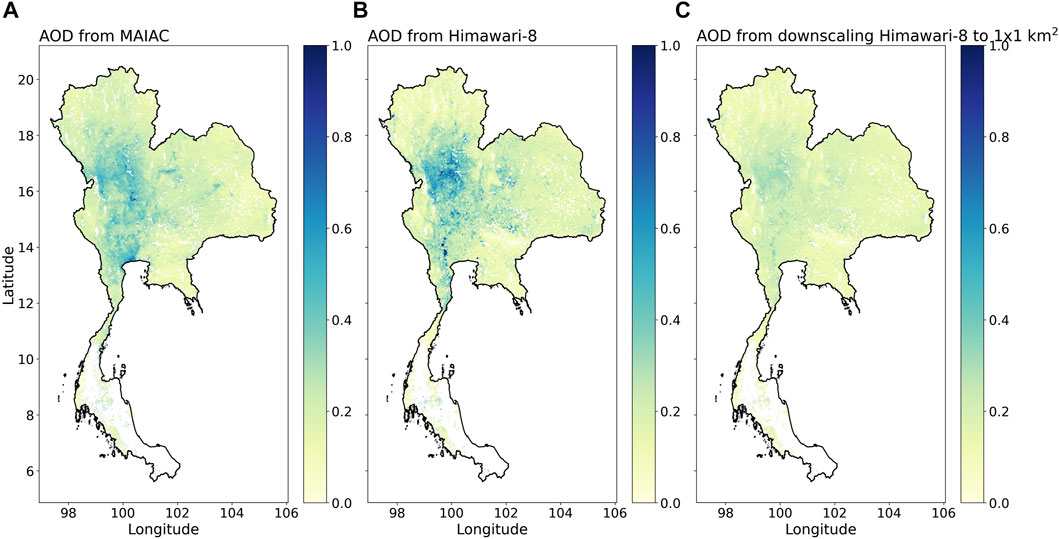
FIGURE 4. Comparison of AODs from (A) Himawari-8, (B) AODs from MAIAC, and (C) Downscaled AODs on 11 December 2019 at 10:00 a.m.
In Figure 4, a noteworthy observation is that the AOD values from MAIAC and Himawari-8 exceed those obtained through the downscaled AOD within the middle part of Thailand. This divergence can be attributed to the comprehensive spatiotemporal scope of the model developed for this study, which encompasses data from 2017 to 2021, providing a holistic perspective on AOD dynamics throughout Thailand. A key contributor to the relatively lower AOD values in this specific region is the pronounced presence of very high AOD, primarily due to the influence of anthropogenic aerosols (Luo et al., 2019) where this area is correspond to regions with extensive agricultural land use. This influence is particularly significant during December, coinciding with Thailand’s harvest season, marked by various agricultural activities that release elevated aerosols into the atmosphere. Incorporating this information enriches our understanding of the complex interplay of factors affecting AOD, encompassing both natural and human-induced elements.
In this study, Pearson’s coefficient was used to assess the correlation among meteorological parameters, downscaled AOD and PM2.5 concentration from air quality monitoring data. Additionally, RFE was employed for the XGBRegressor and other models to identify key important variables for predicting PM2.5 concentration.
The analysis using Pearson’s coefficient (Figure 5) revealed that the highest correlation with PM2.5 concentration was found with the downscaled AOD, followed by wind speed, pressure, precipitation, and temperature. However, the RFE analysis indicated that the important variables were the downscaled AOD, wind speed, temperature, pressure, and precipitation, in this order. Interestingly, when the precipitation data was excluded in predicting PM2.5 concentrations, there was no significant difference in the model performance. Thus, this study decided to use four variables, namely, downscaled AOD (Himawari_xgb), wind speed, temperature, and pressure, for predicting PM2.5 concentration.
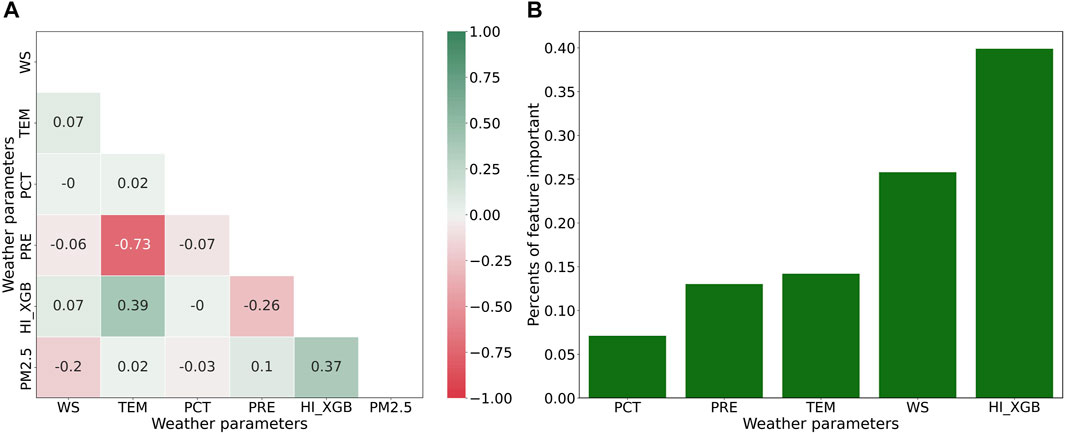
FIGURE 5. (A) Pearson’s Correlation and (B) Feature Importance of Auxiliary Variables in Predicting PM2.5 Concentration (WS-Wind speed, TEM-Temperature, PCT-Precipitation, PRE-Pressure, and HI_XGB-Himawari_XGB).
The performance evaluation of monthly PM2.5 concentration estimation models using XGBRegressor revealed that the R2 of the testing set ranges from 0.20 to 0.91. Moreover, the RMSE indicated that the prediction models had an error range of 7.07–36.93 μg/m³. Figure 6 presents monthly performances of PM2.5 estimation model using XGBRegressor.
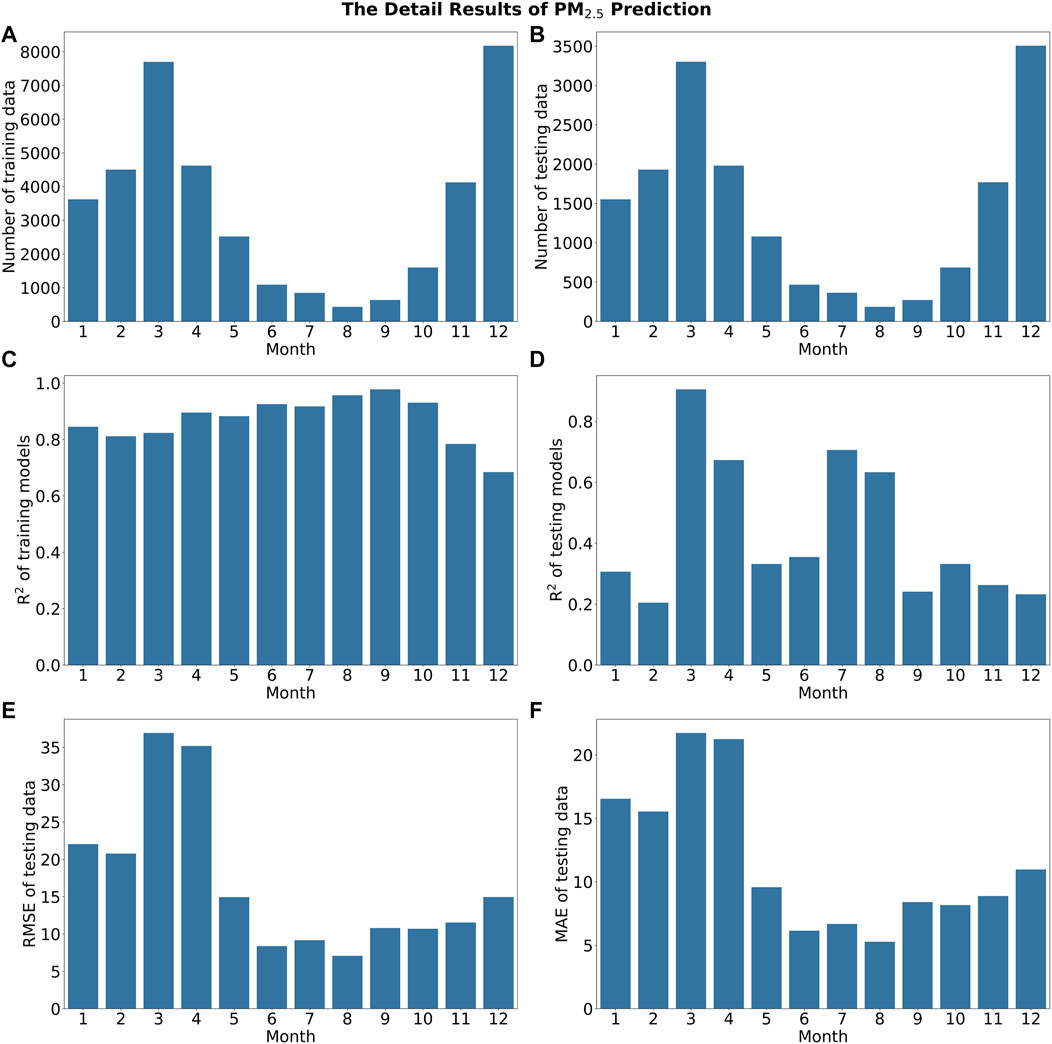
FIGURE 6. Monthly Performances of PM2.5 Estimation Models using Extreme Gradient Boosting Regressor: (A) Number of training data (B) Number of testing data (C) R2 of training models (D) R2 of testing models (E) RMSE of testing data (F) MAE of testing data.
PM2.5 concentration estimated from models in this study were compared with those from monitoring stations in Thailand on the corresponding grids where the monitoring stations were located. In total, this study compared 7,583 hourly data points from 2018 to 2021. The regression coefficient, based on the Pearson’s coefficient method, was found to be approximately 0.80. However, the results indicated that the estimated PM2.5 concentration were generally higher than the monitored PM2.5 concentration (Figure 7).
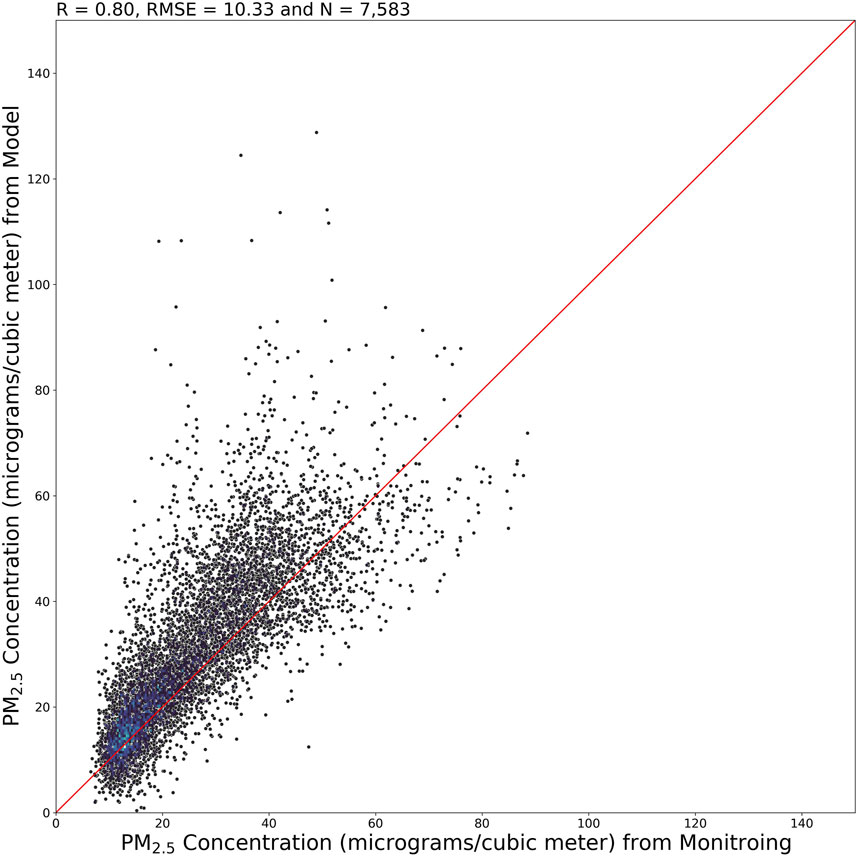
FIGURE 7. Scatter Plot of Hourly Average PM2.5 Concentrations: Model Estimation vs. Monitoring (2018–2021).
Figure 8 displays the timeseries comparison between PM2.5 concentration from monitoring stations and model estimation. It is evident that the estimated values consistently exceeded the monitored values during March to April. This disparity can be attributed to the influence of elevated ambient temperatures, which can affect the AOD data due to increased photochemical reactions. Additionally, during this period, there was a significant incidence of open burning of agricultural residues in the study area (Figure 9), further contributing to this observed difference. These effects contribute to higher AOD than other periods (Shen et al., 2018; Xian et al., 2022). Moreover, it is important to acknowledge that open burning has a direct impact on PM2.5 concentrations since it also emits gaseous pollutants, such as SO2, NO2, CO, all of which are correlated with both PM2.5 concentration and AOD (Amnuaylojaroen, 2022).
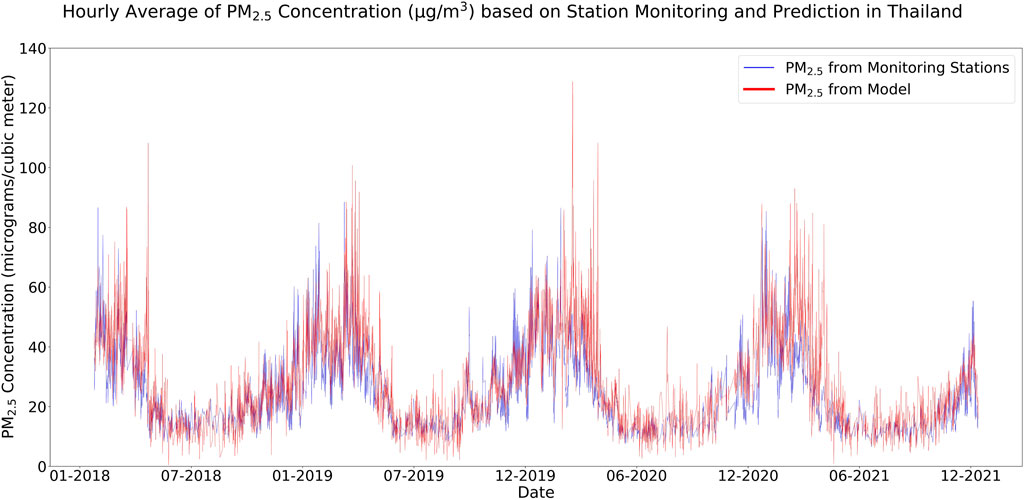
FIGURE 8. Time-series Comparison of Hourly Average PM2.5 Concentrations: Model vs. Monitoring (2018–2021).
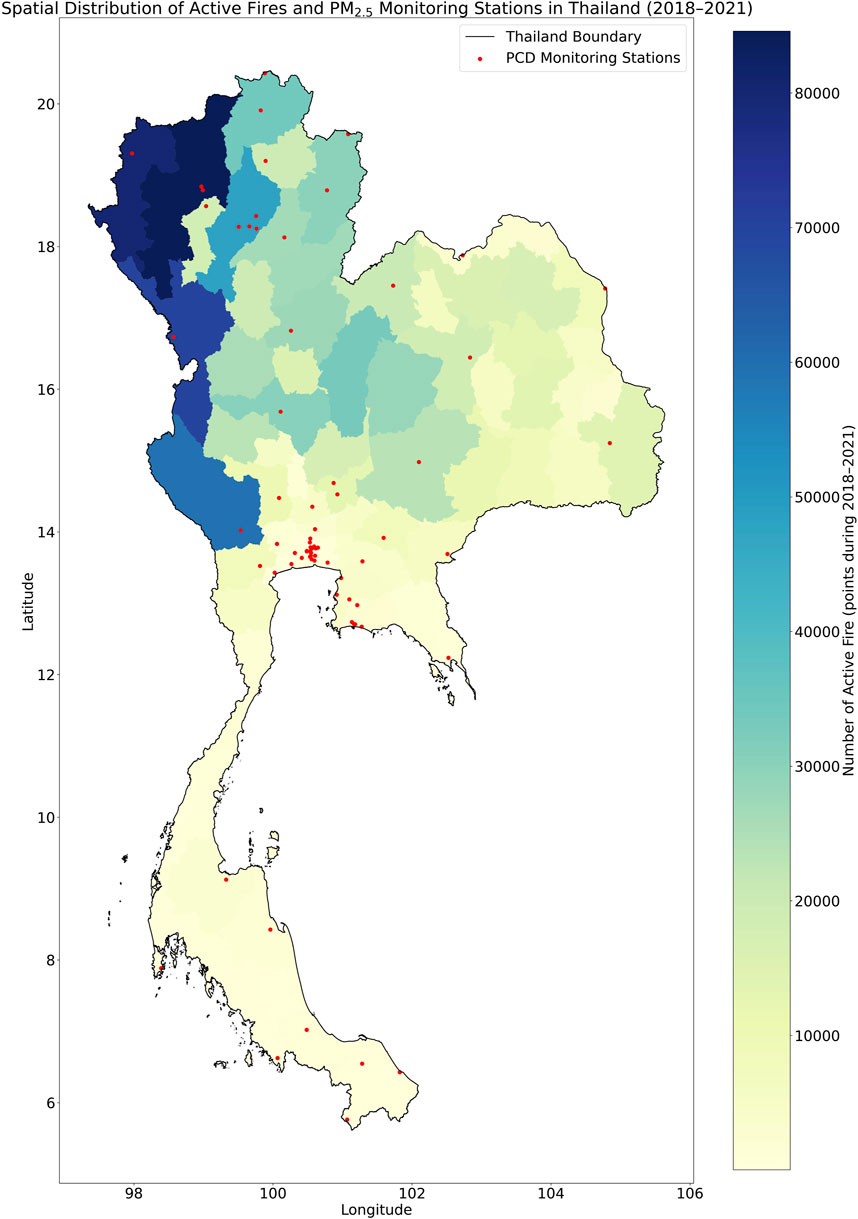
FIGURE 9. Spatial distribution of active fires and PM2.5 monitoring stations in Thailand (2018–2021).
PM2.5 concentration maps of Thailand were generated using a 1 × 1 km2 grid based on MAIAC cells (625,057 grids covering Thailand). After model estimation was made for each grid, PM2.5 concentrations were computed by averaging the data on an hourly, daily, monthly, and yearly basis (Figure 10). The spatial distribution of PM2.5 concentrations revealed that a significant number of grids had missing data due to cloud interference, particularly data in the hourly-average format (Figure 10A). However, by aggregating the data on a daily, monthly, and yearly basis, more data are available, providing a more comprehensive view of the PM2.5 concentrations over Thailand.
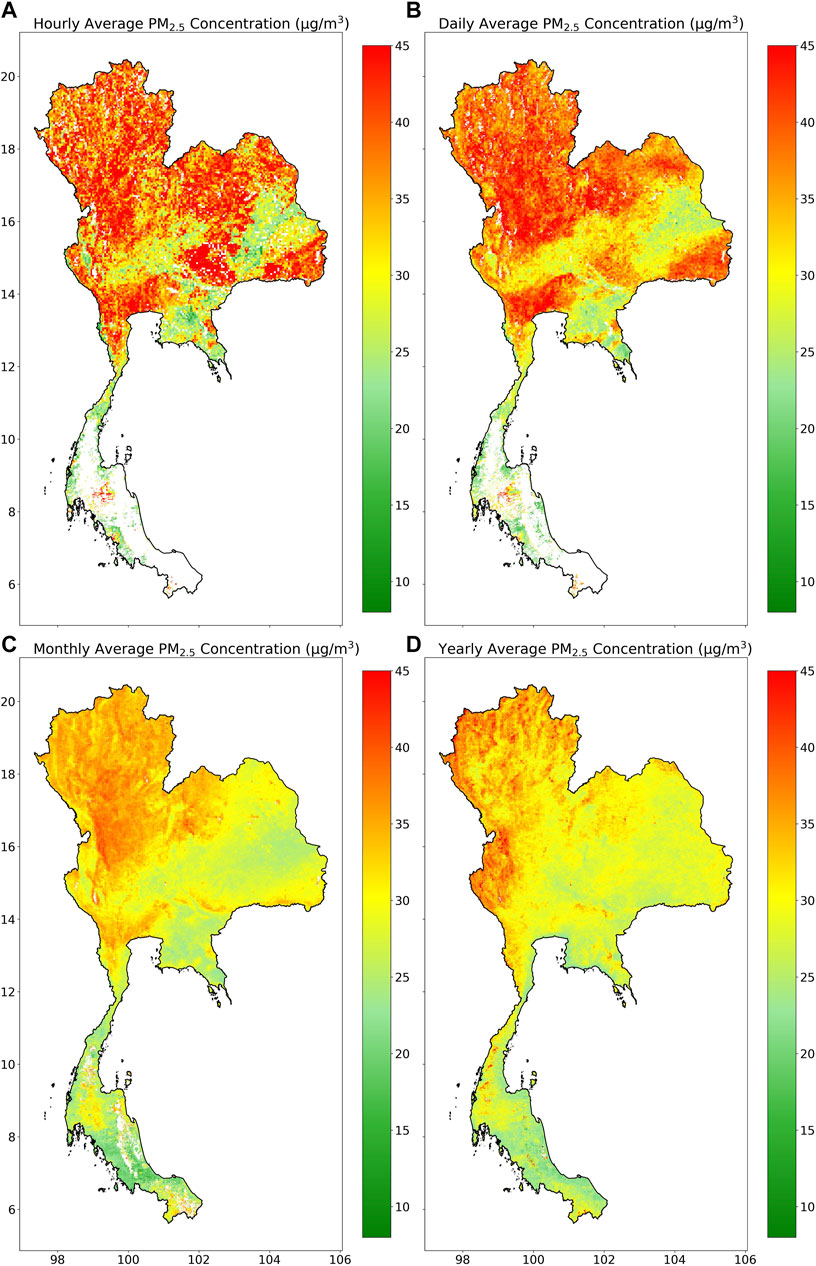
FIGURE 10. Spatial distribution (1 × 1 km2) of PM2.5 concentration (µg/m3) in Thailand from model estimation: (A) hourly average (11 December 2019 at 10:00am), (B) daily average (11 December 2019), (C) monthly average (December 2019) and (D) yearly average (year 2019).
Figure 10C monthly average (December 2019) PM2.5 concentration: Significant increase in PM2.5 concentration during the dry season, particularly in the northern region of Thailand, was observed. This temporal pattern aligns with the findings presented in Figure 11 during December 2019. During the dry season, multiple sources contribute to elevate PM2.5 levels, including open burning and forest fires. While open burning and forest fire are widely recognized as the primary sources to dry-season PM2.5 concentration, it is important to note that traffic and other emissions are consistent year-round sources of PM2.5. Despite biomass burning accounting for 25%–79% of PM2.5 during this period (Hu et al., 2017), traffic emissions also play a significant role in contributing to haze pollution (Fu et al., 2023).
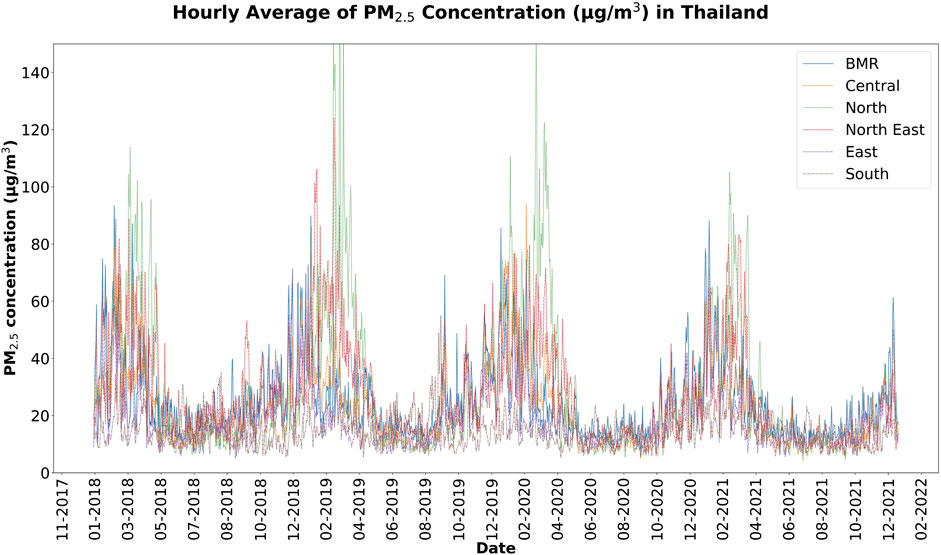
FIGURE 11. Hourly average PM2.5 concentration by region in Thailand (2018–2021).
Figure 10D yearly average of PM2.5 concentration: The northern and western regions of Thailand exhibited higher PM2.5 levels compared to other areas. This observation is consistent with the spatial distribution of active fires in Figure 9, indicating a correlation between high PM2.5 levels and the occurrence of active fire hotspots in the northern and western regions.
In this study, relationship between AOD of Himawari-8 and MAIAC, WRF model parameters (wind speed, precipitation, pressure, and temperature) and PM2.5 concentrations in Thailand during 2018–2021 has been investigated. The hourly 5 × 5 km2 AOD from Himawari-8 was downscaled to 1 × 1 km2 using the AOD distribution pattern of the MAIAC product on the same day. More than 250 million data points for training and testing were employed during the downscaling process to enhance the model’s accuracy by XGBoost model. However, our findings revealed that the R-square value of the training model was relatively low during rainy season in Thailand (May to August). This can be attributed to the time gap between Himawari-8 and MAIAC-product passing over the study area. Additionally, the presence of cloud interference during the rainy season contributed to the availability of the data during this period. Nonetheless, it is important to note that our study utilized training and testing data encompassing all regions of Thailand. One potential factor contributing to the observed lower accuracy may be the presence of anthropogenic aerosols concentrated in urban and agricultural areas, exerting a substantial influence on the scattering and absorption of solar radiation (Luo et al., 2019). Nevertheless, our study has developed a downscaling AOD methodology that optimizes the impact of anthropogenic factors and significantly improves spatial and temporal resolution. Furthermore, AOD accuracies are influenced by various factors, including topography, seasonally changing surface characterization (e.g., vegetation cover, surface reflectance), aerosol type, size distribution, and vertical distribution of aerosols in the atmospheric column, along with sensor and solar viewing geometry (Gupta et al., 2021). Despite the multifaceted nature of these influences, this study specifically examined AOD as the most critical factor in predicting PM2.5 concentrations. Consequently, AOD emerges as a primary source of error in PM2.5 concentration predictions, particularly as we aimed to estimate concentrations across all regions in Thailand. Many previous studies have revealed that regression model with the MODIS AOD measurement can be used as a predictor variable to estimate the spatial ground-level PM2.5 concentrations, taking into account many potential confounders (Hu et al., 2014; Zheng et al., 2016; Wang et al., 2019; Guo et al., 2021). This method would benefit for exposure assessment for epidemiological research, especially in the areas with no monitoring station network that is commonly used to explore the association of PM2.5 with morbidity and mortality (Peng-in et al., 2022). The prediction of PM2.5 concentrations commenced by identifying relevant variables through the Pearson’s correlation and recursive feature elimination based on the XGBoost model. Following the testing phase, the downscaled AOD, wind speed, temperature, and pressure were selected as the predicting variables for hourly PM2.5 concentration estimation. Utilizing the downscaled AOD with meteorological data, this study predicted PM2.5 concentrations over Thailand, encompassing over 600,000 grids at a 1 × 1 km2 resolution.
The PM2.5 estimation models (developed for each month in Thailand) yielded a diverse range of R2 results for the training dataset, but, in overall, exhibited consistently high accuracy. The R2 values for the testing dataset varied from 0.20 to 0.91, with corresponding root mean square errors ranging from 7.07 to 36.93 μg/m³. Then, the PM2.5 concentration from the model estimation were compared with those from ambient air monitoring stations at the corresponding grid and time. The model’s performance shows R2 value of 0.64 and an RMSE of 10.33 μg/m³. The accuracy result of estimating PM2.5 concentration was similar to the previous studies in Thailand and other countries (Ma et al., 2014; Zheng et al., 2016; Guo et al., 2021; Xu et al., 2021; Buya et al., 2023). However, the estimated PM2.5 concentration from March to April was higher than the monitoring data due to the significant of open burning of agricultural residues in the study area. These effects contribute to higher AOD than other periods and are related to PM2.5, AOD and other pollutants (Amnuaylojaroen, 2022). Thus, the developed models can be used to estimate PM2.5 concentration on an hourly basis with a resolution of 1 × 1 km2 covering Thailand.
The accuracy of our PM2.5 estimations was subject to the influence of several pivotal factors. The AOD-PM2.5 relationship proved sensitive to variables, such as aerosol concentrations, relative humidity, cloud cover, boundary layer height (Gupta and Christopher, 2009; Chitranshi et al., 2015). However, our analysis encountered limitations, notably the restricted scope of meteorological data from the available WRF model output from TMD. Additionally, our reliance on an AOD inversion algorithm introduced limitations that affected our ability to estimate PM2.5 concentrations across all regions. Notably, the current AOD inversion algorithm struggles with cloud recognition, often mistaking haze for clouds, potentially resulting in the absence of aerosol products under heavy pollution conditions (Bilal et al., 2017). As a potential solution to these limitations, we suggest exploring multisource data inversion algorithms to enhance spatial coverage (Shi et al., 2018). The complexity of PM2.5 prediction is further compounded by the influence of various variables, including weather conditions and environmental seasonality (Amnuaylojaroen, 2022). In particular, Buya et al. (2023) enhanced the accuracy of PM2.5 estimation by incorporating additional factors, such as Normalized Difference Vegetation Index (NDVI), Elevation, Week of the Year, and year in Thailand. The resulting model, based on the XGBoost algorithm, achieved an R-squared value of 0.45 and an RMSE of 12.12 μg/m³. Furthermore, Luo et al. (2019) conducted a study that explored the influence of surface solar radiation on AOD. This relationship arises from solar radiation affecting the scattering and absorption of aerosols, which, in turn, impacts AOD. Higher solar radiation levels can intensify photochemical reactions that result in the formation of secondary aerosols, subsequently elevating AOD (Luo et al., 2019).
Despite the valuable insights gained from our study, it is crucial to acknowledge that we primarily relied on AOD data for PM2.5 estimation, introducing variability across different regions and potentially affecting the overall accuracy of our findings, given the utilization of two AOD products from Himawari-8 and MAIAC. In future research, it is crucial to consider incorporating additional factors into AOD downscaling, such as land use data, solar radiation, week of the year.
The original contributions presented in the study are included in the article/Supplementary material, further inquiries can be directed to the corresponding author.
PP: Conceptualization, Methodology, Visualization, Formal Analysis, Writing–original draft. EW: Conceptualization, Methodology, Visualization, Project administration, Writing–review and editing. PK: Conceptualization, Writing–review and editing. SV: Writing–review and editing. WX: Writing–review and editing. TN: Writing–review and editing.
The author(s) declare financial support was received for the research, authorship, and/or publication of this article. This research was funded by The National Research Council of Thailand, grant number (วช.อว.(ก)(กบท2)186/25).
The authors would like to acknowledge Thailand Pollution Control Department for providing the PM2.5 air quality monitoring data, and Thai Meteorological Department for providing the WRF model outputs (meteorological data).
The authors declare that the research was conducted in the absence of any commercial or financial relationships that could be construed as a potential conflict of interest.
All claims expressed in this article are solely those of the authors and do not necessarily represent those of their affiliated organizations, or those of the publisher, the editors and the reviewers. Any product that may be evaluated in this article, or claim that may be made by its manufacturer, is not guaranteed or endorsed by the publisher.
Amnauylawjarurn, T., Kreasuwun, J., Towta, S., and Siriwitayakorn, K. (2010). Dispersion of particulate matter (PM10) from forest fires in Chiang Mai province, Thailand. Chiang Mai J. Sci. 37 (1), 39–47.
Amnuaylojaroen, T. (2022). Prediction of PM2.5in an urban Area of northern Thailand using multivariate linear regression model. Adv. Meteorology 2022, 1–9. doi:10.1155/2022/3190484
Amnuaylojaroen, T., Inkom, J., Janta, R., and Surapipith, V. (2020). Long range transport of southeast asian PM2.5pollution to northern Thailand during high biomass burning episodes. Sustainability 12 (23), 10049. doi:10.3390/su122310049
Amnuaylojaroen, T., Macatangay, R. C., and Khodmanee, S. (2019). Modeling the effect of VOCs from biomass burning emissions on ozone pollution in upper Southeast Asia. Heliyon 5 (10), e02661. doi:10.1016/j.heliyon.2019.e02661
Bai, Y., Wu, L., Qin, K., Zhang, Y., Shen, Y., and Zhou, Y. (2016). A geographically and temporally weighted regression model for ground-level PM2.5estimation from satellite-derived 500 m resolution AOD. Remote Sens. 8 (3), 262. doi:10.3390/rs8030262
Bilal, M., Nichol, J. E., and Wang, L. (2017). New customized methods for improvement of the MODIS C6 Dark Target and Deep Blue merged aerosol product. Remote Sens. Environ. 197, 115–124. doi:10.1016/j.rse.2017.05.028
Buya, S., Usanavasin, S., Gokon, H., and Karnjana, J. (2023). An Estimation of daily PM2.5Concentration in Thailand using satellite Data at 1-kilometer resolution. Sustainability 15 (13), 10024. doi:10.3390/su151310024
Chen, G., Li, S., Knibbs, L. D., Hamm, N., Cao, W., Li, T., et al. (2018). A machine learning method to estimate PM2.5concentrations across China with remote sensing, meteorological and land use information. Sci. Total Environ. 636, 52–60. doi:10.1016/j.scitotenv.2018.04.251
Chen, J., Yin, J., Zang, L., Zhang, T., and Zhao, M. (2019a). Stacking machine learning model for estimating hourly PM2.5in China based on Himawari 8 aerosol optical depth data. Sci. Total Environ. 697, 134021. doi:10.1016/j.scitotenv.2019.134021
Chen, T., He, T., Benesty, M., Khotilovich, V., et al. (2019b). Package ‘xgboost’, 90. New York: R version, 1–66. Proceedings of the 22nd ACM SIGKDD International Conference on Knowledge Discovery and Data Mining.
Chen, T., and Guestrin, C. (2016). “Xgboost: a scalable tree boosting system,” in Proceedings of the 22nd acm sigkdd international conference on knowledge discovery and data mining.
Chitranshi, S., Sharma, S. P., and Dey, S. (2015). Satellite-based estimates of outdoor particulate pollution (PM10) for Agra City in northern India. Air Qual. Atmos. Health 8 (1), 55–65. doi:10.1007/s11869-014-0271-x
Fu, D., Gueymard, C. A., Yang, D., Zheng, Y., Xia, X., and Bian, J. (2023). Improving aerosol optical depth retrievals from Himawari-8 with ensemble learning enhancement: validation over Asia. Atmos. Res. 284, 106624. doi:10.1016/j.atmosres.2023.106624
Gao, L., Chen, L., Li, J., and Zhu, L. (2021). An improved dark target method for aerosol optical depth retrieval over China from Himawari-8. Atmos. Res. 250, 105399. doi:10.1016/j.atmosres.2020.105399
Geurts, P., Ernst, D., and Wehenkel, L. (2006). Extremely randomized trees. Mach. Learn. 63, 3–42. doi:10.1007/s10994-006-6226-1
Granitto, P. M., Furlanello, C., Biasioli, F., and Gasperi, F. (2006). Recursive feature elimination with random forest for PTR-MS analysis of agroindustrial products. Chemom. intelligent laboratory Syst. 83 (2), 83–90. doi:10.1016/j.chemolab.2006.01.007
Guo, W., Zhang, B., Wei, Q., Guo, Y., Yin, X., Li, F., et al. (2021). Estimating ground-level PM2.5concentrations using two-stage model in Beijing-Tianjin-Hebei, China. Atmos. Pollut. Res. 12 (9), 101154. doi:10.1016/j.apr.2021.101154
Gupta, P., and Christopher, S. A. (2009). Particulate matter air quality assessment using integrated surface, satellite, and meteorological products: multiple regression approach. J. Geophys. Res. Atmos. 114 (D14). doi:10.1029/2008jd011496
Gupta, P., Zhan, S., Mishra, V., Aekakkararungroj, A., Markert, A., Paibong, S., et al. (2021). Machine learning Algorithm for estimating surface PM2.5in Thailand. Aerosol Air Qual. Res. 21 (11), 210105. doi:10.4209/aaqr.210105
Hoff, R. M., and Christopher, S. A. (2009). Remote sensing of particulate pollution from space: have we reached the promised land? J. Air and Waste Manag. Assoc. 59 (6), 645–675. doi:10.3155/1047-3289.59.6.645
Hongthong, A., Nanthapong, K., and Kanabkaew, T. (2022). Estimates of disease burden attributed to particulate matter in northern part of Thailand. Thammasat University, Thailand.
Hongthong, A., Nanthapong, K., and Kanabkaew, T. (2023). Estimation of respiratory disease burden attributed to particulate matter from biomass burning in northern Thailand using 1-km resolution MAIAC-AOD. Appl. Environ. Res. 45 (2). doi:10.35762/aer.2023008
Hu, X., Belle, J. H., Meng, X., Wildani, A., Waller, L. A., Strickland, M. J., et al. (2017). Estimating PM2.5concentrations in the conterminous United States using the random forest approach. Environ. Sci. Technol. 51 (12), 6936–6944. doi:10.1021/acs.est.7b01210
Hu, X., Waller, L. A., Lyapustin, A., Wang, Y., Al-Hamdan, M. Z., Crosson, W. L., et al. (2014). Estimating ground-level PM2.5concentrations in the Southeastern United States using MAIAC AOD retrievals and a two-stage model. Remote Sens. Environ. 140, 220–232. doi:10.1016/j.rse.2013.08.032
Jinsart, W., Tamura, K., Loetkamonwit, S., Thepanondh, S., Karita, K., and Yano, E. (2002). Roadside particulate air pollution in Bangkok. J. Air and Waste Manag. Assoc. 52 (9), 1102–1110. doi:10.1080/10473289.2002.10470845
Joharestani, M. Z., Ni, X., Bashir, B., and Talebiesfandarani, S. (2019). “PM2.5 prediction based on random forest, XGBoost, and deep learning using multisource remote sensing data”. Atmosphere 10, 373. doi:10.3390/atmos10070373
Kanabkaew, T. (2013). Prediction of hourly particulate matter concentrations in chiangmai, Thailand using MODIS aerosol optical depth and ground-based meteorological data. EnvironmentAsia 6 (2).
Ketu, S. (2022). Spatial air quality Index and air pollutant concentration prediction using linear regression based recursive feature elimination with random forest regression (RFERF): a case study in India. Nat. Hazards 114 (2), 2109–2138. doi:10.1007/s11069-022-05463-z
Kong, L., Xin, J., Zhang, W., and Wang, Y. (2016). The empirical correlations between PM2.5, PM10and AOD in the Beijing metropolitan region and the PM2.5, PM10distributions retrieved by MODIS. Environ. Pollut. 216, 350–360. doi:10.1016/j.envpol.2016.05.085
Lee, H.-H., Iraqui, O., Gu, Y., Yim, S. H. L., Chulakadabba, A., Tonks, A. Y. M., et al. (2018). Impacts of air pollutants from fire and non-fire emissions on the regional air quality in Southeast Asia. Atmos. Chem. Phys. 18 (9), 6141–6156. doi:10.5194/acp-18-6141-2018
Lee, H.-H., Iraqui, O., and Wang, C. (2019). The impact of future fuel consumption on regional air quality in Southeast Asia. Sci. Rep. 9 (1), 2648. doi:10.1038/s41598-019-39131-3
Lelieveld, J., Barlas, C., Giannadaki, D., and Pozzer, A. (2013). Model calculated global, regional and megacity premature mortality due to air pollution. Atmos. Chem. Phys. 13 (14), 7023–7037. doi:10.5194/acp-13-7023-2013
Luo, H., Han, Y., Lu, C., Yang, J., and Wu, Y. (2019). Characteristics of surface solar radiation under different air pollution conditions over Nanjing, China: observation and simulation. Adv. Atmos. Sci. 36, 1047–1059. doi:10.1007/s00376-019-9010-4
Lyapustin, A., Wang, Y., Laszlo, I., Kahn, R., Korkin, S., Remer, L., et al. (2011). Multiangle implementation of atmospheric correction (MAIAC): 2. Aerosol algorithm. J. Geophys. Res. Atmos. 116 (D3), D03211. doi:10.1029/2010jd014986
Ma, Z., Hu, X., Huang, L., Bi, J., and Liu, Y. (2014). Estimating ground-level PM2.5in China using satellite remote sensing. Environ. Sci. Technol. 48 (13), 7436–7444. doi:10.1021/es5009399
Marchese, F., Falconieri, A., Pergola, N., and Tramutoli, V. (2018). Monitoring the Agung (Indonesia) ash plume of November 2017 by means of infrared Himawari 8 data. Remote Sens. 10 (6), 919. doi:10.3390/rs10060919
Oanh, N. K., Upadhyay, N., Zhuang, Y. H., Hao, Z. P., Murthy, D., Lestari, P., et al. (2006). Particulate air pollution in six Asian cities: spatial and temporal distributions, and associated sources. Atmos. Environ. 40 (18), 3367–3380. doi:10.1016/j.atmosenv.2006.01.050
Oanh, N. T. K., and Leelasakultum, K. (2011). Analysis of meteorology and emission in haze episode prevalence over mountain-bounded region for early warning. Sci. Total Environ. 409 (11), 2261–2271. doi:10.1016/j.scitotenv.2011.02.022
Peng-in, B., Sanitluea, P., Monjatturat, P., Boonkerd, P., and Phosri, A. (2022). Estimating ground-level PM2.5over Bangkok Metropolitan Region in Thailand using aerosol optical depth retrieved by MODIS. Air Qual. Atmos. Health 15 (11), 2091–2102. doi:10.1007/s11869-022-01238-4
Qu, L., Xiao, H., Zheng, N., Zhang, Z., and Xu, Y. (2017). Comparison of four methods for spatial interpolation of estimated atmospheric nitrogen deposition in South China. Environ. Sci. Pollut. Res. 24, 2578–2588. doi:10.1007/s11356-016-7995-0
Shen, Y., Zhang, L., Fang, X., Zhao, Z., Li, X., Wang, J., et al. (2018). Long-term analysis of aerosol optical depth over the Huaihai Economic Region (HER): possible causes and implications. Atmosphere 9 (3), 93. doi:10.3390/atmos9030093
Shi, S., Cheng, T., Gu, X., Letu, H., Guo, H., Chen, H., et al. (2018). Synergistic retrieval of multitemporal aerosol optical depth over north China plain using geostationary satellite data of himawari-8. J. Geophys. Res. Atmos. 123 (10), 5525–5537. doi:10.1029/2017jd027963
Srivastava, A., Sam Han, E.-H., Singh, V., and Kumar, V. (1999). “Parallel formulations of decision-tree classification algorithms,” in High performance data mining (Boston: Springer).
Sun, J., Gong, J., and Zhou, J. (2021). Estimating hourly PM2.5concentrations in Beijing with satellite aerosol optical depth and a random forest approach. Sci. Total Environ. 762, 144502. doi:10.1016/j.scitotenv.2020.144502
Tsai, F. C., Smith, K. R., Vichit-Vadakan, N., Ostro, B. D., Chestnut, L. G., and Kungskulniti, N. (2000). Indoor/outdoor PM10and PM2.5in Bangkok, Thailand. J. Expo. Sci. Environ. Epidemiol. 10 (1), 15–26. doi:10.1038/sj.jea.7500071
Vichit-Vadakan, N., Ostro, B. D., Chestnut, L. G., Mills, D. M., Aekplakorn, W., Wangwongwatana, S., et al. (2001). Air pollution and respiratory symptoms: results from three panel studies in Bangkok, Thailand. Environ. Health Perspect. 109 (3), 381–387. doi:10.1289/ehp.01109s3381
Wang, Q., Zeng, Q., Tao, J., Sun, L., Zhang, L., Gu, T., et al. (2019). Estimating PM2.5concentrations Based on MODIS AOD and NAQPMS Data over beijing–tianjin–hebei. Sensors 19 (5), 1207. doi:10.3390/s19051207
Wei, J., Huang, W., Li, Z., Xue, W., Peng, Y., Sun, L., et al. (2019). Estimating 1-km-resolution PM2.5concentrations across China using the space-time random forest approach. Remote Sens. Environ. 231, 111221. doi:10.1016/j.rse.2019.111221
Wei, J., Li, Z., Cribb, M., Huang, W., Xue, W., Sun, L., et al. (2020). Improved 1 km resolution PM2.5estimates across China using enhanced space–time extremely randomized trees. Atmos. Chem. Phys. 20 (6), 3273–3289. doi:10.5194/acp-20-3273-2020
Wei, J., Li, Z., Lyapustin, A., Sun, L., Peng, Y., Xue, W., et al. (2021). Reconstructing 1-km-resolution high-quality PM2.5data records from 2000 to 2018 in China: spatiotemporal variations and policy implications. Remote Sens. Environ. 252, 112136. doi:10.1016/j.rse.2020.112136
Wongnakae, P., Chitchum, P., Sripramong, R., and Phosri, A. (2023). Application of satellite remote sensing data and random forest approach to estimate ground-level PM2.5concentration in Northern region of Thailand. Environ. Sci. Pollut. Res. 30 (38), 88905–88917. doi:10.1007/s11356-023-28698-0
Xian, P., Zhang, J., O'Neill, N. T., Reid, J. S., Toth, T. D., Sorenson, B., et al. (2022). Arctic spring and summertime aerosol optical depth baseline from long-term observations and model reanalyses–Part 2: statistics of extreme AOD events, and implications for the impact of regional biomass burning processes. Atmos. Chem. Phys. 22 (15), 9949–9967. doi:10.5194/acp-22-9949-2022
Xiao, Q., Chang, H., Geng, G., and Liu, Y. (2018). An ensemble machine-learning model to predict historical PM2.5concentrations in China from satellite data. Environ. Sci. Technol. 52 (22), 13260–13269. doi:10.1021/acs.est.8b02917
Xiao, Q., Wang, Y., Chang, H. H., Meng, X., Geng, G., Lyapustin, A., et al. (2017). Full-coverage high-resolution daily PM2.5estimation using MAIAC AOD in the Yangtze River Delta of China. Remote Sens. Environ. 199, 437–446. doi:10.1016/j.rse.2017.07.023
Xie, Y., Wang, Y., Bilal, M., and Dong, W. (2019). Mapping daily PM2.5 at 500 m resolution over Beijing with improved hazy day performance. Sci. Total Environ. 659, 410–418. doi:10.1016/j.scitotenv.2018.12.365
Xie, Y., Wang, Y., Zhang, K., Dong, W., Lv, B., and Bai, Y. (2015). Daily Estimation of ground-level PM2.5Concentrations over Beijing using 3 km resolution MODIS AOD. Environ. Sci. Technol. 49 (20), 12280–12288. doi:10.1021/acs.est.5b01413
Xu, Q., Chen, X., Yang, S., Tang, L., and Dong, J. (2021). Spatiotemporal relationship between Himawari-8 hourly columnar aerosol optical depth (AOD) and ground-level PM2.5mass concentration in mainland China. Sci. Total Environ. 765, 144241. doi:10.1016/j.scitotenv.2020.144241
Yan, K., and Zhang, D. (2015). Feature selection and analysis on correlated gas sensor data with recursive feature elimination. Sensors Actuators B Chem. 212, 353–363. doi:10.1016/j.snb.2015.02.025
Yang, Q., Yuan, Q., Yue, L., Li, T., Shen, H., and Zhang, L. (2020). Mapping PM2.5concentration at a sub-km level resolution: a dual-scale retrieval approach. ISPRS J. Photogrammetry Remote Sens. 165, 140–151. doi:10.1016/j.isprsjprs.2020.05.018
Yao, F., Wu, J., Li, W., and Peng, J. (2019). Estimating daily PM2.5concentrations in Beijing using 750-M VIIRS IP AOD retrievals and a nested spatiotemporal statistical model. Remote Sens. 11 (7), 841. doi:10.3390/rs11070841
Yin, S., Wang, X., Zhang, X., Guo, M., Miura, M., and Xiao, Y. (2019). Influence of biomass burning on local air pollution in mainland Southeast Asia from 2001 to 2016. Environ. Pollut. 254, 112949. doi:10.1016/j.envpol.2019.07.117
Zhang, G., Rui, X., and Fan, Y. (2018a). Critical review of methods to estimate PM2.5concentrations within specified research region. ISPRS Int. J. Geo-Information 7 (9), 368. doi:10.3390/ijgi7090368
Zhang, T., Zhu, Z., Gong, W., Zhu, Z., Sun, K., Wang, L., et al. (2018b). Estimation of ultrahigh resolution PM2.5concentrations in urban areas using 160 m Gaofen-1 AOD retrievals. Remote Sens. Environ. 216, 91–104. doi:10.1016/j.rse.2018.06.030
Zhang, Z., Zang, Z., Cheng, X., Lu, C., Huang, S., Hu, Y., et al. (2021). Development of three-dimensional variational data assimilation Method of Aerosol for the CMAQ model: an Application for PM2.5and PM10Forecasts in the sichuan basin. Earth Space Sci. 8 (5), e2020EA001614. doi:10.1029/2020ea001614
Zheng, Y., Zhang, Q., Liu, Y., Geng, G., and He, K. (2016). Estimating ground-level PM2.5concentrations over three megalopolises in China using satellite-derived aerosol optical depth measurements. Atmos. Environ. 124, 232–242. doi:10.1016/j.atmosenv.2015.06.046
Keywords: PM2.5 concentration, aerosol optical depth, machine learning, Himawari, MAIAC
Citation: Punpukdee P, Winijkul E, Kyaw PP, Virdis SGP, Xue W and Nguyen TPL (2024) Estimation of hourly one square kilometer fine particulate matter concentration over Thailand using aerosol optical depth. Front. Environ. Sci. 11:1303152. doi: 10.3389/fenvs.2023.1303152
Received: 27 September 2023; Accepted: 26 December 2023;
Published: 10 January 2024.
Edited by:
Sirapong Sooktawee, Ministry of Natural Resources and Environment, ThailandReviewed by:
Bushra Khalid, Chinese Academy of Sciences (CAS), ChinaCopyright © 2024 Punpukdee, Winijkul, Kyaw, Virdis, Xue and Nguyen. This is an open-access article distributed under the terms of the Creative Commons Attribution License (CC BY). The use, distribution or reproduction in other forums is permitted, provided the original author(s) and the copyright owner(s) are credited and that the original publication in this journal is cited, in accordance with accepted academic practice. No use, distribution or reproduction is permitted which does not comply with these terms.
*Correspondence: Ekbordin Winijkul, ZWtib3JkaW53QGFpdC5hc2lh
Disclaimer: All claims expressed in this article are solely those of the authors and do not necessarily represent those of their affiliated organizations, or those of the publisher, the editors and the reviewers. Any product that may be evaluated in this article or claim that may be made by its manufacturer is not guaranteed or endorsed by the publisher.
Research integrity at Frontiers
Learn more about the work of our research integrity team to safeguard the quality of each article we publish.