
94% of researchers rate our articles as excellent or good
Learn more about the work of our research integrity team to safeguard the quality of each article we publish.
Find out more
ORIGINAL RESEARCH article
Front. Environ. Sci. , 14 November 2023
Sec. Environmental Economics and Management
Volume 11 - 2023 | https://doi.org/10.3389/fenvs.2023.1290126
This article is part of the Research Topic Greenhouse Gas Emission (GHG) Reduction and Economic Structural Transformation View all 18 articles
 Jincai Zhao1,2*
 Yongmeng Du1
Clarifying the influencing mechanism of rural revitalization on agricultural carbon emissions is crucial for attaining carbon peaking and carbon neutrality. This study utilized spatial econometric model, mediating effect model and dual fixed effect model to explore the influence and spatial impact of rural revitalization on carbon emissions from agricultural land by using the panel data of prefectural cities in Henan Province. Results indicate that rural revitalization exerts a notable beneficial influence on carbon emissions, as its improvement results in a rise in such emissions. Furthermore, rural revitalization demonstrates a favorable spatial spillover effect on agricultural carbon emissions in neighboring cities. Agricultural GDP and mechanical technological progress act as intermediate factors, as rural revitalization promotes carbon emissions from agriculture by fostering economic development and technological advancements. Heterogeneity analysis indicates that the correlation between rural revitalization and greenhouse gas emissions from agriculture is nonlinear, as moderate and low levels of rural revitalization promote agricultural carbon emissions, while higher levels exhibit a negative effect. Thus, rural revitalization exhibits an inflection point effect on agricultural carbon emissions.
Excessive emissions of carbon dioxide, covering carbon dioxide (CO2), methane (CH4), and nitrous oxide (N2O) emissions, have had detrimental effects such as global temperature increase, climate crisis, and elevated sea levels. As a result, governments worldwide have placed significant emphasis on addressing this issue (Douglas, 1991). In September 2020, at the UNGA (United Nations General Assembly), China declared its commitment to peaking CO2 discharges before 2030 and pursuing carbon neutrality by 2060. However, achieving these goals requires in-depth research on carbon footprint across different industries. Agriculture, in particular, represents a significant origin of carbon emissions, making up around 14% of global greenhouse gas emissions (Nduagu and Gates, 2015). Global agricultural greenhouse gas emissions have nearly doubled from 2,752 Mt CO2 equivalent in 1961 to 5,294 Mt CO2 equivalent in 2016 (Mondal et al., 2018). Over the period from 1980 to 2020, China’s The overall greenhouse gas emissions from agriculture have risen from 665 million metric tons of CO2 equivalent to 970 million tons, exhibiting a fluctuating growth trend and an overall increase of nearly 46% (Guttikunda et al., 2014). While China’s agricultural sector contributes approximately 17% to the world’s whole agricultural carbon emissions (Liu and Xiao, 2020), it is crucial to note that the proportion of farming emissions in China is relatively lower compared to industrial emissions. Nonetheless, the total emissions remain substantial. Furthermore, given that China’s level of agricultural development is still lower in comparison to developed countries, there is significant potential for reducing carbon emissions agricultural field. Therefore, it is crucial to recognize the key factors contributing to carbon footprint in agriculture and propose effective measures to reduce releases in agricultural production. These efforts will contribute to the fulfillment of the “dual carbon” objective and the high-quality development of China’s modernization.
Early research related to agricultural carbon emissions primarily concentrated on measuring emissions and analyzing their temporal and spatial characteristics (Tristram and West, 2002; Tian et al., 2014; Xiong et al., 2016a; Xiong et al., 2016b; Huang et al., 2019; Chen et al., 2020; Liu et al., 2023). As research progressed, scholars started to explore the factors influencing agricultural carbon emissions from various perspectives. External factors include carbon taxes, economics, renewable energy sources, agricultural technology, urbanization, and policy (Liu et al., 2017; Ismael et al., 2018; Ridzuan et al., 2020; Dumortier and Elobeid, 2021; Liu et al., 2021; Alam et al., 2023; Li et al., 2023; Wojewodzki et al., 2023; Xia et al., 2023). Internal factors mainly revolve around land use (Liu et al., 2023). For instance, Pugh (Pugh et al., 2015) used the LPJ-GUESS model to find that people often underestimate the greenhouse gas emissions during land cover change and the potential carbon absorption from future reforestation. Guo (Guo et al., 2021) concluded that increasing the planting area of certain crops, such as wheat, soybeans, vegetables and sorghum, can reduce carbon emissions built on statistics from three provinces in Northeast China. Hu (Hu et al., 2016) observed that adopting intercropping using conservation agriculture principles for maize and wheat in China’s Hexi Corridor can reduce water usage in arid areas and reduce carbon emissions. While existing research has extensively discussed agricultural greenhouse gas emissions from multiple facets, limited research has examined the effect of rural revitalization, a major innovation in modern rural development theory and practice (Liu et al., 2020), on the carbon footprint of agriculture. As rural revitalization progresses, agricultural production will be optimized, agricultural carbon emissions have the potential to be reduced. Rural revitalization plays a crucial role in promoting the adoption of sustainable agricultural production methods. Traditional farming practices often contribute significantly to greenhouse gas emissions, but rural revitalization policies encourage farmers to embrace environmentally friendly approaches such as organic farming and precision agriculture. These sustainable practices have the potential to make a substantial impact in reducing greenhouse gas emissions. Most existing literature primarily concentrates on the connotation and realization path of rural revitalization strategy (Gao et al., 2023), with only a few exploring agricultural and emission reduction strategies from the perspective of rural revitalization (Zhou et al., 2022). Few studies have utilized econometric models to quantify the influence and spatial consequences of rural revitalization on agricultural greenhouse gas emissions. Given the variations in economic development and natural endowments across different regions, the process of rural revitalization and development may exhibit spatial dependence and spillover effects. As a significant farming province, Henan has 7.51 million hectares arable land, ranking third in China, with low urbanization rate less than 60%. Therefore, this study takes the province of Henan as an example, and employs panel data from 18 cities at the prefecture level within Henan province from 2001 to 2020. The study uses Spatial Moran’s global index to examine the correlation and agglomeration characteristics of agricultural carbon emissions. Additionally, a spatial panel data econometric model is used to empirically examine the influence and spatial impact of rural revitalization on agricultural greenhouse gas emissions. The outcomes of this study aim to offer insights for agricultural carbon reduction policies in Henan province.
Rural revitalization is tightly linked to agricultural carbon emissions. The 19th Communist Party of China National Congress introduced the rural revitalization strategy, which encompasses the general policy of “flourishing industry, livable ecology, Rural style civilization, efficient governance, and thriving livelihood.” The strategy similarly outlines specific demands for rural revitalization across five dimensions.
“Flourishing industry” is a driving force behind rural revitalization (Wang et al., 2021), aiming to promote economic growth in rural regions. Nevertheless, the development related to the agricultural sector heavily relies on machinery, leading to a long-term equilibrium connection between the growth in the farming industrial economic system and mechanization (Juhász, 2018). This heavy mechanization results in increased usage of diesel and electricity, thus contributing to higher carbon dioxide emissions in agriculture.
“Ecological livability” is a fundamental aspect of rural revitalization (Yang et al., 2023). The use of pesticides and fertilizers in rural areas exhibits a direct influence on the natural environment. Excessive usage relating to these chemicals can deteriorate the ecological balance and diminish air quality for local residents. Moreover, it can contribute to increased carbon dioxide emissions from agriculture. Furthermore, the expansion of rural postal routes brings convenience to rural residents, but it also promotes the use of mechanical transportation, leading to a rise in carbon dioxide emissions.
“Rural style civilization” serves as the essence of the rural revitalization strategy (Ru, 2023). Rural residents’ investments in education, culture, and entertainment reflect their emphasis on cultural and educational values. The improvement of education levels is helpful for the widespread adoption of advanced agricultural cultivation methods and the enhancement of productivity. Ultimately, this has the ability to help curb agricultural carbon emissions.
“Efficient governance” serves as the organizational backbone for rural revitalization (Leck and Simon, 2013). An increased budget in the urban and rural affairs sector often focuses on rural infrastructure development, such as the construction of farmland and canals. These endeavors invariably require additional manpower, resources, and machinery, thereby contributing to higher agricultural carbon emissions.
“Thriving livelihood” represents the ultimate objective of the rural revitalization tactic (Zhuo et al., 2021). It could be measured through the disposable income of rural residents. If disposable income increases, it ensures a higher standard of material wellbeing for rural residents. Consequently, people will have more time and energy to engage in various cultural activities. This, in turn, facilitates the widespread adoption of advanced green and low-carbon agricultural technology as well as professional agricultural knowledge. Ultimately, this helps to curb agricultural carbon emissions.
A comprehensive analysis reveals that the effect of rural revitalization concerning agricultural carbon emissions can be uncertain, leading to both positive and negative outcomes. Therefore, we propose Hypothesis 1.
H1. The effect of rural revitalization on farming greenhouse gases is uncertain.
Countryside revitalization will facilitate the enhancement of agricultural infrastructure and production factors, with agricultural production technology being a crucial resource that spreads rapidly through inter-regional exchanges. Technological upgrades and spillover effects will expedite the decrease of farming carbon emissions in nearby areas. Furthermore, the development of countryside revitalization may enhance the competitive advantage of relevant enterprises, serving as benchmarks for other companies to learn from. This will further generate an “imitation result” and “demonstration result,” reinforcing the spatial effect of countryside revitalization regarding farming carbon emissions. Therefore, we propose Hypothesis 2.
H2. Rural revitalization exhibits a notable spatial spillover impact on carbon emissions in agriculture.
Rural revitalization aims to achieve a prosperous life (Stokes and Seto, 2019). During the course of rural revitalization and progress, promoting the expansion of the agricultural economy is crucial. Zang et al. conducted research on Xinjiang Province in China using relevant data from 2002 to 2020 to examine the association between agricultural economy and agricultural greenhouse gas emissions. The consequences revealed that the farming economy had a notable influence on the intensity of agricultural greenhouse gas emissions (Zang et al., 2022). Zhang et al. also discovered a reciprocal cause-and-effect relationship between agricultural carbon emissions and agricultural economic growth in both the short and long term (Zhang et al., 2019).
Furthermore, the level of mechanization plays a crucial role in agricultural production technology. The advancement of rural revitalization is closely linked to agricultural mechanization, which impacts farming scale, agricultural labor productivity, and industrial structure (Wang et al., 2022). Consequently, it also affects agricultural carbon emissions. Drawing from these findings, we propose Hypothesis 3.
H3. Agricultural GDP and the level of mechanical technology progress serve as intermediate factors in the correlation between rural revitalization and the release of carbon emissions from agricultural activities.
The dependent factor in this study refers to carbon emissions from agriculture, which encompass CH4 emissions from rice farming and N2O emissions generated by fertilizers as well as soils. Additionally, it includes CO2 emissions produced by fertilizers, insecticides, agricultural plastics, ploughing, agricultural equipment, and agricultural water management (Xing and Yan, 2000; Hu et al., 2010; Min and Hu, 2012). The calculation method for agricultural carbon emissions is provided in Formula (1) as proposed by Tian et al. (Tian et al., 2012).
Regarding N2O emissions from different crops, this study synthesizes the research findings of Wang (Wang, 1997), Yu et al. (Yu et al., 1995), Su et al. (Su et al., 1992), Huang et al. (Huang et al., 1995), and Qiu et al. (Qiu et al., 2010). The N2O emission parameters for corn, rice, winter wheat, soybean, vegetables, in addition to other dry crops were set as 2.532, 0.24, 1.75, 2.29, 4.944, and 0.95 (kg·hm-2) respectively. The emission coefficients for other emission sources are presented in Table 1. N2O and CH4 emissions were converted using the results of the sixth IPCC survey: 1 metric ton of CH4 is equal to 27.2 tons of CO2, and 1 metric ton of N2O is equal to 273 metric tons of CO2. (CO2 emission coefficient = carbon emission coefficient * 44/12).
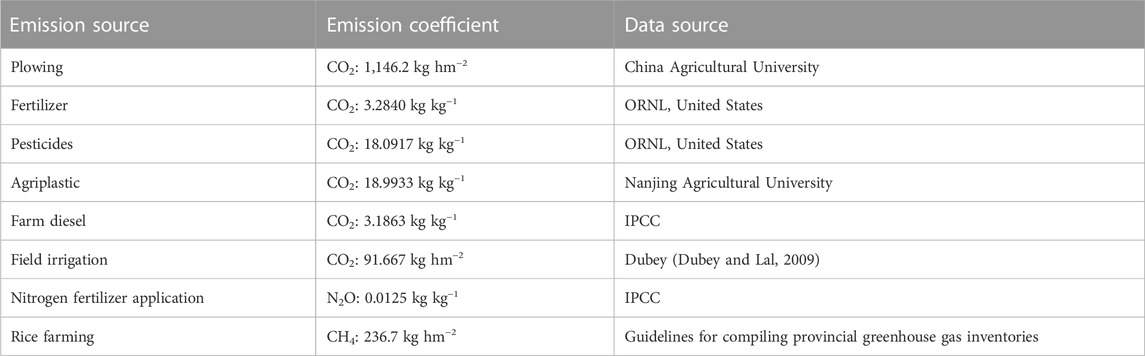
TABLE 1. Emission coefficients of agricultural GHG emissions.
Where Ti is in reference to the actual cultivated area of rice, the real utilization of nitrogen fertilizer, the actual use of chemical fertilizer, the actual use of pesticides, the actual utilization of farming film, the real usage of diesel fuel, the actual irrigation zone, and the actual cultivated area of crops.
The Key explanatory variable in the investigation refers to the holistic measure of rural rejuvenation. It is grounded in the new era of rural revival strategy, which focuses on the aim of rural revival: flourishing industry, livable ecology, rural style civilization, efficient governance, and thriving livelihood. The indicator system in favor of rural revitalization was constructed and is presented in Table 2. To avoid subjectivity and uncertainty, the entropy method was employed to assess weights for the relevant indexes. Firstly, these indicators were standardized, and then the information entropy of each indicator was calculated. Finally, the weights for each indicator could be determined according to the information entropy. The detailed steps can be found in references (Zhao et al., 2018).
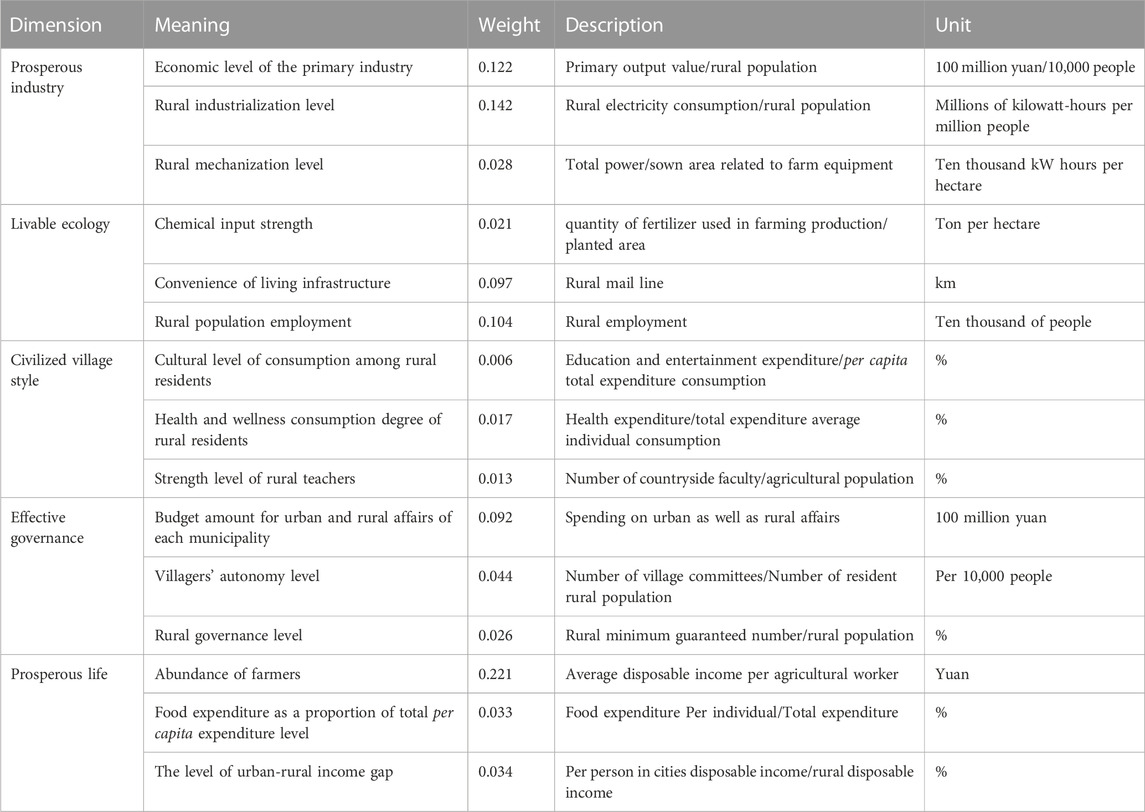
TABLE 2. Indicator system of rural revitalization.
The selected Controlled factors in this investigation include urbanization, industrial structure, scale of cultivated land, investment intensity of farmers, and investment in the primary industry. The concept of urbanization is multidimensional and encompasses economic, social, land, population, and ecological aspects (Chen et al., 2018). As scholars have deepened their understanding of urbanization, it is widely believed that a single indicator is insufficient to capture its complexity. Therefore, this study adopts a multidimensional urbanization index as a control variable, which includes the commonly used dimensions of economic urbanization, Population growth in urban areas, and Urban land development.
Urban economic growth is defined as the ratio between non-agricultural economy to the combined economy of agriculture, industry, and services. Population urbanization represents the proportion of residents to the total urban population. Land urbanization is assessed by the proportion of urban built-up area to the administrative area. The structure of the industrial sector is captured by the proportion of the GDP of the agriculture sector to the total industrial GDP. The scale of cultivated land is represented through the comparison of the actual sown cultivated area to the quantity of employees in the primary industry. The investment intensity of rural households is indicated by the ratio of fixed investment by farmers to the population working in the agricultural sector. Investment in fixed assets in the agricultural sector is measured by the volume of fixed investment in that sector.
The information utilized in this research includes agricultural carbon emissions data, indicators of rural revitalization at all levels, and controlled variables. The aforementioned information was obtained from the Henan Provincial Statistical Compilation and Rural Statistical Compilation spanning from 2001 to 2020. In instances where there were a few absent data points, they were supplemented using trend analysis and linear fitting methods.
The Global Moran’s coefficient model was utilized to examine the geographic autocorrelation of total agricultural carbon footprint. The equation utilized is as follows:
where I stands for the Global Moran’s coefficient I, and n denotes the quantity of measured cities.
The variables
Empirical analysis was conducted to examine the influence of rural revitalization regarding carbon emissions from agriculture in the province of Henan, with the objective of testing the hypothesis. The spatial metrology model utilized is described as:
where c£ represents a constant value;
This study was inspired by the findings of Deng et al. (Deng and Zhang, 2021). It employed a panel data intermediate effect model to analyze the intermediary effect of rural revitalization regarding carbon emissions in agriculture for the purpose of examining the hypothesis.
The initial part of the intermediate effect model, represented by Eq. 6, focused on the main effect of rural revitalization. The second and third stage models, represented by Eqs 4, 5 respectively, were used to examine the mediating effects.
In this study, a parallel intermediate effect analysis was conducted to assess the mediating effects of variables.
Where
Where
To identify the impacts of various levels of rural revitalization on the greenhouse gas emissions from agriculture in Henan Province, a grouping regression approach was employed. The double fixed regression model used is as follows:
where
From 2001 to 2020, carbon footprint of agriculture in Henan Province exhibited an overall pattern of initially increasing afterward decreasing, as depicted in Figure 1. These values appear to be higher compared to the findings of Wei et al. (Wei et al., 2023). This disparity can be attributed to two aspects: firstly, the emission factors were converted to carbon dioxide emission factors; secondly, the greenhouse gases (N2O and CH4) were also calculated and converted to an equivalent of carbon dioxide. Specifically, there was an upward trend in emissions from 2001 to 2015, followed by a decline in total carbon emissions between 2015 and 2020. This change in trend can be attributed to the implementation of a series of green development strategies by China, particularly the introduction of green and low-carbon agricultural policies in 2015. As a result, the effective control of pesticides and fertilizers (Lal, 2004) led to a suppression of carbon footprint of agriculture.
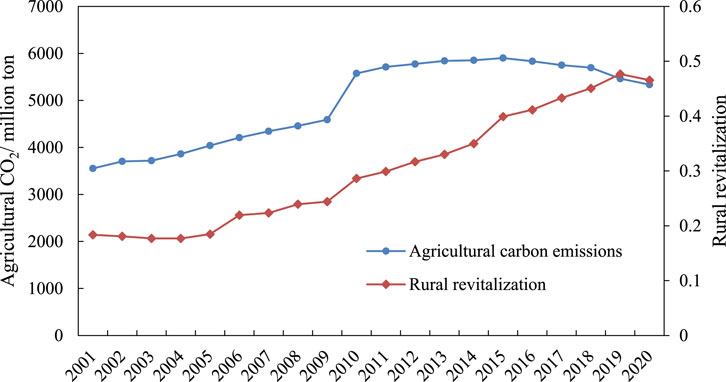
FIGURE 1. Change trend of agricultural CO2 and rural revitalization from 2001 to 2020.
As shown in Figure 1, the rural revitalization curve in Henan Province exhibited an upward trend. From 2001 to 2004, the curve remained relatively flat. However, from 2004 to 2019, it showed a consistent and rapid growth trend, characterized by stability. In the period of 2019–2020, there was a slight decrease in the rural revitalization curve. This pattern can be attributed to the inclusion of the “Three Agricultural Questions” since 2004. As a result, local cities diligently implemented national policies, which acted as a driving force for the continuous growth of rural revitalization.
Based on Figure 2, Xinyang City, Nanyang City, and Zhoukou City ranked as the top three cities in Henan Province with high carbon footprint of agriculture. Jiyuan City, Hebi City, and Sanmenxia City ranked as the three cities with the lowest agricultural carbon emissions. This disparity can be attributed to the fact that Xinyang City, Nanyang City, and Zhoukou City have larger areas of cultivated land and a greater emphasis on agricultural development. Consequently, they tend to consume more fertilizers and pesticides, resulting in higher agricultural carbon emissions. Conversely, Jiyuan City, Hebi City, and Sanmenxia City may have a different agricultural composition, leading to lower carbon emissions in this sector. Furthermore, by referring to other figures, we observe that some cities exhibited a relatively stable trend, such as Hebi City, Sanmenxia City, and Jiyuan City. Conversely, cities like Zhengzhou City, Luoyang City, and Jiaozuo City exhibited a tendency of initially growing followed by declining. Finally, cities like Nanyang City, Xinyang City, and Zhoukou City experienced a significant initial increase followed by a subsequent decrease in agricultural carbon emissions.
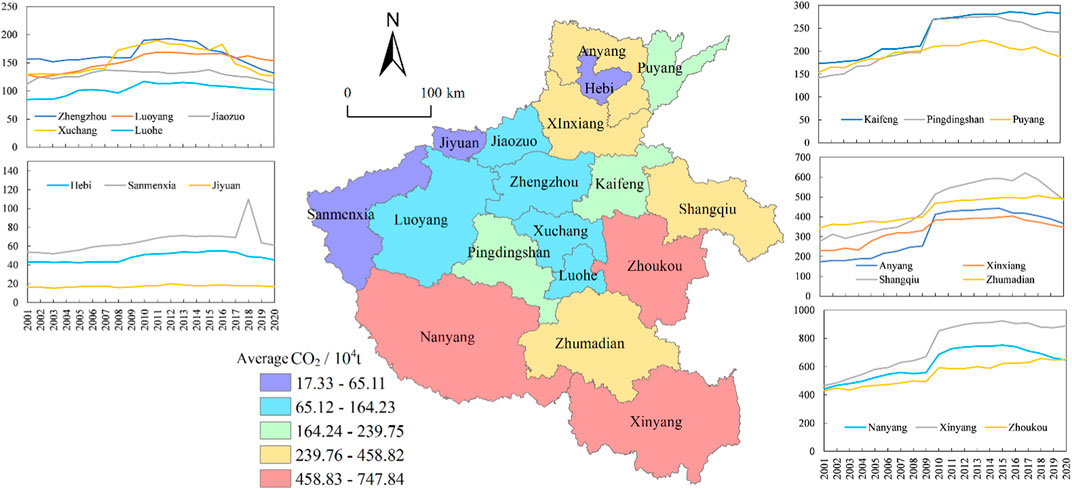
FIGURE 2. Spatial and temporal trend of agricultural carbon emissions.
The Equal Interval method was employed to classify the level of rural revitalization, as illustrated in Figure 3. The rural revitalization level in Henan Province was relatively low in 2001. However, over time, the level of rural revitalization improved. Specifically, by 2005, the eastern part of Henan Province showed an elevated level of rural revitalization. By 2010, the southwestern region of Henan Province exhibited an elevated level of rural revitalization. During the year 2015, the southern and central areas of Henan Province reached a notable extent of rural revitalization. Finally, in the year 2020, the southwestern, eastern, and central cities of Henan Province demonstrated a notable extent of rural revitalization. This shift at the level of rural revitalization can be attributed to the varying levels of importance placed on rural development by local governments. Additionally, different regions possess distinct natural endowments, contributing to the disparities in rural revitalization and development.
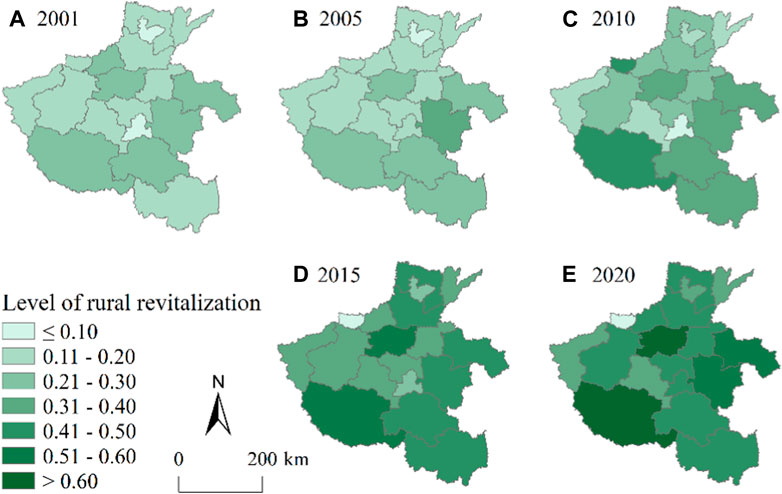
FIGURE 3. Spatial pattern of rural revitalization.
According to Figure 4, the worldwide Moran’s I index for total greenhouse gas emissions from agriculture in the region of Henan Province showed a consistently positive trend from 2001 to 2020. The index showed a variable growth pattern, starting at 0.264 in 2001 and reaching 0.275 in 2020. This finding indicates that the spatial dispersion of agricultural carbon footprint located in Henan Province was not random. Instead, it displayed significant spatial agglomeration characteristics. Furthermore, the degree of spatial agglomeration has progressively increased, suggesting a content of carbon footprint of agriculture in specific areas.
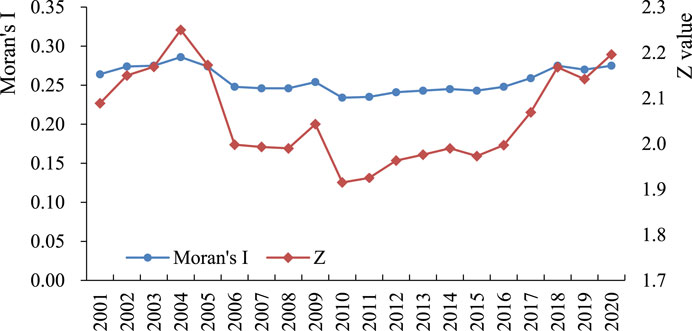
FIGURE 4. Global Moran’ I of agricultural carbon emissions 2001–2020.
In accordance with Rangel et al. (Rangel et al., 2010), the Moran diagram is commonly accustomed to explore the spatial association pattern of a specific variable among neighboring cities in a sample region. In this study, agricultural carbon footprint data from cities in Henan Province were selected for the years 2001–2020. A local Moran scatter plot was then created to analyze the spatial agglomeration variations in carbon emissions from agriculture within this group of cities. Then, according to the Moran scatter plot of agricultural carbon emissions, cities were categorized into four quadrants: High-High level, Low-High level, Low-Low level, and High-Low level, displayed in Table 3.
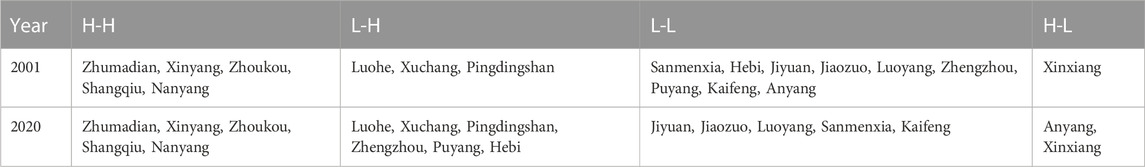
TABLE 3. Spatial agglomeration of agricultural carbon emissions in cities of Henan Province.
Table 3 indicates that, in general, there was a dominant presence of high and low concentration in 2001, accounting for 94.44% of the total. In 2020, the dominance shifted to high agglomeration, low agglomeration, and low agglomeration, accounting for 88.89% of the total. This observation suggests spatial polarization characteristics in urban carbon footprint of farming within the province of Henan.
In the year of 2001, the cities in the first quadrant (H-H) including Zhumadian, Xinyang, Zhoukou, Shangqiu, and Nanyang exhibited heightened carbon footprint from agriculture. Furthermore, he nearby cities had enhanced agricultural greenhouse gas emissions. This indicates that these urban areas contribute to the agricultural carbon footprint of adjacent cities. Luohe, Xuchang, and Pingdingshan were situated in second quadrant (L-H), suggesting that these urban areas had lower agricultural carbon emissions themselves, but the surrounding cities had higher emissions. Additionally, the surrounding cities had spillover effects on the agricultural carbon emissions of Luohe, Xuchang, and Pingdingshan. The urban areas within the third quadrant (L-L), including Sanmenxia, Hebi, Jiyuan, Jiaozuo, Luoyang, Zhengzhou, Puyang, Kaifeng, and Anyang, had lower agricultural carbon emissions both within the cities themselves and in the surrounding cities, with no significant spillover effects. Xinxiang was located in the fourth quadrant (H-L), indicating that Xinxiang had high Carbon footprint of agriculture. Conversely, surrounding cities had lower emissions. Xinxiang Played a crucial role in driving agricultural greenhouse gas emissions in the surrounding cities. Compared to 2001, the high-concentration pattern remained unchanged in 2020. However, in 2020, Zhengzhou, Puyang, and Hebi shifted from the low-low clustering pattern to the low-high agglomeration pattern, indicating a rise in greenhouse gas emissions in the cities encircling them. Anyang shifted from a low-low agglomeration form to a high-low agglomeration form. This indicates an increase in Anyang’s carbon footprint of agriculture, efficiently promoting farming-related carbon emissions locally.
The analysis of carbon footprint of agriculture revealed significant spatial dependency, leading to the construction of a spatial econometric approach to examine the consequence and spatial effects regarding rural revitalization on carbon footprints in agriculture Several tests, including the Hausmann test, LM test, LR test, Wald test, were conducted to evaluate the methodology. The conclusions indicated that the regional fixed effect model was the most suitable for analysis, and it was not feasible to simplify the spatial Dubin model into a spatial lag model or spatial error model. Therefore, a region-fixed Spatial Durbin model was adopted. The outcomes are shown in Table 4.
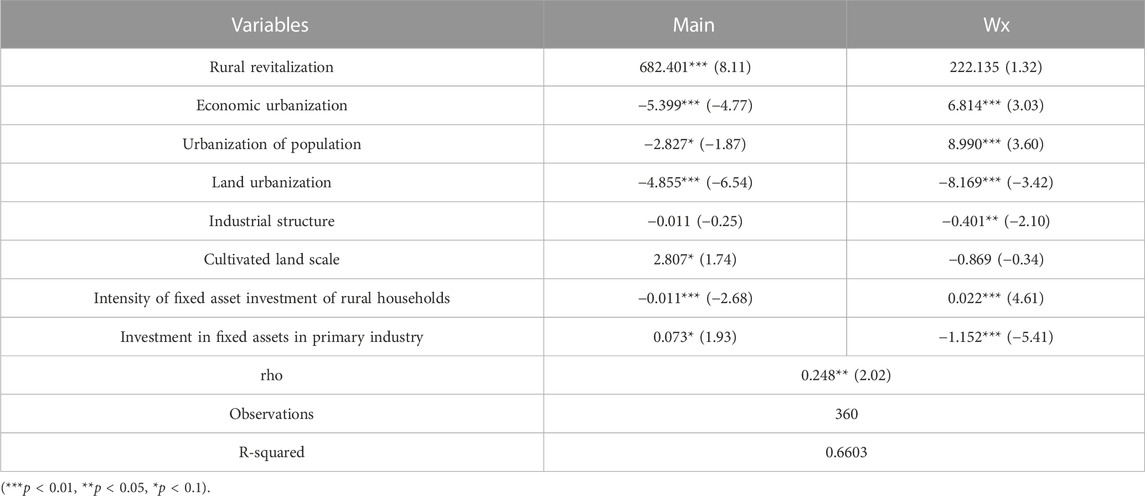
TABLE 4. Results of Durbin model.
Regarding the main explanatory variable, the coefficient of rural revitalization was found to be significantly favorable at the 1% level. This suggests that countryside revitalization has a significant contribution to carbon emissions. This finding is consistent with the results of Zhou et al. (Zhou et al., 2022), which revealed a rise in emissions per capita in rural areas during the rural revitalization process in China. This may be attributed to the promotion of agricultural mechanization and increased mechanization levels through rural revitalization. Mechanization shows a favorable influence on agricultural carbon footprint (Guo et al., 2022). Furthermore, rural revitalization may lead to increased fertilizer usage, thereby boosting agricultural carbon footprint.
In relation to control variables, urbanization was found to possess a significant effect on reducing carbon footprint from agriculture. This finding contradicts the conclusion of Magazzino et al. (Magazzino et al., 2023), which may be due to differences in the research scope and regional heterogeneity, leading to variations in the results. Economic urban expansion, through the advancement of non-agricultural industrial sectors, has facilitated the advancement of green and low-carbon technologies, thus minimizing carbon footprint from agriculture. Population urbanization has led to rural labor migration to urban areas, resulting in more efficient management of rural land and a reduction in agricultural carbon emissions. Land urbanization, characterized by urban expansion and transforming farmland into urban construction land, has also made a contribution to the overall decrease in carbon footprint of agriculture by reducing the total agricultural land area.
The scale of cultivated land was found to have a substantial positive effect on carbon footprint of agriculture in Henan Province at a significance level of 5%, which aligns with the finding of Wang et al. (Wang et al., 2022). Larger-scale farming operations tend to utilize more agricultural equipment, which positively influences carbon footprint of agriculture. The intensity of fixed asset investment of rural households was substantially negative at 1% level. This result is inconsistent with the finding of Lin (Lin and Xu, 2018), possibly attributed to variations in research scope, resulting in disparities in the outcomes. This suggests that rural households’ fixed asset investment, which often prioritize the use of green production machines, effectively curbs carbon emissions from agriculture. Additionally, fixed investment in the primary industry had a significant positive effect on agricultural carbon footprint at a 1% level. This can be attributed to the increase in fixed investment in the primary industry, which promotes agricultural mechanization, leading to higher agricultural electricity consumption and diesel usage, consequently boosting agricultural carbon emissions.
The direct, indirect, total effects of the core explanatory variable (rural revitalization) and control variables on agricultural carbon footprint are presented within Table 5. Regarding the core explanatory variable, an increase of one unit in the degree of rural revitalization was found to lead to a significant increase of 690.730 units in agricultural carbon footprint within the locality. Additionally, agricultural carbon footprint in nearby regions also increased by 550.450 units, passing the significance analysis at 1% level. The evidence suggests that rural revitalization has a significant impact on spatial spillover effects and hypothesis 2 is confirmed. These findings indicate that rural revitalization has both a direct effect on agricultural carbon footprint in the locality and an indirect effect through spillover effects on neighboring areas. The increase in agricultural carbon footprint can be attributed to the expanded use of fertilizers and agricultural machine in rural revitalization efforts. Fertilizers contribute to the release of N2O emissions into the air, while mechanized operation leads to a greater utilization of diesel and gasoline in agriculture, resulting in increased agricultural greenhouse gas emissions. Furthermore, when the extent of rural revitalization improves in a particular region, it serves as a demonstration effect for neighboring areas, prompting them to also increase their level of rural revitalization and subsequently boosting carbon emissions from agriculture. In summary, rural revitalization has a notable favorable influence on both the region itself and its neighboring areas in terms of agricultural carbon footprint.
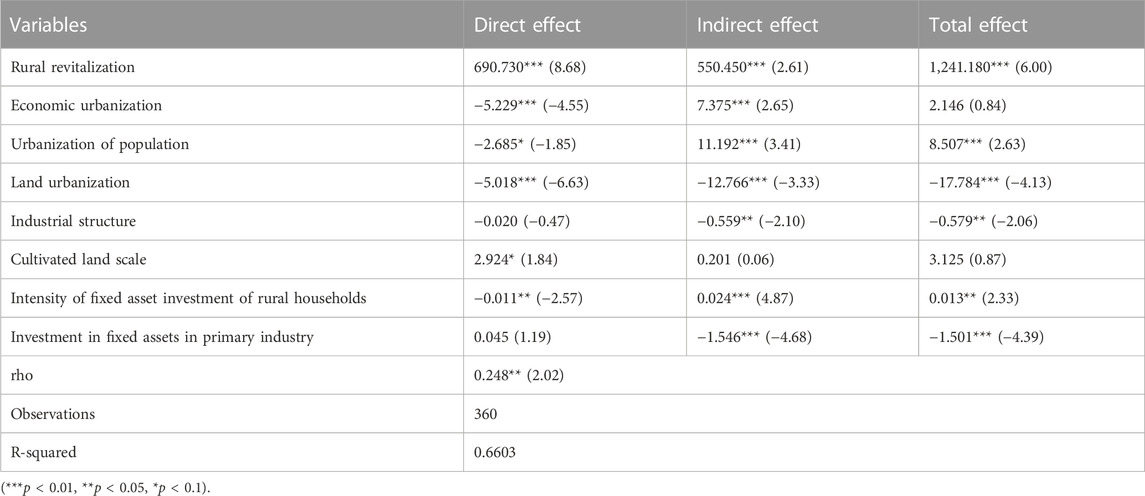
TABLE 5. Decomposition of the influence of explanatory variables on agricultural carbon footprint.
The control variables in this research have shown interesting effects on agricultural carbon footprint.
Increase of one unit in economic urbanization led to a reduction of 5.299 units in local agricultural carbon footprint. However, it also resulted in an increase of 7.375 units in agricultural carbon footprint in adjacent areas. It suggests that when the non-agricultural economy in a region flourishes, the local agricultural sector may weaken, leading to a shift in demand for agricultural products to neighboring areas. This, in turn, promotes agricultural development in the neighboring areas and increases their carbon emissions.
An increase of one unit in population urbanization resulted in a reduction of 2.685 units in local agricultural carbon emissions. However, it also led to an increase of 11.192 units in agricultural carbon emissions in neighboring areas. This indicates that urbanization can help curb local agricultural carbon footprint, but it holds a promoting influence on agricultural carbon footprint in neighboring areas. The higher level of urbanization in a region attracts labor from neighboring areas, where the rural labor force may still rely on outdated and extensive farming methods, contributing to increased carbon emissions in agriculture.
The total consequence, direct consequence, and indirect consequence of land urbanization were all significantly negative. This may be influenced by the competition and cooperation among neighboring governments. An increase in land urbanization in the local region also leads to a growth in neighboring areas, thereby further inhibiting carbon emissions in the neighborhood. This exhibits a notable detrimental overflow effect.
The total consequence, direct consequence, and indirect consequence of industrial structure were all unfavorable, but indirect consequence was significantly higher rather than direct consequence. The development of the agricultural economy stimulates technological progress, which flows into neighboring areas and reduces carbon emissions in agriculture. This suggests that advancements in farming technology can hold a favorable effect on reducing agricultural carbon footprint.
The total consequence, direct consequence, and indirect consequence of cultivated land scale were all positive, but only the direct consequence was statistically significant. This implies that enlarging the magnitude cultivated land in the local vicinity hold a positive effect on reducing agricultural carbon footprint, but the indirect consequence and overall consequence were not significant.
The direct effect of rural household fixed asset investment intensity was significantly negative, indicating that investment behavior in advanced farming concepts among local farmers can help reduce local agricultural carbon footprint. However, the indirect consequence was positive significantly, suggesting that the spread of farming ideas across administrative lines is limited, and neighboring areas are less influenced by changes in farming practices in the studied region.
The direct effect of fixed asset investment in the first industry was positive, while the indirect effect was significantly negative. This suggests that increasing fixed asset investment in the first industry promotes energy use in agriculture, potentially contributing to higher carbon emissions. However, neighbors may complement each other in terms of learning and adopting green technologies, leading to a net reduction in agricultural carbon emissions.
Overall, these findings highlight the complex interplay between different factors and their effects on agricultural carbon emissions. It emphasizes the importance of considering various socioeconomic and environmental factors when formulating strategies to mitigate carbon emissions in agriculture.
According to Wen et al. (Wen et al., 2004), they employed an intermediate effect model to investigate the process and mechanism of rural revitalization on agricultural carbon footprint. Farming GDP and mechanical technological development were chosen as intermediate variables. The findings are summarized in Tables 6, 7.
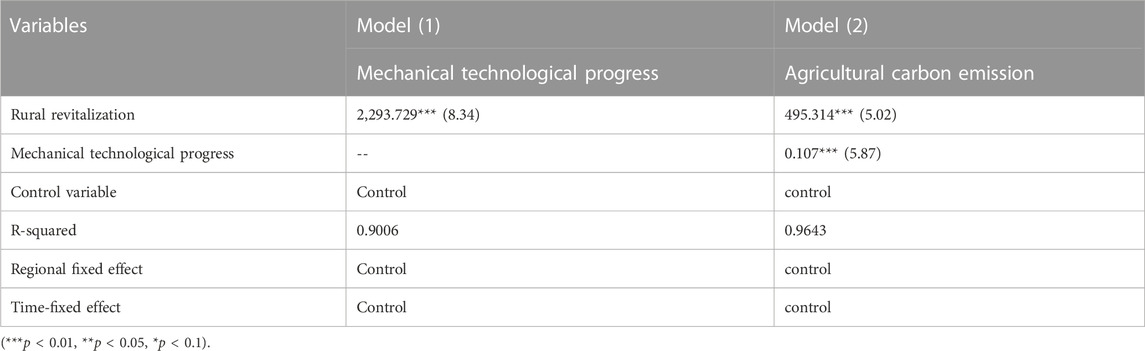
TABLE 6. Intermediate effect model (the level of mechanical technological progress as the intermediate variable).
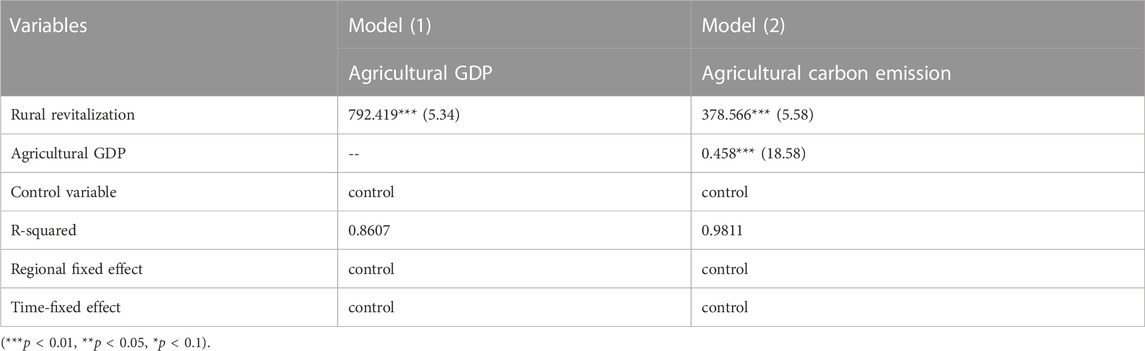
TABLE 7. Intermediate effect model (agricultural GDP as the intermediate variable).
Table 6 shows the outcomes of the model, including the coefficient estimates and statistical significance of the variables. It shows the direct relationships between rural revitalization, agricultural GDP, mechanical technological progress, and agricultural carbon footprint. The coefficients indicate the magnitude and the path of the relationships.
Model (1) shown in Table 6, rural revitalization has a substantial favorable impact on mechanical technological progress with a parameter of 2,293.729, indicating that rural revitalization promotes advancements in mechanical technology. Model (2) reveals that rural revitalization hold a significant positive influence on agricultural carbon footprint with a coefficient of 495.314. This suggests that rural revitalization contributes significantly to agricultural carbon emissions. Additionally, mechanical technological progress is found to hold a significant favorable influence on agricultural carbon footprint with a parameter of 0.107. This implies that advancements in mechanical technology promote agricultural carbon emissions. Therefore, the action pathway for mechanical technological progress is as follows: Rural revitalization ↑→ Mechanical technological progress ↑→ Agricultural carbon emissions ↑.
As for model (1) of Table 7, rural revitalization holds a favorable influence on agricultural GDP with a coefficient of 792.419, indicating that rural revitalization promotes an increase in agricultural GDP. Model (2) shows that rural revitalization significantly contributes to agricultural carbon footprint with a parameter of 378.566. Furthermore, agricultural GDP hold a positive influence on agricultural carbon footprint with a parameter of 0.458. This indicates that farming GDP significantly promotes agricultural carbon emissions. Hence, the action pathway for agricultural GDP is as follows: Rural revitalization ↑→ Agricultural GDP ↑→ Agricultural carbon emissions ↑.
The study also utilized bootstrap sampling and Sobel analysis to investigate the intermediate effects of mechanical technological progress and agricultural GDP. The results of the Sobel analysis confirmed the findings from Tables 6, 7, showing similar significance levels for the intermediate model. Additionally, the bootstrap sampling results supported the presence of a significant intermediate effect. Therefore, we conclude that the assessment of the intermediate effect model is robust.
This study followed the approach of He et al. (He et al., 2022) to address the issue of endogeneity in the analysis of rural revitalization. The backward treatment method was applied to test the endogeneity. The Spatial Durbin model was employed, and the residual term was extracted. This residual term was then included as a new independent variable in the Durbin model. The p-values of the residual coefficient were found to be 0.377, 0.382, 0.386, 0.389, and 0.373, indicating that the model did not suffer from endogeneity.
To ensure the reliability of the spatial model findings, the research utilized the replacement space weight matrix method for robustness analysis. The economic geography nested matrix was replaced with the inverse distance square matrix. The results, as shown in Table 8, revealed that the signs of the core explanatory variables remained the same as in Table 4. These findings indicate that the spatial effect analysis conducted in this study exhibited a certain level of robustness.

TABLE 8. Robustness test of replacing weight matrix.
The accelerated evolution of the agricultural economy has generated an increasing imbalance in economic development among regions. This imbalance is reflected in various aspects of rural life, including agricultural economy, rural culture, and resources allocation in agricultural production. These factors, in turn, impact agricultural carbon emissions. This study focused on different levels of rural revitalization and divided the sample into low, medium, and high levels of rural revitalization. By regressing the data based on these groups, the study aimed to determine the consequences of rural revitalization regarding agricultural carbon footprint and examine the heterogeneity.
The results, as presented in Table 9, showed that for areas with low-level rural revitalization, there was a positive but insignificant impact on agricultural carbon emissions. This suggests that the impact of rural revitalization on agricultural carbon footprint is minimal when the degree of rural revitalization is insufficient. However, when countryside revitalization reaches a medium level, it notably stimulates the growth of agricultural carbon footprint, which matches with the regression results of the Durbin model mentioned earlier. Interestingly, when the level of rural revitalization further improves, the effect on agricultural carbon emissions shifts to a negative state at the 1% level. It indicates that the association between rural revitalization and agricultural carbon footprint is not straightforward and hold an inflection point effect. Moreover, the study found that with further improvement in rural revitalization, it can effectively curb agricultural carbon emissions.
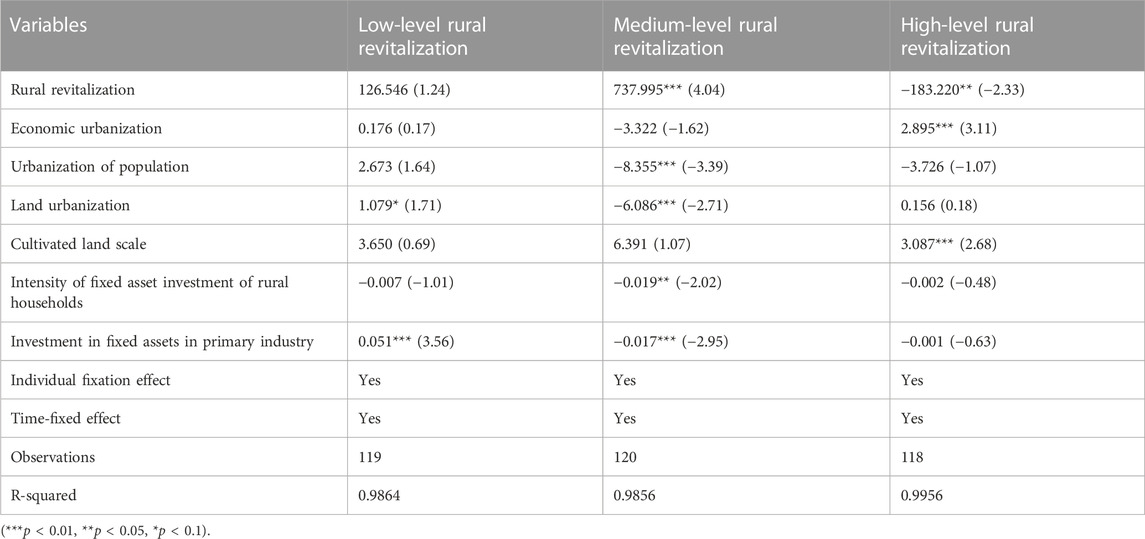
TABLE 9. Influence of diverse levels of rural revitalization on agricultural carbon footprint.
Overall, these findings demonstrate the complex and nonlinear correlation between rural revitalization and agricultural carbon footprint, emphasizing the criticality of reaching an optimal level of rural revitalization to efficiently manage carbon footprint within the farming sector.
On the basis of study on panel data for 18 prefecture-level cities in Henan Province from 2001 to 2020, the study examined the correlation between rural revitalization and agricultural carbon footprint. The analysis used systematic calculations to determine agricultural carbon footprint and employed Moran’s index to identify spatial agglomeration patterns in these emissions. Additionally, a Spatial Durbin model was utilized to analyze the process and spatial effects of rural revitalization on agricultural carbon footprint. The analysis demonstrated that the global Moran’s index analysis revealed a significant positive spatial autocorrelation in agricultural carbon footprint of Henan Province, indicating clustering patterns. The initial findings of analysis indicated that rural revitalization has a significant positive influence on agricultural carbon footprint. Intermediate effect model showed that rural revitalization promotes a growth in carbon footprint by stimulating farming GDP and mechanical technological progress. The spatial effect decomposition results demonstrated that rural revitalization has a notable spatial spillover effect. Improvements in the local rural revitalization degree effectively encourage the growth of agricultural carbon footprint in adjacent regions. The analysis about heterogeneity revealed an inflection point influence of rural revitalization on agricultural carbon footprint. Specifically, low and medium-level rural revitalization positively influenced carbon emissions, while further improvements in rural revitalization had a detrimental suppressive impact on these releases. These findings highlight the spatial characteristics and effects of rural revitalization on agricultural carbon footprint. It underscores the importance of considering spatial dynamics and optimizing rural revitalization strategies to efficiently address carbon footprint in agricultural areas.
Drawing from the research results, the subsequent recommendations are proposed.
(1) Improving farming patterns according to local conditions: Consider economic, social, and environmental factors when implementing the rural revitalization strategy. Guide farmers to optimize farming patterns to mitigate the potential increase in agricultural carbon emissions resulting from rural revitalization. For example, promote the use of organic fertilizers to reduce greenhouse gas emissions, encourage the adoption of biotechnology and biological pest control methods, and provide subsidies for low-carbon agricultural machinery and soil testing formula fertilization.
(2) Accelerating the advancement and application of eco-friendly agricultural core innovations: Recognize the role about agricultural GDP and mechanical technological progress in the correlation between rural revitalization and agricultural carbon footprint. Invest in exploration and advancement of eco-friendly core innovations to reduce emissions. Promote the adoption of technological advancements to mitigate agricultural carbon emissions.
(3) Promoting inter-regional exchanges and cooperation: Recognize the spatial spillover effect of rural revitalization about neighboring areas’ agricultural carbon emissions. Facilitate the exchange and cooperation between different regional agricultural departments to share technology and experiences. Accelerate the spread of agricultural technology and promote the adoption of sustainable farming practices to decrease carbon emissions.
(4) Enhancing the degree of rural revitalization: Understand the inflection point influence of rural revitalization on agricultural carbon footprint. When the rural revitalization’ level reaches a certain threshold, its impact changes from positive promotion to negative inhibition. Therefore, focus on advancing the level of rural revitalization through the Rural Revitalization Strategy, which contributes towards the decrease of agricultural carbon footprint.
By implementing these suggestions, it is possible to effectively address the carbon footprint within the farming industry while promoting rural revitalization and ensuring sustainable development.
The original contributions presented in the study are included in the article/Supplementary material, further inquiries can be directed to the corresponding author.
JZ: Conceptualization, Funding acquisition, Methodology, Supervision, Writing–review and editing. YD: Data curation, Software, Writing–original draft.
The author(s) declare that no financial support was received for the research, authorship, and/or publication of this article.
The authors are grateful to reviewers and editors for helpful comments and suggestions.
The authors declare that the research was conducted in the absence of any commercial or financial relationships that could be construed as a potential conflict of interest.
All claims expressed in this article are solely those of the authors and do not necessarily represent those of their affiliated organizations, or those of the publisher, the editors and the reviewers. Any product that may be evaluated in this article, or claim that may be made by its manufacturer, is not guaranteed or endorsed by the publisher.
Alam, M. S., Duraisamy, P., Siddik, A. B., Murshed, M., Mahmood, H., Palanisamy, M., et al. (2023). The impacts of globalization, renewable energy, and agriculture on CO2 emissions in India: contextual evidence using a novel composite carbon emission-related atmospheric quality index. Gondwana Res. 119, 384–401. doi:10.1016/j.gr.2023.04.005
Chen, M., Liu, W., Lu, D., Chen, H., and Ye, C. (2018). Progress of China's new-type urbanization construction since 2014: a preliminary assessment. Cities 78, 180–193. doi:10.1016/j.cities.2018.02.012
Chen, X., Shuai, C., Wu, Y., and Zhang, Y. (2020). Analysis on the carbon emission peaks of China's industrial, building, transport, and agricultural sectors. Sci. Total Environ. 709, 135768. doi:10.1016/j.scitotenv.2019.135768
Deng, R., and Zhang, A. (2021). The impact of urban digital finance development on carbon emission performance in China and mechanism. Resour. Sci. 43, 2316–2330. doi:10.18402/resci.2021.11.14
Dubey, A., and Lal, R. (2009). Carbon footprint and sustainability of agricultural production systems in Punjab, India, and Ohio, USA. J. Crop Improv. 23, 332–350. doi:10.1080/15427520902969906
Dumortier, J., and Elobeid, A. (2021). Effects of a carbon tax in the United States on agricultural markets and carbon emissions from land-use change. Land Use Policy 103, 105320. doi:10.1016/j.landusepol.2021.105320
Gao, J., Yang, J., Chen, C., and Chen, W. (2023). From ‘forsaken site’ to ‘model village’: unraveling the multi-scalar process of rural revitalization in China. Habitat Int. 133, 102766. doi:10.1016/j.habitatint.2023.102766
Guo, H., Xie, S., and Pan, C. (2021). The impact of planting industry structural changes on carbon emissions in the three northeast provinces of China. Int. J. Environ. Res. Public Health 18, 705. doi:10.3390/ijerph18020705
Guo, L., Song, Y., Zhao, S., Tang, M., Guo, Y., Su, M., et al. (2022). Dynamic linkage between aging, mechanizations and carbon emissions from agricultural production. Int. J. Environ. Res. Public Health 19, 6191. doi:10.3390/ijerph19106191
Guttikunda, S. K., and Jawahar, P. (2014). Atmospheric emissions and pollution from the coal-fired thermal power plants in India. Atmos. Environ. 92, 449–460. doi:10.1016/j.atmosenv.2014.04.057
He, Y., Wang, H., and Liu, Y. (2022). Spatial effects of agricultural carbon emissions from the perspective of industrial agglomeration. Resour. Sci. 44, 2428–2439. doi:10.18402/resci.2022.12.04
Hu, F., Gan, Y., Cui, H., Zhao, C., Feng, F., Yin, W., et al. (2016). Intercropping maize and wheat with conservation agriculture principles improves water harvesting and reduces carbon emissions in dry areas. Eur. J. Agron. 74, 9–17. doi:10.1016/j.eja.2015.11.019
Hu, X., and Wang, J. (2010). Estimation of greenhouse gas emissions from livestock and poultry in China. Trans. Chin. Soc. Agric. Eng. 26, 247–252. doi:10.3969/j.issn.1002-6819.2010.10.042
Huang, G., Chen, G., Wu, J., Huang, B., and Yu, K. (1995). Study on N_2O and CH_4 emission fluxes from typical dry farmland in Northeast China. Chin. J. Appl. Ecol., 383–386.
Huang, X., Xu, X., Wang, Q., Zhang, L., Gao, X., and Chen, L. (2019). Assessment of agricultural carbon emissions and their spatiotemporal changes in China, 1997-2016. Int. J. Environ. Res. Public Health 16, 3105. doi:10.3390/ijerph16173105
Ismael, M., Srouji, F., and Boutabba, M. A. (2018). Agricultural technologies and carbon emissions: evidence from Jordanian economy. Environ. Sci. Pollut. Res. Int. 25, 10867–10877. doi:10.1007/s11356-018-1327-5
Juhász, R. (2018). Temporary protection and technology adoption: evidence from the napoleonic blockade. Am. Econ. Rev. 108, 3339–3376. doi:10.1257/aer.20151730
Lal, R. (2004). Carbon emission from farm operations. Environ. Int. 30, 981–990. doi:10.1016/j.envint.2004.03.005
Leck, H., and Simon, D. (2013). Fostering multiscalar collaboration and Co-operation for effective governance of climate change adaptation. Urban Stud. 50, 1221–1238. doi:10.1177/0042098012461675
Li, J., Gao, M., Luo, E., Wang, J., and Zhang, X. (2023). Does rural energy poverty alleviation really reduce agricultural carbon emissions? The case of China. Energy Econ. 119, 106576. doi:10.1016/j.eneco.2023.106576
Lin, B., and Xu, B. (2018). Factors affecting CO2 emissions in China's agriculture sector: a quantile regression. Renew. Sustain. Energy Rev. 94, 15–27. doi:10.1016/j.rser.2018.05.065
Liu, C., Xu, R., Xu, K., Lin, Y., and Cao, Y. (2023b). Carbon emission effects of land use in chaobai river region of beijing–tianjin–hebei, China. Land 12, 1168. doi:10.3390/land12061168
Liu, Q., and Xiao, H. (2020). The impact of farmland management scale and fiscal policy for supporting agriculture on agricultural carbon emission. Resour. Sci. 42, 1063–1073. doi:10.18402/resci.2020.06.05
Liu, S., Jia, J., Huang, H., Chen, D., Zhong, Y., and Zhou, Y. (2023a). China’s CO2 emissions: a thorough analysis of spatiotemporal characteristics and sustainable policy from the agricultural land-use perspective during 1995–2020. Land 12, 1220. doi:10.3390/land12061220
Liu, X., Zhang, S., and Bae, J. (2017). The impact of renewable energy and agriculture on carbon dioxide emissions: investigating the environmental Kuznets curve in four selected ASEAN countries. J. Clean. Prod. 164, 1239–1247. doi:10.1016/j.jclepro.2017.07.086
Liu, Y., Zang, Y., and Yang, Y. (2020). China’s rural revitalization and development: theory, technology and management. J. Geogr. Sci. 30, 1923–1942. doi:10.1007/s11442-020-1819-3
Liu, Z., Lang, L., Hu, B., Shi, L., Huang, B., and Zhao, Y. (2021). Emission reduction decision of agricultural supply chain considering carbon tax and investment cooperation. J. Clean. Prod. 294, 126305. doi:10.1016/j.jclepro.2021.126305
Magazzino, C., Cerulli, G., Shahzad, U., and Khan, S. (2023). The nexus between agricultural land use, urbanization, and greenhouse gas emissions: novel implications from different stages of income levels. Atmos. Pollut. Res. 14, 101846. doi:10.1016/j.apr.2023.101846
Min, J., and Hu, H. (2012). Estimation of greenhouse gas emissions from agricultural production in China. China's Popul. China Population,Resources Environ. 22, 21–27. doi:10.3969/j.issn.1002-2104.2012.07.004
Mondal, M. A. H., Rosegrant, M., Ringler, C., Pradesha, A., and Valmonte-Santos, R. (2018). The Philippines energy future and low-carbon development strategies. Energy 147, 142–154. doi:10.1016/j.energy.2018.01.039
Nduagu, E. I., and Gates, I. D. (2015). Unconventional heavy oil growth and global greenhouse gas emissions. Environ. Sci. Technol. 49, 8824–8832. doi:10.1021/acs.est.5b01913
Pugh, T. A. M., Arneth, A., Olin, S., Ahlström, A., Bayer, A. D., Klein Goldewijk, K., et al. (2015). Simulated carbon emissions from land-use change are substantially enhanced by accounting for agricultural management. Environ. Res. Lett. 10, 124008. doi:10.1088/1748-9326/10/12/124008
Qiu, W., Liu, J., Hu, C., Tan, Q., and Sun, X. (2010). Comparative study on nitrous oxide emission difference between cultivated vegetable fields and bare fields. Ecol. Environ. Sci. 19, 2982–2985. doi:10.16258/j.cnki.1674-5906.2010.12.034
Rangel, T. F., Diniz-Filho, J. A. F., and Bini, L. M. (2010). SAM: a comprehensive application for spatial analysis in macroecology. Ecography 33, 46–50. doi:10.1111/j.1600-0587.2009.06299.x
Ridzuan, N. H. A. M., Marwan, N. F., Khalid, N., Ali, M. H., and Tseng, M.-L. (2020). Effects of agriculture, renewable energy, and economic growth on carbon dioxide emissions: evidence of the environmental Kuznets curve. Resour. Conservation Recycl. 160, 104879. doi:10.1016/j.resconrec.2020.104879
Ru, W. (2023). The restrictive factors of migrant workers returning home to Be an entrepreneurship under the background of rural revitalization. Soc. Sci. Res. Front. doi:10.57237/j.ssrf.2023.02.002
Stokes, E. C., and Seto, K. C. (2019). Characterizing urban infrastructural transitions for the Sustainable Development Goals using multi-temporal land, population, and nighttime light data. Remote Sens. Environ. 234, 111430. doi:10.1016/j.rse.2019.111430
Su, W., Song, W., Zhang, H., Cao, M., Lu, H., Zhou, Q., et al. (1992). Field nitrous oxide flux in typical winter wheat area of North China. Environ. Chem., 26–32.
Tian, Y., Zhang, J., and Bo, Li (2012). Research on agricultural carbon emissions in China: measurement, spatio-temporal comparison and decoupling effect. Resour. Sci. 34, 2097–2105.
Tian, Y., Zhang, J.-b., and He, Y.-y. (2014). Research on spatial-temporal characteristics and driving factor of agricultural carbon emissions in China. J. Integr. Agric. 13, 1393–1403. doi:10.1016/S2095-3119(13)60624-3
Tristram, O., and West, G. M. (2002). A synthesis of carbon sequestration, carbon emissions, and net carbon flux in agriculture: comparing tillage practices in the United States. Agric. Ecosyst. Environ. 91, 217–232. doi:10.1016/S0167-8809(01)00233-X
Wang, C., Duan, J., Ren, C., Liu, H., Reis, S., Xu, J., et al. (2022b). Ammonia emissions from croplands decrease with farm size in China. Environ. Sci. Technol. 56, 9915–9923. doi:10.1021/acs.est.2c01061
Wang, M., He, B., Zhang, J., and Jin, Y. (2021). Analysis of the effect of cooperatives on increasing farmers’ income from the perspective of industry prosperity based on the PSM empirical study in shennongjia region. Sustainability 13, 13172. doi:10.3390/su132313172
Wang, R., Zhang, Y., and Zou, C. (2022a). How does agricultural specialization affect carbon emissions in China? J. Clean. Prod. 370, 133463. doi:10.1016/j.jclepro.2022.133463
Wang, Z. (1997). Estimation of N_2O emissions from farmland in China. J. Ecol. Rural Environ., 52–56.
Wei, Z., Wei, K., Liu, J., and Zhou, Y. (2023). The relationship between agricultural and animal husbandry economic development and carbon emissions in Henan Province, the analysis of factors affecting carbon emissions, and carbon emissions prediction. Mar. Pollut. Bull. 193, 115134. doi:10.1016/j.marpolbul.2023.115134
Wen, Z., Zhang, L., Hou, J., and Liu, H. (2004). Mediating effect test program and its application. Acta Psychol. Sin., 614–620.
Wojewodzki, M., Wei, Y., Cheong, T. S., and Shi, X. (2023). Urbanisation, agriculture and convergence of carbon emissions nexus: global distribution dynamics analysis. J. Clean. Prod. 385, 135697. doi:10.1016/j.jclepro.2022.135697
Xia, X., Yu, R., and Zhang, S. (2023). Evaluating the impact of smart city policy on carbon emission efficiency. Land 12, 1292. doi:10.3390/land12071292
Xing, G., and Yan, X. (2000). Analysis and estimation of N_2O emission from farmland in China and mitigation strategies. J. Ecol. Rural Environ., 1–6. doi:10.3969/j.issn.1673-4831.2000.04.001
Xiong, C., Yang, D., and Huo, J. (2016a). Spatial-temporal characteristics and LMDI-based impact factor decomposition of agricultural carbon emissions in hotan prefecture, China. Sustainability 8, 262. doi:10.3390/su8030262
Xiong, C., Yang, D., Xia, F., and Huo, J. (2016b). Changes in agricultural carbon emissions and factors that influence agricultural carbon emissions based on different stages in Xinjiang, China. Sci. Rep. 6, 36912. doi:10.1038/srep36912
Yang, A., Huan, X., Teo, B. S. X., and Li, W. (2023). Has green finance improved China's ecological and livable environment? Environ. Sci. Pollut. Res. Int. 30, 45951–45965. doi:10.1007/s11356-023-25484-w
Yu, K., Chen, G., Yang, S., Wu, J., Huang, B., Huang, G., et al. (1995). Effects of several dryland crops on N_2O release and environmental factors. Chin. J. Appl. Ecol., 387–391.
Zang, D., Hu, Z., Yang, Y., and He, S. (2022). Research on the relationship between agricultural carbon emission intensity, agricultural economic development and agricultural trade in China. Sustainability 14, 11694. doi:10.3390/su141811694
Zhang, L., Pang, J., Chen, X., and Lu, Z. (2019). Carbon emissions, energy consumption and economic growth: evidence from the agricultural sector of China's main grain-producing areas. Sci. Total Environ. 665, 1017–1025. doi:10.1016/j.scitotenv.2019.02.162
Zhao, J., Ji, G., Tian, Y., Chen, Y., and Wang, Z. (2018). Environmental vulnerability assessment for mainland China based on entropy method. Ecol. Indic. 91, 410–422. doi:10.1016/j.ecolind.2018.04.016
Zhou, Q., Liu, Y., and Qu, S. (2022). Emission effects of China's rural revitalization: the nexus of infrastructure investment, household income, and direct residential CO2 emissions. Renew. Sustain. Energy Rev. 167, 112829. doi:10.1016/j.rser.2022.112829
Keywords: agricultural carbon emission, rural revitalization, spatial durbin model, heterogeneity analysis, Henan Province
Citation: Zhao J and Du Y (2023) The impact and spatial effect of rural revitalization on agricultural carbon dioxide emissions: a case study of Henan Province. Front. Environ. Sci. 11:1290126. doi: 10.3389/fenvs.2023.1290126
Received: 07 September 2023; Accepted: 31 October 2023;
Published: 14 November 2023.
Edited by:
Zhangqi Zhong, Guangdong University of Foreign Studies, ChinaReviewed by:
Gaoxiang Gu, East China Normal University, ChinaCopyright © 2023 Zhao and Du. This is an open-access article distributed under the terms of the Creative Commons Attribution License (CC BY). The use, distribution or reproduction in other forums is permitted, provided the original author(s) and the copyright owner(s) are credited and that the original publication in this journal is cited, in accordance with accepted academic practice. No use, distribution or reproduction is permitted which does not comply with these terms.
*Correspondence: Jincai Zhao, emhhb2ppbmNhaTE5ODlAMTYzLmNvbQ==
Disclaimer: All claims expressed in this article are solely those of the authors and do not necessarily represent those of their affiliated organizations, or those of the publisher, the editors and the reviewers. Any product that may be evaluated in this article or claim that may be made by its manufacturer is not guaranteed or endorsed by the publisher.
Research integrity at Frontiers
Learn more about the work of our research integrity team to safeguard the quality of each article we publish.