 Fu Lu1
 Yang Yuan
94% of researchers rate our articles as excellent or good
Learn more about the work of our research integrity team to safeguard the quality of each article we publish.
Find out more
ORIGINAL RESEARCH article
Front. Environ. Sci., 05 September 2023
Sec. Atmosphere and Climate
Volume 11 - 2023 | https://doi.org/10.3389/fenvs.2023.1254390
This article is part of the Research TopicClimate-Environment Interactions under Global Warming, volume IIView all 10 articles
Tracking the evolution of air pollutants has a critical impact on our ability to further improve air quality, which have been extensively studied in the North China Plain (NCP), the Yangtze River Delta (YRD) and the Pearl River Delta (PRD) regions, but remain poorly characterized in Guizhou located in the east of Yunnan-Guizhou Plateau. Here, we analyzed spatiotemporal variations and trends of six criteria air pollutants, i.e., inhalable particles (PM10), fine particle (PM2.5), sulfur dioxide (SO2), carbon monoxide (CO), nitrogen dioxide (NO2) and ozone (O3), from 2016 to 2020 in the focus major cities in Guizhou, taking advantage of the extensive network data available since 2016. The annual mean concentrations of the six criteria air pollutants were substantially lower than China’s national ambient air quality standard (NAAQS-II), confirmed a significant improvement of air quality in Guizhou. The annual mean concentrations of PM10, PM2.5, SO2, CO and NO2 all decreased year by year during 2016–2020 in the focus major cities, and the highest decrease occurred in fall or winter. By contrast, O3 increased with a rate ranged from 0.85 μg·m−3 yr−1 (95% CI: 0∼1.78) to 3.71 μg·m−3 yr−1 (95% CI: 2.54∼5.13), and the highest increase occurred in spring or summer, revealing a strong impetus for reducing O3 pollution. Correlations among the six criteria air pollutants unveiled that the correlation coefficients between PM2.5 and NO2 were higher than those of between PM2.5 and SO2 in most focus major cities, mirroring a priority to control NOx to further reduce PM2.5 pollution in Guizhou. The focus of curbing O3 pollution in Guizhou should be redesigned to mitigate multiple precursors from multiple sectors, and efficient control strategies to mitigate warm seasons O3 pollution should also be implemented in cold seasons. Our results will benefit for our knowledge about current air pollution situation and police makers for future air pollution control in Guizhou.
Rising anthropogenic interferences for rapid and energy-intensive development in China has triggered a overwhelming quantities of tropospheric air pollutants (Hoesly et al., 2017), which not only impacts weather and climate (Guo et al., 2014) but weakens net primary productivity (Yue et al., 2017) and lowers Chinese urbanites’ expressed happiness on social media (Zheng et al, 2019a), particularly in Beijing-Tianjin-Hebei (BTH), Sichuan Basin (SCB), Yangtze River Delta (YRD) and Pearl River Delta (PRD) regions (Lelieveld et al, 2015; Zhang et al., 2019a). Many epidemiological studies confirmed that both nonaccidental and cause-specific mortality have been associated with exposure to tropospheric air pollution (Burnett et al., 2018; Yin et al., 2020). A global atmospheric chemistry model estimated that there were 2.5 million individuals in China die each year from the health effects of air pollution (Lim et al., 2012; Lelieveld et al., 2015).
Large-scale and long-lasting air pollution frequently descend on China. Since 2012, the China National Environmental Monitoring Center (CNEMC) network (http://106.37.208.233:20035/, last access: 03 November 2021) routinely measure levels of particulate matter measuring 10 μm (PM10) and 2.5 μm (PM2.5), sulfur dioxide (SO2), nitrogen dioxide (NO2), carbon monoxide (CO) and ozone (O3) to improve our understanding of air pollution under different conditions and regions and help formulate more effective air pollution control strategies. According to monitoring results from 74 cities throughout China showed that the daily average concentrations of PM2.5 exceeded the national ambient air quality standard of 75 ug m−3 for 69% of days in January in 2013, with a record-breaking daily concentration of 772 ug m−3 (Huang et al., 2014). High O3 concentrations exceeding the national ambient air quality standards have frequently been observed in the aforementioned regions (Guo et al., 2017; Wang et al., 2017a). In response to the extremely severe and persistent haze pollution experienced by about 800 million people during the first quarter of 2013 (Huang et al., 2014), the Chinese government launched the Air Pollution Prevention and Control Action Plan (APPCAP, 2013–2017) to reduce anthropogenic emissions with a focus on the BTH, the YRD, and the PRD regions (www.gov.cn/zwgk/2013-09/12/content_2486773.htm, last access: 05 November 2021). The three metropolitan regions were required to reduce the five-year PM2.5 concentrations by 25%, 20%, and 15%, respectively. The APPCAP launched a series of aggressive control measures including “ultralow” emission standard for power plants, strengthening industrial emission standards and phasing out outdated industrial capacity and so on. According to the evaluation of the effectiveness of the APPCAP, the national level of PM2.5 exposure has dropped by 32% from 61.8 to 42.0 μg·m−3 in 5 years (Zhang et al., 2019b). In order to further reduce the PM2.5 concentration, significantly improve the environmental air quality, and enhance the people’s blue sky happiness, the State Council issued the three-year Action Plan for winning the battle to protect the blue sky (hereinafter referred to as the “Action Plan,” 2018–2020) (http://www.gov.cn/zhengce/content/2018-07/03/content_ 5303158.htm, last access: 05 November 2021). The Action Plan proposed that by 2020, the concentration of PM2.5 in cities below the prefecture level will decrease by more than 18%, and the total SO2 and NOx emissions will be reduced by more than 15%, respectively, compared with 2015. The Action Plan clarified five categories of measures, including optimizing industrial structure, adjusting energy structure, adjusting transportation structure, optimizing land use structure and implementing special actions (Zheng, et al., 2018a; Chu et al., 2020). Consequently, the total emission of major air pollutants and the number of days of heavy pollution in corresponding regions have been significantly reduced (Jiang et al., 2021), resulting in more blue-sky days (https://www.mee.gov.cn/ywdt/hjywnews/201607/t20160706_357205.shtml, last access: 06 November 2021). To further improve the country’s ecological environment, the Communist Party of China Central Committee and the State Council jointly released a Circular on Further Promoting the Nationwide Battle to Prevent and Control Pollution (http://www.gov.cn/zhengce/2021-11/07/content_5649656.htm, last access: 06 November 2021). According to the circular, by 2025, in cities at or above the prefectural level, both the intensity of PM2.5 and NOx will be decreased by 10 percent and the growth trend of O3 concentration will be effectively curbed. Success in controlling air pollution in China has changed the concentrations of air pollutants in China, decreasing the concentrations of CO, SO2, NO2, PM2.5, and PM10 and increasing the concentrations of O3 (Zheng, et al., 2018b; Li et al., 2019a; Li et al., 2019a; Zhang et al., 2019b; Guo et al., 2019; Wang et al., 2020b; Chu et al., 2020). From 2013 to 2018, the concentrations of PM10, PM2.5, SO2, CO, and NO2 decreased by 37%, 45%, 71%, 37%, and 19%, respectively, while O3 increased by 17% (Chu et al., 2020), and the warm-season (April-September) daily maximum 8-h average (MDA8) O3 levels increase by 2.4 ppb (5.0%) year−1 from 2013 to 2019, with over 90% of the nationwide ozone monitoring sites showing positive trends and 30% with trends larger than 3.0 ppb·year−1 (Lu et al., 2020), indicating a increasing photochemical pollution. To lessen particulate matter pollution, policies have focused on the reduction of primary emissions such as SO2 and NOx, while proposed efforts to reduce O3 pollution target volatile organic compounds (VOCs) (Huang et al., 2020). However, efforts to reduce one pollutant can have perverse effects on others (Kulmala, 2015) and enhanced secondary pollution may offset reduction of primary emissions (Huang et al., 2020), hence further improvement of air quality depends upon a coordinated and balanced strategy for controlling multiple pollutants (Li et al., 2019c; Zhao et al., 2021).
Guizhou is located in Southwest China, bounded by 24°37′∼ 29°13′N and 103°36′∼109°35′E. The climate is diverse with an annual precipitation of 1,100–1,300 mm. The overall terrain is high in the southwest and low in the northeast. Most areas belong to the Karst Hilly landform of Yunnan Guizhou Plateau, and the cities and towns are basically distributed in the flat mountains. With the continuous advancement of urbanization in Central Guizhou, it is preliminarily predicted that by 2025, the new amount of NOx, particulate matter and VOCs in Central Guizhou will increase by 9%, 11%, and 24%, respectively, compared with 2019 (https://sthj.guizhou.gov.cn/zwgk/zfxxgk1/fdzdgknr/tzgg/gggs_5619746/202111/t20211105_71562742.html, last access: 07 November 2021). The source structure of air pollutants will change from large and medium-sized industrial pollution sources in the past to a composite structure of industrial sources, living sources, mobile sources and dust sources. To address air pollution issues and protect public health, in recent years, the government, research institutions and universities have done the following efforts. By 2020, a total of 87 automatic air quality monitoring stations above the provincial level have been built in Central Guizhou, ensuring more than 2 automatic air quality monitoring stations in each county-level city, and forming a 6-index air quality monitoring system networked with the provincial level and covering all counties (districts and cities). The Guizhou Air Pollution Prevention and Control Action Plan (Guizhou_APPCAP, 2014–2017) (https://www.guizhou.gov.cn/zwgk/zcfg/szfwj/qff/201709/t20170925_70477126.html, last access: 08 November 2021) clarified that by 2017, the air quality in the province will be improved, the number of good days will increase year by year, and the concentration of PM10 will be reduced by more than 5% compared with that in 2012. The ambient air quality of Guiyang should be kept in the forefront of key cities in China. Guizhou Province’s three-year Action Plan for winning the battle to protect the blue sky (hereinafter referred to as the Guizhou_Action Plan, 2018–2020) (https://www.guizhou.gov.cn/zwgk/zcfg/szfwj/qff/201809/t20180925_70477270.html, last access: 08 November 2021) clearly stipulated that by 2020, the total emissions of sulfur dioxide and nitrogen oxides in the province will be reduced by more than 7% respectively compared with 2015 and the main pollution indicators such as PM2.5 and PM10 have been effectively controlled. Since the implementation of Guizhou_APPCAP and Guizhou_Action Plan, all departments have deeply implemented the relevant requirements, and the industrial structure, energy structure, transportation structure and land use structure have been continuously optimized and adjusted; Special actions have been carried out for the control of construction and road dust, the control of diesel truck pollution, the air pollution prevention and control of industrial enterprises, the comprehensive treatment of air pollution of industrial furnaces and kilns, the comprehensive treatment of VOCs in key industries, the treatment of loose burning coal and substitution of coal consumption reduction. These attempts has been highly effective in continuously improving air quality and further enhancing people’s sense of blue sky in Guizhou. To reduce continuous flake air pollution in Central Guizhou, Guizhou Provincial Department of Ecological Environment issued the Plan for Joint Prevention and Control of Air Pollution in Central Guizhou Urban Agglomeration (https://sthj.guizhou.gov.cn/zwgk/zfxxgk1/fdzdgknr/tzgg/gggs_5619746/202111/t20211105_71562742.html, last access: 09 November 2021). According to the plan, by 2025, the average annual concentration of six indicators of urban ambient air in Central Guizhou will stably reach the secondary standard, and the aggravating trend of O3 pollution will be effectively curbed. The ratio of excellent days in central cities is more than 95%, and that in county-level cities is more than 96.5%. In order to fight the tough battle against heavy pollution weather and O3 pollution, it is important to fully understand the trends and variations of air pollutants.
Meeting the set targets, realizing the coordinated control of PM2.5 and O3, quantifying the impacts of different emission control policies on air quality and assessing the associations between exposure and human health will require a comprehensive understanding of the spatiotemporal variations and trends of conventional air pollutants in different regions. Compared with the increasing rich studies of spatiotemporal variability of air pollutants and assessing the impact of APPCAP and Action Plan on air quality trends on the national scale (Bai et al., 2020; Chu et al., 2020; Feng et al., 2019; Guo et al., 2019; Jiang et al., 2021; Kong et al., 2021a; Li et al., 2019b; Ma et al., 2019a; Sun et al., 2018; Wang et al., 2017a; Wanget al., 2020a; Zhang et al., 2019a; Zheng et al., 2018b) and in some key areas where photochemical smog pollution has become increasingly worse over recent decades (Bai et al., 2020; Bian et al., 2019; Chen et al., 2019a; Kong et al., 2021b; Li et al., 2020; Liu et al., 2021; Shi et al., 2019; Vu et al., 2019a; Wang et al., 2017b), a provincial long-term estimate of the surface concentrations of six air pollutants in Guizhou on an hourly scale are still lacking. To fill the blank, in this study, the spatiotemporal variations and trends of air quality and the correlations among air pollutants during 2016–2020 were studied based on the automatic monitoring data of air quality in Guizhou. To our knowledge, this study represents the first provincial estimate of air pollutants in Guizhou. The results of this study are of great significance for completing and advancing our understanding of air pollution and formulating accurate and effective air pollution prevention and control strategies.
According to the requirements of ambient air quality standard (GB 3095-2012, https://www.mee.gov.cn/ywgz/fgbz/bz/bzwb/dqhjbh/dqhjzlbz/201203/t20120302_224165.shtml, last access: 09 November 2021) (hereinafter referred to as the new standard), the Guizhou Provincial Environmental Monitoring Central Station network, established by the Department of Ecology and Environment of Guizhou Province began measuring six air pollutants concentrations in Guizhou in 2016. The network includes 164 sites in 98 counties/districts, as visualized in Supplementary Figure S1. PM10, PM2.5, SO2, NO2, O3 and CO are measured following the specifications and test procedures for ambient air quality continuous automated monitoring system released by the Ministry of Ecology and Environment of China (MEE) (HJ 653-2013, https://www.mee.gov.cn/ywgz/fgbz/bz/bzwb/jcffbz/201308/t20130802_256852.shtml, last access: 10 November 2021, and HJ 654-2013, https://www.mee.gov.cn/ywgz/fgbz/bz/bzwb/jcffbz/201308/t20130802_256853.htm, last access: 10 November 2021). Particulate matter concentrations are measured using β absorption and/or oscillating microbalance; SO2 and NO2 concentrations are measured by ultraviolet (UV) fluorescence and by a molybdenum converter and chemiluminescence, respectively; O3 and CO concentrations are measured using UV and infrared absorption, respectively. In addition, both the gross domestic product (GDP) and permanent population at the year-end by region were obtained from the statistical yearbook compiled by the Guizhou Provincial Bureau of Statistics (http://stjj.guizhou.gov.cn/tjsj_35719/, last access: 10 November 2021). The possession of civil vehicles were obtained from the Vehicle Management Office of the Provincial Traffic Police Corps.
Data quality control has been applied to the hourly PM10, PM2.5, SO2, NO2, O3 and CO measurements prior to further analysis because the presence of the outliers, due to instrument malfunctions, the influence of harsh environments and the limitation of measuring methods, may lead to unrealistic spatiotemporal variations. First, the raw observation data with zero or negative value were defined as missing (Chu et al., 2020; Shi et al., 2018). Second, the repeated values for no less than 3 times, which were likely to be duplicated by the reporting system of the monitoring network due to communication error, were also set as missing, except for the first value (Rohde and Muller, 2015; Chu et al., 2020). Third, the unreasonable extreme values were deleted following (Chu et al., 2020). Fourth, spatially and temporally inconsistent outliers and lower PM10 than PM2.5 outliers were removed following (Wu et al., 2018). These procedures remove 7% of the hourly records. In addition, similar data quality control methods with (Lu et al., 2020) were also used here for trend analyses that can be sensitive to data outliers: For each year, there should be more than 60% of available hourly records. If not, all records of this year are removed from the analysis. For each site, we calculate the yearly mean levels of PM10, PM2.5, SO2, NO2, O3 and CO (averaged over all available hourly records) for each year. Year with its mean value falls outside the 5-year mean values ±300% standard deviation range are removed from the analysis. These procedures removed 2% of the remaining hourly records.
In this study, for the trend analyses, the Theil-Sen method has been used, which has been implemented in the R “openair” package (Carslaw and Ropkins, 2012) and are freely available at https://cran.r-project.org/web/packages/openair/index.html (last access: 11 November 2021). Theil-Sen approach, which computes the slopes of all possible pairs of pollutant concentrations and takes the median value (Sen and Kumar, 1968; Theil, 1992), is typically used to determine trends in pollutant concentrations over several years (Lu et al., 2020; Olstrup et al., 2018; Pal and Masum, 2021; Vu et al., 2019b). The advantage of using the Theil-Sen estimator is that it tends to yield accurate confidence intervals, by selecting the median of the slopes, even with non-normal data and heteroscedasticity (Kong et al., 2021a; Lu et al., 2020; Vu et al., 2019a; Wu et al., 2018). The trend estimate, confidence intervals for the trend and significance level are estimated through bootstrap resampling. In our calculations, the trends were based on the deseasonalised monthly mean concentrations of PM10, PM2.5, SO2, NO2, O3 and CO.
Figure 1 and Supplementary Figures S2–S7 show the PM10, PM2.5, SO2, CO, NO2 and O3 values at all available sites for each year in 2015–2020. The observed levels of PM10, PM2.5, SO2, CO, NO2 and O3 during 2016–2020 were on average 38.8 μg·m-3 [95% confidence interval (CI) of 37.4∼41.2], 23.3 μg·m−3 (95% CI: 22.5∼24.2), 10.5 μg·m−3 (95% CI: 9.6∼11.3), 0.7 mg·m−3 (95% CI: 0.6∼0.7), 13.2 μg·m−3 (95% CI: 13.1∼14.2) and 47.2 μg·m−3 (95% CI: 45.8∼48.6), respectively, which were significantly lower than those in BTH, SCB, YRD and PRD regions (Chu et al., 2020; Guo et al., 2019; Kong et al., 2021b; Li et al., 2019c; Wang et al., 2020a; Zhang et al., 2019a; Zheng et al., 2018a). The corresponding maxima of PM10, PM2.5, SO2, CO, NO2 and O3 were 52.8 μg·m−3 (95% CI: 52.5∼53.2), 27.1 μg·m−3 (95% CI: 27.0∼27.3), 16.7 μg·m−3 (95% CI: 16.5∼17.0), 0.8 mg·m−3 (95% CI: 0.7∼0.8), 24.7 μg m-3 (95% CI: 24.6∼24.8) and 58.3 μg·m−3 (95% CI: 58.0∼58.6), occurred in Tongren, Liupanshui, Qianan, Bijie, Zunyi and Anshun, respectively (Table 1). The mean concentrations of PM10, SO2, CO, NO2 and O3 were lower than China’s national ambient air quality standard (NAAQS-I) (https://www.mee.gov.cn/ywgz/fgbz/bz/bzwb/dqhjbh/dqhjzlbz/201203/t20120302_224165.shtml, last access: 15 November 2021) of 40, 20, 4, 80, and 160 μg·m−3, respectively, whereas the level of PM2.5 was still substantially higher than NAAQS-I of 15 μg·m−3 and the WHO guideline of 10 μg·m−3 (https://www.euro.who.int/en/health-topics/environment-and-health/air-quality, last access: 15 November 2021). The percentage of counties/districts with PM10, PM2.5, SO2, CO, NO2 and O3 concentrations higher than 40, 15, 20, 4, 80 and 160 μg·m−3 were 36.7%, 100.0%, 0.0%, 0.0%, 0.0% and 0.0%, respectively. These results confirmed that Guizhou presented a cleaner atmospheric environment as a whole, compared with the cities in eastern and central China hit by serious air pollution caused by the development of urbanization and industrialization.
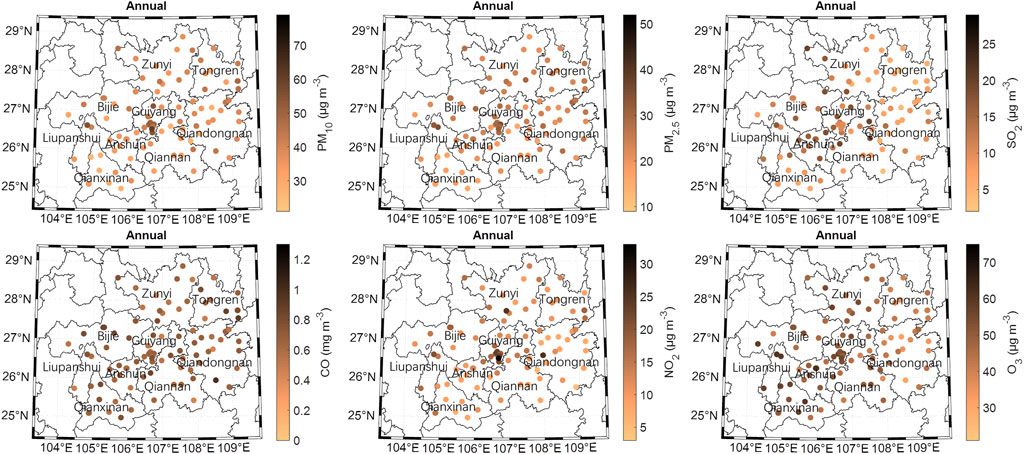
FIGURE 1. Spatiotemporal distributions of PM10, PM2.5, SO2, CO, NO2 and O3 in Guizhou. The map was prepared in MATLAB R2019a using political boundaries from the Global Database of Administrative Areas.
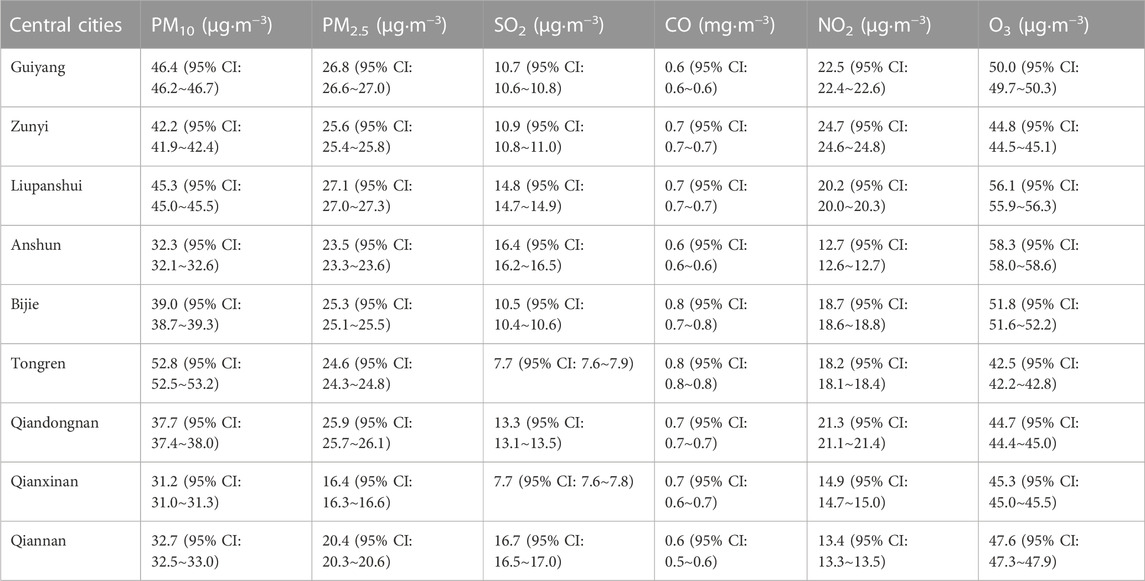
TABLE 1. Statistics for the annual-average concentrations of criteria pollutants in the nine major cities in Guizhou.
Contrasting spatial variations of O3 and the others in Guizhou from 2016 to 2020 were observed (Supplementary Figures S2–S7), which was similar to what has been reported in previous studies conducted in eastern and southern China (Bian et al., 2019; Chen et al., 2019b; Chu et al., 2020; Guo et al., 2019; Li et al., 2019a; Zhang et al., 2019a). During 2016–2020, the spatial distribution shrunk for the high values of PM10, PM2.5, SO2, CO and NO2, while the scope of O3 pollution expanded, and demonstrated a lower spatial heterogeneity than that of the others, which were attributed the success to the reduced anthropogenic emissions and the nonexistence of tailored control measures for O3 in current policies. The increasing spatial distribution of O3 pollution coincided with the decreasing spatial distribution of PM2.5 pollution. This coincidence was largely attributable to the model simulations results that the decrease in PM2.5 could drive the increase in O3 because PM2.5 scavenges hydroperoxy (HO2) and NOx radicals that would otherwise produce O3 (Li et al., 2019c). Ground-based observation also showed that when the concentrations of PM2.5 were less than 100 μg·m−3, O3 concentrations rapidly increased with the decrease in PM2.5 concentrations (Tie et al., 2019). Spatially, the high values of PM10 and PM2.5 appeared in Guiyang and Liupanshui (Supplementary Figures S2, S3), whereas SO2 and NO2 occurred in Guiyang and its neighbouring areas (Supplementary Figures S4, S6), which could be accounted for by the facts that Guiyang and its neighbouring areas concentrated 46% of the province’s population, produced 61% of the province’s total economic output and distributed 53% of the province’s industrial parks, and industrial coal consumption accounted for 42% of theprovince’s total coal consumption (https://sthj.guizhou.gov.cn/xwzx/tzgg/202111/t20211105_77740934.html, last access: 09 November 2021). The basic situation of heavy industrial structure, coal energy structure, and highway transportation structure has not been fundamentally changed in Guiyang and its neighbouring areas, and the problem of structural pollution needs further breakthroughs. In contrast, the high value of CO was widely distributed in inter-provincial border areas (Supplementary Figure S5), demonstrating that it is necessary to implement cross-provincial joint prevention and control measures of air pollution. Distinct exacerbation of O3 pollution can be seen from 2016 to 2020 (Supplementary Figure S7). In 2016, the high value of O3 was concentrated in Guiyang and its neighbouring areas. Since 2017, O3 hot spots extended northwestward to Bijie and Liupanshui, and southwestward to Anshun and Qianxinan. In addition, smaller hotspots of O3 pollution were observed in Zunyi and Tongren. The spatial evolution of O3 pollution suggested that only from a regional perspective will Guizhou decrease O3 pollution.
Air pollutants display diurnal variations due to the diurnal cycles of their influencing factors including meteorological conditions, sources and sinks (Lin et al., 2011; Su et al., 2017). Diurnal regulations of air pollutants were adopted in some regions in China although ongoing research has documented that positive or negative impacts of diurnal regulation approach on air pollutants concentrations were both found at the city level (Wu et al., 2021). Supplementary Figure S8 depicts the annual average diurnal cycles of six criteria pollutants measured from 2016 to 2020 in Guiyang, Zunyi, Liupanshui, Anshun, Bijie, Tongren, Qiandongnan, Qianxinan and Qiannan. Generally, the diurnal variation patterns of PM10, PM2.5, SO2, CO and NO2 seemed fairly synchronous, while that of O3 reversed, which was also observed in Wuqing (Xu et al., 2011), Beijing (Lin et al., 2011) and Nanjing (Ding et al., 2013a). It is apparent that the averages of PM10, PM2.5, SO2, CO and NO2 levels between 2016 and 2018 were higher than that between 2019 and 2020, while the opposite was true for O3. Also it is noteworthy that the peak time for O3 levels has slightly delayed. Additionally, different nighttime-afternoon differences of the six criteria pollutants occurred in the nine major cities.
Specifically, pronounced diurnal variation of PM2.5 was observed in the nine major cities, with an obvious morning peak at around 09:00 to 11:00 (Beijing Time) and an afternoon valley between 14:00 and 16:00. This diurnal pattern was also observed in Beijing (Liu et al., 2015a), Shenyang, Chongqing, Lhasa, Dinghu, Gongga mountain (Liu et al., 2018), Lushan and Changde (Wang et al., 2015). The morning and evening peaks were contributed to by enhanced anthropogenic activity during rush hour, and the afternoon valley was mainly due to a higher atmospheric mixing layer, which is beneficial for air pollution diffusion (Liu et al., 2018; Liu et al., 2015b). The diurnal variation in PM10 concentrations was similar to that of PM2.5 in the nine major cities. The SO2, CO and NO2 concentrations showed similar diurnal patterns with elevated concentration during the night, a peak at around 08:00 to 10:00, and a broad valley in the afternoon. The morning peak was consistent with the rush hour emissions (Hao et al., 2000) and the large nighttime-afternoon differences should be mainly due to larger emissions from heating in combination with stronger temperature inversion during the nighttime (Lin et al., 2011). The diurnal variability of O3 concentrations were opposite to the PM10, PM2.5, SO2, CO and NO2 concentrations, being lowest in the morning and reaching a peak in the afternoon when the photochemical reactions are more intense due to the higher temperature and stronger solar radiation (Shi et al., 2019; Tang et al., 2012). Similar diurnal patterns were also observed for the surface O3 in Beijing (Tang et al., 2009; Tang et al., 2012; Wang et al., 2014a), Tianjin (Wang et al., 2014b), Hong Kong (Guo et al., 2013), Nanjing (Ding et al., 2013b). The lowest O3 concentration during the rush-hours in the morning was mainly caused by the strong destruction of O3 by chemical titration of NO owing to higher NOx emissions (Lin et al., 2011; Lin et al., 2009; Lin et al., 2008).
For each month the average diurnal variations of six criteria pollutants were calculated from the hourly mean values in the corresponding month. Figure 2 shows the monthly average diurnal cycles of criteria pollutants measured from 2016 to 2020 in Guiyang, Zunyi, Liupanshui, Anshun, Bijie, Tongren, Qiandongnan, Qianxinan and Qiannan. As can be seen in Figure 2, the diurnal variations of PM10 and PM2.5 were much more significant in winter than those in other seasons in the nine major cities. The summer-winter difference of the average diurnal amplitude in the PM10 concentration was by far not as large as that in the PM2.5 concentration in the nine major cities. The seasonal average diurnal variations of PM10 and PM2.5 in Qianxinan and Qianan were much less significant than in other cities. The monthly average diurnal cycles of SO2 was much less significant compared with other pollutans, particularly in Bijie, Tongren and Qianxinan. The concentrations of O3 precursors CO and NO2 at night in winter stayed at high levels, which might be resulted from larger emission from heating, in combined with strong temperature inversion and stable condition (Lin et al., 2009). The highest average diurnal amplitude for NO2 appeared in Guiyang, Zunyi, Tongren and Qiandongnan, and the lowest average diurnal amplitude appeared in Anshun and Qianan. In contrast with the primary pollutants, the secondary pollutant O3 showed a reverse seasonal average diurnal pattern with the highest average diurnal amplitude appearing in spring (particularly in April and May) and summer (particularly in August and September), and the lowest amplitude appearing in winter (particularly in December and January), which was consistent with results observed in Beijing-Tianjin-Hebei region, Yangtze River Delta, Pearl River Delta, Chengdu-Chongqing region and the Fenhe-Weihe River Plain urban agglomeration (China’s Air Ozone Pollution Prevention and Control Blue Book (2020): https://mp.weixin.qq.com/s/y9CJhur7v18aBhYcOTvgQA). It is worth noting that the durations of the high value interval of the seasonal average diurnal variation in O3 concentrations in Guiyang, Zunyi, Anshun and Bijie were longer than that in other cities, and the higher the O3 maximum was, the longer its duration was. Also As shown in Figure 2, the daily variation in the O3 concentration was usually continuous. The change from high concentration to low concentration, or from low concentration to high concentration, was often a gradual process rather than a sudden change, which was consistent with prior study based on O3 concentrations in 338 cities from 1 January 2016, to 28 February 2019 in China at a city level (Yang et al., 2020).
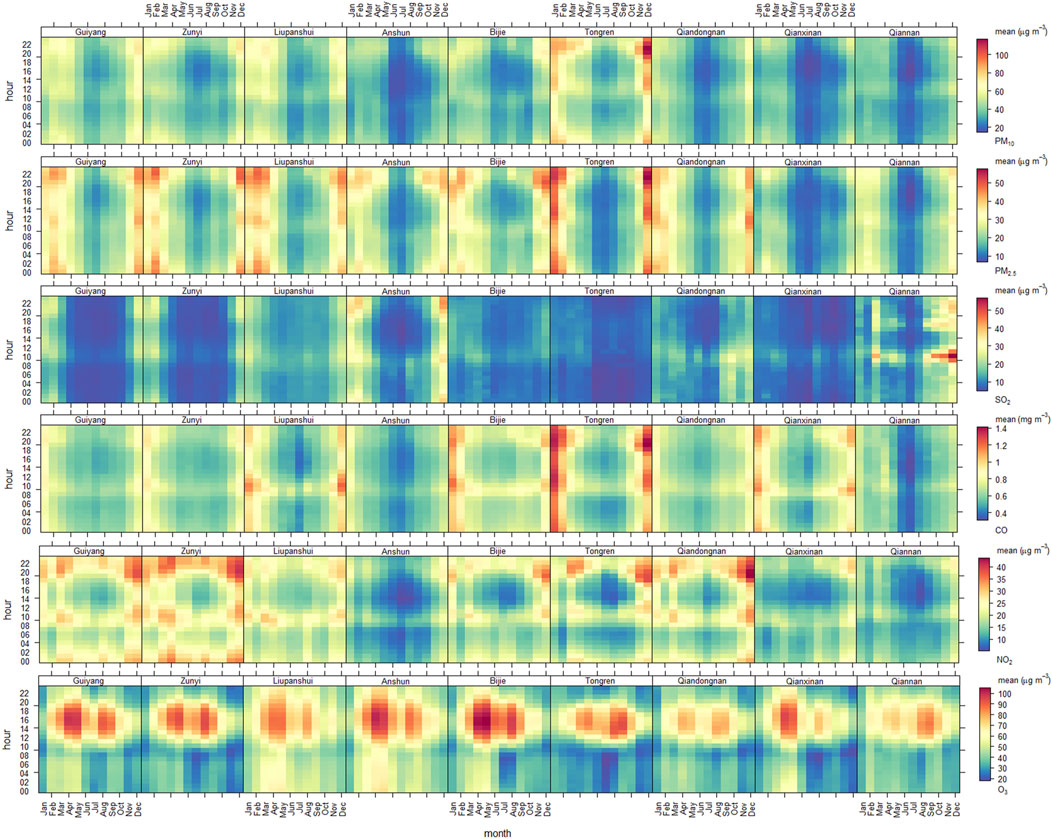
FIGURE 2. Monthly average diurnal cycles of criteria pollutants measured from 2016 to 2020 in Guiyang, Zunyi, Liupanshui, Anshun, Bijie, Tongren, Qiandongnan, Qianxinan and Qiannan.
Criteria pollutants concentrations usually exhibit different seasonality in different regions owing to the differences of chemical processes, evolution of emission sources and meteorological conditions. Figure 3 illustrates the seasonal variations of criteria pollutants measured from 2016 to 2020 in Guiyang, Zunyi, Liupanshui, Anshun, Bijie, Tongren, Qiandongnan, Qianxinan and Qiannan. The six criteria pollutants showed well-defined seasonal patterns but also some unique month-to-month variations in different year. Overall, for PM10, PM2.5, SO2, CO and NO2, seasonal patterns looked similar, with the highest levels appearing in winter and the lowest levels appearing in summer. In contrast with the PM10, PM2.5, SO2, CO and NO2, O3 concentrations showed a reverse seasonal pattern, with lower concentrations in winter and higher concentrations in late spring and early autumn in the nine major cities.
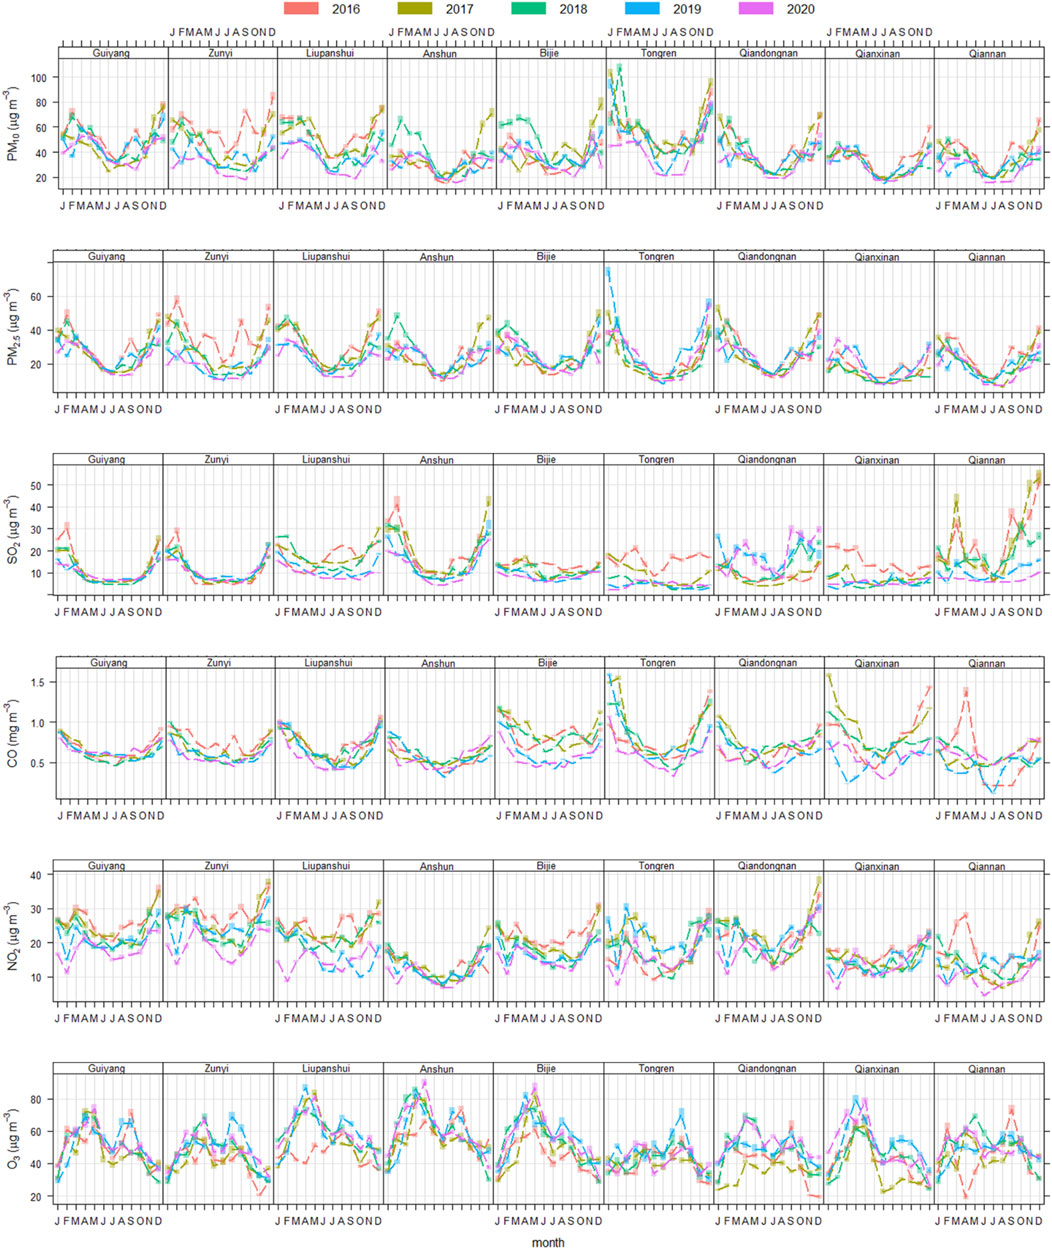
FIGURE 3. Seasonal variations of criteria pollutants measured from 2016 to 2020 in Guiyang, Zunyi, Liupanshui, Anshun, Bijie, Tongren, Qiandongnan, Qianxinan and Qiannan. The shading shows the 95 % confidence intervals of the average.
Both the PM10 and PM2.5 concentrations exhibited an overall well-defined seasonal pattern with a maximum in winter (November or February) and a minimum in summer in all central cities. The observed winter peaks of PM10 and PM2.5 can be attributed to the increased anthropogenic emissions related to enhanced power generation, industrial activities, fossil fuel burning for heating purposes (Li et al., 2017) and unfavourable meteorological conditions (Kong et al., 2021a). The observed summer valleys of PM10 and PM2.5 can be attributed to the low emission rate and intense mixing processes (Kong et al., 2021b). The SO2, CO and NO2 concentrations exhibited a profound seasonal cycle but also some unique month-to-month variation patterns in different city in different year. These seasonal variations of SO2, CO and NO2 have been studied by previous authors in the western Yangtze River Delta during August 2011-July 2012 (Ding et al., 2013a). These seasonal and month-to-month variation patterns could be due to the change of anthropogenic emissions and atmospheric conditions in different seasons and months. O3 showed a distinguished seasonal pattern, with two peaks in late spring and early autumn (a maximum in April or May and a secondary maximum in August or September) and a minimum in winter. Specifically, the highest O3 level in April or May appeared in Liupanshui, Anshun, Bijie and Qianxinan, and in August or September appeared in Tongren, while the two peaks in Guiyang, Zunyi, Qiandongnan and Qiannan were basically the same. The observed valleys of O3 in winter can be attributed to lower vertical mixing due to lower planetary boundary layer heights, stronger titration by NOx due to higher emissions related to heating and lower photochemical production due to lower temperature and solar radiation (Tang et al., 2012). The observed peaks of O3 in late spring and early autumn could be due to the large emissions of local and regional O3 precursor and related meteorological variables (Ding et al., 2008; Wang et al., 2008). Given that summer (June, July and August) had the highest temperature predicted by Gaussian process regression method (He et al., 2021), higher O3 concentrations were expected in this season. Therefore, the fact that the O3 concentration in summer was much lower than that in late spring and early autumn is of great interest. The observed seasonal behavior of O3 in the nine major cities in Guizhou was different from what has been reported in previous studies conducted in PRD region (China’s Air Ozone Pollution Prevention and Control Blue Book (2020): https://mp.weixin.qq.com/s/y9CJhur7v18aBhYcOTvgQA). For instance, a summer minimum of O3 was recorded at Hong Kong in southern China (Wang et al., 2009) and an early summer broad maximum was reported in Beijing (Lin et al., 2009; Lin et al., 2008). Available observations from either surface measurement at Lin’an (Xu et al., 2008) and satellite retrievals at Shanghai (Dufour et al., 2010) in the YRD region also suggested a later spring (May) maximum and early autumn (September) secondary maximum of O3, which was attributed to the summer minimum of O3 associated with the Asian summer monsoon that brings clean air masses from the Pacific during summer.
Air pollutants concentrations changed markedly and contrasting trends of all primary pollutants (PM10, PM2.5, SO2, CO and NO2) and secondary pollutant O3 concentrations were observed in Guizhou from 2016 to 2020 (Figure 4), which were decoupling from gross domestic product, population and vehicles growth (Supplementary Figure S9). For PM10, the average trends for the focus central cities were −1.58 μg·m−3 yr−1 (95% CI: -2.57∼-0.49) for Guiyang, −6.16 μg·m−3 yr−1 (95% CI: -7.37∼-4.68) for Zunyi, −5.41 μg·m−3 yr−1 (95% CI: -6.35∼-4.59) for Liupanshui, 0.11 μg·m−3 yr−1 (95% CI: -1.12∼1.11) for Anshun, −0.11 μg·m−3 yr−1 (95% CI: -1.85∼1.5) for Bijie, −4.54 μg·m−3 yr−1 (95% CI: -6.03∼-2.73) for Tongren, −1.82 μg·m−3 yr−1 (95% CI: -2.97∼-0.63) for Qiandongnan, −0.94 μg·m−3 yr−1 (95% CI: -1.51∼-0.38) for Qianxinan, and −2.81 μg·m−3 yr−1 (95% CI: -3.76∼-2.07) for Qiannan. The highest decrease in PM2.5 was observed in Zunyi, with a average value of −4.22 μg·m−3 yr−1 (95% CI: -5.21∼-3.12); the reductions in Guiyang, Liupanshui, qiandongnan and Qiannan were −0.99 μg·m−3 yr−1 (95% CI: -1.88∼-0.43), −2.53 μg·m−3 yr−1 (95% CI: -3.26∼-1.93), −0.74 μg·m−3 yr−1 (95% CI: -1.57∼0.11) and −1.69 μg·m−3 yr−1 (95% CI: -2.27∼-1.05), respectively; while upward trends occurred in Anshun, Bijie, Tongren and Qianxinan with the corresponding average trends being 0.57 μg·m−3 yr−1 (95% CI: -0.27∼1.17), 0.54 μg·m−3 yr−1 (95% CI: -0.34∼1.12), 0.91 μg·m−3 yr−1 (95% CI: -0.25∼2.2) and 0.52 μg·m−3 yr−1 (95% CI: -0.11∼1.36). The average trends of PM10 and PM2.5 for the focus central cities fell within the ranges reported for other Chinese cities and regions (Cai et al., 2017; Chu et al., 2020; Guo et al., 2019; Huang et al., 2018; Jiang et al., 2015; Silver et al., 2018; Wang et al., 2020a; Xu et al., 2020; Xue et al., 2019; Zhang et al., 2019a; Zheng et al., 2017). These results demonstrated that Guizhou government was successful in the reduction of particulate matter in central cities from 2016 to 2020, although its concentration has increased slightly in several cities. Although interannual meteorological variations could significantly alter PM10 and PM2.5 concentrations, the relative contribution of emission control and interannual meteorological variation to reductions in PM10 and PM2.5 concentrations revealed that the effects of meteorological conditions on the trends of PM10 and PM2.5 were relatively small (Ding et al., 2019b; Zhai et al., 2019; Zhang et al., 2019a; Zhang et al., 2019b), demonstrating that the improvement in PM10 and PM2.5 air quality was dominated by abatements in anthropogenic emissions. The control of anthropogenic emissions accounted for 78.6% of the decrease in PM2.5 concentrations in Beijing from 2013 to 2017, with the relative contribution of local and regional emission reduction being 53.7% and 24.9%, respectively (Chen et al., 2019b). The drivers of improved PM10 and PM2.5 air quality could be attributed to the strengthening industrial emission standards (power plants and emission-intensive industrial sectors), upgrading on industrial boilers, phasing out outdated industrial capacities, and promoting clean fuels in the residential sector (Zhang et al., 2019a; Zheng et al., 2018a).
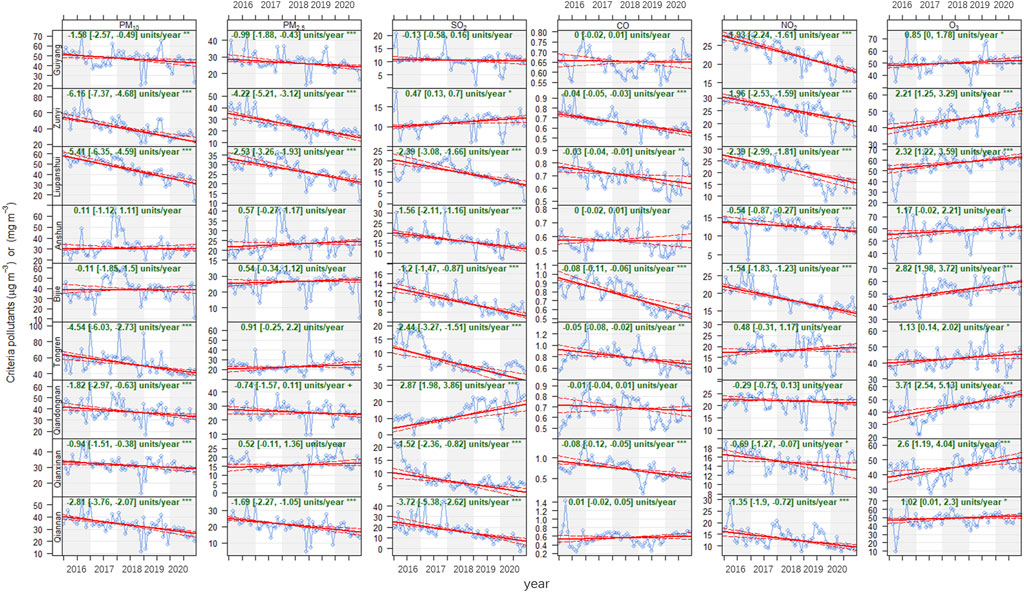
FIGURE 4. Trends of criteria pollutants measured from 2016 to 2020 in Guiyang, Zunyi, Liupanshui, Anshun, Bijie, Tongren, Qiandongnan, Qianxinan and Qiannan. The solid red line shows the trend estimate and the dashed red lines show the 95 % confidence intervals for the trend based on resampling methods. Note also that the symbols shown next to each trend estimate relate to how statistically significant the trend estimate is: p < 0.001 = ∗ ∗ ∗, p < 0.01 = ∗ ∗, p < 0.05 = ∗ and p < 0.1 = +.
The relative change rates of SO2 in the focus central cities during 2016–2020 were −0.13 μg·m−3 yr−1 (95% CI: -0.58∼0.16) for Guiyang, 0.47 μg·m−3 yr−1 (95% CI: 0.13∼0.7) for Zunyi, −2.39 μg·m−3 yr−1 (95% CI: -3.08∼-1.66) for Liupanshui, −1.56 μg·m−3 yr−1 (95% CI: -2.11∼-1.16) for Anshun, −1.2 μg·m−3 yr−1 (95% CI: -1.47∼-0.87) for Bijie, −2.44 μg·m−3 yr−1 (95% CI: -3.27∼-1.51) for Tongren, 2.87 μg·m−3 yr−1 (95% CI: 1.98∼3.86) for Qiandongnan, −1.52 μg·m−3 yr−1 (95% CI: -2.36∼-0.82) for Qianxinan, and −3.72 μg·m−3 yr−1 (95% CI: -5.38∼-2.62) for Qiannan. The SO2 concentration substantially increased in Qiandongnan should gaine growing attention and emphasis. SO2 emissions are mainly from coal combustion in power plant and residential heating (Lu et al., 2010; Vu et al., 2019b; Zheng et al., 2018a), hence the negative trends of SO2 in most central cities in Guizhou should be driven by the decreased emissions of these factors. During the 11th-13th Five-Year Plans (FYPs) and APPCAP the Chinese government set strict emissions reduction measures including the installation of flue-gas desulfurization (FGD) and selective catalytic reduction systems, construction of large units, decommissioning of small units, and replacement of coal with cleaner energies (Kong et al., 2021b; Li et al., 2017; Liu et al., 2015b; Sun et al., 2018; Zheng et al., 2018a), resulting in SO2 anthropogenic emissions in China decreased by 10% from 2005 to 2010 (Sun et al., 2018), 62% during 2010–2017 (Zheng et al., 2018b), 59% during 2013–2017 (Zheng et al., 2018b) and 6.2 μg·m−3 yr−1 during 2013–2018 (Kong et al., 2021b). The CO concentration in the focus central cities in Guizhou during 2016–2020 were estimated to have decreased with the rate of around −0.04 mg·m−3 yr−1 (95% CI: -0.05∼-0.03) for Zunyi, −0.03 mg·m−3 yr−1 (95% CI: -0.04∼-0.01) for Liupanshui, −0.08 mg·m−3 yr−1 (95% CI: -0.11∼-0.06) for Bijie, −0.05 mg·m−3 yr−1 (95% CI: -0.08∼-0.02) for Tongren, −0.01 mg·m−3 yr−1 (95% CI: -0.04∼0.01) for Qiandongnan and −0.08 mg·m−3 yr−1 (95% CI: -0.12∼-0.05) for Qianxinan, whereas CO concentration in Guiyang, Anshun and Qiannan changed little, with the corresponding change rates being 0.0 mg·m−3 yr−1 (95% CI: -0.02∼0.01), 0.0 mg·m−3 yr−1 (95% CI: -0.02∼0.01) and 0.01 mg·m−3 yr−1 (95% CI: -0.02∼0.05). The negative trends of CO concentration have also been observed in BTH, YRD and PRD using long-term comprehensive data sets from 2013 to 2017, the corresponding percentage of the decrease being 21%, 12% and 12% (Wang et al., 2020a). According to the estimates using a combination of bottom-up emission inventory and index decomposition analysis approaches, during 2010–2017, the relative change rates of China’s anthropogenic emission of CO decreased by 27% (Zheng et al., 2018a). Such negative trends have also been observed in satellite measurements, such as MOPITT observations (Zheng et al., 2018b), which are mainly attributed to the reduced anthropogenic emissions in China, as suggested by both bottom-up and top-down methods (Zheng et al., 2019b). Incomplete combustion of coal, biomass, and gasoline are recognized as the major CO emissions sources (Sun et al., 2018), hence these factors should be the main drivers of CO reduction. Between 2016 and 2020, observed average NO2 levels in the focus central cities decreased by −1.93 μg·m−3 yr−1 (95% CI: -2.24∼-1.61) for Guiyang, −1.96 μg·m−3 yr−1 (95% CI: -2.53∼-1.59) for Zunyi, −2.39 μg·m−3 yr−1 (95% CI: -2.99∼-1.81) for Liupanshui, −0.54 μg·m−3 yr−1 (95% CI: -0.87∼-0.27) for Anshun, −1.54 μg·m−3 yr−1 (95% CI: -1.83∼-1.23) for Bijie, 0.48 μg·m−3 yr−1 (95% CI: -0.31∼1.17) for Tongren, −0.29 μg·m−3 yr−1 (95% CI: -0.75∼0.13) for Qiandongnan, −0.69 μg·m−3 yr−1 (95% CI: -1.27∼-0.07) for Qianxinan, and −1.35 μg·m−3 yr−1 (95% CI: -1.9∼-0.72) for Qiannan. These decreases were comparable to the reductions reported by (Chu et al., 2020), who used the data from the China National Environmental Monitoring Center (CNEMC) and observations at more rural sites. From 2013 to 2020, with the implementation of the APPCAP and Action Plan in China, significant declines in NO2 concentrations occurred nationwide. For instance, compared to levels in 2013, the concentration of NO2 in 2018 decreased by 19% (Chu et al., 2020), and from 2017 to 2020, decreased by 17% (Li et al., 2021a). The reduced emissions of fossil fuel combustion, on-road vehicles, biomass burning, and non-road mobile sources may be responsible for the reductions of NO2 (Sun et al., 2018; Zheng et al., 2018b).
The O3 concentration exhibited the opposite trend to that exhibited by the other air pollutants, which revealed significant positive trends in the focus central cities, indicating enhanced photochemical pollution in Guizhou. The highest increase in O3 was observed in Qiandongnan, with a average value of 3.71 μg·m−3 yr−1 (95% CI: 2.54∼5.13), followed by 2.82 μg·m−3 yr−1 (95% CI: 1.98∼3.72) for Bijie, 2.6 μg·m−3 yr−1 (95% CI: 1.19∼4.04) for Qianxinan, 2.32 μg·m−3 yr−1 (95% CI: 1.22∼3.59) for Liupanshui, 2.21 μg·m−3 yr−1 (95% CI: 1.25∼3.29) for Zunyi, 1.17 μg·m−3 yr−1 (95% CI: -0.02∼2.21) for Anshun, 1.13 μg·m−3 yr−1 (95% CI: 0.14∼2.02) for Tongren and 1.02 μg·m−3 yr−1 (95% CI: 0.01∼2.3) for Qiannan, while the lowest increase occurred in Guiyang with a average value of 0.85 μg·m−3 yr−1 (95% CI: 0∼1.78). The increase rate of O3 in most focus central cities in Guizhou was comparable to the Chinese average of 2.1 μg·m−3 yr−1 from 2013 to 2018 (Chu et al., 2020). The increasing O3 levels have been found in many locations in China. For instance, a 6-year-long high-resolution Chinese air quality reanalysis (CAQRA) dataset obtained from the assimilation of surface observations from the CNEMC revealed significant positive trends in NCP, northeast, southeast, northwest, southwest and central regions, ranging from 2.3 to 5.4 μg·m−3 yr−1 (Kong et al., 2021a). The multiple analytical approaches also unveiled that O3 had increased by 20.86%, 14.05% and 12.64% in North, Central and South regions during 2015–2018 (Kalsoom et al., 2021). Using an observation-based box 15 model (OBM) coupled with CB05 mechanism (Wang et al., 2017c), found that both monthly-averaged O3 and monthly maximum O3 increased with a rate of 0.56 ± 0.01 ppbv yr-1 (p <0.01) and 1.92 ± 0.15 ppbv yr-1 (p <0.05), respectively. At the national scale, significant increases in O3 concentrations occurred. For instance, taking advantage of CNEMC, observations and Tropospheric Ozone Assessment Report (TOAR) dataset (Chu et al., 2020), found that the O3 concentration increased 17% from 2013 to 2018 and (Lu et al., 2020) revealed that O3 levels at the 5th, 50th, and 95th percentiles increase at, respectively, 0.4 (7%), 1.7 (7%), 2.8 (4%) ppb year-1 (all with p <0.05) averaged over CNEMC network based on the linear trend estimate. The maximum 8-hour-average 90-percentile (MDA8-90) O3 concentration is suggested by MEE of China to characterize the statistic potential damage of O3. Supplementary Figure S10 shows that the MDA8-90 O3 measured from 2016 to 2020 in Guiyang, Zunyi, Liupanshui, Anshun, Bijie, Tongren, Qiandongnan, Qianxinan and Qiannan increased by −0.43 μg·m−3 yr−1 (95% CI: -2.26∼2.02), 2.96 μg·m−3 yr−1 (95% CI: 0.7∼6.05), 4 μg·m−3 yr−1 (95% CI: 1.99∼6.55), 0.48 μg·m−3 yr−1 (95% CI: -2.45∼3.53), 1.74 μg·m−3 yr−1 (95% CI: 0.07∼3.68), 1.71 μg·m−3 yr−1 (95% CI: -0.88∼5.45), 0.69 μg·m−3 yr−1 (95% CI: -1.25∼2.68), 4.65 μg·m−3 yr−1 (95% CI: 2.33∼6.9), and 0.04 μg·m−3 yr−1 (95% CI: -2.41∼2.97), respectively. The most significant increase of MDA8-90 O3 occurred in Qianxinan, Liupanshui and Zunyi, which were even faster in some Chinese cities compared with the urban MDA8-90 O3 trends in any other region worldwide reported in TOAR (Lu et al., 2020), suggesting these localities should further do solid efforts in the prevention and control of O3 pollution. The MDA8-90 O3 levelled off in Qianan during 2016–2020, while decreasing MDA8-90 O3 in Guiyang, confirming the effectiveness of emergency control measures for O3 pollution in Guiyang. It can be also found from comparisons with O3 concentrations that the increase rates of MDA8-90 O3 higher than that O3 in Zunyi, Liupanshui, Tongren and Qianxinan that required our urgent attention, while the opposite was true for the other focus central cities. The O3 increases could partially be explained by the following aspects. Anthropogenic emission reductions, particularly PM2.5 and NOx reductions, could lead to O3 increases. The decrease of PM2.5 can slow down the aerosol sink of hydroperoxy (HO2) radicals and thus enhanced O3 concentration (Li et al., 2019a). Simulations using GEOS-Chem model indicated that a more important factor for the increase in summer O3 in the NCP was the reduction in summer PM2.5 concentration by about 40% over the 2013–2017 period (Li et al., 2019b). Decreasing PM2.5 concentrations can increase solar radiation, especially ultraviolet radiation, which could photolysis more NO2 into NO, and consequently, increase O3 production (Wang et al., 2020b). Based on the synchronous monitoring of PM2.5 and broadband solar radiation (Hu et al., 2017), found that the solar radiation intensity increased by 1.93 W−2 per year between 2005 and 2015 in Beijing, while the PM2.5 concentration showed a decreasing trend. Elevated PM2.5 may suppress mixing layer height (Wilcox et al., 2016), demoting the vertical diffusion of O3 precursors, and PM2.5 may affect cloud formation (Koren et al., 2004; Koren et al., 2008) and cloud radiative properties (Zamora et al., 2016; Zheng et al., 2018a), affecting photolysis rates and temperature, and hence facilitating O3 production chemistry. Reductions in anthropogenic NOx would enhance O3 in urban areas where O3 production is expected to be NOx-saturated (Li et al., 2019a; Lu et al., 2019a; Wang et al., 2021) due to a decrease of the titration effect of NO. High daytime nitrous acid concentrations, which as an important source of OH radicals in the atmosphere, may to some extent enhance the photochemical production of O3, particularly during late spring and early fall (Tie et al., 2019). In addition, interannual meteorological conditions had a significant influence on the annual variability in O3 concentrations (Han et al., 2020; Ma et al., 2019a; Yang et al., 2019), and O3 can increase as much as 8.1 ppbv due to meteorology (Zhang et al., 2021), which can be attributed to increasing temperature and increasing solar radiation (Ding et al., 2019a; Ma et al., 2021; Wang et al., 2020b; Zhang et al., 2021b). Factors contributing to the O3 enhancements in 2017 compared to 2016 over China were the higher background O3 driven by hotter and drier weather conditions rather than anthropogenic emission change (Lu et al., 2018), highlighting strong effects of meteorological variations on the interannual variability of surface O3 over China.
Supplementary Figures S11–S16 display the trends of six criteria pollutants in four seasons in the focus central cities. Overall, decreasing PM10, PM2.5, SO2, CO and NO2 occurred in four seasons, despite the upward trend in a certain city at some season. The highest decrease of PM10, PM2.5, SO2, CO and NO2 occurred in fall or winter, with the corresponding maximum being −7.77 μg·m−3 yr−1 (95% CI: -9.39∼-6.67), −5.73 μg·m−3 yr−1 (95% CI: -6.62∼-5.05), −8.12 μg·m−3 yr−1 (95% CI: -8.8∼-7.5), −0.11 mg·m−3 yr−1 (95% CI: -0.13∼-0.1), and −3.04 μg·m−3 yr−1 (95% CI: -3.67∼-2.5), which appeared in Liupanshui, Zunyi, Qiannan, Qianxinan and Guiyang, respectively. These results confirmed the effectiveness of air pollution prevention and control in fall and winter. However, O3 concentrations showed increasing trends in four seasons in the focus central cities, revealing rapid broadening of the O3 pollution season in Guizhou. The extension of the O3 pollution season into winter-spring was also observed not only for the North China Plain but across China (Li et al., 2021a), which were attributable to the rapid photochemical production of O3, driven by HOx radicals from carbonyl photolysis, and increasing background O3 in cold seasons. The highest increase of O3 and MDA8-90 O3 occurred in spring or summer, with the corresponding maximum being 5.87 μg·m−3 yr−1 (95% CI: 5.86∼5.87) and 10.26 μg·m−3 yr−1 (95% CI: 8.6∼11.77), which appeared in Qianxinan (Supplementary Figure S17). In general, in contrast to its initial focus on control actions in O3 pollution season (April-September), the prevention and control of O3 pollution should extend to four seasons through extensive coordination at the regional level.
The correlations between air pollutants can yield quiet a few rewarding information about the related mechanisms/processes and how they change over time in different regions (Chu et al., 2020; Ding et al., 2013a; Guo et al., 2019; Othman and Latif, 2021; Wang et al., 2014a). The relationships between air pollutants in the nine major cities in Guizhou during the period of study are illustrated in Figure 5. Overall, strong correlations were observed between PM10 and PM2.5 for all focus central cities with r = 0.92 for Guiyang, r = 0.92 for Zunyi, r = 0.95 for Liupanshui, r = 0.96 for Anshun, r = 0.94 for Bijie, r = 0.8 for Tongren, r = 0.96 for Qiandongnan, r = 0.81 for Qianxinan and r = 0.91 for Qiannan, suggesting that PM2.5 accounted for a large fraction of PM10 (Wang et al., 2017d). O3 was weakly to moderately anti-correlated with other gaseous pollutants, which was is partially the result of O3 depletion during the oxidation of NO to NO2 (Wang et al., 2014b). Weak positive correlations (0 < r ≤ 0.47) were observed between O3 and PM10 as well as PM2.5, indicating the simultaneous formation of secondary O3 and particulate matter by photochemical reactions under favorable weather conditions. Discriminating correlations between PM2.5 and primary gaseous pollutants were observed in Guiyang, Zunyi and Anshun. Pleasurable relationships between PM2.5 and CO were observed because almost all combustion sources contribute CO and most gaseous precursors of PM2.5, such as NOx and SO2 (Chu et al., 2020). The positive correlations between PM2.5 and SO2, with r = 0.55 for Guiyang, r = 0.42 for Zunyi, r = 0.3 for Liupanshui, r = 0.46 for Anshun, r = 0.28 for Bijie, r = 0.19 for Qiandongnan, r = 0.19 for Qianxinan and r = 0.25 for Qiannan, indicated that coal burning is an important source of PM2.5 (Yang et al., 2011), particularly in Guiyang, Zunyi and Anshun. The favorable relationship between PM2.5 and NO2, with r = 0.43 for Guiyang, r = 0.42 for Zunyi, r = 0.27 for Liupanshui, r = 0.53 for Anshun, r = 0.42 for Bijie, r = 0.23 for Tongren, r = 0.39 for Qiandongnan, r = 0.25 for Qianxinan and r = 0.48 for Qiannan, implied that vehicle emissions are another important source of PM2.5 (Chu et al., 2020), particularly in Guiyang, Zunyi and Anshun, Bijie and Qiannan. The lower correlation between PM2.5 and NO2 than that between PM2.5 and SO2 occurred in Guiyang and Liupanshui, indicating a relative higher contribution of SO2 emission to PM2.5 in these in these two cities. The higher correlation between PM2.5 and NO2 than that between PM2.5 and SO2 occurred in Anshun, Bijie, Tongren, Qiandongnan, Qianxinan and Qiannan, accounting for about 67% of the total focus central cities, which may be resulted from the slower reduction of NOx than SO2 in the past decade in Guizhou, highlighting regulation of NOx emissions is pressing for mitigating PM2.5 pollution in Guizhou. Field and laboratory studies indicated NO2 can enhance atmospheric oxidation capacity, hence contributing secondary PM2.5 production (Cheng et al., 2016; Chu et al., 2019; He et al., 2014; Russell et al., 1988). Aerosol pollution in the NCP gradually changed from sulfate-driven to nitrate-driven was observed based on intensive field observations and model simulations (Huang et al., 2021; Li et al., 2019b; Li et al., 2021c; Wen et al., 2018). High concentrations of NOx, as a catalyst or an oxidants, can promote the heterogeneous reaction of SO2 with NO2, particularly under NH3-rich conditions (Chu et al., 2020; He et al., 2014; Ma et al., 2018; Wang et al., 2016; Xue et al., 2016; Zhang et al., 2021a). These heterogeneous processes and aqueous reactions further indicated that NO2 played an vital role in enhancing the secondary PM2.5 production and explained why PM2.5 concentrations were highly related to changes in NO2 than in SO2 in most central cities in Guizhou, highlighting the urgency for curbing NOx to further mitigate PM2.5 pollution in Guizhou.
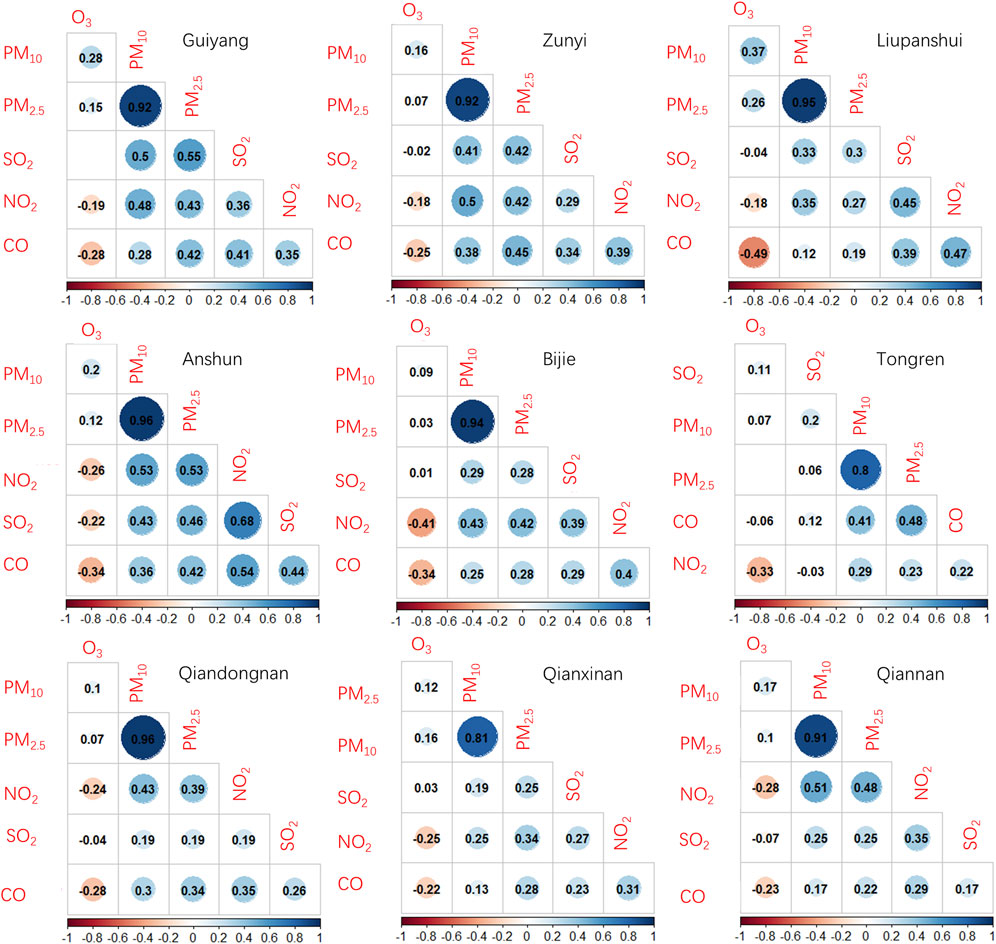
FIGURE 5. The matrix of Pearson correlation coefficients between air pollutants in Guiyang, Zunyi, Liupanshui, Anshun, Bijie, Tongren, Qiandongnan, Qianxinan and Qiannan. Leave blank on no significant coefficient.
In general, as shown in Supplementary Figures S18–S20, the correlation between PM2.5 and NO2/SO2 were higher in the winter and autumn seasons with lower correlation coefficient between PM2.5 and SO2 than that between PM2.5 and NO2, indicating the presence of NOx-related secondary PM2.5 production in the winter and autumn seasons. Generally, higher correlation between PM2.5 and O3 were observed in winter in the focus central cities, except in Liupanshui where the highest value occurred in spring. Speculatively, one reason of this phenomenon is that there is strong O3 photochemical production due to carbonyl photolysis and photodissociation of nitrous acid in these seasons (Edwards et al., 2014; Li et al., 2021a; Schnell et al., 2009; Tie et al., 2019). A comprehensive observations of atmospheric radicals and relevant parameters during several haze events in winter 2016 Beijing revealed surprisingly high hydroxyl radical oxidation rates up to 15 ppbv·h−1 facilitating the production of secondary pollutants, which was is mainly initiated by the photolysis of nitrous acid and ozonolysis of olefins and maintained by an extremely efficiently radical cycling process driven by nitric oxide (Lu et al., 2019b). There was also often strong O3 photochemical production due to the photodissociation of nitrous acid, causing a copresence of high PM2.5 and O3 concentrations during late spring in eastern China (Tie et al., 2019).
Research on spatiotemporal variations and trends of criteria air pollutants can help policymakers develop strategies and policies for emission reductions and track the progress of those policies. Our study quantified the spatiotemporal variations and trends of criteria air pollutants in nine central cities in Guizhou based on datasets obtained from Guizhou Provincial Environmental Monitoring Central Station network. Our results showed that the dramatic reductions in PM10, PM2.5, SO2, CO and NO2, indicating the remarkable air quality improvements in Guizhou. Our results confirmed that driven by a series of active explorations and practices, the air quality in Guizhou has continued to improve steadily. However, the annual mean concentration of PM2.5 is still substantially higher than China’s national ambient air quality standard (NAAQS-I) of 15 μg·m−3 and the WHO guideline of 10 μg·m−3. VOCs, SO2, NOx, and NH3 are key precursors of secondary PM2.5 (Gu et al., 2021; Li et al., 2016; Liu et al., 2013; Yang et al., 2009). VOCs, including volatile chemical products (VCPs), which are responsible for half of the petrochemical VOCs emitted in major urban areas (McDonald et al., 2018; Coggon et al., 2021), can produce amounts of the photochemical organic PM2.5. In addition, the latest study showed that abating NH3 is more cost-effective than NOx for mitigating PM2.5 air pollution (Gu et al., 2021). Both VOCs and NH3 are derived from a wealth of sources, with a lack of effective control measures, and the lower correlation between PM2.5 and NO2 than that between PM2.5 and SO2. Therefore, we suggest that a reduction of NOx emissions is currently urgent for further reducing PM2.5 pollution in Guizhou. However, further mitigating PM2.5 pollution in the future because of the benefit for public health, tailored control measures for VOCs and NH3 emissions should be put on the agenda.
Our results showed an increasing trend of O3 concentrations and an extension of the O3 pollution season, hence curbing O3 concentrations has become the focus of Guizhou’s next air quality control strategies. Both ground measurements and simulations indicated that decreasing PM2.5 and NOx emissions can increase O3 in urban areas where O3 production is expected to be VOC-limited, calling for decreasing NOx and VOC emissions to overcome that effect (Li et al., 2019a; Li et al., 2019b). In addition, the photodissociation of nitrous acid (Lu et al., 2019c; Tie et al., 2019), carbonyl photolysis (Edwards et al., 2014; Li et al., 2021a), increasing background O3 (Li et al., 2021b) and meteorological conditions (Han et al., 2020; Ma et al., 2019b; Yang et al., 2019) could also contribute to the increase in surface O3 pollution. Therefore, curbing O3 pollution in Guizhou will require comprehensive measurements, and the focus should be redesigned to mitigate multiple precursors from multiple sectors through extensive coordination at the regional or national level, instead of its initial focus on control actions for a single pollutant or in a single sector. Meanwhile, efficient control strategies to mitigate cold season O3 pollution in Guizhou may require measures similar as implemented to avoid O3 pollution in warm season in pursuit of cleaner air.
Based on the extensive network data available since 2016, we analyzed the spatiotemporal variations and trends of air quality in the nine major cities in Guizhou during 2016–2020 for the first time to the best of our knowledge. The provincewide 5-year PM10, PM2.5, SO2, CO, NO2 and O3 were 38.8 μg·m−3 (95% CI 37.4∼41.2), 23.3 μg·m−3 (95% CI: 22.5∼24.2), 10.5 μg·m−3 (95% CI: 9.6∼11.3), 0.7 mg·m−3 (95% CI: 0.6∼0.7), 13.2 μg·m−3 (95% CI: 13.1∼14.2) and 47.2 μg·m−3 (95% CI: 45.8∼48.6), respectively, with corresponding maxima occurred in Tongren, Liupanshui, Qianan, Bijie, Zunyi and Anshun. PM10, PM2.5, SO2, CO and NO2 exhibited similar spatiotemporal variation with nighttime and wintertime peaks, and the polluted areas had shrunk, wihle O3 presented distinguished diurnal and seasonal pattern with an afternoon maximum and two peaks in late spring and early autumn, and the polluted areas had expanded. The annual mean concentrations of PM10, PM2.5, SO2, CO and NO2 all decreased year by year during 2016–2020 with the corresponding rate rangs being −6.16 μg·m−3 yr−1 (95% CI: -7.37∼-4.68) - 0.11 μg·m−3 yr−1 (95% CI: -1.12∼1.11), −4.22 μg·m−3 yr−1 (95% CI: -5.21∼-3.12)- 0.91 μg·m−3 yr−1 (95% CI: -0.25∼2.2), −3.72 μg·m−3 yr−1 (95% CI: -5.38∼-2.62)- 2.87 μg·m−3 yr−1 (95% CI: 1.98∼3.86), −0.08 mg·m−3 yr−1 (95% CI: -0.11∼-0.06)- 0.01 mg·m−3 yr−1 (95% CI: -0.02∼0.05) and −2.39 μg·m−3 yr−1 (95% CI: -2.99∼-1.81) −0.48 μg·m−3 yr−1 (95% CI: -0.31∼1.17), and the highest decrease occurred in fall or winter. In contrast with the PM10, PM2.5, SO2, CO and NO2, O3 concentrations increased year by year, with increase rates ranged from 0.85 μg·m−3 yr−1 (95% CI: 0∼1.78) to 3.71 μg·m−3 yr−1 (95% CI: 2.54∼5.13), and the highest increase occurred in spring or summer. The correlations among the six criteria pollutants indicated the PM2.5-NO2 correlation coefficients were higher than those of PM2.5-SO2, hence a priority to control NOx to further reduce PM2.5 pollution in Guizhou. However, tailored control measures for VOCs and NH3 emissions should be put on the agenda in order to continuously improve PM2.5 air quality in the future because of the benefit for public health. Comprehensive measurements, including carbonyls and nitrous acid, and the focus redesigned to mitigate multiple precursors from multiple sectors are indispensable for curbing O3 pollution.
This study can provide a theoretical basis for the formulation of future air-pollution control policy in Guizhou. Importantly, Guizhou urgently needs to conduct observation of multiple pollutants, formulate O3 control policies, and setting up cost-effective measures to mitigate both PM2.5 and O3. Cleaning up city air will require simultaneous tracking of all air pollutants relevant to health and their feedbacks and interactions. We need to understand how the mixture and its toxicity changes as air quality measures are implemented. Therefore, in the future, we will estimate the drivers of the contrasting trends of PM2.5 and surface O3 air quality, and the associated health benefits in Guizhou, and also quantify the effectiveness of Guizhou’s action plan by decoupling the impact of meteorology on ambient air quality.
The original contributions presented in the study are included in the article/Supplementary Material, further inquiries can be directed to the corresponding author.
FL: Data curation, Formal Analysis, Investigation, Methodology, Software, Visualization, Writing–original draft. YY: Conceptualization, Funding acquisition, Project administration, Supervision, Validation, Writing–review and editing. FH: Software, Visualization, Writing–review and editing. LH: Software, Visualization, Writing–review and editing.
This research has been supported by the Guizhou Province Science and Technology Plan Project “Research and demonstration of ozone formation mechanism and control policies in Bijie Pilot Zone [Qianke joint support (2021) general 498],” and the Science and Technology Planned Project in Guizhou Province [Qian Kehe Foundation (2020)1Y175].
All referenced supplemental figures and tables can be found in the supporting information. The authors are grateful to all staff and workers from Guizhou Provincial Environmental Monitoring Central Station network for maintaining the instruments used in the current study.
The authors declare that the research was conducted in the absence of any commercial or financial relationships that could be construed as a potential conflict of interest.
All claims expressed in this article are solely those of the authors and do not necessarily represent those of their affiliated organizations, or those of the publisher, the editors and the reviewers. Any product that may be evaluated in this article, or claim that may be made by its manufacturer, is not guaranteed or endorsed by the publisher.
The Supplementary Material for this article can be found online at: https://www.frontiersin.org/articles/10.3389/fenvs.2023.1254390/full#supplementary-material
Bai, K., Li, K., Wu, C., Chang, N. B., and Guo, J. (2020). A homogenized daily in situ PM&lt;sub&gt;2.5&lt;/sub&gt; concentration dataset from the national air quality monitoring network in China. Earth Syst. Sci. Data 12 (4), 3067–3080. doi:10.5194/essd-12-3067-2020
Bian, Y., Huang, Z., Ou, J., Zhong, Z., Xu, Y., Zhang, Z., et al. (2019). Evolution of anthropogenic air pollutant emissions in Guangdong Province, China, from 2006 to 2015. Atmos. Chem. Phys. 19 (18), 11701–11719. doi:10.5194/acp-19-11701-2019
Burnett, R., Chen, H., Szyszkowicz, M., Fann, N., Hubbell, B., PopeSpadaro, C. A. J. V., et al. (2018). Global estimates of mortality associated with long-term exposure to outdoor fine particulate matter. Proc. Natl. Acad. Sci. U. S. A. 115 (38), 9592–9597. doi:10.1073/pnas.1803222115
Cai, S., Wang, Y., Zhao, B., Wang, S., Chang, X., and Hao, J. (2017). The impact of the “air pollution prevention and control action plan” on PM2.5 concentrations in jing-jin-ji region during 2012–2020. Sci. Total Environ. 580, 197–209. doi:10.1016/j.scitotenv.2016.11.188
Carslaw, D. C., and Ropkins, K. (2012). Openair — an R package for air quality data analysis. Environ. Model. Softw. 27-28, 52–61. doi:10.1016/j.envsoft.2011.09.008
Chen, Z., Chen, D., Kwan, M.-P., Chen, B., Gao, B., Zhuang, Y., et al. (2019a). The control of anthropogenic emissions contributed to 80 % of the decrease in PM&lt;sub&gt;2.5&lt;/sub&gt; concentrations in Beijing from 2013 to 2017. Atmos. Chem. Phys. 19 (21), 13519–13533. doi:10.5194/acp-19-13519-2019
Chen, Z., Chen, D., Wen, W., Zhuang, Y., Kwan, M.-P., Chen, B., et al. (2019b). Evaluating the “2+26” regional strategy for air quality improvement during two air pollution alerts in Beijing: variations in PM&lt;sub&gt;2.5&lt;/sub&gt; concentrations, source apportionment, and the relative contribution of local emission and regional transport. Atmos. Chem. Phys. 19 (10), 6879–6891. doi:10.5194/acp-19-6879-2019
Cheng, Y., Zheng, G., Wei, C., Mu, Q., Zheng, B., Wang, Z., et al. (2016). Reactive nitrogen chemistry in aerosol water as a source of sulfate during haze events in China. Sci. Adv. 2 (12), e1601530. doi:10.1126/sciadv.1601530
Chu, B., Ma, Q., Liu, J., Ma, J., Zhang, P., Chen, T., et al. (2020). Air pollutant correlations in China: Secondary air pollutant responses to NOx and SO2 control. Environ. Sci. Technol. Lett. 7 (10), 695–700. doi:10.1021/acs.estlett.0c00403
Chu, B., Wang, Y., Yang, W., Ma, J., Ma, Q., Zhang, P., et al. (2019). Effects of NO&lt;sub&gt;2&lt;/sub&gt; and C&lt;sub&gt;3&lt;/sub&gt;H&lt;sub&gt;6&lt;/sub&gt; on the heterogeneous oxidation of SO&lt;sub&gt;2&lt;/sub&gt; on TiO&lt;sub&gt;2&lt;/sub&gt; in the presence or absence of UV–Vis irradiation. Atmos. Chem. Phys. 19 (23), 14777–14790. doi:10.5194/acp-19-14777-2019
Coggon, M. M., Gkatzelis, G. I., McDonald, B. C., Gilman, J. B., Schwantes, R. H., Abuhassan, N., et al. (2021). Volatile chemical product emissions enhance ozone and modulate urban chemistry. Proc. Natl. Acad. Sci. 118 (32), e2026653118. doi:10.1073/pnas.2026653118
Ding, A. J., Fu, C. B., Yang, X. Q., Sun, J. N., Zheng, L. F., Xie, Y. N., et al. (2013a). Ozone and fine particle in the western Yangtze River Delta: An overview of 1 yr data at the SORPES station. Atmos. Chem. Phys. 13 (11), 5813–5830. doi:10.5194/acp-13-5813-2013
Ding, A. J., Fu, C. B., Yang, X. Q., Sun, J. N., Zheng, L. F., Xie, Y. N., et al. (2013b). Ozone and fine particle in the western Yangtze River Delta: An overview of 1 yr data at the SORPES station. Atmos. Chem. Phys. 13 (11), 5813–5830. doi:10.5194/acp-13-5813-2013
Ding, A. J., Wang, T., Thouret, V., Cammas, J. P., and Nédélec, P. (2008). Tropospheric ozone climatology over Beijing: analysis of aircraft data from the MOZAIC program. Atmos. Chem. Phys. 8 (1), 1–13. doi:10.5194/acp-8-1-2008
Ding, D., Xing, J., Wang, S., Chang, X., and Hao, J. (2019a). Impacts of emissions and meteorological changes on China's ozone pollution in the warm seasons of 2013 and 2017. Front. Environ. Sci. Eng. 13 (5), 76. doi:10.1007/s11783-019-1160-1
Ding, D., Xing, J., Wang, S., Liu, K., and Hao, J. (2019b). Estimated contributions of emissions controls, meteorological factors, population growth, and changes in baseline mortality to reductions in ambient [formula: See text] and [formula: See text]-related mortality in China, 2013-2017. Environ. Health Perspect. 127 (6), 067009. doi:10.1289/EHP4157
Dufour, G., Eremenko, M., Orphal, J., and Flaud, J. M. (2010). IASI observations of seasonal and day-to-day variations of tropospheric ozone over three highly populated areas of China: Beijing, Shanghai, and Hong Kong. Atmos. Chem. Phys. 10 (8), 3787–3801. doi:10.5194/acp-10-3787-2010
Edwards, P. M., Brown, S. S., Roberts, J. M., Ahmadov, R., Banta, R. M., deGouw, J. A., et al. (2014). High winter ozone pollution from carbonyl photolysis in an oil and gas basin. Nature 514 (7522), 351–354. doi:10.1038/nature13767
Feng, Y., Ning, M., Lei, Y., Sun, Y., Liu, W., and Wang, J. (2019). Defending blue sky in China: Effectiveness of the “air pollution prevention and control action plan” on air quality improvements from 2013 to 2017. J. Environ. Manag. 252, 109603. doi:10.1016/j.jenvman.2019.109603
Gu, B., Zhang, L., Dingenen, R. V., Vieno, M., Grinsven, H. J. V., Zhang, X., et al. (2021). Abating ammonia is more cost-effective than nitrogen oxides for mitigating PM2.5 air pollution. Science 374 (6568), 758–762. doi:10.1126/science.abf8623
Guo, H., Gu, X., Ma, G., Shi, S., Wang, W., Zuo, X., et al. (2019). Spatial and temporal variations of air quality and six air pollutants in China during 2015-2017. Sci. Rep. 9 (1), 15201. doi:10.1038/s41598-019-50655-6
Guo, H., Ling, Z. H., Cheng, H. R., Simpson, I. J., Lyu, X. P., Wang, X. M., et al. (2017). Tropospheric volatile organic compounds in China. Sci. Total Environ. 574, 1021–1043. doi:10.1016/j.scitotenv.2016.09.116
Guo, H., Ling, Z. H., Cheung, K., Jiang, F., Wang, D. W., Simpson, I. J., et al. (2013). Characterization of photochemical pollution at different elevations in mountainous areas in Hong Kong. Atmos. Chem. Phys. 13 (8), 3881–3898. doi:10.5194/acp-13-3881-2013
Guo, S., Hu, M., Zamora, M. L., Peng, J., Shang, D., Zheng, J., et al. (2014). Elucidating severe urban haze formation in China. Proc. Natl. Acad. Sci. 111 (49), 17373–17378. doi:10.1073/pnas.1419604111
Han, H., Liu, J., Shu, L., Wang, T., and Yuan, H. (2020). Local and synoptic meteorological influences on daily variability in summertime surface ozone in eastern China. Atmos. Chem. Phys. 20 (1), 203–222. doi:10.5194/acp-20-203-2020
Hao, J., He, D., Wu, Y., Fu, L., and He, K. (2000). A study of the emission and concentration distribution of vehicular pollutants in the urban area of Beijing. Atmos. Environ. 34 (3), 453–465. doi:10.1016/S1352-2310(99)00324-6
He, H., Wang, Y., Ma, Q., Ma, J., Chu, B., Ji, D., et al. (2014). Mineral dust and NOx promote the conversion of SO2 to sulfate in heavy pollution days. Sci. Rep. 4 (1), 4172. doi:10.1038/srep04172
He, Q., Wang, M., Liu, K., Li, K., and Jiang, Z. (2021). GPRChinaTemp1km: A high-resolution monthly air temperature dataset for China (1951–2020) based on machine learning. Earth Syst. Sci. Data Discuss. 2021, 1–29. doi:10.5194/essd-2021-267
Hoesly, R., Smith, S., Feng, L., Klimont, Z., Janssens-Maenhout, G., Pitkanen, T., et al. (2017). Historical (1750–2014) anthropogenic emissions of reactive gases and aerosols from the Community Emission Data System (CEDS). Geosci. Model Dev. Discuss., 1–41. doi:10.5194/gmd-2017-43
Hu, B., Zhao, X., Liu, H., Liu, Z., Song, T., Wang, Y., et al. (2017). Quantification of the impact of aerosol on broadband solar radiation in North China. Sci. Rep. 7 (1), 44851. doi:10.1038/srep44851
Huang, J., Pan, X., Guo, X., and Li, G. (2018). Health impact of China's air pollution prevention and control action plan: An analysis of national air quality monitoring and mortality data. Lancet Planet. Health 2 (7), e313–e323. doi:10.1016/S2542-5196(18)30141-4
Huang, R. J., Zhang, Y., Bozzetti, C., Ho, K. F., Cao, J. J., Han, Y., et al. (2014). High secondary aerosol contribution to particulate pollution during haze events in China. Nature 514 (7521), 218–222. doi:10.1038/nature13774
Huang, W., Yang, Y., Wang, Y., Gao, W., Li, H., Zhang, Y., et al. (2021). Exploring the inorganic and organic nitrate aerosol formation regimes at a suburban site on the North China Plain. Sci. Total Environ. 768, 144538. doi:10.1016/j.scitotenv.2020.144538
Huang, X., Ding, A., Gao, J., Zheng, B., Zhou, D., Qi, X., et al. (2020). Enhanced secondary pollution offset reduction of primary emissions during COVID-19 lockdown in China. Natl. Sci. Rev. 8, nwaa137. doi:10.1093/nsr/nwaa137
Jiang, X., Hong, C., Zheng, Y., Zheng, B., Guan, D., Gouldson, A., et al. (2015). To what extent can China’s near-term air pollution control policy protect air quality and human health? A case study of the Pearl River Delta region. Environ. Res. Lett. 10 (10), 104006. doi:10.1088/1748-9326/10/10/104006
Jiang, X., Li, G., and Fu, W. (2021). Government environmental governance, structural adjustment and air quality: A quasi-natural experiment based on the three-year action plan to win the blue sky defense war. J. Environ. Manag. 277, 111470. doi:10.1016/j.jenvman.2020.111470
Kalsoom, U., Wang, T., Ma, C., Shu, L., Huang, C., and Gao, L. (2021). Quadrennial variability and trends of surface ozone across China during 2015–2018: A regional approach. Atmos. Environ. 245, 117989. doi:10.1016/j.atmosenv.2020.117989
Kong, L., Tang, X., Zhu, J., Wang, Z., Li, J., Wu, H., et al. (2021a). A 6-year-long (2013–2018) high-resolution air quality reanalysis dataset in China based on the assimilation of surface observations from CNEMC. Earth Syst. Sci. Data 13 (2), 529–570. doi:10.5194/essd-13-529-2021
Kong, L., Tang, X., Zhu, J., Wang, Z., Li, J., Wu, H., et al. (2021b). A 6-year-long (2013–2018) high-resolution air quality reanalysis dataset in China based on the assimilation of surface observations from CNEMC. Earth Syst. Sci. Data 13 (2), 529–570. doi:10.5194/essd-13-529-2021
Koren, I., Kaufman, Y. J., Remer, L. A., and Martins, J. V. (2004). Measurement of the effect of amazon smoke on inhibition of cloud formation. Science 303 (5662), 1342–1345. doi:10.1126/science.1089424
Koren, I., Martins, J. V., Remer, L. A., and Afargan, H. (2008). Smoke invigoration versus inhibition of clouds over the amazon. Science 321 (5891), 946–949. doi:10.1126/science.1159185
Kulmala, M. (2015). Atmospheric chemistry: China’s choking cocktail. Nature 526 (7574), 497–499. doi:10.1038/526497a
Lelieveld, J., Evans, J. S., Fnais, M., Giannadaki, D., and Pozzer, A. (2015). The contribution of outdoor air pollution sources to premature mortality on a global scale. Nature 525 (7569), 367–371. doi:10.1038/nature15371
Li, H., Cheng, J., Zhang, Q., Zheng, B., Zhang, Y., Zheng, G., et al. (2019c). Rapid transition in winter aerosol composition in Beijing from 2014 to 2017: Response to clean air actions. Atmos. Chem. Phys. 19 (17), 11485–11499. doi:10.5194/acp-19-11485-2019
Li, J., Gao, W., Cao, L., Xiao, Y., Zhang, Y., Zhao, S., et al. (2021a). Significant changes in autumn and winter aerosol composition and sources in Beijing from 2012 to 2018: Effects of clean air actions. Environ. Pollut. 268, 115855. doi:10.1016/j.envpol.2020.115855
Li, J., Wu, R., Li, Y., Hao, Y., Xie, S., and Zeng, L. (2016). Effects of rigorous emission controls on reducing ambient volatile organic compounds in Beijing, China. Sci. Total Environ. 557-558, 531–541. doi:10.1016/j.scitotenv.2016.03.140
Li, K., Jacob, D. J., Liao, H., Zhu, J., Shah, V., Shen, L., et al. (2019b). A two-pollutant strategy for improving ozone and particulate air quality in China. Nat. Geosci. 12 (11), 906–910. doi:10.1038/s41561-019-0464-x
Li, K., Jacob, D. J., Liao, H., Qiu, Y., Shen, L., Zhai, S., et al. (2021b). Ozone pollution in the North China Plain spreading into the late-winter haze season. Proc. Natl. Acad. Sci. 118 (10), e2015797118. doi:10.1073/pnas.2015797118
Li, K., Jacob, D. J., Liao, H., Shen, L., Zhang, Q., and Bates, K. H. (2019a). Anthropogenic drivers of 2013-2017 trends in summer surface ozone in China. Proc. Natl. Acad. Sci. 116 (2), 422–427. doi:10.1073/pnas.1812168116
Li, M., Liu, H., Geng, G., Hong, C., Liu, F., Song, Y., et al. (2017). Anthropogenic emission inventories in China: A review. Natl. Sci. Rev. 4 (6), 834–866. doi:10.1093/nsr/nwx150
Li, W., Shao, L., Wang, W., Li, H., Wang, X., Li, Y., et al. (2020). Air quality improvement in response to intensified control strategies in Beijing during 2013–2019. Sci. Total Environ. 744, 140776. doi:10.1016/j.scitotenv.2020.140776
Li, Y., Shi, G., and Chen, Z. (2021c). Spatial and temporal distribution characteristics of ground-level nitrogen dioxide and ozone across China during 2015-2020. Environ. Res. Lett. 16, 124031. doi:10.1088/1748-9326/ac3794
Lim, S. S., Vos, T., Flaxman, A. D., Danaei, G., Shibuya, K., Adair-Rohani, H., et al. (2012). A comparative risk assessment of burden of disease and injury attributable to 67 risk factors and risk factor clusters in 21 regions, 1990-2010: A systematic analysis for the global burden of disease study 2010. Lancet 380 (9859), 2224–2260. doi:10.1016/S0140-6736(12)61766-8
Lin, W., Xu, X., Ge, B., and Liu, X. (2011). Gaseous pollutants in Beijing urban area during the heating period 2007–2008: Variability, sources, meteorological, and chemical impacts. Atmos. Chem. Phys. 11 (15), 8157–8170. doi:10.5194/acp-11-8157-2011
Lin, W., Xu, X., Ge, B., and Zhang, X. (2009). Characteristics of gaseous pollutants at Gucheng, a rural site southwest of Beijing. J. Geophys. Res. Atmos. 114 (D2), D00G14. doi:10.1029/2008JD010339
Lin, W., Xu, X., Zhang, X., and Tang, J. (2008). Contributions of pollutants from North China plain to surface ozone at the shangdianzi GAW station. Atmos. Chem. Phys. 8 (19), 5889–5898. doi:10.5194/acp-8-5889-2008
Liu, F., Zhang, Q., Tong, D., Zheng, B., Li, M., Huo, H., et al. (2015a). High-resolution inventory of technologies, activities, and emissions of coal-fired power plants in China from 1990 to 2010. Atmos. Chem. Phys. 15 (23), 13299–13317. doi:10.5194/acp-15-13299-2015
Liu, J., Li, X., Liu, S., Liu, L., Wu, J., Wang, R., et al. (2021). Assessment of the emission mitigation effect on the wintertime air quality in the Guanzhong Basin, China from 2013 to 2017. Atmos. Pollut. Res. 12 (10), 101196. doi:10.1016/j.apr.2021.101196
Liu, X. G., Li, J., Qu, Y., Han, T., Hou, L., Gu, J., et al. (2013). Formation and evolution mechanism of regional haze: A case study in the megacity Beijing, China. Atmos. Chem. Phys. 13 (9), 4501–4514. doi:10.5194/acp-13-4501-2013
Liu, Z., Gao, W., Yu, Y., Hu, B., Xin, J., Sun, Y., et al. (2018). Characteristics of PM&lt;sub&gt;2.5&lt;/sub&gt; mass concentrations and chemical species in urban and background areas of China: Emerging results from the CARE-China network. Atmos. Chem. Phys. 18 (12), 8849–8871. doi:10.5194/acp-18-8849-2018
Liu, Z., Hu, B., Wang, L., Wu, F., Gao, W., and Wang, Y. (2015b). Seasonal and diurnal variation in particulate matter (PM10and PM2.5) at an urban site of Beijing: analyses from a 9-year study. Environ. Sci. Pollut. Res. 22 (1), 627–642. doi:10.1007/s11356-014-3347-0
Lu, H., Lyu, X., Cheng, H., Ling, Z., and Guo, H. (2019a). Overview on the spatial-temporal characteristics of the ozone formation regime in China. Environ. Science-Processes Impacts 21 (6), 916–929. doi:10.1039/c9em00098d
Lu, K., Fuchs, H., Hofzumahaus, A., Tan, Z., Wang, H., Zhang, L., et al. (2019b). Fast photochemistry in wintertime haze: Consequences for pollution mitigation strategies. Environ. Sci. Technol. 53 (18), 10676–10684. doi:10.1021/acs.est.9b02422
Lu, X., Zhang, L., Chen, Y., Zhou, M., Zheng, B., Li, K., et al. (2019c). Exploring 2016–2017 surface ozone pollution over China: Source contributions and meteorological influences. Atmos. Chem. Phys. 19 (12), 8339–8361. doi:10.5194/acp-19-8339-2019
Lu, X., Zhang, L., Wang, X., Gao, M., Li, K., Zhang, Y., et al. (2020). Rapid increases in warm-season surface ozone and resulting health impact in China since 2013. Environ. Sci. Technol. Lett. 7 (4), 240–247. doi:10.1021/acs.estlett.0c00171
Lu, Z., Liu, X., Zhang, Z., Zhao, C., Meyer, K., Rajapakshe, C., et al. (2018). Biomass smoke from southern Africa can significantly enhance the brightness of stratocumulus over the southeastern Atlantic Ocean. Proc. Natl. Acad. Sci. 115 (12), 2924–2929. doi:10.1073/pnas.1713703115
Lu, Z., Streets, D. G., Zhang, Q., Wang, S., Carmichael, G. R., Cheng, Y. F., et al. (2010). Sulfur dioxide emissions in China and sulfur trends in East Asia since 2000. Atmos. Chem. Phys. 10 (13), 6311–6331. doi:10.5194/acp-10-6311-2010
Ma, J., Chu, B., Liu, J., Liu, Y., Zhang, H., and He, H. (2018). NO promotion of SO2 conversion to sulfate: An important mechanism for the occurrence of heavy haze during winter in Beijing. Environ. Pollut. 233, 662–669. doi:10.1016/j.envpol.2017.10.103
Ma, M., Gao, Y., Wang, Y., Zhang, S., Leung, L. R., Liu, C., et al. (2019a). Substantial ozone enhancement over the North China Plain from increased biogenic emissions due to heat waves and land cover in summer 2017. Atmos. Chem. Phys. 19 (19), 12195–12207. doi:10.5194/acp-19-12195-2019
Ma, X., Huang, J., Zhao, T., Liu, C., Zhao, K., Xing, J., et al. (2021). Rapid increase in summer surface ozone over the North China plain during 2013–2019: A side effect of particulate matter reduction control? Atmos. Chem. Phys. 21 (1), 1–16. doi:10.5194/acp-21-1-2021
Ma, Z., Liu, R., Liu, Y., and Bi, J. (2019b). Effects of air pollution control policies on PM&lt;sub&gt;2.5&lt;/sub&gt; pollution improvement in China from 2005 to 2017: A satellite-based perspective. Atmos. Chem. Phys. 19 (10), 6861–6877. doi:10.5194/acp-19-6861-2019
McDonald, B. C., de Gouw, J. A., Gilman, J. B., Jathar, S. H., Akherati, A., Cappa, C. D., et al. (2018). Volatile chemical products emerging as largest petrochemical source of urban organic emissions. Science 359 (6377), 760–764. doi:10.1126/science.aaq0524
Olstrup, H., Forsberg, B., Orru, H., Spanne, M., Nguyen, H., Molnár, P., et al. (2018). Trends in air pollutants and health impacts in three Swedish cities over the past three decades. Atmos. Chem. Phys. 18 (21), 15705–15723. doi:10.5194/acp-18-15705-2018
Othman, M., and Latif, M. T. (2021). Air pollution impacts from COVID-19 pandemic control strategies in Malaysia. J. Clean. Prod. 291, 125992. doi:10.1016/j.jclepro.2021.125992
Pal, S. K., and Masum, M. M. H. (2021). Spatiotemporal trends of selected air quality parameters during force lockdown and its relationship to COVID-19 positive cases in Bangladesh. Urban Clim. 39, 100952. doi:10.1016/j.uclim.2021.100952
Rohde, R. A., and Muller, R. A. (2015). Air pollution in China: Mapping of concentrations and sources. Plos One 10 (8), e0135749. doi:10.1371/journal.pone.0135749
Russell, A. G., McCue, K. F., and Cass, G. R. (1988). Mathematical modeling of the formation of nitrogen-containing pollutants. 2. Evaluation of the effect of emission controls. Environ. Sci. Technol. 22 (11), 1336–1347. doi:10.1021/es00176a014
Schnell, R. C., Oltmans, S. J., Neely, R. R., Endres, M. S., Molenar, J. V., and White, A. B. (2009). Rapid photochemical production of ozone at high concentrations in a rural site during winter. Nat. Geosci. 2 (2), 120–122. doi:10.1038/ngeo415
Sen, , and Kumar, P. (1968). Estimates of the regression coefficient based on kendall's tau. Publ. Am. Stat. Assoc. 63 (324), 1379–1389. doi:10.1080/01621459.1968.10480934
Shi, X., Zhao, C., Jiang, J. H., Wang, C., Yang, X., and Yung, Y. L. (2018). Spatial representativeness of PM2.5 concentrations obtained using observations from network stations. J. Geophys. Res. Atmos. 123 (6), 3145–3158. doi:10.1002/2017JD027913
Shi, Z., Vu, T., Kotthaus, S., Harrison, R. M., Grimmond, S., Yue, S., et al. (2019). Introduction to the special issue “In-depth study of air pollution sources and processes within Beijing and its surrounding region (APHH-Beijing)”. Atmos. Chem. Phys. 19 (11), 7519–7546. doi:10.5194/acp-19-7519-2019
Silver, B., Reddington, C. L., Arnold, S. R., and Spracklen, D. V. (2018). Substantial changes in air pollution across China during 2015–2017. Environ. Res. Lett. 13 (11), 114012. doi:10.1088/1748-9326/aae718
Su, W., Liu, C., Hu, Q., Fan, G., Xie, Z., Huang, X., et al. (2017). Characterization of ozone in the lower troposphere during the 2016 G20 conference in Hangzhou. Sci. Rep. 7 (1), 17368. doi:10.1038/s41598-017-17646-x
Sun, W., Shao, M., Granier, C., Liu, Y., Ye, C. S., and Zheng, J. Y. (2018). Long-term trends of anthropogenic SO2, NOx, CO, and NMVOCs emissions in China. Earth's Future 6 (8), 1112–1133. doi:10.1029/2018ef000822
Tang, G., Li, X., Wang, Y., Xin, J., and Ren, X. (2009). Surface ozone trend details and interpretations in Beijing, 2001–2006. Atmos. Chem. Phys. 9 (22), 8813–8823. doi:10.5194/acp-9-8813-2009
Tang, G., Wang, Y., Li, X., Ji, D., Hsu, S., and Gao, X. (2012). Spatial-temporal variations in surface ozone in Northern China as observed during 2009–2010 and possible implications for future air quality control strategies. Atmos. Chem. Phys. 12 (5), 2757–2776. doi:10.5194/acp-12-2757-2012
Theil, H. (1992). A rank-invariant method of linear and polynomial regression analysis. Nederl. Akad. wetensch.Proc. 12 (2), 345–381. doi:10.1007/978-94-011-2546-8_20
Tie, X., Long, X., Li, G., Zhao, S., Cao, J., and Xu, J. (2019). Ozone enhancement due to the photodissociation of nitrous acid in eastern China. Atmos. Chem. Phys. 19 (17), 11267–11278. doi:10.5194/acp-19-11267-2019
Vu, T. V., Shi, Z., Cheng, J., Zhang, Q., He, K., Wang, S., et al. (2019a). Assessing the impact of clean air action on air quality trends in Beijing using a machine learning technique. Atmos. Chem. Phys. 19 (17), 11303–11314. doi:10.5194/acp-19-11303-2019
Vu, T. V., Shi, Z., Cheng, J., Zhang, Q., He, K., Wang, S., et al. (2019b). Assessing the impact of clean air action on air quality trends in Beijing using a machine learning technique. Atmos. Chem. Phys. 19 (17), 11303–11314. doi:10.5194/acp-19-11303-2019
Wang, G., Kawamura, K., Xie, M., Hu, S., Cao, J., An, Z., et al. (2009). Organic molecular compositions and size distributions of Chinese summer and autumn aerosols from nanjing: Characteristic haze event caused by wheat straw burning. Environ. Sci. Technol. 43 (17), 6493–6499. doi:10.1021/es803086g
Wang, G., Zhang, R., Gomez, M. E., Yang, L., Levy Zamora, M., Hu, M., et al. (2016). Persistent sulfate formation from London Fog to Chinese haze. Proc. Natl. Acad. Sci. 113 (48), 13630–13635. doi:10.1073/pnas.1616540113
Wang, T., Xue, L., Brimblecombe, P., Lam, Y. F., Li, L., and Zhang, L. (2017a). Ozone pollution in China: A review of concentrations, meteorological influences, chemical precursors, and effects. Sci. Total Environ. 575, 1582–1596. doi:10.1016/j.scitotenv.2016.10.081
Wang, W.-N., Cheng, T.-H., Gu, X.-F., Chen, H., Guo, H., Wang, Y., et al. (2017b). Assessing spatial and temporal patterns of observed ground-level ozone in China. Sci. Rep. 7 (1), 3651. doi:10.1038/s41598-017-03929-w
Wang, W. N., Cheng, T. H., Gu, X. F., Chen, H., Guo, H., Wang, Y., et al. (2017c). Assessing spatial and temporal patterns of observed ground-level ozone in China. Sci. Rep. 7 (1), 3651. doi:10.1038/s41598-017-03929-w
Wang, W., Parrish, D. D., Li, X., Shao, M., Liu, Y., Mo, Z., et al. (2020a). Exploring the drivers of the increased ozone production in Beijing in summertime during 2005–2016. Atmos. Chem. Phys. 20 (24), 15617–15633. doi:10.5194/acp-20-15617-2020
Wang, W., van der A, R., Ding, J., van Weele, M., and Cheng, T. (2021). Spatial and temporal changes of the ozone sensitivity in China based on satellite and ground-based observations. Atmos. Chem. Phys. 21 (9), 7253–7269. doi:10.5194/acp-21-7253-2021
Wang, Y. H., Gao, W. K., Wang, S., Song, T., Gong, Z. Y., Ji, D. S., et al. (2020b). Contrasting trends of PM2.5 and surface-ozone concentrations in China from 2013 to 2017. Natl. Sci. Rev. 7 (8), 1331–1339. doi:10.1093/nsr/nwaa032
Wang, Y. H., Hu, B., Ji, D. S., Liu, Z. R., Tang, G. Q., Xin, J. Y., et al. (2014b). Ozone weekend effects in the Beijing–Tianjin–Hebei metropolitan area, China. Atmos. Chem. Phys. 14 (5), 2419–2429. doi:10.5194/acp-14-2419-2014
Wang, Y., McElroy, M. B., Munger, J. W., Hao, J., Ma, H., Nielsen, C. P., et al. (2008). Variations of O&lt;sub&gt;3&lt;/sub&gt; and CO in summertime at a rural site near Beijing. Atmos. Chem. Phys. 8 (21), 6355–6363. doi:10.5194/acp-8-6355-2008
Wang, Y. Q., Zhang, X. Y., Sun, J. Y., Zhang, X. C., Che, H. Z., and Li, Y. (2015). Spatial and temporal variations of the concentrations of PM&lt;sub&gt;10&lt;/sub&gt;, PM&lt;sub&gt;2.5&lt;/sub&gt; and PM&lt;sub&gt;1&lt;/sub&gt; in China. Atmos. Chem. Phys. 15 (23), 13585–13598. doi:10.5194/acp-15-13585-2015
Wang, Y., Wang, H., Guo, H., Lyu, X., Cheng, H., Ling, Z., et al. (2017d). Long-term O&lt;sub&gt;3&lt;/sub&gt;–precursor relationships in Hong Kong: Field observation and model simulation. Atmos. Chem. Phys. 17 (18), 10919–10935. doi:10.5194/acp-17-10919-2017
Wang, Y., Ying, Q., Hu, J., and Zhang, H. (2014a). Spatial and temporal variations of six criteria air pollutants in 31 provincial capital cities in China during 2013-2014. Environ. Int. 73, 413–422. doi:10.1016/j.envint.2014.08.016
Wen, L., Xue, L., Wang, X., Xu, C., Chen, T., Yang, L., et al. (2018). Summertime fine particulate nitrate pollution in the North China plain: Increasing trends, formation mechanisms and implications for control policy. Atmos. Chem. Phys. 18 (15), 11261–11275. doi:10.5194/acp-18-11261-2018
Wilcox, E. M., Thomas, R. M., Praveen, P. S., Pistone, K., Bender, F. A. M., and Ramanathan, V. (2016). Black carbon solar absorption suppresses turbulence in the atmospheric boundary layer. Proc. Natl. Acad. Sci. 113 (42), 11794–11799. doi:10.1073/pnas.1525746113
Wu, H., Tang, X., Wang, Z., Wu, L., Lu, M., Wei, L., et al. (2018). Probabilistic automatic outlier detection for surface air quality measurements from the China national environmental monitoring network. Adv. Atmos. Sci. 35 (12), 1522–1532. doi:10.1007/s00376-018-8067-9
Wu, W., Xue, W., Zheng, Y., Wang, Y., Lei, Y., and Wang, J. (2021). Diurnal regulation of VOCs may not be effective in controlling ozone pollution in China. Atmos. Environ. 256, 118442. doi:10.1016/j.atmosenv.2021.118442
Xu, W., Kuang, Y., Bian, Y., Liu, L., Li, F., Wang, Y., et al. (2020). Current challenges in visibility improvement in southern China. Environ. Sci. Technol. Lett. 7 (6), 395–401. doi:10.1021/acs.estlett.0c00274
Xu, W. Y., Zhao, C. S., Ran, L., Deng, Z. Z., Liu, P. F., Ma, N., et al. (2011). Characteristics of pollutants and their correlation to meteorological conditions at a suburban site in the North China Plain. Atmos. Chem. Phys. 11 (9), 4353–4369. doi:10.5194/acp-11-4353-2011
Xu, X., Lin, W., Wang, T., Yan, P., Tang, J., Meng, Z., et al. (2008). Long-term trend of surface ozone at a regional background station in eastern China 1991–2006: Enhanced variability. Atmos. Chem. Phys. 8 (10), 2595–2607. doi:10.5194/acp-8-2595-2008
Xue, J., Yuan, Z., Griffith, S. M., Yu, X., Lau, A. K. H., and Yu, J. Z. (2016). Sulfate Formation enhanced by a cocktail of high NOx, SO2, particulate matter, and droplet pH during haze-fog events in megacities in China: An observation-based modeling investigation. Environ. Sci. Technol. 50 (14), 7325–7334. doi:10.1021/acs.est.6b00768
Xue, T., Liu, J., Zhang, Q., Geng, G., Zheng, Y., Tong, D., et al. (2019). Rapid improvement of PM2.5 pollution and associated health benefits in China during 2013–2017. Sci. China Earth Sci. 62 (12), 1847–1856. doi:10.1007/s11430-018-9348-2
Yang, F., Tan, J., Zhao, Q., Du, Z., He, K., Ma, Y., et al. (2011). Characteristics of PM&lt;sub&gt;2.5&lt;/sub&gt; speciation in representative megacities and across China. Atmos. Chem. Phys. 11 (11), 5207–5219. doi:10.5194/acp-11-5207-2011
Yang, G., Liu, Y., and Li, X. (2020). Spatiotemporal distribution of ground-level ozone in China at a city level. Sci. Rep. 10 (1), 7229. doi:10.1038/s41598-020-64111-3
Yang, L., Luo, H., Yuan, Z., Zheng, J., Huang, Z., Li, C., et al. (2019). Quantitative impacts of meteorology and precursor emission changes on the long-term trend of ambient ozone over the Pearl River Delta, China, and implications for ozone control strategy. Atmos. Chem. Phys. 19 (20), 12901–12916. doi:10.5194/acp-19-12901-2019
Yang, S., Yuesi, W., and Changchun, Z. (2009). Measurement of the vertical profile of atmospheric SO2 during the heating period in Beijing on days of high air pollution. Atmos. Environ. 43 (2), 468–472. doi:10.1016/j.atmosenv.2008.09.057
Yin, P., Guo, J., Wang, L., Fan, W., Lu, F., Guo, M., et al. (2020). Higher risk of cardiovascular disease associated with smaller size-fractioned particulate matter. Environ. Sci. Technol. Lett. 7 (2), 95–101. doi:10.1021/acs.estlett.9b00735
Yue, X., Unger, N., Harper, K., Xia, X., Liao, H., Zhu, T., et al. (2017). Ozone and haze pollution weakens net primary productivity in China. Atmos. Chem. Phys. 17 (9), 6073–6089. doi:10.5194/acp-17-6073-2017
Zamora, L. M., Kahn, R. A., Cubison, M. J., Diskin, G. S., Jimenez, J. L., Kondo, Y., et al. (2016). Aircraft-measured indirect cloud effects from biomass burning smoke in the Arctic and subarctic. Atmos. Chem. Phys. 16 (2), 715–738. doi:10.5194/acp-16-715-2016
Zhai, S., Jacob, D. J., Wang, X., Shen, L., Li, K., Zhang, Y., et al. (2019). Fine particulate matter (PM&lt;sub&gt;2.5&lt;/sub&gt;) trends in China, 2013–2018: Separating contributions from anthropogenic emissions and meteorology. Atmos. Chem. Phys. 19 (16), 11031–11041. doi:10.5194/acp-19-11031-2019
Zhang, Q., Zheng, Y., Tong, D., Shao, M., Wang, S., Zhang, Y., et al. (2019a). Drivers of improved PM2.5 air quality in China from 2013 to 2017. Proc. Natl. Acad. Sci. 116 (49), 24463–24469. doi:10.1073/pnas.1907956116
Zhang, S., Li, D., Ge, S., Liu, S., Wu, C., Wang, Y., et al. (2021a). Rapid sulfate formation from synergetic oxidation of SO2 by O3 and NO2 under ammonia-rich conditions: Implications for the explosive growth of atmospheric PM2.5 during haze events in China. Sci. Total Environ. 772, 144897. doi:10.1016/j.scitotenv.2020.144897
Zhang, X., Xu, X., Ding, Y., Liu, Y., Zhang, H., Wang, Y., et al. (2019b). The impact of meteorological changes from 2013 to 2017 on PM2.5 mass reduction in key regions in China. Sci. China Earth Sci. 62, 1885–1902. doi:10.1007/s11430-019-9343-3
Zhang, Y., Shindell, D., Seltzer, K., Shen, L., Lamarque, J. F., Zhang, Q., et al. (2021b). Impacts of emission changes in China from 2010 to 2017 on domestic and intercontinental air quality and health effect. Atmos. Chem. Phys. 21 (20), 16051–16065. doi:10.5194/acp-21-16051-2021
Zhao, H., Chen, K., Liu, Z., Zhang, Y., Shao, T., and Zhang, H. (2021). Coordinated control of PM2.5 and O3 is urgently needed in China after implementation of the “Air pollution prevention and control action plan”. Chemosphere 270, 129441. doi:10.1016/j.chemosphere.2020.129441
Zheng, B., Chevallier, F., Ciais, P., Yin, Y., Deeter, M., Worden, H., et al. (2018a). Rapid decline in carbon monoxide emissions and export from East Asia between years 2005 and 2016. Environ. Res. Lett. 13, 044007. doi:10.1088/1748-9326/aab2b3
Zheng, B., Chevallier, F., Yin, Y., Ciais, P., Fortems-Cheiney, A., Deeter, M., et al. (2019a). Global atmospheric carbon monoxide budget 2000-2017 inferred from multi-species atmospheric inversions. Earth Syst. Sci. Data 11, 1411–1436. doi:10.5194/essd-11-1411-2019
Zheng, B., Tong, D., Li, M., Liu, F., Hong, C., Geng, G., et al. (2018b). Trends in China's anthropogenic emissions since 2010 as the consequence of clean air actions. Atmos. Chem. Phys. 18 (19), 14095–14111. doi:10.5194/acp-18-14095-2018
Zheng, S., Wang, J., Sun, C., Zhang, X., and Kahn, M. E. (2019b). Air pollution lowers Chinese urbanites' expressed happiness on social media. Nat. Hum. Behav. 3 (3), 237–243. doi:10.1038/s41562-018-0521-2
Keywords: air pollutants, air quality, PM2.5, O3, Guizhou
Citation: Lu F, Yuan Y, Hong F and Hao L (2023) Spatiotemporal variations and trends of air quality in major cities in Guizhou. Front. Environ. Sci. 11:1254390. doi: 10.3389/fenvs.2023.1254390
Received: 07 July 2023; Accepted: 21 August 2023;
Published: 05 September 2023.
Edited by:
Zhiyuan Hu, Sun Yat-sen University, ChinaReviewed by:
Bo Hu, Chinese Academy of Sciences (CAS), ChinaCopyright © 2023 Lu, Yuan, Hong and Hao. This is an open-access article distributed under the terms of the Creative Commons Attribution License (CC BY). The use, distribution or reproduction in other forums is permitted, provided the original author(s) and the copyright owner(s) are credited and that the original publication in this journal is cited, in accordance with accepted academic practice. No use, distribution or reproduction is permitted which does not comply with these terms.
*Correspondence: Yang Yuan, Z3poa3lfeXlAMTYzLmNvbQ==
Disclaimer: All claims expressed in this article are solely those of the authors and do not necessarily represent those of their affiliated organizations, or those of the publisher, the editors and the reviewers. Any product that may be evaluated in this article or claim that may be made by its manufacturer is not guaranteed or endorsed by the publisher.
Research integrity at Frontiers
Learn more about the work of our research integrity team to safeguard the quality of each article we publish.