
94% of researchers rate our articles as excellent or good
Learn more about the work of our research integrity team to safeguard the quality of each article we publish.
Find out more
ORIGINAL RESEARCH article
Front. Environ. Sci., 22 March 2023
Sec. Atmosphere and Climate
Volume 11 - 2023 | https://doi.org/10.3389/fenvs.2023.1146437
This article is part of the Research TopicAir Pollution, Deposition, and Source Identification in South AsiaView all 5 articles
 Pornpan Uttamang1*
 Radshadaporn Janta2*
 Sherin Hassan Bran2Ronald Macatangay2Vanisa Surapipith2Wittaya Tala3,4Somporn Chantara3,4
Biogenic volatile organic compounds (BVOC), which are mainly emitted from plants, are a major precursor for the formation of ground-level ozone (O3) and secondary organic aerosols (SOA). In the northern region of Thailand, 63.8% of the land area is covered by forests. Herein we investigated the effects of biogenic volatile organic compounds (BVOC) emitted from plants and anthropogenic NOx emissions on ground-level ozone (O3) and fine particulate matters (PM2.5) formation. The Weather Research and Forecasting Model coupled with Chemistry (WRF-Chem Model) was applied to simulate three scenarios including baseline, noBio and modiAntho simulations. The modeling results over the northern region of Thailand indicate that BVOC emissions over the northern region of Thailand contributed only 5.3%–5.6% of the total concentrations of PM2.5 and BVOC had a direct relationship to glyoxal and SOA of glyoxal. The comparison between the observed and the modeled isoprene over the study site showed an underestimation (3- to 4-folds) of the simulated concentrations during the study period (June and November 2021). In June, decreases in anthropogenic NOx emissions by 40% led to PM2.5 reductions (5.3%), which corresponded to a zero BVOC emission scenario. While higher PM2.5 reductions (5.6%) were found to be caused by anthropogenic NOx reductions in November, small increases in PM2.5 were observed over the area near a power plant located in Lampang Province. Therefore, both VOC and NOx emission controls may be necessary for areas near the lignite mine and power plant. Since the areas within the vicinity of the power plant were under VOC-limited regimes, while the other areas were determined to be NOx-limited.
The northern region of Thailand has experienced air quality degradation during the hot-dry season (February-April), especially PM2.5 that frequently exceeded its national ambient air quality standard of Thailand (Thailand NAAQs for daily PM2.5 is 50 μg·m−3 (Radchakitchanubagesa, 2022) for example, in 2019, Chiang Mai - a province in the northern region of Thailand, had the worst air pollution in the world (Wipatayotin, 2019), in 2021, Chiang Mai was ranked as the third most air-polluted city in the world (Tanraksa, 2021), in February 2023, air quality over the northern region of Thailand that was reported by the Pollution Control Department, Thailand (PCD) has AQI values ranging from 96 (moderate) to 294 (unhealthy) with the daily average PM2.5 ranging from 49 to 184 μg·m−3 (Pollution Control Department, 2023). The influence of air pollution on human health and the environment is a significant source of concern. According to a 2021 World Health Organization (WHO) report (World Health Organization, 2022), approximately seven million people worldwide died prematurely due to health problems attributed to air pollution. Importantly, excessive air pollution can cause a range of harmful effects on human health depending on age and gender. Southeast Asia and the Western Pacific region account for around 25% and 45% of world’s mortality rates, respectively, according to current estimations of global premature death rates based on high-resolution global O3 and PM2.5 models (Lelieveld et al., 2013; Amnuaylojaroen et al., 2019).
Volatile organic compounds (VOCs) are important compounds in the ambient air that can act as a precursor to the formation of O3 and secondary organic aerosols (SOA) (Claeys et al., 2004; Kota et al., 2015). They can come from both natural and man-made sources, which are referred to as biogenic volatile organic compounds (BVOC) and anthropogenic volatile organic compounds (AVOC), respectively. BVOC emissions account for up to 90% of all VOC emissions globally, with vegetation accounting for 99% of these emissions (Guenther et al., 1995). Due to their high emissions and high levels of reactivity, BVOC like isoprene, monoterpene, and sesquiterpene contribute significantly to the formation of SOAs (Carslaw et al., 2010; Tasoglou and Pandis, 2015). Fu and Liao (2012) determined that interannual variations in BVOC caused 2%–5% differences in simulated O3 and SOA levels in the summer months during the period from 2001 to 2006. About 20% and 76% of all O3 and SOA levels worldwide, respectively, are attributed to BVOC emissions (Hallquist et al., 2009; Wang et al., 2019). Furthermore, it was indicated that the ratio of BVOC emissions to anthropogenic VOC emissions is greater than 1.8 (Li et al., 2016; Yang et al., 2021). Moreover, various compounds can exhibit a high degree of sensitivity to changes in these emissions, suggesting that they could have a high impact on SOA as well.
Glyoxal (CHOCHO), the smallest dicarbonyl produced through the oxidation of isoprene by the hydroxyl radical (OH•), has been acknowledged as an important SOA precursor, since it can transform to SOA through a range of reversible and irreversible reactions (Knote et al., 2014; Miller et al., 2017). However, the chemical pathways that are used to convert glyoxal to SOA are still not fully clear (Knote et al., 2014). Under low-NOx conditions, the rate of glyoxal formation from isoprene is slower than it is when these mechanisms are employed under high-NOx conditions (Miller et al., 2017). In another case, under a VOC-limited regime (NOx-saturated), wherein the hydroxyl radical (OH•) dominantly reacts with NO2, resulting in nitrate aerosol formation. Therefore, a reduction of NOx emissions can lead to an increase in OH, and the oxidation of SO2 become dominant. As a result, sulfate concentrations are enhanced. On the other hand, a reduction in VOCs under this regime will slow down sulfate formation due to a reduction in O3 and OH levels (Tsimpidi et al., 2008). Sulfate, nitrate and ammonium, collectively known as SNA, are considered important inorganic aerosol species because they account for half of the total mass of PM2.5 (Wang et al., 2013; Chen et al., 2016) which, the SNA system also depends on the levels of VOC and NOx. Aksoyoglu et al. (2017) studied the effects of BVOC on the SNA system over Europe by utilizing the three-dimensional regional comprehensive air quality model with relevant extensions (CAMx). The results from their study revealed that increasing BVOC emissions by a factor of two could enhance SOA levels even if nitrate and sulfate levels were reduced.
In Thailand, there are a few studies attempted to investigate causes of air quality degradation, for example, Amnuaylojaroen et al. (2014) used the Weather Research and Forecasting Model with Chemistry (WRF-Chem) to predict surface O3 and CO levels in Southeast Asia during peak biomass burning periods. Amnuaylojaroen et al. (2019) investigated the effect of volatile organic compounds from biomass burning on surface O3 levels in Southeast Asia using the WRF-Chem; Sharma et al. (2017) evaluated the modeled surface O3 over South Asia using three different emission inventories in WRF-Chem; Khodmanee and Amnuaylojaroen (2021) use a model simulation to investigate the effect of biomass burning on anthropogenic, biogenic, and biomass burning emissions; however, the studies on BVOC and its effects on the formation of surface are limit. Especially, over the northern Thailand wherein forests cover over 63.8% (greater than 5,723,503.79 ha) of the land area and this region is rich in natural resources and biodiversity (Royal Forest Department, 2018). Besides anthropogenic emission such as biomass burning, particularly during the beginning of the year, from January to April (Yin et al., 2019; Amnuaylojaroen et al., 2020) and transportation vehicles as a result of increasing population and rapidly expanding urbanization and suburbanization that are causes of air pollution, investigation whether forests could be a major source of air pollution in the region is necessary.
Therefore, in this study, the influence of BVOC and anthropogenic NOx (precursor) on the formation of surface O3 and SOA and its contribution to the total PM2.5 concentration were investigated. The Weather Research and Forecasting Model coupled with Chemistry (WRF-Chem Model) was utilized during the period of 16–23 June of 2021 (representing the wet season) and 24 November of 2021 to 1 December of 2021 (representing the dry season). The results from this study provides an in-depth analysis of SOA formation from BVOC and from anthropogenic emissions and insights for aerosol chemistry in models that can help to recognize the impact of biogenic and anthropogenic emission sources on SOA and surface O3 over this area which this information will support the local government to prepare proper PM2.5 control mitigations over the northern region of Thailand.
In this study, a single domain with a 12-km horizontal resolution, that employed 37 vertical sigma-pressure levels, was utilized using the Weather Research and Forecasting Model coupled with Chemistry (WRF-Chem Model) version 3.9.1.1. The domain covered eight provinces in the northern region of Thailand including, Mae Hong Son, Chiang Mai, Chiang Rai, Lamphun, Lampang, Phayao, Phrae, and Nan Provinces. This study area is located in the complex terrain comprised of the Thanon Thong Chai Range, the Doi Inthanon Range, the Khun Tan Range, the Phi Pan Nam Range, and the Luang Prabang Range extending from the east to the west, as well as the Daen Lao Rang located in the north of the study area (Figure 1). About 63.8% of the region is covered by forests including hilly evergreen forests, dry deciduous dipterocarp forests and mixed deciduous forests (Royal Forest Department, 2018). A major anthropogenic emission source in this area is the lignite mine and power plant with a generating capacity of 2,220 MW. This power plant consumes about 16 million tons of fuel annually.
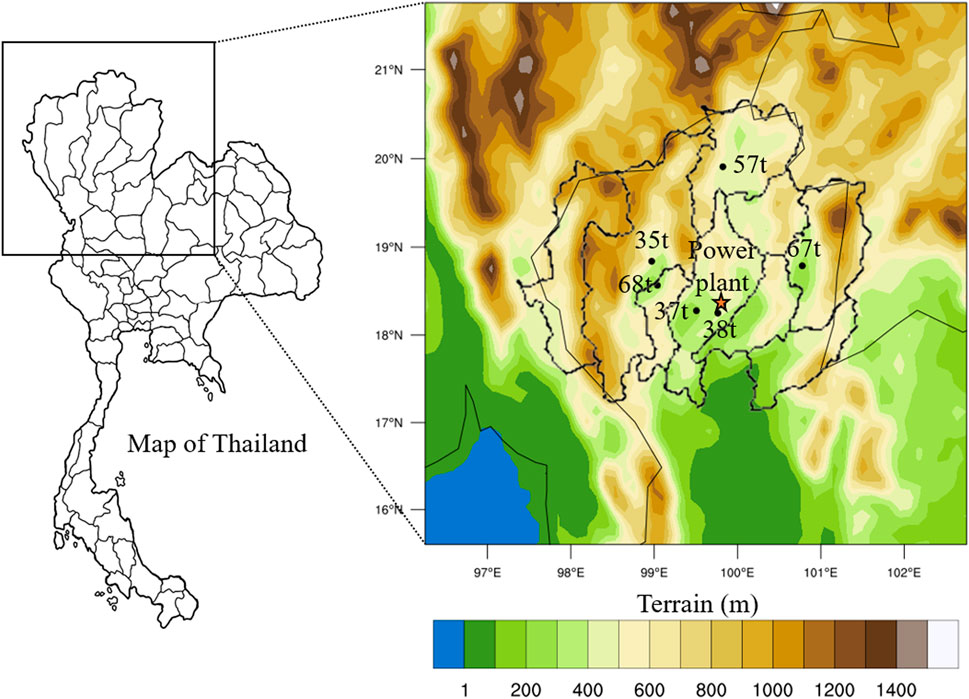
FIGURE 1. WRF-chem domain with terrain height values. Dots refer to monitoring stations operated by the Pollution Control Department of Thailand located in Chiang Mai (station ID: 35t), Chiang Rai (station ID: 57t), Lamphun (station ID: 68t), Lampang (station ID: 37t and 38t), Nan (station ID: 67t) provinces and the location of the power plant located in Lampang province is referred by a star symbol.
Each year, during the months from May to October, northern Thailand is influenced by southwest monsoon winds. These monsoon winds bring high moisture content air masses from the Indian Ocean that ultimately bring the wet season to this region. The dry season runs from November to May and occurs as a result of the cold and dry air masses that travel from China. The dry season in Thailand is separated into two periods, namely, the local summer season (from February to May) and the local winter season (from October to February). During the local summer season, the weather is hot to very hot (with temperatures ranging from 35 to greater than 40°C); while cooler and dry weather occurs during the winter months (Thai Meteorological Department, 2022).
The WRF-Chem Model version 3.9.1.1 was selected to study the effects of BVOC and anthropogenic NOx emissions on O3 and PM2.5 formations over the northern region of Thailand. The WRF-chem simulation system was installed on the TARA high performance computing cluster system, which was operated by the National Science and Technology Development Agency, Thailand. Table 1 summarizes the input data sets, as well as the physical and chemical options selected in this study. We then selected the 20-category Moderate Resolution Imaging Spectroradiometer (MODIS) land covers. The meteorological investigation was driven by the National Centers for Environmental Prediction Global Forecast System (NCEP-GFS) with a 0.25 × 0.25 degree of horizontal resolution prepared every 6 h. Since Thailand is lacking in a comprehensive national emissions inventory, the Emissions Database for Global Atmospheric Research-Hemispheric Transport of Air Pollution (EDGAR-HTAP) for 2010 with the finest horizontal resolution of 0.1 × 0.1° was employed in this study. The biogenic emission inventory was estimated by the online Model of Emissions of Gases and Aerosols from Nature (MEGAN). The emissions from biomass burning were calculated based on the Fire Inventory obtained from the NCAR (FINN) model in year 2020. This was because at the time of this study, the FINN 2021 data set was not yet available. The WRF Single–moment 6–class scheme was selected for microphysics in conjunction with the Rapid Radiative Transfer Model (RRTMG) scheme for longwave and shortwave radiations, the Eta similarity surface layer scheme, the Mellor–Yamada–Janjic planetary boundary scheme and the Grell–Freitas ensemble cumulus parameterization. Gas-phase and photolysis were calculated by the Model for Ozone and Related chemical Tracers (MOZART) and the Madronich F-TUV photolysis scheme, respectively. Aerosol chemistry was simulated by the Model for Simulating Aerosol Interactions and Chemistry (MOSAIC) 4-bin aerosols module with the Kinetic PreProcessor (KPP), which provided more in-depth information on aerosol compositions and properties.

TABLE 1. Input data, physical, and chemical options selected for this study.
Two simulation periods, including 16 to 23 June of 2021 and 24 November to 1 December of 2021, were set to estimate the effects of BVOC and anthropogenic NOx emissions on O3 and PM2.5 formation during the wet season, with low biomass burning, and high biomass burning during the dry season, respectively.
We designed three scenario simulations, namely, baseline, noBio and modiAnthro, to investigate the effects of BVOC and anthropogenic NOx emissions on O3 and PM2.5 formation over the northern region of Thailand. The first simulation (baseline) was set according to the model configuration specifically established for the purposes of model evaluation while also serving as a basis simulation. The second scenario is “noBio” scenario in which the BVOC emission inventory estimated by MEGAN was turned off (zero BVOC emissions). A 40% anthropogenic NOx emission reduction was applied for the fourth or “modiAnthro” scenario. Table 2 summarizes the simulation designs and the purpose of the simulations. Figure 2 illustrates the model simulation designs and workflow diagram in this study.
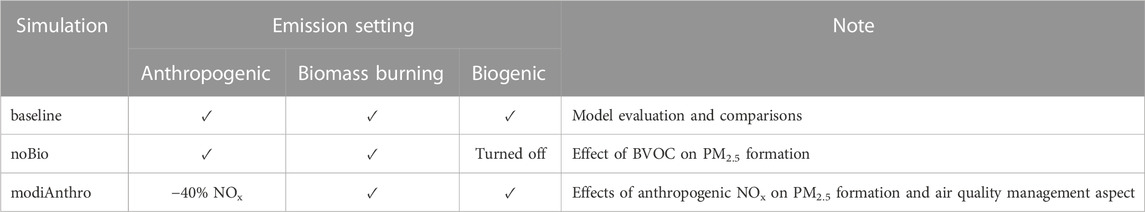
TABLE 2. Settings of sensitive model simulations.
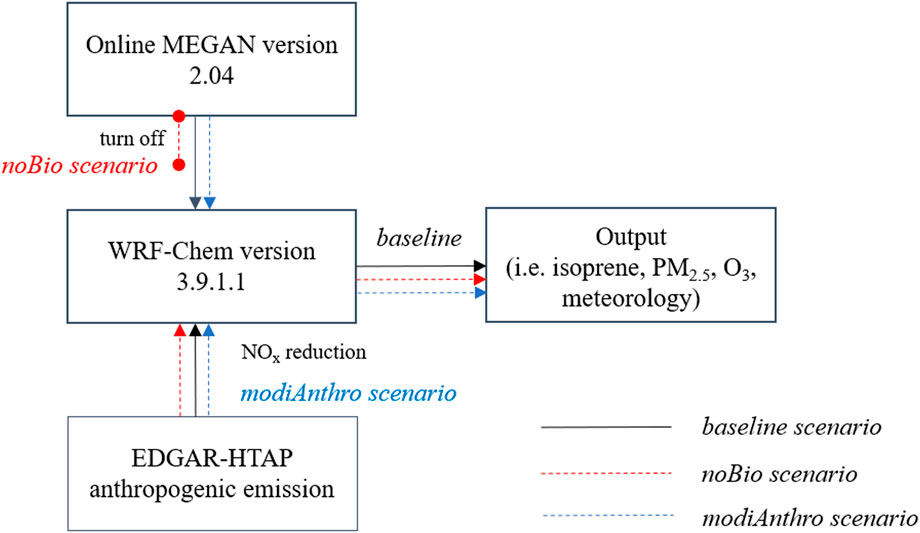
FIGURE 2. Model simulation designs and workflow diagram.
To evaluate the model performance, hourly meteorological parameters, including temperature T), relative humidity (RH) and wind speed (WS), were simulated. Chemical species, including ozone (O3) and fine particulate matter (PM2.5) extracted at the lowest vertical level, were compared to observations at the six monitoring stations (i.e., station ID: 35t, 37t, 38t, 57t, 68t, and 67t) during the two study periods. Statistical analyses that included mean values and standard deviations (
where Mi = simulation and Oi = observation.
To evaluate the effects of BVOC and NOx emissions on O3 and PM2.5 formation and PM2.5 compositions over the northern region of Thailand, the O3 and PM2.5 concentrations from the alternative scenarios (the second and the third scenario) were compared to the results obtained from the baseline simulations as follows:
where X is the parameter value (i.e., O3 and PM2.5 concentrations).
During the study periods isoprene sampling was conducted at 42 m above ground level at the meteorological tower located in the Mae Moh forestry plantations of Lampang Province using a thermal desorption sorbent tube connected to a pump. Air was drawn at a flow rate of 200 mL·min−1 for 30 min per sample. The sampling was then performed from 9 a.m. to 5 p.m. on the days of the investigation. The sample tubes were preserved under low temperatures (0°C–4°C) during transportation prior to analysis by employing the thermal desorption gas chromatography mass spectrometry (TD-GC–MS) method (GC-Clarus 690, MS-Clarus SQ8 T from Perkin-Elmer and TD100-xr from Markes International Ltd.). The isoprene concentrations were used in model evaluation of isoprene and used as supporting information for discussions.
The results from the model evaluation are presented in Supplementary Table S1. According to the meteorological parameters, the model showed a potential to reproduce the variations of T (r extending to 1.0) and RH (r ≥ 0.7), but it barely captured the relevant variations of WS. Overall, the model tended to under-predict T with FBs values ranging from −0.01 to −0.2 and RMSEs values ranging from 1.7°C to 3.4°C. RH was more likely to be overpredicted with FBs values ranging from 0.04 to 0.2; however, at the 57t and 38t monitoring stations, the model tended to under-predict RH values in November with FBs values of −0.04 and −0.03, respectively. The model normally overpredicted WS with FBs values ranging from 0.6 to 1.3 and RMSEs values ranging from 0.7 to 2.5 m·s−1. The model performance in our study was comparable to that of another study in terms of similar ranges of FB and RMSE values. In a study conducted by Chen et al. (2016), T2 (temperature at 2 m from the surface) calculated by the WRF-Chem Model over China was underpredicted with biases ranging from −0.24°C–1.10°C and RMSEs values ranging from 1.90°C to 3.25°C. However, WS was overpredicted with biases ranging from 0.36 to 1.50 m·s−1 and RMSEs values ranging from 1.39 to 2.10 m·s−1. Wang et al. (2016) reported that humidity values simulated from the WRF-chem Model over east Asia and over northern China were overpredicted.
For the evaluation of chemical species, the model exhibited a good ability to capture the diurnal variations of O3 with r ≥ 0.7. The average observed concentrations of O3 recorded in June and November ranged from 15.1 to 27.7 ppb and 10.9–24.0 ppb; while those same values from the baseline simulation ranged from 23.7 to 35.4 ppb and from 20.0 to 35.1 ppb, respectively. The comparisons revealed that the model tended to overpredict O3 with FBs values ranging from 0.01 to 0.9 and RMSEs values ranging from 7.4 to 19.0 ppb. The diurnal variation of O3 from the observation and the baseline simulation during 16–23 June 2021 and during 24 November to 1 December 2021 are shown in Supplementary Figures S1, S2. Possible causes of O3 overestimations are 1) the MOZART-MOSAIC mechanism that tends to overestimate O3 and 2) low anthropogenic NOx emissions over the study area. Georgiou et al. (2018) compared three simulations utilized by the CBMZ-MOSAIC, MOZART-MOSAIC, and RADM2-MADE/SORGAM chemical mechanisms over the Eastern Mediterranean using the WRF/Chem model. The study revealed that the monthly average O3 simulated by the MOZART-MOSAIC overestimated by 23%, while the MOSAIC aerosol mechanism highly overestimates PM2.5 concentrations (NMB ≥100%). Over the northern region of Thailand, the concentrations of NOx were underestimated which low NOx concentrations might cause low O3 loss by NO during nighttime, resulting in high nighttime residual O3 and enhances the concentrations of O3 during daytime.
Unlike the O3 simulations, the model had difficulty in simulating PM2.5 levels. The average PM2.5 concentrations at the monitoring stations ranged from 10.4 to 21.1 μg·m−3 and 11.2–22.1 μg·m−3 in June and November, respectively. However, the model showed extremely low PM2.5 concentrations in June (1.6–5.6 μg·m−3) and very low concentrations in November (5.5–11.3 μg·m−3). The model underpredicted the PM2.5 concentrations with FBs values ranging from −1.7 to −0.2 and RMSEs values ranged from 0.7 to 21.4 μg·m−3. Reasonable O3 simulations, but a low degree of performance in simulating PM2.5 concentrations by performing the WRF-Chem Model with MOZART-MOSAIC chemical options, were reported in Bucaram and Bowman (2021). Accordingly; Bucaram and Bowman (2021) reported that the WRF-Chem Model with MOZART-MOSAIC four bins exhibited a good degree of performance to calculate O3 concentrations over the Northern Great Plains; however, hourly PM2.5 concentrations simulated from the model had a very low correlation to the applicable measurements. With regard to the EDGAR-HTAP emission inventory, only one anthropogenic source emitted discernable levels of PM2.5, as was depicted in the study area (Supplementary Figure S3). Based on its location, this emission source was probably the power plant situated in Lampang Province. The comparison between the concentrations of CO, NO2 and SO2 from the baseline simulation and those from the observation revealed that, overall, the model underestimated the concentrations of CO about 1.2–3.6 times, SO2 about 1.2–2.9 times and NO2 about 0.2–0.4 times compared to those from the observations. An exception to this occurred over Lampang province (the location of the power plant) which in November the model overestimated SO2 by far compared to those from the observation. Therefore, a lack of anthropogenic PM2.5 emissions and an overprediction of the wind speed in the study area could be two of the possible causes for the poor performance of the PM2.5 simulations.
The isoprene concentrations recorded from the observations ranged from 3,799.5 to 16,151.7 pptv (average 6,781.6 ± 3,614.1 ppt) in June and ranged from 1,655.6 to 7,489.8 pptv (average 4,528.5 ± 2,122.5 ppt) in November; while the values from the baseline simulations ranging from 352 to 5,547 pptv (average 1,820.1 ± 577.0 ppt) and from 612 to 6,152 pptv (average 1,853.4 ± 766.5 ppt), respectively. Overall, isoprene was underpredicted by about 3.7 times in June and by about 2.4 times in November when compared with the observations. Very low isoprene concentrations simulated from the model could be a possible reason for the underestimation of PM2.5.
The O3 concentrations recorded from the simulations are shown in Supplementary Table S2. The spatial distributions of O3, ΔO3(baseline-noBio), and ΔO3(baseline-modiAnthro) are shown in Figure 3. From the baseline simulation, the domain-wide average O3 concentrations were 26.4 ± 8.5 ppb in June and 35.7 ± 11.1 ppb in November; whereas, the values from the noBio simulation were 24.6 ± 6.1 ppb and 33.3 ± 8.8 ppb, respectively. Comparisons between the baseline and the noBio simulations showed that the presence of BVOC enhanced the domain-wide average O3 concentration in June 1.8 ppb (6.8%), while the highest O3 increment, as high as 12.3 ppb (34.8%), was recorded at the 67t monitoring station. In November, the domain-wide average O3 concentration increased by 2.4 ppb (6.7%) and the highest O3 increments [9.0 ppb (37.7%)] occurred at the 38t monitoring station. Comparisons between the baseline and the modiAnthro simulations showed that a 40% anthropogenic NOx emission reduction led to domain-wide O3 reductions of 1.2 ppb (4.5%) and 2 ppb (5.6%) in June and November, respectively. Due to the NOx emission reduction, decreases in O3 concentrations at the monitoring stations ranged from 0.4 to 3.0 ppb (1.7%–8.5%). In November, reductions in O3 concentrations occurred at the 35t, 57t, 68t, and 67t monitoring stations [0.9–3.7 ppb (3.0%–8.3%)]; while O3 increments [6.2 and 6.6 ppb (27.6% and 32.0%)] were recorded at the 37t and 38t monitoring stations. The O3 responses occurred due to changes in the BVOC and NOx levels and were supported by the spatial distributions of H2O2/HNO3 (Supplementary Figure S4). The H2O2/HNO3 ratio is an important photochemical indicator that can be used to identify VOC-limited and NOx-limited regimes. A VOC-limited regime is indicated when a value of H2O2/HNO3 was less than the transition value (ranges from 0.2 (Sillman, 1995; Hammer et al., 2002; Zhang et al., 2009), such as with 0.3–0.6 (Millard and Toupance, 2002) and 0.8 to 1.2 (Lam et al., 2005). The outcomes of our study indicate that the areas within the vicinity of the power plant were under VOC-limited regimes, where concentrations of O3 were more likely to vary according to the concentrations of VOC, while the other areas were determined to be NOx-limited.
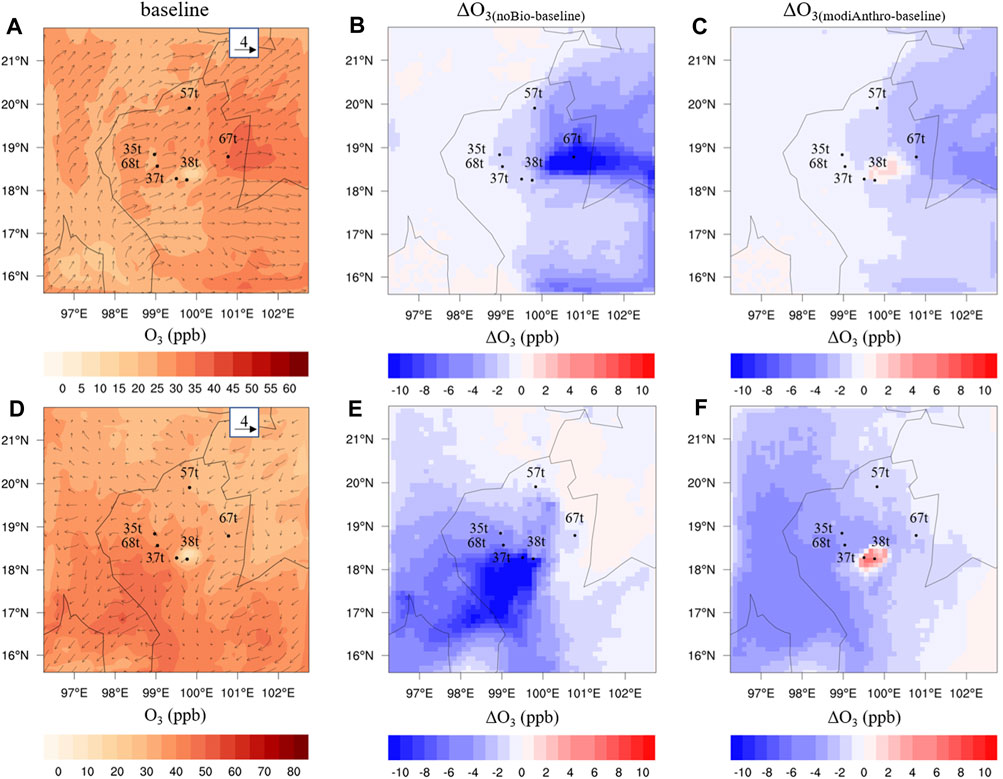
FIGURE 3. Spatial distribution of O3 from baseline simulation with wind vectors (1st column), spatial distribution of ΔO3(noBio-baseline) (2nd column), and ΔO3(modiAnthro-baseline) (3rd column) during the period from 16 to 23 June of 2021 (A–C), and those during the period from 24 November to 1 December of 2021 (D–F), respectively. Reddish and bluish colors refer to an increase in O3 and a decrease in O3 concentration compared to the O3 from the baseline simulations, respectively.
PM2.5 concentrations recorded from the simulations are presented in Supplementary Table S2. The spatial distributions of PM2.5 recorded from the base-line simulation, as well as the spatial distributions of ΔPM2.5(baseline-noBio), and ΔPM2.5(baseline-modiAnthro), are presented in Figure 4.
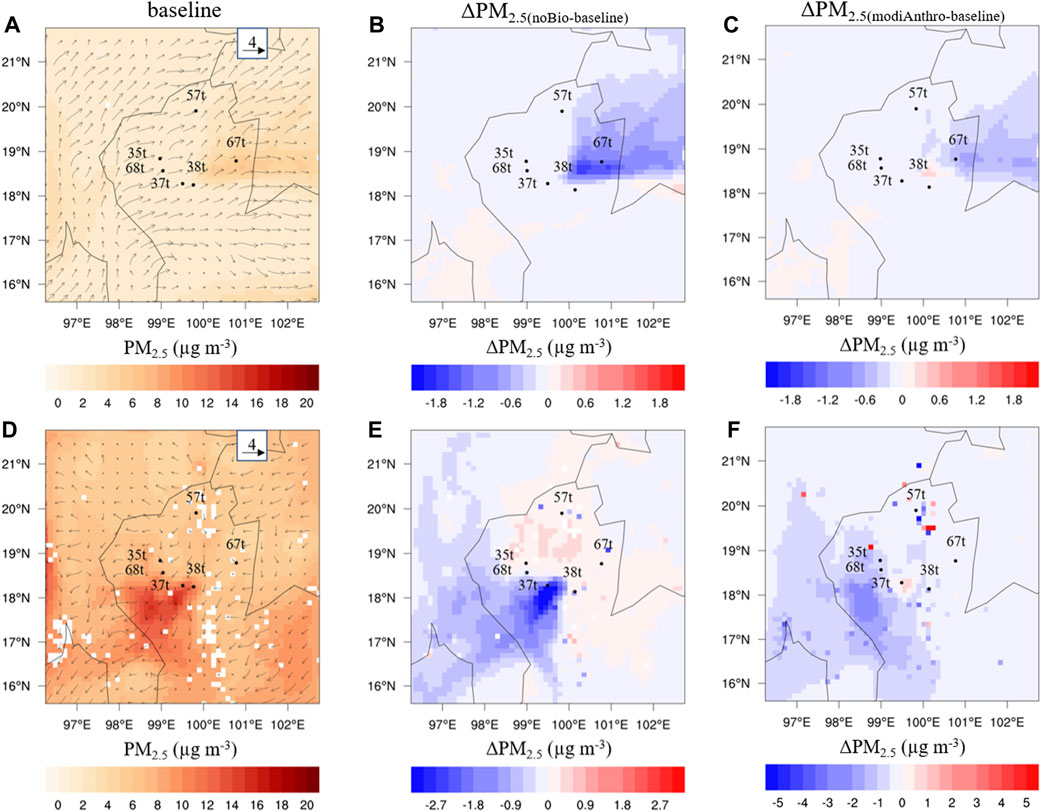
FIGURE 4. Spatial distribution of PM2.5 from baseline simulation with wind vectors (1st column), spatial distribution of ΔPM2.5(noBio-baseline) (2nd column), and ΔPM2.5(modiAnthro-baseline) (3rd column) during the period from 16 to 23 June of 2021 (A–C), and those during the period from 24 November to 1 December of 2021 (D–F), respectively. Reddish and bluish colors refer to an increase in PM2.5 and a decrease in PM2.5 concentration compared to the PM2.5 from the baseline simulations, respectively.
The sensitivity study revealed that the domain-wide average PM2.5 concentrations recorded from the baseline simulation were 1.9 ± 0.6 μg·m−3 in June and 7.1 ± 1.9 μg·m−3 in November; while those values from the noBio simulation were 1.8 ± 0.5 μg·m−3 and 6.9 ± 1.7 μg·m−3, respectively. Comparisons made between the baseline and the noBio simulations showed that BVOC tended to increase the domain-wide PM2.5 concentrations by about 0.1–0.2 μg·m−3 in June and November, respectively. In June, BVOC enhanced PM2.5 concentrations principally at the 57t and 67t monitoring stations (0.1 and 1.2 μg·m−3, respectively); whereas the PM2.5 levels were increased mainly at the 37t and 38t monitoring stations (2.5 and 2.3 μg·m−3, respectively) in November. A comparison between the baseline and the modiAnthro simulations revealed that, overall, a 40% reduction in anthropogenic NOx emissions resulted in a decrease in PM2.5 levels. The domain-wide averages in PM2.5 levels were decreased from 0.1 to 0.2 μg·m−3 (5.3% and 5.6%) in June and November, respectively. In general, the comparison between the noBio and the modiAnthro simulations suggest that the 40% reduction in NOx emissions (modiAnthro) has more impact than noBio to decrease the levels of PM2.5 over this area.
The domain wide average of PM2.5 chemical compositions from the simulations are illustrated in Figure 5. The results from all simulations showed that, in June, sulfate aerosol (SO4) was the dominant species (40.5%–43.4%), followed by inorganic aerosol (oin_a) (25.1%–26.0%), organic carbon aerosol (OC) (18.7%–19.3%), ammonium aerosol (NH4) (9.5%–10.7%), and glyoxal aerosol (Glyoxal) (1.0%–6.8%). In November, higher levels of organic carbon aerosol (48.6%–51.0%), followed by sulfate aerosol (26.2%–28.5%), ammonium aerosol (NH4) (9.8%–11.1%), glyoxal aerosol (Glyoxal) (4.1%–9.4%) and nitrate aerosol (NO3) (2.5%–4.6%). During this high biomass burning month, biomass burning resulting in SOA [simplified biomass burning SOA (smpbb_soa)] represented about 1.9%–2.3%, while the amount of inorganic aerosol (oin_a) became negligible (less than 1%).
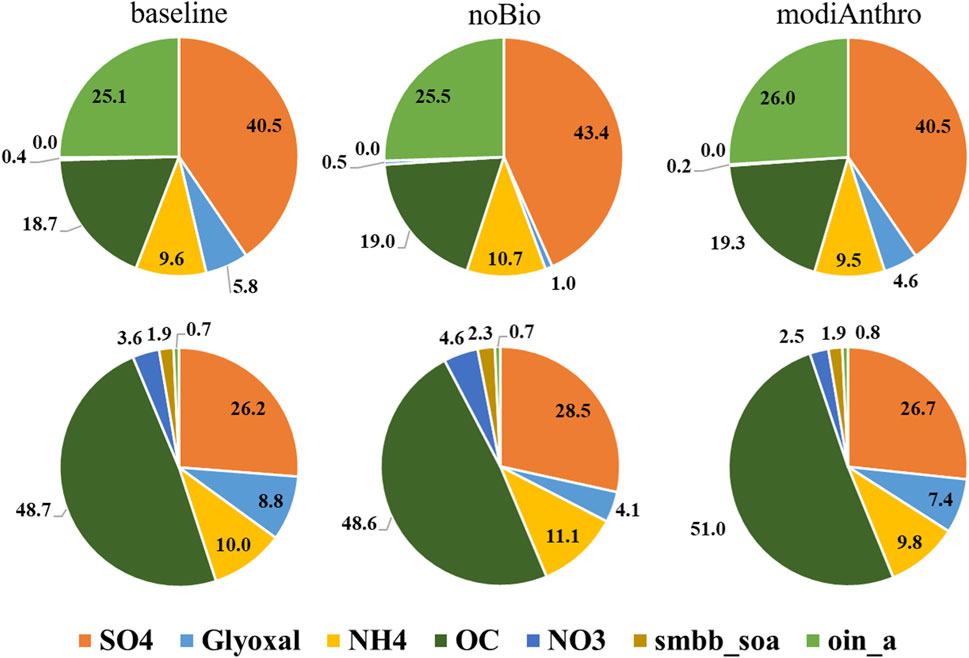
FIGURE 5. Domain wide average of PM2.5 chemical compositions including sulfate aerosol (SO4), secondary organic aerosol (SOA) from glyoxal (Glyoxal), ammonium aerosol (NH4), organic carbon aerosol (OC), nitrate aerosol (NO3), simplified biomass burning SOA (smpbb_soa) and inorganic aerosol (oin_a) during June and November 2021.
The proportions of aerosol compositions recorded from the simulations at the six monitoring stations were illustrated in Supplementary Figure S5; Supplementary Table S3. In general, proportions of aerosol compositions at the monitoring stations were similar to the domain wide average of PM2.5 chemical compositions. An exception to this occurred at the 67t monitoring station which reported that, in June, SOA levels derived from glyoxal were high (17%–25%) while the proportions of OC (4%–5%) and oin_a (10%–13%) were low. A possible cause of the high glyoxal proportions at the 67t monitoring station would be discussed in the proceeding section (SOA from glyoxal response).
A comparison between the baseline and noBio simulations revealed that changes in BVOC mainly affected the levels of SOA from glyoxal formation. The levels of SOA from glyoxal were enhanced from noBio to baseline in June (58.8%–95.0% as shown in Supplementary Table S3) and in November (25.6%–69.6% as shown in Supplementary Table S3) owing to the presence of BVOC (Supplementary Table S3). In November, small changes in SOA from glyoxal levels occurred due to biomass burning, which is a significant glyoxal source (Kaiser et al., 2015). The results showed that a significant decrease in the levels of SOA from glyoxal occurred in June (20.8%–25.4%) and November (1.5%–23.3%) due to the 40% anthropogenic NOx emission reduction.
Changes in the SNA system occurred because changes in the BVOC levels are complex. Comparisons between the baseline and the noBio simulations indicate that in June, sulfate, nitrate and ammonium species were generally elevated by 3.5%–7.7%, 25.9%–133.1% and 9.8%–13.8% (see Supplementary Table S3) due to the absence of BVOC, except at the 67t monitoring station. At this monitoring station, SNA species were reduced by 2.3%, 24.7% and 2.2%, respectively. In November, the absence of BVOC enhanced nitrate species from 13.8% to 125.0% and sulfate and ammonium levels over NOx-limited areas (35t, 57t, 68t, and 67t monitoring stations) with sulfate increments ranging from 11.0% to 29.3% and ammonium increments ranging from 15.6% to 37.5% due to the presence of BVOC. On the other hand, over VOC-limited areas (37t and 38t monitoring stations), the absence of BVOC led to reductions in sulfate (23.2%–23.9%) and ammonium (6.0%–8.4%).
A comparison between the baseline and the modiAnthro simulations indicated that the 40% anthropogenic NOx emission reduction was most likely responsible for reducing the SNA species from 37.7% to 71.8%, 0.7%–10.2% and 0.8%–4.5%, respectively in June. In November, nitrate levels were reduced from 2.5% to 68.6% due to the NOx emission reduction. Reductions in sulfate (1.7%–20.7%) and ammonium (4.5%–24.1%) were found over NOx-limited areas; while incremental changes in sulfate (17.8%–22.3%) and ammonium (1.0%–16.2%) were recorded over VOC-limited areas. It is noteworthy to mention that in June, an incremental increase in the sulfate level was expected to occur at the 67t monitoring station located in a VOC-limited area. However, sulfate species were reduced by 10.2% at this monitoring station when compared to the baseline simulation. The results suggest that either NOx-limited, VOC-limited or mixed regimes can significantly influence the SNA formation over our study areas.
In the simulations, the MOZART-MOSAIC chemistry scheme (Knote et al., 2014) form SOA from oxidizing VOCs particularly isoprene (dominant species) by OH to form glyoxal, then by glyoxal uptake into aqueous aerosols. These processes are influenced by several environmental factors. Therefore, the model needs to simulate the following parameters (which are location and time dependent) accurately: meteorology, gas-phase precursors of glyoxal, OH in the atmosphere, photolysis and ambient aerosol properties. In June, the noBio scenario utilized no biogenic volatile organic compound (BVOC) emissions. Since the majority of BVOC in this region come from isoprene, the noBio scenario implies that there was no biogenic isoprene used in the simulations. This reduced the SOA from glyoxal (5.8%–1%) thereby decreasing PM2.5 mass concentrations by approximately 5.3%. In the modiAnthro scenario, in which NOx is reduced, ammonium and nitrate decreased since NOx is a precursor of ammonium and nitrate. SOA from glyoxal also decreased due to the limited availability of OH radical. As OH is controlled by NOx - low NOx means low OH, low OH means BVOC is less oxidized, hence less glyoxal is formed from biogenic isoprene. On the other hand, the percentage of sulfate stayed the same, since NOx does not directly influence sulfate formation. Also, OC and OIN increased in percentage since OIN/OC (e.g., dust, soot) is not mixing with secondary aerosols (because secondary aerosols also decreased) therefore OIN/OC were not growing and therefore OIC/ON were not dry depositing. The end result is a decrease PM2.5 mass concentration by approximately 5.3%. November showed the same pattern as June except for a higher percentage in OC since the biomass burning season has started in this time period. OIN is decreased significantly in percentage due to reduced resuspension due to lower convection (lower temperatures and lower wind speeds).
Even though this study has some limitations including 1) a short study period per season (8 days per season) due to the small number of isoprene observations and 2) lacking of Thailand’s national anthropogenic emission inventory, the study revealed remarkable results. About 63.8% of the northern region of Thailand is covered by forests, where high BVOC emissions are expected to occur. Since VOCs are one of the O3 and SOA precursors, we examined whether forests, which cover over 63.8% of the area in northern Thailand, can enhance air pollution in the region. Also, in this study, relationships between reductions in BVOC and anthropogenic NOx emissions from the power plant, as well as decreases in O3 and PM2.5 concentrations in this region, were investigated. Our study revealed that the formation of O3 over the northern region of Thailand was sensitive to changes in NOx rather than changes in VOCs emissions. Since this region is more likely to be NOx-limited, NOx emission controls are considered an effective strategy for reducing O3 levels. However, a VOC-limited regime could be observed near the lignite mine and power plant, while both VOC and NOx emission controls may be necessary. Unlike O3, PM2.5 seems to be less sensitive to changes in BVOC and NOx emissions, while the formation of PM2.5 is highly complicated. Even though proportions of glyoxal and nitrate species change directly in relation to BVOC and NOx emissions, respectively, other compositions may respond to changes in these emissions and appear to move in the opposite direction. In June, a 40% reduction in anthropogenic NOx and a reduction in PM2.5 levels were almost compatible with those associated with zero BVOC emission. In November, higher PM2.5 reductions were observed due to the anthropogenic NOx reductions; even though some small PM2.5 increases were recorded near the power plant. Finally, over the northern region of Thailand, the forests can be considered a source of PM2.5 emissions; however, these forests can contribute to PM2.5 levels by only 5.3%–5.6% of the total concentrations. According to a perspective of air quality management in the northern region of Thailand, some VOC and NOx anthropogenic emission controls are more practical and could be more effective as strategies designed to improve the air quality over northern Thailand.
The original contributions presented in the study are included in the article/Supplementary Material, further inquiries can be directed to the corresponding authors.
PU and RJ wrote sections of the manuscript. PU, RJ, and VS contributed to conception and design of the study. SB and RM assisted in the modeling and proof reading. WT and SC assisted in drafting and proof reading the manuscript. All authors contributed to manuscript revision, read, and approved the submitted version.
Funding from the National Research Council of Thailand (project: Secondary source and chemical mechanism of PM2.5 formation from physical-chemical reaction of biogenic volatile organic compounds above the forest canopy in northern Thailand, project ID: 31249) is gratefully acknowledged. Sincere appreciation is also expressed to the National Science and Technology Development Agency Supercomputer Center (ThaiSC) team for supporting the computational platform and for aiding in installing the WRF-Chem system. Air quality data obtained from the Pollution Control Department (PCD), the Ministry of Natural Resources and Environment of Thailand are also gratefully acknowledged.
The authors declare that the research was conducted in the absence of any commercial or financial relationships that could be construed as a potential conflict of interest.
All claims expressed in this article are solely those of the authors and do not necessarily represent those of their affiliated organizations, or those of the publisher, the editors and the reviewers. Any product that may be evaluated in this article, or claim that may be made by its manufacturer, is not guaranteed or endorsed by the publisher.
The Supplementary Material for this article can be found online at: https://www.frontiersin.org/articles/10.3389/fenvs.2023.1146437/full#supplementary-material
Aksoyoglu, S., Ciarelli, G., El-Haddad, I., Baltensperger, U., and Prévôt, A. S. H. (2017). Secondary inorganic aerosols in Europe: Sources and the significant influence of biogenic VOC emissions, especially on ammonium nitrate. Atmos. Chem. Phys. 17, 7757–7773. doi:10.5194/acp-17-7757-2017
Amnuaylojaroen, T., Barth, M. C., Emmons, L. K., Carmichael, G. R., Kreasuwun, J., Prasitwattanaseree, S., et al. (2014). Effect of different emission inventories on modeled ozone and carbon monoxide in Southeast Asia. Atmos. Chem. Phys. 14 (23), 12983–13012. doi:10.5194/acpd-14-9345-2014
Amnuaylojaroen, T., Inkom, J., Janta, R., and Surapipith, V. (2020). Long range transport of Southeast asian PM2.5 pollution to northern Thailand during high biomass burning episodes. Sustainability 12 (23), 10049. doi:10.3390/su122310049
Amnuaylojaroen, T., Macatangay, R. C., and Khodmanee, S. (2019). Modeling the effect of VOCs from biomass burning emissions on ozone pollution in upper Southeast Asia. Heliyon 5 (10), e02661. doi:10.1016/j.heliyon.2019.e02661
Bucaram, C. J., and Bowman, F. M. (2021). WRF-chem modeling of summertime air pollution in the northern Great Plains: Chemistry and aerosol mechanism intercomparison. Atmosphere 12, 1121. doi:10.3390/atmos12091121
Carslaw, K. S., Boucher, O., Spracklen, D. V., Mann, G. W., Rae, J. G. L., Woodward, S., et al. (2010). A review of natural aerosol interactions and feedbacks within the Earth system. Atmos. Chem. Phys. 10 (4), 1701–1737. doi:10.5194/acp-10-1701-2010
Chen, D., Liu, Z., Fast, J., and Ban, J. (2016). Simulations of Sulfate-Nitrate-Ammonium (SNA) aerosols during the extreme haze events over Northern China in October 2014. Atmos. Chem. Phys. 16, 10707–10724. doi:10.5194/acp-16-10707-2016
Claeys, M., Graham, B., Vas, G., Wang, W., Vermeylen, R., Pashynska, V., et al. (2004). Formation of secondary organic aerosols through photooxidation of isoprene. Science 303 (5661), 1173–1176. doi:10.1126/science.1092805
Friedl, M. A., McIver, D. K., Hodges, J. C. F., Zhang, X. Y., Muchoney, D., Strahler, A. H., et al. (2002). Global land cover mapping from MODIS: Algorithms and early results. Remote Sens. Environ. 83, 287–302. doi:10.1016/s0034-4257(02)00078-0
Fu, Y., and Liao, H. (2012). Simulation of the interannual variations of biogenic emissions of volatile organic compounds in China: Impacts on tropospheric ozone and secondary organic aerosol. Atmos. Environ. 59, 170–185. doi:10.1016/j.atmosenv.2012.05.053
Georgiou, G. K., Christoudias, T., Proestos, Y., Kushta, J., Hadjinicolaou, P., and Lelieveld, J. (2018). Air quality modelling in the summer over the eastern mediterranean using WRF-chem: Chemistry and aerosol mechanism intercomparison. Atmos. Chem. Phys. 18, 1555–1571. doi:10.5194/acp-18-1555-2018
Grell, G. A., and Freitas, S. R. (2014). A scale and aerosol aware stochastic convective parameterization for weather and air quality modeling. Atmos. Chem. Phys. 14 (10), 5233–5250. doi:10.5194/acp-14-5233-2014
Guenther, A. B., Jiang, X., Heald, C. L., Sakulyanontvittaya, T., Duhl, T., Emmons, L. K., et al. (2012). The model of emissions of gases and aerosols from nature version 2.1 (MEGAN2.1): An extended and updated framework for modeling biogenic emissions. Geosci. Model Dev. 5, 1471–1492. doi:10.5194/gmd-5-1471-2012
Guenther, A., Hewitt, C. N., Erickson, D., Fall, R., Geron, C., Graedel, T., et al. (1995). A global model of natural volatile organic compound emissions. J. Geophys. Res. 100 (D5), 8873. doi:10.1029/94jd02950
Hallquist, M., Wenger, J. C., Baltensperger, U., Rudich, Y., Simpson, D., Claeys, M., et al. (2009). The formation, properties and impact of secondary organic aerosol: Current and emerging issues. Atmos. Chem. Phys. 9 (14), 5155–5236. doi:10.5194/acp-9-5155-2009
Hammer, M. U., Vogel, B., and Vogel, H. (2002). Findings on H2O2/HNO3 as an indicator of ozone sensitivity in Baden-Württemberg, Berlin-Brandenburg, and the Po valley based on numerical simulations. J. Geophys. Res. Atmos. 107 (D22), LOP 3-1–LOP 3-18. 8190. doi:10.1029/2000jd000211
Hong, S. Y., and Lim, J. O. J. (2006). The WRF single-moment 6-class microphysics scheme (WSM6). J. Korean Meteorological Soc. 42 (2), 129151.
Iacono, M. J., Delamere, J. S., Mlawer, E. J., Shephard, M. W., Clough, S. A., and Collins, W. D. (2008). Radiative forcing by long-lived greenhouse gases: Calculations with the AER radiative transfer models. Geophys. Res. Atmos. 113 (13), D13103–D13109. doi:10.1029/2008JD009944
Janic, Z. I. (2001). “Nonsingular implementation of the Mellor-Yamada level 2.5 scheme in the NCEP Meso model,” in Office note (national Centers for environmental prediction), 437, 38–40.
Janjic, Z. (2019). The surface layer parameterization in the NMM models. College Park, Maryland, USA: U.S. Department of Commerce National Oceanic and Atmospheric Administration National Weather Service National Centers for Environmental Prediction.
Janssens-Maenhout, G., Crippa, M., Guizzardi, D., Dentener, F., Muntean, M., Pouliot, G., et al. (2015). HTAP_v2.2: A mosaic of regional and global emission grid maps for 2008 and 2010 to study hemispheric transport of air pollution. Atmos. Chem. Phys. 15, 11411–11432. doi:10.5194/acp-15-11411-2015
Kaiser, J., Wolfe, G. M., Min, K. E., Brown, S. S., Miller, C. C., Jacob, D. J., et al. (2015). Reassessing the ratio of glyoxal to formaldehyde as an indicator of hydrocarbon precursor speciation. Atmos. Chem. Phys. 15 (13), 7571–7583. doi:10.5194/acp-15-7571-2015
Khodmanee, S., and Amnuaylojaroen, T. (2021). Impact of biomass burning on ozone, carbon monoxide, and nitrogen dioxide in Northern Thailand. Front. Environ. Sci. 9, 641877. doi:10.3389/fenvs.2021.641877
Knote, C., Hodzic, A., Jimenez, J. L., Volkamer, R., Orlando, J. J., Baidar, S., et al. (2014). Simulation of semi-explicit mechanisms of SOA formation from glyoxal in aerosol in a 3-D model. Atmos. Chem. Phys. 14 (12), 6213–6239. doi:10.5194/acp-14-6213-2014
Kota, S. H., Schade, G., Estes, M., Boyer, D., and Ying, Q. (2015). Evaluation of MEGAN predicted biogenic isoprene emissions at urban locations in Southeast Texas. Atmos. Environ. 110, 54–64. doi:10.1016/j.atmosenv.2015.03.027
Lam, K. S., Wang, T. J., Wu, C. L., and Li, Y. S. (2005). Study on an ozone episode in hot season in Hong Kong and transboundary air pollution over Pearl River Delta region of China. Atmos. Environ. 39 (11), 1967–1977. doi:10.1016/j.atmosenv.2004.11.023
Lelieveld, J., Barlas, C., Giannadaki, D., and Pozzer, A. J. A. C. P. (2013). Model calculated global, regional and megacity premature mortality due to air pollution. Atmos. Chem. Phys. 13 (14), 7023–7037. doi:10.5194/acp-13-7023-2013
Li, J., Li, L., Wu, R., Li, Y., Bo, Y., and Xie, S. (2016). Inventory of highly resolved temporal and spatial volatile organic compounds emission in China. Air Pollut. XXIV, WIT Trans. Ecol. Environ. 207, 79–86.
Marsh, D., Mills, M., Kinnison, D. E., Lamarque, J. -F., Calvo, N., and Polvani, L. M. (2013). Climate change from 1850 to 2005 simulated in CESM1(WACCM). J. Clim. 26, 7372–7391. doi:10.1175/JCLI-D-12-00558.1
Millard, F., and Toupance, G. (2002). “Indicators concept applied to a European city: The ile de France area during ESQUIF campaign,” in Air pollution modelling and simulation (Berlin, Heidelberg: Springer), 54–58.
Miller, C. C., Jacob, D. J., Marais, E. A., Yu, K., Travis, K. R., Kim, P. S., et al. (2017). Glyoxal yield from isoprene oxidation and relation to formaldehyde: Chemical mechanism, constraints from SENEX aircraft observations, and interpretation of OMI satellite data. Atmos. Chem. Phys. 17 (14), 8725–8738. doi:10.5194/acp-17-8725-2017
NCEP/National Weather Service/NOAA/U.S. Department of Commerce (2015). “NCEP GFS 0.25 degree global Forecast grids historical archive,” in Research data archive at the national center for atmospheric research, computational and information systems laboratory. updated daily. 10.5065/D65D8PWK (Accessed May 1, 2021).
Niu, G. Y., Yang, Z. L., Mitchell, K. E., Chen, F., Ek, M. B., Barlage, M., et al. (2011). The community noah land surface model with multiparameterization options (Noah-MP): 1. Model description and evaluation with local-scale measurements. J. Geophys Res. Atmos. 116 (12), D12109–D12119. doi:10.1029/2010JD015139
Pollution Control Department (PCD) (2023). Air4Thai. Available at: http://air4thai.pcd.go.th/webV3/#/Home (Accessed February 14, 2023).
Radchakitchanubagesa (2022). “gam-not maat-dtra-taan fun la-ong ka-naat mai gern 2.5 mai-kron nai ban-yaa-gaat doi tuua bpai Act,” in Radchakitchanubagesa, 139. (dton pi-set 163). Available at: https://ratchakitcha.soc.go.th/pdfdownload/?id=139D163S0000000002100 (Accessed July 8, 2022).
Royal Forest Department (2018). Executive report: Thailand forestry area database (in Thai). Bangkok, Thailand: Forest Royal Department, Ministry of Natural Resource and Environment.
Sharma, A., Ojha, N., Pozzer, A., Mar, K. A., Beig, G., Lelieveld, J., et al. (2017). WRF-chem simulated surface ozone over South Asia during the pre-monsoon: Effects of emission inventories and chemical mechanisms. Atmos. Chem. Phys. 17, 14393–14413. doi:10.5194/acp-17-14393-2017
Sillman, S. (1995). The use of NO y, H2O2, and HNO3 as indicators for ozone-NOx-hydrocarbon sensitivity in urban locations. J. Geophys. Res. Atmos. 100 (7), 14175–14188. doi:10.1029/94JD02953
Tanraksa, P. (2021). Chiang Mai '3rd most polluted city'. Bangkok Post. Available at: https://www.bangkokpost.com/thailand/general/2077759/chiang-mai-3rd-most-polluted-city.
Tasoglou, A., and Pandis, S. N. (2015). Formation and chemical aging of secondary organic aerosol during the β-caryophyllene oxidation. Atmos. Chem. Phys. 15 (11), 6035–6046. doi:10.5194/acp-15-6035-2015
Thai Meteorological Department (TMD) (2022). The climate of Thailand. Available at: https://www.tmd.go.th/en/archive/thailand_climate.pdf (Accessed May 17, 2022).
Tie, X., Madronich, S., Walters, S., Zhang, R., Rasch, P., and Collins, W. (2003). Effect of clouds on photolysis and oxidants in the troposphere. J. Geophys. Res. Atmos. 108 (D20), 4642. doi:10.1029/2003JD003659
Tsimpidi, A. P., Karydis, V. A., and Pandis, S. N. (2008). Response of fine particulate matter to emission changes of oxides of nitrogen and anthropogenic volatile organic compounds in the Eastern United States. J. Air and Waste Manag. Assoc. 58 (11), 1463–1473. doi:10.3155/1047-3289.58.11.1463
Wang, L., Zhang, Y., Wang, K., Zheng, B., Zhang, Q., and Wei, W. (2016). Application of weather research and forecasting model with chemistry (WRF/chem) over northern China: Sensitivity study, comparative evaluation, and policy implications. Atmos. Environ. 124, 337–350. doi:10.1016/j.atmosenv.2014.12.052
Wang, P., Chen, Y., Hu, J., Zhang, H., and Ying, Q. (2019). Source apportionment of summertime ozone in China using a source-oriented chemical transport model. Atmos. Environ. 211, 79–90. doi:10.1016/j.atmosenv.2019.05.006
Wang, Y., Zhang, Q. Q., He, K., Zhang, Q., and Chai, L. (2013). Sulfate-nitrate-ammonium aerosols over China: Response to 2000–2015 emission changes of sulfur dioxide, nitrogen oxides, and ammonia. Atmos. Chem. Phys. 13 (5), 2635–2652. doi:10.5194/acp-13-2635-2013
Wiedinmyer, C., Akagi, S. K., Yokelson, R. J., Emmons, L. K., Al-Saadi, J. A., Orlando, J. J., et al. (2011). The Fire INventory from NCAR (FINN): A high resolution global model to estimate the emissions from open burning. Geosci. Model Dev. 4, 625–641. doi:10.5194/gmd-4-625-2011
Wipatayotin, A. (2019). Chiang Mai air pollution worst in the world. Bangkok Post. Available at: https://www.bangkokpost.com/thailand/general/1643388/chiang-mai-air-pollution-worst-in-the-world.
World Health Organization (WHO) (2022). 7 million premature deaths annually linked to air pollution. Available at: https://www.dw.com/en/who-air-pollution-causes-7-million-premature-deaths-a-year/a-59264198.
Yang, W., Cao, J., Wu, Y., Kong, F., and Li, L. (2021). Review on plant terpenoid emissions worldwide and in China. Sci. Total Environ. 787, 147454. doi:10.1016/j.scitotenv.2021.147454
Yin, S., Wang, X., Zhang, X., Guo, M., Miura, M., and Xiao, Y. (2019). Influence of biomass burning on local air pollution in mainland Southeast Asia from 2001 to 2016. Environ. Pollut. 254, 112949. doi:10.1016/j.envpol.2019.07.117
Zhang, Y., Wen, X. Y., Wang, K., Vijayaraghavan, K., and Jacobson, M. Z. (2009). Probing into regional ozone and particulate matter pollution in the United States: 1. A 1 year cmaq simulation and evaluation using surface and satellite data. J. Geophys. Res. Atmos. 114 (D22), D22304. doi:10.1029/2009JD011898
Keywords: biogenic volatile organic compounds, ozone, secondary organic aerosols, anthropogenic NOx, glyoxal, WRF-chem model
Citation: Uttamang P, Janta R, Bran SH, Macatangay R, Surapipith V, Tala W and Chantara S (2023) Effects of biogenic volatile organic compounds and anthropogenic NOx emissions on O3 and PM2.5 formation over the northern region of Thailand. Front. Environ. Sci. 11:1146437. doi: 10.3389/fenvs.2023.1146437
Received: 17 January 2023; Accepted: 08 March 2023;
Published: 22 March 2023.
Edited by:
Cenlin He, National Center for Atmospheric Research (UCAR), United StatesReviewed by:
Yun Lin, University of California, Los Angeles, United StatesCopyright © 2023 Uttamang, Janta, Bran, Macatangay, Surapipith, Tala and Chantara. This is an open-access article distributed under the terms of the Creative Commons Attribution License (CC BY). The use, distribution or reproduction in other forums is permitted, provided the original author(s) and the copyright owner(s) are credited and that the original publication in this journal is cited, in accordance with accepted academic practice. No use, distribution or reproduction is permitted which does not comply with these terms.
*Correspondence: Radshadaporn Janta, cmFkc2hhZGFwb3JuQG5hcml0Lm9yLnRo; Pornpan Uttamang, cG9ybnBhbl91bUBtanUuYWMudGg=
Disclaimer: All claims expressed in this article are solely those of the authors and do not necessarily represent those of their affiliated organizations, or those of the publisher, the editors and the reviewers. Any product that may be evaluated in this article or claim that may be made by its manufacturer is not guaranteed or endorsed by the publisher.
Research integrity at Frontiers
Learn more about the work of our research integrity team to safeguard the quality of each article we publish.