 Deborah Simon Mwakapesa
 Xiaoji Lan2†
 Yaser Ahangari Nanehkaran
 Yimin Mao
94% of researchers rate our articles as excellent or good
Learn more about the work of our research integrity team to safeguard the quality of each article we publish.
Find out more
ORIGINAL RESEARCH article
Front. Environ. Sci., 02 March 2023
Sec. Environmental Informatics and Remote Sensing
Volume 11 - 2023 | https://doi.org/10.3389/fenvs.2023.1140834
Landslide susceptibility mapping (LSM) is a crucial step during landslide assessment and environmental management. Clustering algorithms can construct effective models for LSM. However, a random selection of important parameters, inconsideration of uncertain data, noise data, and large datasets can limit the implementation of clustering in LSM, resulting in low and unreliable performance results. Thus, to address these problems, this study proposed an optimized clustering algorithm named O-CURE, which combines: the traditional Clustering Using REpresentatives algorithm (CURE), that is, efficient for large datasets and noise data, the partition influence weight (PIW)-based method to enhance the selection of sample sets and the city block distance (CIBD) for processing of the uncertain data in CURE clustering during LSM modeling. A database containing 293 landslide location samples, 213 non-landslide samples, and 7 landslide conditioning factors was prepared for the implementation and evaluation of the method. Also, a Multicollinearity analysis was conducted to select the most appropriate factors, and all the factors were acceptable for modeling. Based on O-CURE, landslide density, and the partitioning around medoids (PAM) algorithm a susceptibility map was constructed and classified into very high (33%), high (18%), moderate (24%), low (13%), and very low (12%) landslide susceptible levels. To evaluate the performance of the O-CURE model, five statistic metrics including accuracy, sensitivity, specificity, kappa, and AUC were applied. The analysis shows that O-CURE obtained accuracy = .9368, sensitivity = .9215, specificity = .9577, kappa = .8496, and AUC = .896 is an indication of high-performance capability. Also, the proposed method was compared with the CURE algorithm, three existing clustering methods, and popular supervised learning methods. From this assessment, O-CURE outperformed the other clustering methods while showing significant and more consistent performance than the supervised learning methods. Therefore, we recommend that the O-CURE model and the constructed map can be useful in assessing landslides and contribute to sustainable land-use planning and environmental management in light of future disasters.
A landslide is a geo-environmental disaster initiated by rainfall, volcanoes, human activities, earthquakes, or other factors that causes slope instability (Chowdhuri et al., 2021b; Zhao and Zhao, 2021; Wang et al., 2022). Recently, because of the increased urbanization pressure, the magnitude and frequency of landslide disasters have increased greatly causing changes in the landscape leading to huge damages, and putting lives and resources in great danger (Wang et al., 2019; Wang et al., 2020; Azarafza et al., 2021). Thus, assessing and managing this disaster is vital to ensure safety, proper land use/planning, and environmental management. Consequently, to understand the nature and mechanism of landslides, and to reduce their impact in different parts of the world, researchers have developed various approaches for pre-disaster and post-disaster assessments (Pal and Chowdhuri, 2019; Solanki et al., 2022). Landslide susceptibility mapping (LSM) is a pre-disaster assessment that locates areas susceptible to landslides. It also portrays the degree of susceptibility, which provides information essential for land-use planning and environmental management (Chowdhuri et al., 2021b; Bourenane et al., 2021). LSM considers previous landslide data, and geological, topographic, geomorphological, and hydrological factors that contributed to landslide occurrence, and the modeling methods (Pourghasemi et al., 2018; Ling et al., 2022). In the past, most of the susceptibility maps were produced based on an expert’s judgment which consumes a lot of time and energy, and it is difficult to quantify its accuracy due to its subjective effects. Fortunately, with the development of computer technologies such as Geographic Information Systems, Remote Sensing, and advanced data collection methods, machine learning algorithms are widely used in this field (Chowdhuri et al., 2021a; Ganga et al., 2022; Zhang et al., 2022). These developments have significantly improved LSM accuracy and efficiency. In previous research studies several machine learning-based methods such as supervised learning (SL) and unsupervised learning (USL) algorithms have been applied and compared in LSM in different regions (Chowdhuri et al., 2021a; Mehrabi and Moayedi, 2021; Saha et al., 2021; Solanki et al., 2022). Nevertheless, none of them can be applicable and effective in all cases.
Although most SL methods [examples: (Benchelha et al., 2020; Nhu et al., 2020; Arabameri et al., 2021; Berhane et al., 2021; Mehrabi and Moayedi, 2021; Ruidas et al., 2022b; Ganga et al., 2022; Korma, 2022; Sheng et al., 2022)] are popular and may achieve high prediction accuracy, they require data with predefined labels (landslide or non-landslide labels). Moreover, to obtain high performance these methods require a large number of labeled samples during the training process. Because of these limitations, SL methods may not be applicable where there are a limited number of labeled samples as they are not always easy to obtain and may be expensive to acquire in abundance through image interpretation and site surveying, especially in a large study area. USL-based approaches are applied and have contributed to improving the implementation and the accuracy of LSM in such situations (Lei et al., 2018; Hu et al., 2021; Yimin et al., 2021; Mao et al., 2022; Su et al., 2022; Liu et al., 2023). USL-based methods such as clustering can be used to map the susceptibility areas, as they can identify the underlying structures in unlabeled datasets, hence, do not require data with predefined labels, and do not involve a training process during their implementation. With these advantages, they can widely be used in areas of various sizes (small to large sizes) (Yong et al., 2022).
Clustering is a common USL method that assigns a set of samples (mapping units) into some subclasses or clusters based on certain similarities so that samples in a certain subclass have a maximum similarity degree to those in other subclasses (Wang et al., 2017). Over decades, these methods have been widely used in other fields such as marketing research, pattern recognition, and image processing, but very rarely explored in LSM studies (Huang et al., 2020; Su et al., 2022). In recent years, making use of the advantages of these methods, some landslide researchers have also shown interest and conducted LSM studies using these methods (Wan et al., 2015; Wang et al., 2017; Hu et al., 2019; Mao et al., 2021a; Mao et al., 2021b; Hu et al., 2021; Pokharel et al., 2021; Yimin et al., 2021; Mao et al., 2022). From the analysis of these studies and other traditional clustering algorithms, some limitations were observed: the inability to detect subclasses with arbitrary shapes, sensitivity to noise, inability to perform well in large study areas with large datasets, and principally a standard method to process the uncertain data (rainfall) has not being obtained yet. These key disadvantages limit their performance in LSM modeling and give directions for further investigations and new approaches that will provide better performance results.
The clustering using representative (CURE) algorithm is an efficient algorithm for large datasets, that can detect arbitrarily shaped subclasses, and is insensitive to noise; a combination that can rarely be found in other clustering algorithms (Guha et al., 1998). However, the CURE algorithm uses a random approach to select sample sets (representative points), which may not always be correct and may result in incorrect clustering results (Xiufeng and Wei, 2011). Additionally, like other traditional clustering algorithms, the CURE algorithm works well with continuous and discrete data but not uncertain data which may also result in misleading clustering results (Ren et al., 2009). These two limitations can also hinder the application of the CURE algorithm in LSM modeling.
In this study, an optimized CURE (O-CURE) algorithm is proposed for LSM modeling. O-CURE targets to improve the performance of the CURE algorithm by addressing the above limitations, through integrating a partition influence weight (PIW) based method to enhance the selection of sample sets, and the city block distance (CIBD) to facilitate proper processing of the uncertain data in the CURE clustering. With these enhancements, O-CURE is implemented in LSM modeling for Baota District, one of the landslide-susceptible areas in Shaanxi Province, China. Moreover, to evaluate the performance of the O-CURE method, five statistic metrics are applied, i.e., accuracy, sensitivity, specificity, kappa, and AUC. Also, the traditional CURE, existing LSM clustering methods: Chameleon algorithm and an adaptive quadratic distance-CA-AQD (Yimin et al., 2021), Agglomerative Hierarchical Clustering algorithm based on Overlapped Interval Divergence distance-AHC-OLID (Mao et al., 2021a), and OPTICS algorithm using the Hausdorff distance-OA-HD (Hu et al., 2021) as well as Decision Tree-DT (Nikoobakht et al., 2022), Support Vector Machine-SVM (Nikoobakht et al., 2022), and Uncertain Decision Tree-DTU (Mao et al., 2017) supervised learning models were applied for comparison as benchmark methods using data from the same study area. Furthermore, the key objectives of this study are to develop an improved clustering method-the O-CURE algorithm for LSM modeling in Baota District and apply landslide density, attribute values, and the partitioning around medoids (PAM) algorithm to indicate the landslide susceptibility levels in the study area. The final susceptibility map will help to identify potential susceptible areas and will also be a helpful tool in assessing and managing landslide disasters to ensure safety, proper land-use planning, and environmental management.
The study area is Baota district (Figure 1), a 3,556 km2 mountainous area and part of the Loess Plateau, found in Yan’an city, Shaanxi Province, China. Its geographic coverage is approximately 109°14′E-110°07′E longitudes and 36°11′N-37°02′N latitudes, with elevation ranging between 800 m and 1400 m. Furthermore, topographically, there are two main rivers in this area: the Yanhe and Fenchuan rivers. The vegetation covers about 60% of the Fenchuan River basin and less than 30% of the northern Yanhe River basin. The geomorphology of the area is featured gorges and curved slopes. Geologically, there are sedimentary rocks and extensive quaternary loess deposits that dominate the area. The average annual temperature and rainfalls are 10°C and 550 mm respectively, and the heavy rainfall varies between 58 and 117 mm extending between June and October (Zhang and Liu, 2010). It has also been observed that rainfall triggers most landslides in the area (Mao et al., 2017; Hu et al., 2019; Mao et al., 2021a).

FIGURE 1. The study area: Baota District, Shaanxi Province, China.
In general, because of the complex nature of this area and as part of the Loess Plateau (also referred to as the Huangtu Plateau) that covers the upper and middle ranges of the Yellow River, the area has been exposed to extreme soil erosion, that is, highly associated with frequent landslides. Figure 2 shows pictures of some landslide events in the Baota District. Upon dealing with this issue, various authorities apply various measures such as LSM to manage and mitigate landslides and their consequences. We believe that this LSM study will be helpful in different ways toward achieving that goal.
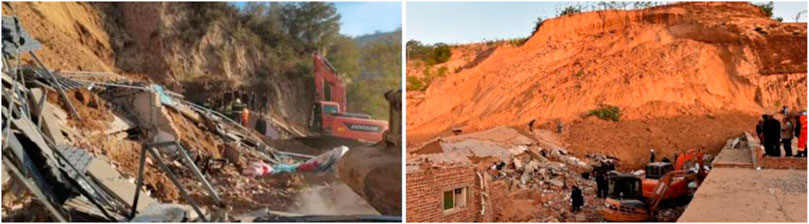
FIGURE 2. Landslides in Baota District, Yan’an City, China (In the year 2021).
To achieve the aim of this study, the following processes were carried out: 1) Preparation of research materials: a total of 506 samples (293 landslide samples and 213 non-landslide samples) were used to prepare a database; 2) A total of 7 landslide conditioning factors were prepared based on previous studies; 3) A Multicollinearity analysis was applied on the conditioning factors by using variance inflation factor (VIF) and tolerance (TOL); 4) Development of O-CURE method; 5) Landslide susceptibility mapping based on O-CURE; and 6) Evaluation of the model’s performance and comparison with other models based on standard evaluation metrics. The flow of the study is shown in Figure 3, and the detailed descriptions are given in the following sections.
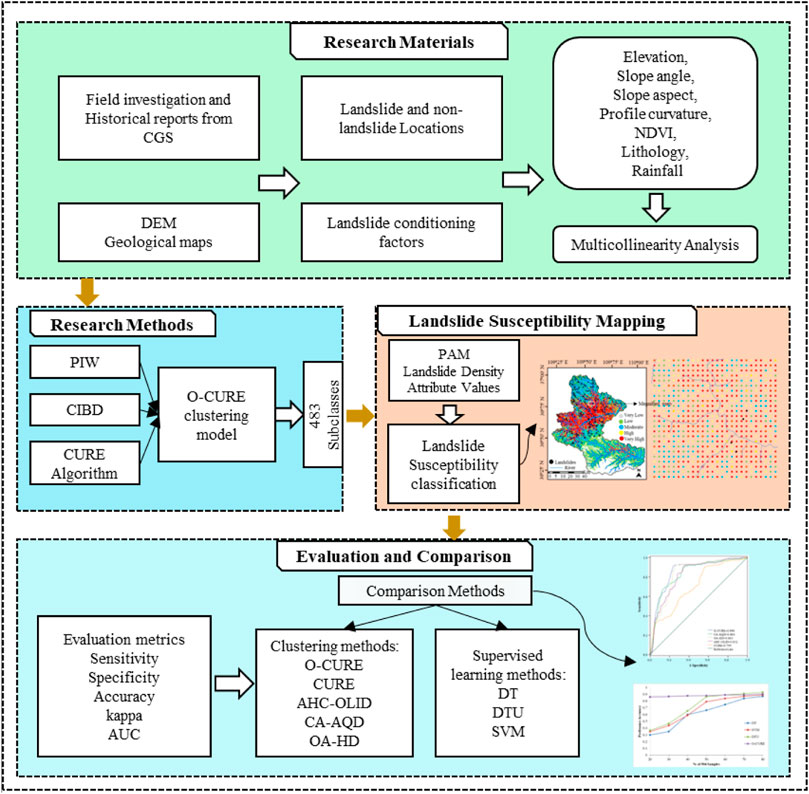
FIGURE 3. Flow diagram of the study.
The database containing information regarding the prevailing landslide distribution as well as the database containing geospatial distribution information of various factors such as locations, nature, size, and varieties of landslides is essential for the determination of the likelihood of landslides occurrence in addition to conducting LSM. The database demonstrating the Baota district landslide survey information was obtained from the Xi’an Center of Geological Survey (CGS). It was prepared based on analysis of 1081 locations from RS of SPOT-5 satellite images for the whole study area and Quick-Bird satellite images of 225 km2 of the urban area; field surveys, and from analysis of the historic data, whereby, 293 landslides were observed in the study area (indicated by black spots in the study area map (Figure 1) and details of some landslides are presented in Table 1). The landslides are of rotational and translational types with most of them being rotational landslides (Mao et al., 2017). Moreover, in terms of size, the landslides are reported to be large (ranging between 102× 104 and 103 × 104 m3), medium (between 101× 104 and 102 × 104 m3), and small sizes (less than 101 × 104 m3); medium-sized landslides are more (about 52.6%) (Mao et al., 2021b). Also, the database showed that 84.6% of the landslide events in this area happen between June and October (the rainy season). The recorded landslides were used for LSM modeling in this study.
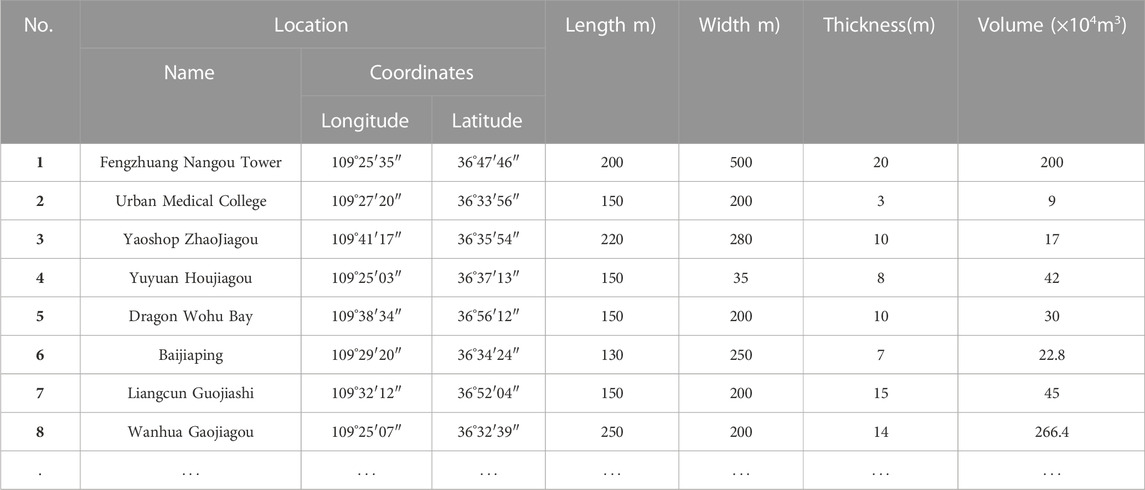
TABLE 1. Details of some landslides.
Landslide occurrences are associated with various conditioning factors, and the process of selecting those factors is very essential during landslide susceptibility mapping. There is no standard for the selection of these factors, and different studies select their factors based on various criteria. Based on previous research studies in Baota District (Hu et al., 2019; Mao et al., 2021a; Mao et al., 2021b), we selected 7 landslide-conditioning factors for modeling: elevation, slope angle, slope aspect, profile curvature, lithology, vegetation coverage index (NDVI), and rainfall. The elevation factor is associated with landslide occurrences, especially in plateau areas (Lee et al., 2018). Slope angle has significant effects on material sliding and the flow of water under the influence of gravity thus affecting the slope stability (Tran et al., 2021). In this area, slope stability is between 25° and 55°, and elevation ranges from 20m to 120 m. The profile curvature affects the water movement on the surface of the Earth resulting in landslide occurrence (Nohani et al., 2019). Lithology is the material basis of landslides and an essential factor in determining the type of rocks/soil exposed to landslides (Zhao and Zhao, 2021). NDVI is an essential ecological factor linked with the soil structure (Youssef and Pourghasemi, 2021; Ling et al., 2022), and its values were obtained using a commonly applied method described in (Ling et al., 2022). Rainfall factor was also selected because frequent rain waters can easily penetrate the soils due to sinkholes, loess structural joints, and weathering fractures, forming saturated areas on impermeable layers, which leads to a reduction in soil strength and gravity, creating pore water pressure and increase in the weight of the rocks and soil mass. The selection of this factor is also supported by the historic reports that recorded the frequency of landslide events during the rainy season (Zhang and Liu, 2010; Hu et al., 2019). Figure 4A–G represents the thematic maps for the factors whereby: maps for elevation, slope angle, slope aspect, and profile curvature were generated from DEM at a 25 m resolution and a scale of 1:10,000, NDVI and lithology maps were developed from ETM+ remote sensing images, and geology map at a scale of 1:50,000 respectively, and the rainfall map was created based on meteorological data at a scale of 1:50,000. The process of creating the thematic maps for the factors was aided by GIS—the ArcGIS 10.2 platform. For LSM modeling, these landslide conditioning factors will be here referred to as attributes. The attributes are further described in Table 2.
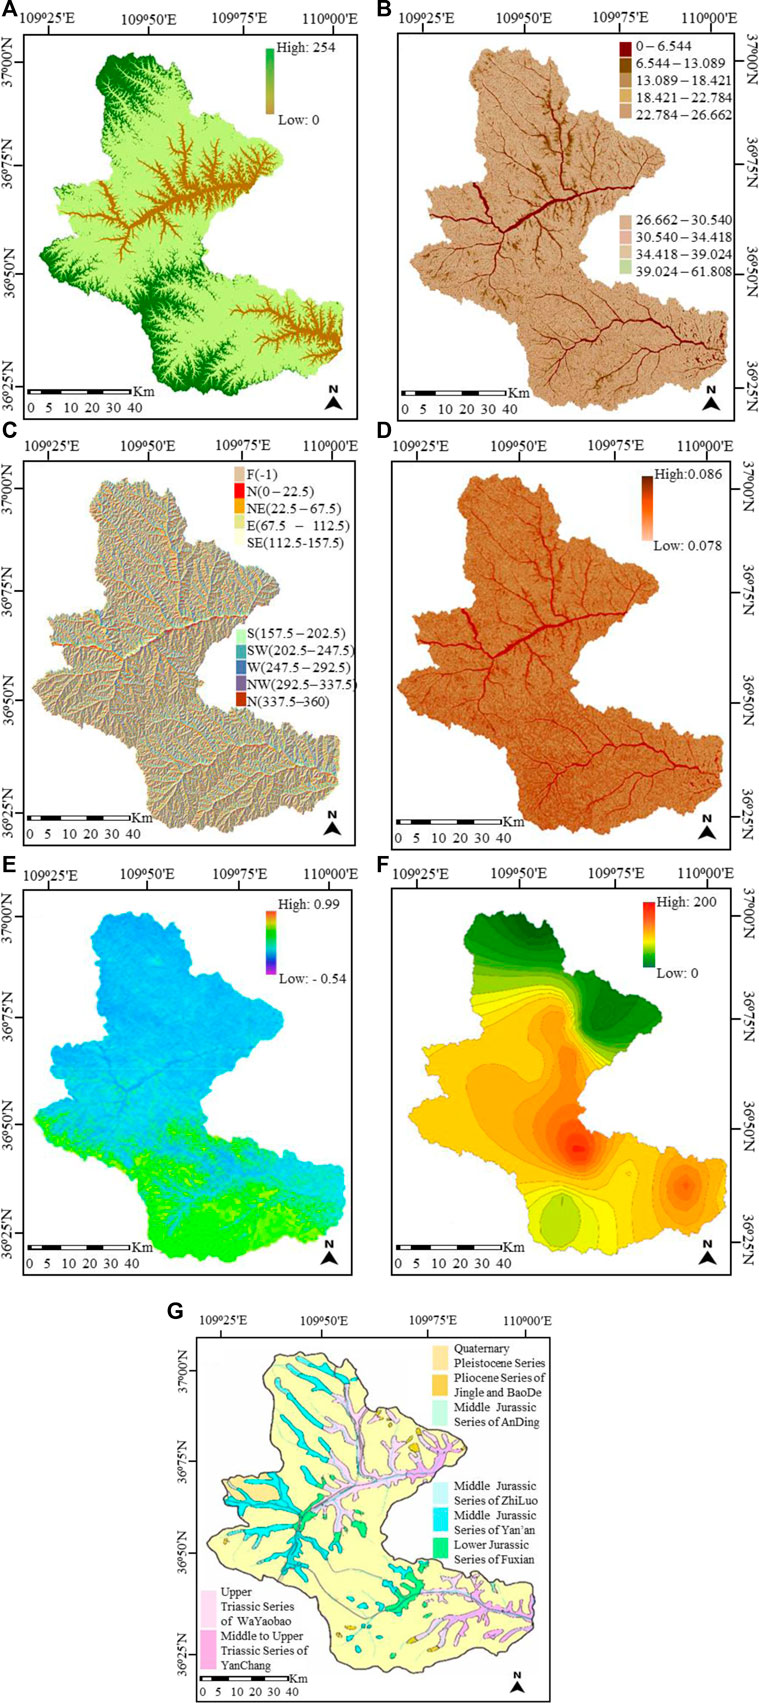
FIGURE 4. The thematic maps of the landslide conditioning factors (A) Elevation (B) Slope angle (C) Slope aspect (D) Profile curvature (E) NDVI (F) Rainfall (G) Lithology.
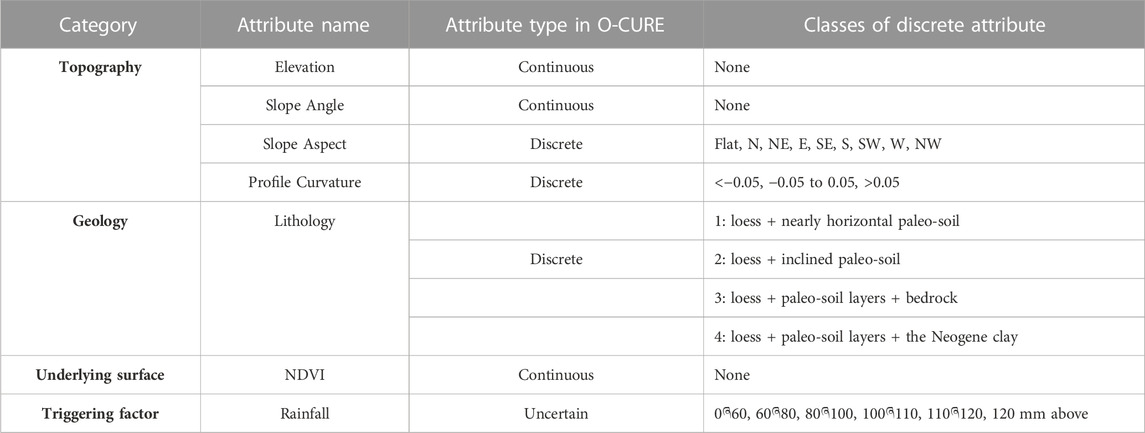
TABLE 2. Attributes description.
Generally, the applied dataset contained 5,672,922 mapping units (with an area of 25 × 25 m per mapping unit) of both landslide location data and non-landslide location data acquired from the study area raster map and the attribute values for each mapping unit. After the compilation of all these data, the data was systematically processed and analyzed first in ArcGIS 10.2 software, and Microsoft Excel.
This analysis is conducted for a better understanding of the selected factors and to determine if there is Multicollinearity or correlation among them. For this purpose, in this study, variance inflation factor (VIF) and tolerance (TOL) were applied (Ruidas et al., 2021; Pal et al., 2022). VIF computes the extent of correlation between an independent factor and other factors in a model, and it is interpreted as VIF = 1 means factors are not correlated, VIF between 1 and 5 means factors are moderately correlated, and VIF >5 indicates high correlation among the factors. TOL is the reciprocal of VIF, and its values are between 0 and 1 (Chen and Chen, 2021; Jaydhar et al., 2022; Zhang et al., 2022). VIF and TOL are computed using the following functions:
CURE is an efficient clustering algorithm that performs classification tasks in large datasets (Qian et al., 2002; Nsengiyumva et al., 2018). It is more robust to noise compared with other clustering methods and can identify arbitrarily shaped. CURE uses a defined number of representative points to describe the cluster and creates a hierarchy of clusters using a bottom-up approach (Guha et al., 1998; Cai and Liang, 2018). This means the algorithm begins by obtaining a small sample of data and treats each point in the data as a single cluster. Then, it randomly selects a small set of well-dispersed points from each cluster to be representative points (RePts) of those clusters and calculates the Euclidean distance between the RePt of one cluster and the RePt of other clusters. The Euclidean distance between two n-dimensional RePts (say
The algorithm then shrinks the RePts and merges two clusters with the closest RePts. The shrinking and merging process repeats until the desired clusters are obtained. Figure 5 illustrates the basic steps of the CURE algorithm.
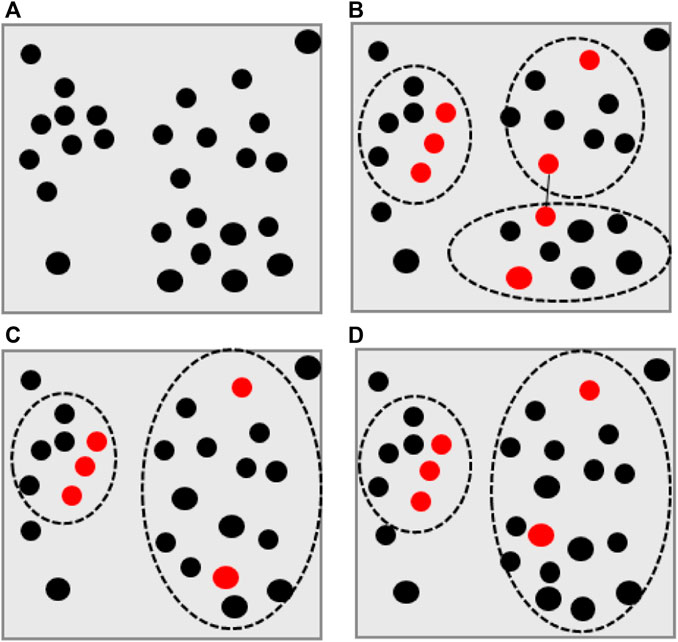
FIGURE 5. The basic steps of the CURE algorithm (A) A sample of data selected from a large dataset (B) Four clusters of current clustering (C) representative points (red points) selected from each cluster (D) After shrinkage of the representative points the clusters with closest representative points are merged.
In light of its advantages, the CURE algorithm is adopted in this study as the basic algorithm for LSM modeling. However, the algorithm has some fundamental problems including 1) the use of a random approach to select representative points, which may result in incorrect clustering results; 2) Like in most of the traditional clustering algorithms, the Euclidean distance used to calculate distance between points cannot work well with uncertain data, which can also affect the clustering results (de Souza and De Carvalho, 2004; Ren et al., 2009).
The O-CURE algorithm is proposed to improve the performance of the CURE algorithm by overcoming the fundamental problems of the CURE algorithm. It is developed by introducing the PIW-based methods to enhance the selection of RePts, and the CIBD-based method to process the uncertain data in the CURE algorithm.
This method selects the RePts by considering the influence of the partition where the RePts are positioned in the cluster and facilitates the effective elimination of noise points during clustering thus improving the quality of the clusters. Also, this method ensures that the dataset can be processed more efficiently and the selected points can describe the dataset more accurately (Cai and Liang, 2018).
Assuming
Wherein,
To select the appropriate RePts, the
This selection process will be repeated until the appropriate RePts are selected.
Uncertain data is the type of data, that is, in some range, and its specific value is not well-known (Ren et al., 2009). This data is presented with its lower and upper bounds such as
Thus, to calculate the distance between data points in the CURE algorithm, the CIBD (de Souza and De Carvalho, 2004) is applied, which can facilitate the successful processing of uncertain data, whereas, the other data types will be considered as special uncertain data with
Let
Thus, by merging the PIW-based method and CIBD into the CURE algorithm, the proposed O-CURE algorithm is summarized in the following steps.
Step 1:. Select a small sample of data and cluster it using a bottom-up hierarchical approach.
Step 2:. Calculate η and
Step 3:. If
Step 4:. Based on the uncertain data model, apply CIBD to calculate the distance between the RePt of the clusters, and find the minimum distance (Dmin) between the RePt of one cluster and the RePt of the other clusters.
Step 5:. Shrink every RePt to a fixed fraction (about 20% or 30%) of the original distance between its current position and its cluster centroid.
Step 6:. Use Dmin to merge two clusters whose pair of RePt, one from each cluster, that are sufficiently close.
Step 7:. After every such merging, select a new RePt to represent the new cluster.
Step 8:. Repeat the merging step until there are no sufficiently close clusters left.
Note:. Points in this algorithm are referred to as mapping units (described by the attribute values) in LSM modeling.
The O-CURE clustering method grouped the mapping units (points as used in the algorithm) to their respective subclasses but did not indicate the susceptibility levels in the subclasses. Thus, to do that, in this study, the PAM clustering algorithm and Landslide Density were applied.
PAM (Rdusseeun and Kaufman, 1987) is a clustering algorithm that partitions data into some clusters based on m selected points called medoids which represent the number of clusters to be obtained. In this study, PAM is applied to partition the subclasses obtained from the O-CURE algorithm, into five landslide susceptibility levels (hence, m = 5). The algorithm follows the steps below.
Step 1Fix the value of m to 5, to represent the number of susceptibility levels
Step 2From the input data randomly choose 5 subclasses as medoids m) for each susceptibility level
Step 3Each subclass gets assigned to the susceptibility level to which its nearest medoid belongs.
Step 4For each subclass of susceptibility level i, its distance from all other subclasses is computed and added. The subclass of ith susceptibility level for which the computed sum of distances from other subclasses is minimal is assigned as the medoid for that susceptibility level.
Step 5Steps (3) and (4) are repeated until the medoids stop changing.
Landslide density [LD (Hu et al., 2019)] is computed using the number of landslides per square kilometer (km2) of a mapping unit in a subclass and is applied to specify the susceptibility level of that subclass. When the number of landslides in a subclass is zero, which means the LD is also equal to zero, then, the attribute values (which describe more the characteristics of the area) based on geology expertise were applied to specify the susceptibility level.
The developed LSM models need to be validated to check their prediction capability (Pham et al., 2020; Pal et al., 2022), and up to date, there are no universal metrics to perform this task. In this study, we apply some standard and popular statistical metrics, namely, accuracy (Ac, for the correctly predicted landslide and non-landslide samples), sensitivity (St), specificity (Sp), kappa (ka), and AUC, plotted using Sensitivity (y-axis) against 1-Specificity (x-axis) (Su et al., 2021; Ling et al., 2022). These metrics are computed using four prediction indices: true positive (tp), true negative (tn), false positive (fp), and false negative (fn) (Dou et al., 2020; Pham et al., 2020; Pal et al., 2022). Tp and fp are the landslide samples that have been correctly predicted as landslide and non-landslide samples respectively, while, tn and fn are the landslide samples that have been incorrectly predicted into landslide and non-landslide classes respectively. The metrics are expressed in the equations below:
Whereby
Ac and ka close to 1 indicate that the model is reliable, while close to 0 means the model is not reliable and has very poor performance (Landis and Koch, 1977; Ruidas et al., 2022a). Also, when AUC is almost 1 implies that the model is perfect while when AUC = .5 means the model is inaccurate (Huang and Ling, 2005; Jaydhar et al., 2022).
To assess the performance of the proposed method for landslide susceptibility modeling, its results were compared with four other clustering methods CURE, CA-AQD, AHC-OLID, and OA-HD. CA-AQD, AHC-OLID, and OA-HD clustering methods were previously developed to also address the uncertain data processing problem and were implemented in the same study area, and they are here compared with the newly proposed model. The comparison is based on the evaluation metrics mentioned above. Furthermore, using the same dataset the performance of the model was also compared with three supervised learning methods, namely, decision tree (DT), uncertain decision tree (DTU), and support vector machine (SVM) based on their performance accuracies. DT is a popular decision-making algorithm that applies a tree-structured model of decisions and their possible outcomes, such as landslide event outcomes. DTU is an improved DT algorithm based on uncertain data processing that was previously proposed and implemented in Baota District. SVM is an SL algorithm with good performance, used for classification, and regression, but is mostly applied for classification problems. A detailed description of DT and SVM algorithms is given in the literature (Nikoobakht et al., 2022) and DTU (Mao et al., 2017). These methods were selected as benchmark methods. The objective of these comparisons is to evaluate and show the possible differences and improvements between the proposed method and the compared methods in LSM modeling.
The results of the 7 selected factors under the Multicollinearity analysis are shown in Table 3, demonstrating that VIF values were not more than 4.68, and TOL values were above .21. Therefore, there was no correlation or Multicollinearity problem among the 7 factors, and they were all acceptable for LSM modeling.
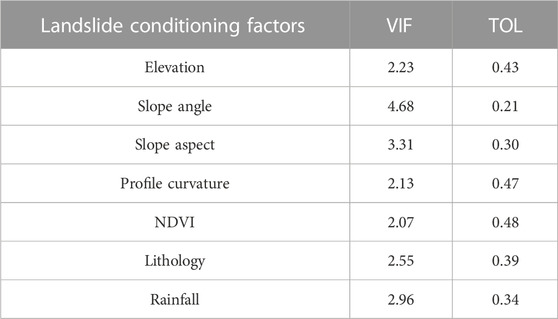
TABLE 3. Results of Multicollinearity analysis.
During the preparation of attributes’ data for the mapping units, each attribute value was normalized by its maximum value so that the value is between 0 and 1. After normalization, following the procedures mentioned in Section 3.4, and taking the attributes’ values as inputs, the O-CURE clustering algorithm was applied to divide the mapping units into different subclasses and output the statistical signature of each subclass. 485 subclasses of varying shapes and sizes, with distinguished geology and topography characteristics, were obtained. These results indicate that the model has a good and effective clustering capability. Figure 6 portrays the distribution of the obtained subclasses in the study area, and the subclasses are presented in different colors.
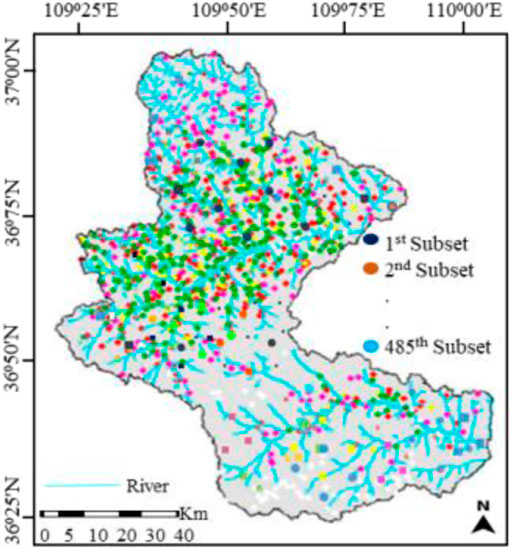
FIGURE 6. The distribution of the obtained subclasses in the study area.
The results obtained from the proposed clustering algorithm can only indicate the statistical values of the subclasses, but do not give any information about the landslide susceptibility for each subclass. So, for that purpose, in this study, the PAM algorithm was applied to the final statistical values of the subclasses to indicate the susceptibility levels of the subclasses based on LD and attribute values, which were then used to construct a landslide susceptibility map in the ArcGIS 10.2 platform. Firstly, the number of landslides in every subclass was determined and LD for every subclass was calculated. Then PAM clustering method (with a value of m = 5) was used to divide those subclasses into five susceptibility levels (very low, low, moderate, high, and very high). To assign the subclasses to their respective levels, landslide density, and attribute values were applied in the sense that highly susceptible subclasses had higher LD while those with low susceptibility had lower LD. Meanwhile, for zero LD, the common knowledge and expert experience that landslide occurrence is mostly influenced by local topographic, geological, and hydrological settings of the area; the attribute values were applied to judge the susceptibility level. All these procedures were conducted in ArcGIS 10.2 under its potential spatial analyst toolbox. Table 4 presents some subclasses together with their attribute values, landslide densities as well as susceptibility levels.
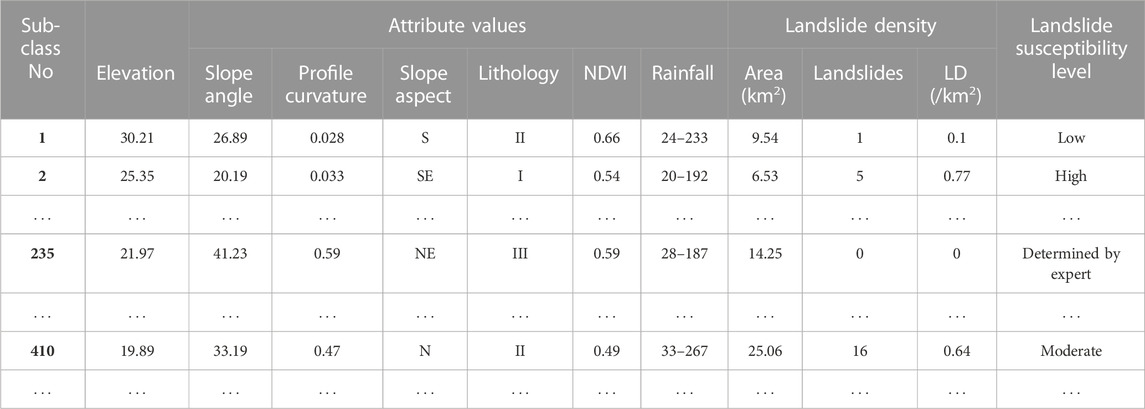
TABLE 4. Attribute values, landslide density, and landslide susceptibility levels of subclasses.
Table 5 presents the analysis of landslide susceptibility classification, it is clear that most subclasses (33% and 24%) are susceptible to landslides at a very high and moderate level respectively, followed by a high level (18%). Few subclasses (13% and 12%) fell into the low and very low susceptibility levels. The constructed susceptibility map is shown in Figure 7.
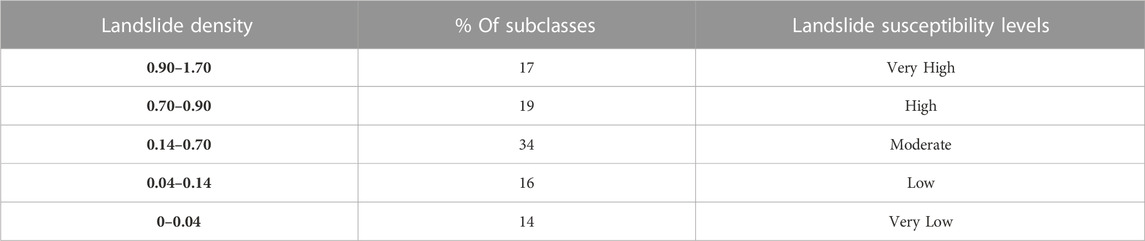
TABLE 5. Analysis of landslide susceptibility classification.
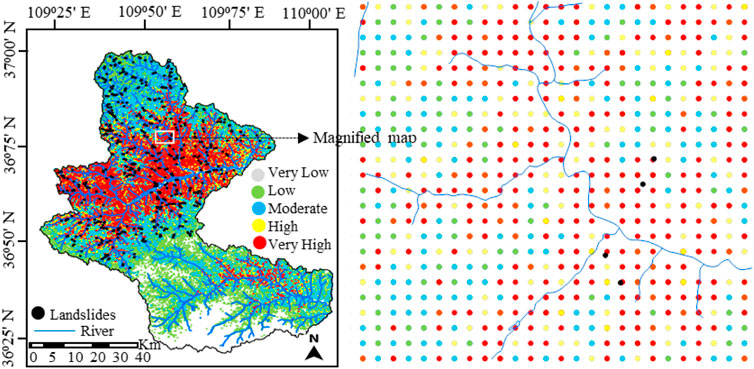
FIGURE 7. Landslide susceptibility map.
The evaluation results of the proposed model and comparison results are presented in Table 6. From the Table, it can be observed that the O-CURE algorithm achieved the highest performance results with St = .9215, Sp = .9577, Ac = .9368, and ka = .8496; more than the compared models: CURE (St = .802, Sp = .7606, Ac = .8353, and ka = .6637), AHC-OLID (St = .8532, Sp = .8451, Ac = .8636, and ka = .7219), OA-HD (St = .9010, Sp = .9202, Ac = .9091, and ka = .8148) and CA-AQD (St = .9147, Sp = .9390, Ac = .9249, and ka = .8471). These results showed a strong performance capability of O-CURE compared to the other clustering models. Additionally, the proposed O-CURE algorithm showed the highest AUC of .896 in the ROC shown in Figure 8.
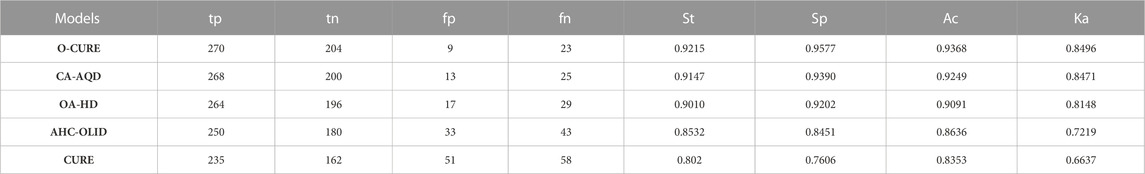
TABLE 6. Evaluation and comparison results.
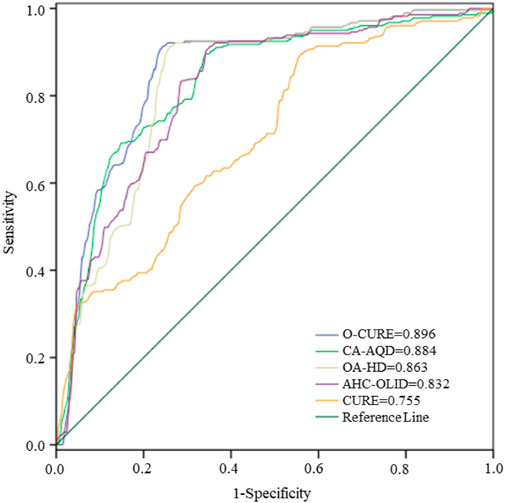
FIGURE 8. ROC curves for O-CURE, CA-AQD, OA-HD, and CURE LSM clustering models.
To construct and evaluate the supervised learning models, the dataset was randomly divided into training and validation sets at a ratio of 20:80. With the general knowledge that the increase in the training set can increase the validation accuracy, the process was executed iteratively by adding 10% of the data from the validation set to the training set until there was 80% of the data in the training set. From the comparison results (Figure 9), the O-CURE model showed nearly constant performance accuracy during the experiment while the DT, DTU, and SVM models started with low accuracies which kept on increasing as more data was added to the training set, and the DTU showed the highest increase of accuracy than the other models.
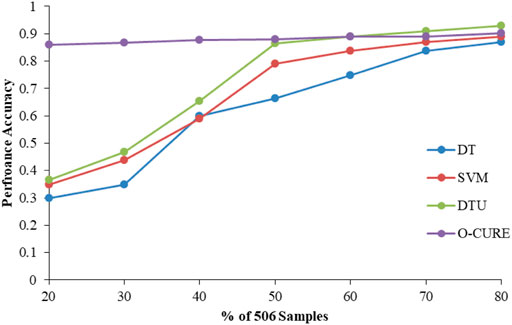
FIGURE 9. Performance evaluation of O-CURE, DT, DTU, and SVM models.
Landslide is one of the most destructive disasters in different parts of the world. Because of this, numerous attempts have been made to develop appropriate landslide prevention and mitigation strategies. Among them, LSM is one of the crucial strategies by which landslide-susceptible areas can be easily identified. Thus, in this study, a new clustering algorithm was developed and applied to conduct landslide susceptibility mapping in Baota, District, China. The performance of the model was evaluated and compared with that of CURE, CA-AQD, OA-HD, and AHC-OLID clustering methods based on sensitivity, specificity, accuracy, kappa, and ROC evaluation metrics. Also, DT, DTU, and SVM - supervised methods were adopted for comparison based on performance accuracy.
The results indicate that the O-CURE obtained higher performance in all cases compared to other clustering models. Also, based on the underlying principle that the higher the kappa, accuracy, and AUC values (closer to 1) the stronger the predictive ability of the model, the O-CURE model obtained accuracy >.9, kappa >.8, and AUC >.85, indicating its strong predictive ability and that it is nearly in complete agreement with the field survey data. This significant performance of the O-CURE model was facilitated by the introduced and improved functions. The Multicollinearity analysis on the selected landslide conditioning factors helped to avoid errors and over-fitting problems that could have resulted from correlated factors. Thus, verified that all the factors were acceptable for modeling and could result in an accurate model. The PIW-based method enhanced the selection of appropriate representative points, and supported the effective elimination of noise data which improved the clustering quality. This method enabled O-CURE to perform better than the CURE model which uses a random selection approach to select the representative points, an approach, that is, subjected to errors and may lead to incorrect results. Also, the CIBD-based method facilitated proper processing of the uncertain data, which also supported better clustering results than CURE clustering which does not consider the uncertain data processing. In addition, O-CURE performed better than CA-AQD, OA-HD, and AHC-OLID because the models are sensitive to the arbitrarily shaped clusters, sensitive to noise, and cannot perform well in large datasets, hence obtaining lower performance results. All these limitations have been addressed and dealt with in the O-CURE model.
Furthermore, in comparison with the DT, DTU, and SVM supervised learning models, these models showed dependence on labeled training data and their performance increased with an increase in the amount of training data. This is an indication that their performances are not consistent and they cannot guarantee an accurate and reliable LSM, especially in large study areas where obtaining enough datasets is a challenge. On the other hand, the O-CURE model showed nearly consistent performance (despite the amount of supplied data) throughout the process indicating that it can be applicable even when there is not enough data and can quickly evaluate the susceptibility of landslide events over a large area. Thus, based on this, the proposed unsupervised learning model is more advantageous than the supervised learning models.
A landslide susceptibility map was constructed based on the developed O-CURE model. It was discovered that about 18% and 33% of the study area were observed in high and very high susceptibility levels while classes 24% are susceptible to landslides at a moderate level. This map can be very useful and practical for landslide management, landslide disaster, risk analysis, and land-use management in general. Also, understanding the differences between various machine learning techniques is essential to obtain and apply an optimal LSM model for a specific study aim and area. For example,; the findings of this study showed that the unsupervised learning models which are rarely used could also be significantly helpful in assessing landslides as a preliminary technique.
Although the results indicated the high-performance capability of the proposed model, the limitation of this study is: the study considered only 7 landslide conditioning factors, there are other several factors (Dias et al., 2021; Lima et al., 2022; Tehrani et al., 2022) that are known to have an association with landslide occurrences. Moreover, further comprehensive studies will be conducted to compare the proposed model with other commonly applied models, increase the number of conditioning factors, and apply it in other study areas with a different dataset to evaluate its performance in LSM modeling. Also, non-location samples were randomly selected based on expert knowledge and existing data. This can cause some errors in the modeling procedure. For further studies, more and other famous evaluation metrics will be applied to evaluate the performance of the model. Nevertheless, the result analysis suggests that the proposed model and its comparison will guarantee a basis and better implementation of results for future studies.
The main objective of this study was to develop an optimized clustering algorithm for landslide susceptibility mapping based on a combination of a CURE algorithm, the partition influence weight-based method, and CIBD (O-CURE algorithm). The study targeted to enhance the performance capability of the CURE algorithm and improve landslide susceptibility modeling by addressing the limitations found in the CURE algorithm and existing clustering models, including the inability to detect subclasses with arbitrary shapes, sensitivity to noise, inability to perform well in large study areas with large datasets and to obtain an optimal solution for quantifying the uncertain data (rainfall). The developed model was implemented in Baota District, Shaanxi province, China. The performance of the model was evaluated using statistical metrics and AUC from ROC. It was then compared with the CURE algorithm, CA-AQD, AHC-OLID, and OA-HD clustering algorithms, as well as DT, DTU, and SVM supervised learning models. Among others, O-CURE obtained the best performance in mapping landslide susceptibility in the area with accuracy >.90, kappa >.80, and AUC >.85. These results suggest that the model could be a useful tool in identifying landslide vulnerable areas and developing landslide preventive measures and mitigation strategies as well as in land use planning and policy. For instance, responsible authorities should pay more attention and give warnings and strategies on building any sort of projects along the high-very high susceptibility areas, or further evacuate people and stop the ongoing projects from those areas. For the moderate-very low susceptible areas, landslide preventive measures could be set and applied while providing proper and sustainable land use planning and environmental protection. Lastly, it is worth mentioning that the results of this study provide a theoretical framework upon which more unsupervised learning methods could be applied, a consistent and reliable tool to assess landslide susceptibility. In addition, this study not only provides insightful contributions to this field and scientific literature but also can be applied and experimented with in other natural disaster assessment studies in other areas around the world.
The raw data supporting the conclusion of this article will be made available by the authors, without undue reservation.
Conceptualization: DM, YM, and XL; methodology: DM and YM; software: YM, DM and YN; writing—original draft preparation: DM and YM; review and editing: YM, DM, and XL; visualization: DM and YM. All authors have read and agreed to the submitted version of the manuscript.
This study was supported by the National Natural Science Foundation of China (41562019).
The authors would like to acknowledge the Jiangxi University of Science and Technology for providing the support needed while conducting this study. The authors would also like to acknowledge and appreciate Key Laboratory for Geo-hazards in Loess Area, MLR, Xi’an, Shaanxi, China for providing with us the historical landslide data; without these data, this work would not have been accomplished.
The authors declare that the research was conducted in the absence of any commercial or financial relationships that could be construed as a potential conflict of interest.
All claims expressed in this article are solely those of the authors and do not necessarily represent those of their affiliated organizations, or those of the publisher, the editors and the reviewers. Any product that may be evaluated in this article, or claim that may be made by its manufacturer, is not guaranteed or endorsed by the publisher.
Arabameri, A., Chandra Pal, S., Rezaie, F., Chakrabortty, R., Saha, A., Blaschke, T., et al. (2021). Decision tree based ensemble machine learning approaches for landslide susceptibility mapping. Geocarto Int. 37, 4594–4627. doi:10.1080/10106049.2021.1892210
Azarafza, M., Azarafza, M., Akgün, H., Atkinson, P. M., and Derakhshani, R. (2021). Deep learning-based landslide susceptibility mapping. Sci. Rep. 11, 24112–24116. doi:10.1038/s41598-021-03585-1
Benchelha, S., Aoudjehane, H. C., Hakdaoui, M., El Hamdouni, R., Mansouri, H., Benchelha, T., et al. (2020). Landslide susceptibility mapping in the commune of oudka, taounate province, north Morocco: A comparative analysis of logistic regression, multivariate adaptive regression spline, and artificial neural network models. Environ. Eng. Geoscience 26, 185–200. doi:10.2113/eeg-2243
Berhane, G., Kebede, M., and Alfarrah, N. (2021). Landslide susceptibility mapping and rock slope stability assessment using frequency ratio and kinematic analysis in the mountains of Mgulat area, Northern Ethiopia. Bull. Eng. Geol. Environ. 80, 285–301. doi:10.1007/s10064-020-01905-9
Bourenane, H., Meziani, A. A., and Benamar, D. A. (2021). Application of GIS-based statistical modeling for landslide susceptibility mapping in the city of Azazga, Northern Algeria. Bull. Eng. Geol. Environ. 80, 7333–7359. doi:10.1007/s10064-021-02386-0
Cai, M., and Liang, Y. (2018). “An improved CURE algorithm,” in International conference on intelligence science, Beijing, China, 2-5 November 2018 (Springer), 102–111.
Chen, X., and Chen, W. (2021). GIS-based landslide susceptibility assessment using optimized hybrid machine learning methods. Catena 196, 104833. doi:10.1016/j.catena.2020.104833
Chowdhuri, I., Pal, S. C., Chakrabortty, R., Malik, S., Das, B., Roy, P., et al. (2021b). Spatial prediction of landslide susceptibility using projected storm rainfall and land use in Himalayan region. Bull. Eng. Geol. Environ. 80, 5237–5258. doi:10.1007/s10064-021-02252-z
Chowdhuri, I., Pal, S. C., Chakrabortty, R., Malik, S., Das, B., and Roy, P. (2021a). Torrential rainfall-induced landslide susceptibility assessment using machine learning and statistical methods of eastern Himalaya. Nat. Hazards 107, 697–722. doi:10.1007/s11069-021-04601-3
De Souza, R. M., and De Carvalho, F. D. A. (2004). Clustering of interval data based on city–block distances. Pattern Recognit. Lett. 25, 353–365. doi:10.1016/j.patrec.2003.10.016
Dias, H. C., Hölbling, D., and Grohmann, C. H. (2021). Landslide susceptibility mapping in Brazil: A review. Geosciences 11, 425. doi:10.3390/geosciences11100425
Dou, J., Yunus, A. P., Merghadi, A., Shirzadi, A., Nguyen, H., Hussain, Y., et al. (2020). Different sampling strategies for predicting landslide susceptibilities are deemed less consequential with deep learning. Sci. total Environ. 720, 137320. doi:10.1016/j.scitotenv.2020.137320
Ganga, A., Elia, M., D’Ambrosio, E., Tripaldi, S., Capra, G. F., Gentile, F., et al. (2022). Assessing landslide susceptibility by coupling spatial data analysis and logistic model. Sustainability 14, 8426. doi:10.3390/su14148426
Guha, S., Rastogi, R., and Shim, K. (1998). Cure: An efficient clustering algorithm for large databases. ACM Sigmod Rec. 27, 73–84. doi:10.1145/276305.276312
Hu, J., Xu, K., Wang, G., Liu, Y., Khan, M. A., Mao, Y., et al. (2021). A novel landslide susceptibility mapping portrayed by OA-HD and K-medoids clustering algorithms. Bull. Eng. Geol. Environ. 80, 765–779. doi:10.1007/s10064-020-01863-2
Hu, J., Zhu, H., Mao, Y., Zhang, C., Liang, T., and Mao, D. (2019). Using uncertain DM-chameleon clustering algorithm based on machine learning to predict landslide hazards. J. Robotics Mechatronics 31, 329–338. doi:10.20965/jrm.2019.p0329
Huang, F., Cao, Z., Jiang, S.-H., Zhou, C., Huang, J., and Guo, Z. (2020). Landslide susceptibility prediction based on a semi-supervised multiple-layer perceptron model. Landslides 17, 2919–2930. doi:10.1007/s10346-020-01473-9
Huang, J., and Ling, C. X. (2005). Using AUC and accuracy in evaluating learning algorithms. IEEE Trans. Knowl. Data Eng. 17, 299–310. doi:10.1109/tkde.2005.50
Jaydhar, A. K., Pal, S. C., Saha, A., Islam, A. R. M. T., and Ruidas, D. (2022). Hydrogeochemical evaluation and corresponding health risk from elevated arsenic and fluoride contamination in recurrent coastal multi-aquifers of eastern India. J. Clean. Prod. 369, 133150. doi:10.1016/j.jclepro.2022.133150
Korma, T. C. (2022). GIS-based landslide susceptibility zonation mapping using frequency ratio and logistics regression models in the Dessie area, South Wello, Ethiopia.
Landis, J. R., and Koch, G. G. (1977). The measurement of observer agreement for categorical data. biometrics, 159–174.
Lee, J.-H., Sameen, M. I., Pradhan, B., and Park, H.-J. (2018). Modeling landslide susceptibility in data-scarce environments using optimized data mining and statistical methods. Geomorphology 303, 284–298. doi:10.1016/j.geomorph.2017.12.007
Lei, T., Xue, D., Lv, Z., Li, S., Zhang, Y., and Nandi, A. K. (2018). Unsupervised change detection using fast fuzzy clustering for landslide mapping from very high-resolution images. Remote Sens. 10, 1381. doi:10.3390/rs10091381
Lima, P., Steger, S., Glade, T., and Murillo-García, F. G. (2022). Literature review and bibliometric analysis on data-driven assessment of landslide susceptibility. J. Mt. Sci. 19, 1670–1698. doi:10.1007/s11629-021-7254-9
Ling, S., Zhao, S., Huang, J., and Zhang, X. (2022). Landslide susceptibility assessment using statistical and machine learning techniques: A case study in the upper reaches of the minjiang river, southwestern China. Front. Earth Sci. 10, 986172. doi:10.3389/feart.2022.986172
Liu, S., Wang, L., Zhang, W., He, Y., and Pijush, S. (2023). A comprehensive review of machine learning-based methods in landslide susceptibility mapping. Geol. J. doi:10.1002/gj.4666
Mao, Y.-M., Mwakapesa, D. S., Li, Y.-C., Xu, K.-B., Nanehkaran, Y. A., and Zhang, M.-S. (2022). Assessment of landslide susceptibility using DBSCAN-AHD and LD-EV methods. J. Mt. Sci. 19, 184–197. doi:10.1007/s11629-020-6491-7
Mao, Y., Mwakapesa, D. S., Wang, G., Nanehkaran, Y., and Zhang, M. (2021a). Landslide susceptibility modelling based on AHC-OLID clustering algorithm. Adv. Space Res. 68, 301–316. doi:10.1016/j.asr.2021.03.014
Mao, Y., Mwakapesa, D. S., Xu, K., Lei, C., Liu, Y., and Zhang, M. (2021b). Comparison of wave-cluster and DBSCAN algorithms for landslide susceptibility assessment. Environ. Earth Sci. 80, 734. doi:10.1007/s12665-021-09896-w
Mao, Y., Zhang, M., Sun, P., and Wang, G. (2017). Landslide susceptibility assessment using uncertain decision tree model in loess areas. Environ. Earth Sci. 76, 752. doi:10.1007/s12665-017-7095-6
Mehrabi, M., and Moayedi, H. (2021). Landslide susceptibility mapping using artificial neural network tuned by metaheuristic algorithms. Environ. Earth Sci. 80, 804–820. doi:10.1007/s12665-021-10098-7
Nhu, V.-H., Mohammadi, A., Shahabi, H., Ahmad, B. B., Al-Ansari, N., Shirzadi, A., et al. (2020). Landslide susceptibility mapping using machine learning algorithms and remote sensing data in a tropical environment. Int. J. Environ. Res. public health 17, 4933. doi:10.3390/ijerph17144933
Nikoobakht, S., Azarafza, M., Akgün, H., and Derakhshani, R. (2022). Landslide susceptibility assessment by using convolutional neural network. Appl. Sci. 12, 5992. doi:10.3390/app12125992
Nohani, E., Moharrami, M., Sharafi, S., Khosravi, K., Pradhan, B., Pham, B. T., et al. (2019). Landslide susceptibility mapping using different GIS-based bivariate models. Water 11, 1402. doi:10.3390/w11071402
Nsengiyumva, J. B., Luo, G., Nahayo, L., Huang, X., and Cai, P. (2018). Landslide susceptibility assessment using spatial multi-criteria evaluation model in Rwanda. Int. J. Environ. Res. public health 15, 243. doi:10.3390/ijerph15020243
Pal, S. C., and Chowdhuri, I. (2019). GIS-based spatial prediction of landslide susceptibility using frequency ratio model of Lachung River basin, North Sikkim, India. SN Appl. Sci. 1, 416–425. doi:10.1007/s42452-019-0422-7
Pal, S. C., Ruidas, D., Saha, A., Islam, A. R. M. T., and Chowdhuri, I. (2022). Application of novel data-mining technique-based nitrate concentration susceptibility prediction approach for coastal aquifers in India. J. Clean. Prod. 346, 131205. doi:10.1016/j.jclepro.2022.131205
Pham, B. T., Prakash, I., Dou, J., Singh, S. K., Trinh, P. T., Tran, H. T., et al. (2020). A novel hybrid approach of landslide susceptibility modelling using rotation forest ensemble and different base classifiers. Geocarto Int. 35, 1267–1292. doi:10.1080/10106049.2018.1559885
Pokharel, B., Althuwaynee, O. F., Aydda, A., Kim, S.-W., Lim, S., and Park, H.-J. (2021). Spatial clustering and modelling for landslide susceptibility mapping in the north of the Kathmandu Valley, Nepal. Landslides 18, 1403–1419. doi:10.1007/s10346-020-01558-5
Pourghasemi, H. R., Teimoori Yansari, Z., Panagos, P., and Pradhan, B. (2018). Analysis and evaluation of landslide susceptibility: A review on articles published during 2005–2016 (periods of 2005–2012 and 2013–2016). Arabian J. Geosciences 11, 193. doi:10.1007/s12517-018-3531-5
Qian, Y.-T., Shi, Q.-S., and Wang, Q. (2002). “CURE-NS: A hierarchical clustering algorithm with new shrinking scheme,” in Proceedings. International Conference on Machine Learning and Cybernetics, Beijing, China, 04-05 November 2002 (IEEE), 895–899.
Rdusseeun, L., and Kaufman, P. (1987). “Clustering by means of medoids,” in Proceedings of the statistical data analysis based on the L1 norm conference, neuchatel, switzerland.
Ren, Y., Liu, Y.-H., Rong, J., and Dew, R. (2009). “Clustering interval-valued data using an overlapped interval divergence,” in Proceedings of the Eighth Australasian Data Mining Conference-Volume 101, Melbourne Australia, December 1 - 4, 2009, 35–42.
Ruidas, D., Chakrabortty, R., Islam, A. R. M. T., Saha, A., and Pal, S. C. (2022a). A novel hybrid of meta-optimization approach for flash flood-susceptibility assessment in a monsoon-dominated watershed, Eastern India. Environ. Earth Sci. 81, 145. doi:10.1007/s12665-022-10269-0
Ruidas, D., Pal, S. C., Islam, A. R. M. T., and Saha, A. (2021). Characterization of groundwater potential zones in water-scarce hardrock regions using data driven model. Environ. Earth Sci. 80, 809–818. doi:10.1007/s12665-021-10116-8
Ruidas, D., Pal, S. C., Saha, A., Chowdhuri, I., and Shit, M. (2022b). Hydrogeochemical characterization based water resources vulnerability assessment in India's first Ramsar site of Chilka lake. Mar. Pollut. Bull. 184, 114107. doi:10.1016/j.marpolbul.2022.114107
Saha, S., Roy, J., Hembram, T. K., Pradhan, B., Dikshit, A., Abdul Maulud, K. N., et al. (2021). Comparison between deep learning and tree-based machine learning approaches for landslide susceptibility mapping. Water 13, 2664. doi:10.3390/w13192664
Sheng, M., Zhou, J., Chen, X., Teng, Y., Hong, A., and Liu, G. (2022). Landslide susceptibility prediction based on frequency ratio method and C5. 0 decision tree model. Front. Earth Sci. 889, 918386. doi:10.3389/feart.2022.918386
Solanki, A., Gupta, V., and Joshi, M. (2022). Application of machine learning algorithms in landslide susceptibility mapping, Kali valley, Kumaun Himalaya, India. Geocarto Int., 1–26. doi:10.1080/10106049.2022.2120546
Su, C., Wang, B., Lv, Y., Zhang, M., Peng, D., Bate, B., et al. (2022). Improved landslide susceptibility mapping using unsupervised and supervised collaborative machine learning models. Georisk Assess. Manag. Risk Eng. Syst. Geohazards, 1–19. doi:10.1080/17499518.2022.2088802
Su, Q., Tao, W., Mei, S., Zhang, X., Guo, J., Yang, Y., et al. (2021). Landslide susceptibility zoning using C5. 0 decision tree, random forest, support vector machine and comparison of their performance in a coal mine area. Front. Earth Sci. 1181. doi:10.3389/feart.2021.781472
Tehrani, F. S., Calvello, M., Liu, Z., Zhang, L., and Lacasse, S. (2022). Machine learning and landslide studies: Recent advances and applications. Nat. Hazards 114, 1197–1245. doi:10.1007/s11069-022-05423-7
Tran, T.-H., Dam, N. D., Jalal, F. E., Al-Ansari, N., Ho, L. S., Phong, T. V., et al. (2021). GIS-based soft computing models for landslide susceptibility mapping: A case study of pithoragarh district, uttarakhand state, India. Math. problems Eng. 2021, 9914650. doi:10.1155/2021/9914650
Wan, S., Yen, J. Y., Lin, C. Y., and Chou, T. Y. (2015). Construction of knowledge-based spatial decision support system for landslide mapping using fuzzy clustering and KPSO analysis. Arabian J. Geosciences 8, 1041–1055. doi:10.1007/s12517-013-1226-5
Wang, Q., Wang, Y., Niu, R., and Peng, L. (2017). Integration of information theory, K-means cluster analysis and the logistic regression model for landslide susceptibility mapping in the Three Gorges Area, China. Remote Sens. 9, 938. doi:10.3390/rs9090938
Wang, S., Lin, X., Qi, X., Li, H., and Yang, J. (2022). Landslide susceptibility analysis based on a PSO-DBN prediction model in an earthquake-stricken area. Front. Environ. Sci. 1244. doi:10.3389/fenvs.2022.912523
Wang, Y., Sun, D., Wen, H., Zhang, H., and Zhang, F. (2020). Comparison of random forest model and frequency ratio model for landslide susceptibility mapping (LSM) in Yunyang County (Chongqing, China). Int. J. Environ. Res. public health 17, 4206. doi:10.3390/ijerph17124206
Wang, Y., Wu, X., Chen, Z., Ren, F., Feng, L., and Du, Q. (2019). Optimizing the predictive ability of machine learning methods for landslide susceptibility mapping using SMOTE for Lishui City in Zhejiang Province, China. Int. J. Environ. Res. public health 16, 368. doi:10.3390/ijerph16030368
Xiufeng, S., and Wei, C. (2011). “Improved CURE algorithm and application of clustering for large-scale data,” in 2011 IEEE International Symposium on IT in Medicine and Education, Guangzhou, China, 09-11 December 2011 (IEEE), 305–308.
Yimin, M., Yican, L., Simon Mwakapesa, D., Genglong, W., Ahangari Nanehkaran, Y., Asim Khan, M., et al. (2021). Innovative landslide susceptibility mapping portrayed by CA-AQD and K-means clustering algorithms. Adv. Civ. Eng., 2021, 1–17. doi:10.1155/2021/8846779
Yong, C., Jinlong, D., Fei, G., Bin, T., Tao, Z., Hao, F., et al. (2022). Review of landslide susceptibility assessment based on knowledge mapping. Stoch. Environ. Res. Risk Assess. 36, 2399–2417. doi:10.1007/s00477-021-02165-z
Youssef, A. M., and Pourghasemi, H. R. (2021). Landslide susceptibility mapping using machine learning algorithms and comparison of their performance at Abha Basin, Asir Region, Saudi Arabia. Geosci. Front. 12, 639–655. doi:10.1016/j.gsf.2020.05.010
Zhang, M.-S., and Liu, J. (2010). Controlling factors of loess landslides in Western China. Environ. Earth Sci. 59, 1671–1680. doi:10.1007/s12665-009-0149-7
Zhang, S., Bai, L., Li, Y., Li, W., and Xie, M. (2022). Comparing convolutional neural network and machine learning models in landslide susceptibility mapping: A case study in wenchuan county. Front. Environ. Sci. 496. doi:10.3389/fenvs.2022.886841
Keywords: landslide susceptibility mapping, clustering algorithm, CURE, cluster quality, uncertain data, O-CURE, PAM, Baota District
Citation: Mwakapesa DS, Lan X, Nanehkaran YA and Mao Y (2023) Landslide susceptibility mapping using O-CURE and PAM clustering algorithms. Front. Environ. Sci. 11:1140834. doi: 10.3389/fenvs.2023.1140834
Received: 10 January 2023; Accepted: 20 February 2023;
Published: 02 March 2023.
Edited by:
Juergen Pilz, University of Klagenfurt, AustriaReviewed by:
Subodh Chandra Pal, University of Burdwan, IndiaCopyright © 2023 Mwakapesa, Lan, Nanehkaran and Mao. This is an open-access article distributed under the terms of the Creative Commons Attribution License (CC BY). The use, distribution or reproduction in other forums is permitted, provided the original author(s) and the copyright owner(s) are credited and that the original publication in this journal is cited, in accordance with accepted academic practice. No use, distribution or reproduction is permitted which does not comply with these terms.
*Correspondence: Yimin Mao, bXltbHljQDE2My5jb20=
†Present address: Deborah Simon Mwakapesa, School of Civil, and Surveying, and Mapping, Jiangxi University of Science and Technology, Ganzhou, Jiangxi, China
Xiaoji Lan, School of Civil, and Surveying, and Mapping, Jiangxi University of Science and Technology, Ganzhou, Jiangxi, China
Disclaimer: All claims expressed in this article are solely those of the authors and do not necessarily represent those of their affiliated organizations, or those of the publisher, the editors and the reviewers. Any product that may be evaluated in this article or claim that may be made by its manufacturer is not guaranteed or endorsed by the publisher.
Research integrity at Frontiers
Learn more about the work of our research integrity team to safeguard the quality of each article we publish.