 Hua Zhuang
 Hongxi Lin
 Kaiyang Zhong
94% of researchers rate our articles as excellent or good
Learn more about the work of our research integrity team to safeguard the quality of each article we publish.
Find out more
ORIGINAL RESEARCH article
Front. Environ. Sci. , 11 October 2022
Sec. Environmental Economics and Management
Volume 10 - 2022 | https://doi.org/10.3389/fenvs.2022.997084
The spatial spillover effect of regional green innovation efficiency (GIE) is a heated issue of academic research; however, it has rarely been discussed from a network perspective. It is pretty meaningful to clarify its spatial association network’s evolutionary rules and driving factors. To fill the lack of research, this study measures the regional GIE in China from 2010 to 2019 using an epsilon-based metric (EBM) model that considers undesirable outputs. A modified gravity model and social network analysis (SNA) method are used to analyze the evolutionary rules and spatial spillover effects of the network structure of GIE, and a quadratic allocation process (QAP) was employed to identify its driving factors. The findings reveal that: 1) China’s regional GIE has a geographic correlation network structure with a low network density (peaking at 0.210 in 2018) and an annually increasing slow trend. 2) The network structure is relatively loose and has a certain hierarchical gradient, with “dense in the eastern” and “sparse in the western” characteristics. 3) The eastern provinces are at the relative center position and play a leading role in the network; the central, western, and northeastern regions are relatively inferior and play a fulcrum and conduction role. 4) Spatial adjacency, the differences in infrastructure, urbanization, and economic development level positively affect the spatially correlated regional GIE. In contrast, differences in environmental regulations and differences in science and technology innovation (STI) have negative effects. Finally, from the perspectives of national, regional, block, and driving factors, several recommendations are made to enhance the overall improvement and balanced development of regional GIE in China.
Environmental protection has become one of the significant obstacles to maintaining sustainable growth in the global economy (Zhang, Ouyang, Ballesteros-Pérez, Li, & Skitmore, 2021a). The traditional development modes generally come at the cost of ecological destruction and resource exhaustion. Evidently, such a growth pattern appears to be inconsistent with the goal of sustainable growth. Several governments have begun encouraging various industries to introduce innovative green technologies in their production processes for the purpose of reducing energy consumption and pollutant emissions (Yin & Li, 2018; Gente & Pattanaro, 2019). Green innovation refers to innovation activities aimed at high-quality economic development and environmental protection, which decreases or eliminates the ecological destruction resulting from economic activities by converting innovative products and technologies throughout their life cycle (Xie, Huo, & Zou, 2019; Zhang, Kang, Li, Ballesteros-Pérez, & Zuo, 2020). Green innovation can help to alleviate the constraints of environmental pollution and resource scarcity and achieve sustainable and healthy economic development. Achieving sustainable economic growth requires innovative green technologies to enhance carbon productivity.
Although China’s economy has grown significantly over the past 40 years, sustainable development has only recently been advocated and received widespread notations. The crude economic growth mode has led to excessive energy consumption, mainly of coal, oil, natural gas, and other fossil fuels, hindering the achievement goals of China’s sustainable economic growth (Fan & Xiao, 2021; Zhou, Yu, Yang, & Shi, 2021). According to the statistics, China’s gross domestic product (GDP) for 2019 reached 9,908.65 billion yuan, and the contribution rate of scientific and technological advancement reached 59.5%. New growth drivers maintained rapid development, with the value-added of strategic emerging manufacturing and high-tech manufacturing industries growing by 8.4% and 8.8%, respectively. However, China’s environmental problems continue to be serious. According to the 2019 State of China’s Ecology and Environment Report, among 337 cities at prefecture level and above, 157 (46.6%) reached the standard of ambient air quality, while 180 (53.4%) exceeded the standard; the proportion of acid rain in monitored precipitation in 469 cities is 33.3%. In the monitoring data of 10,168 national groundwater quality monitoring stations, 14.4% are types of Ⅰ, Ⅱ, and Ⅲ, 66.9% are type Ⅳ, and 18.8% are type V. The structure of carbon emissions in China from 2000 to 2019 can be seen in Figure 1. As a new way of sustainable development, green innovation deeply integrates the two development principles of green and innovation. It already becomes the primary tool to achieve ecological civilization construction, high-quality development, and sustainable growth in a country or region.
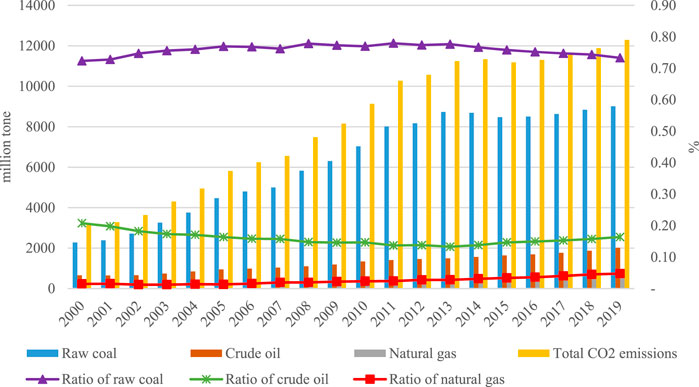
FIGURE 1. The structure of carbon emissions in China from 2000 to 20191.
Green innovation efficiency (GIE) is an indicator that measures the quality of green innovation development level from the input-output perspective. Its efficiency value is influenced by many factors of the region it belongs to, such as resource endowment, economic foundation, regional external environment, and geographical conditions (Li, Wei, & Wang, 2015; Liu, Shao, Tang, & Lan, 2021). Owing to the inter-regional differences and uneven distribution of the factors mentioned above, regional GIEs tend to have “gradient differences” (Zhou et al., 2021; Wang & Ren, 2022). Furthermore, the spatial association network of green innovation is integral to the innovation network. Under the mechanism of regional spatial diffusion and knowledge spillover, the fluid factor resources such as capital, technology, and management methods flow and redistribute in a direction conducive to the development of regional GIE (Giuliani & Bell, 2005; Hoekman, Frenken, & Van Oort, 2009; Fan & Xiao, 2021). In the process, the high-level and low-level regions generate polarization and trickle-down effects through demonstration, collaborative interaction, and peer learning (Li & Fu, 2015), resulting in the formation of spatial association networks of regional GIE. Current academic researchers have conducted many studies on the spatial spillover effects of regional GIE, such as spatial-temporal heterogeneity (Miao, Duan, Zuo, & Wu, 2021; Peng, Yin, Kuang, Wen, & Kuang, 2021) and spatial clustering characteristics (Yang & Liu, 2020). However, these studies only examine the spatial correlation among individual regions, which cannot comprehensively depict the overall network characteristics. Moreover, the existing research rarely discusses the spatial spillover relationship of regional GIE from a network perspective, as well as the spatial spillover effects and their driving factors. The current situation is that China’s green production technology and innovation efficiency are still low. An efficient and well-organized network of GIE has not yet been formed between regions (Fan & Xiao, 2021). Furthermore, there are only a few cross-regional green innovation collaboration activities, and both cross-regional green technology sharing platforms and joint pollution governance platforms have not been established (Su & Yu, 2019). Therefore, under the scenario of the Chinese government’s pursuit of sustainable development, it is of great theoretical and practical significance to unveil the evolutionary rules of the spatial networks for regional GIEs and their driving factors to achieve the goal of cross-regional collaboration development in China.
The significant contributions of the study can be summarized in the following. From a network perspective, the main works of this paper are to investigate the evolutionary rules of the spatial networks for regional GIE in China and reveal their driving factors, which offers a novel perspective for the literature on regional green development. First, the EBM model with undesirable output is utilized to obtain the regional GIEs and reveal their evolutionary rules and spatial differences, which helps to grasp the changing trend of GIE in each province deeply. Second, the modified gravity model is proposed to determine the network binary matrix. The SNA method is utilized to describe the spatial association network’s overall and individual features. The network structure characteristics of regional GIE are presented visually. Finally, the QAP regression analysis method recognizes the driving factors influencing its network formation. It can fundamentally avoid the problem of multiple covariates caused by various independent variables and provide a more scientific and reasonable analysis.
This study is structured as follows: Section 1 describes the context of the study; Section 2 reviews the literature; Section 3 explains the methods; Section 4 describes the indication selection and dataset; Section 5 describes the empirical results, and Section 6 draws conclusions and implications.,
Green innovation has double positive externalities for economic spillover and environmental spillover (Miao et al., 2021; Peng et al., 2021). Compared with general innovation, green innovation is defined as the collection of innovative activities that generate or modify technologies, processes, practices, systems, and products, considering the limitations of environmental performance. It aims to improve environmental performance, promote the comprehensive utilization of resources and energy, and ultimately achieve the goals of improving environmental protection and sustainable social development (Bartlett & Trifilova, 2010; Fan & Xiao, 2021; Zhao, Liu, Pan, & Wang, 2021). With the increasingly serious environmental pollution problems, scholars have started to conduct research on green innovation, including the GIE under different scales of measurement (Yang et al., 2019), spatial distribution heterogeneity (Li et al., 2015; Liu et al., 2021), spatial aggregation and convergence (Li & Fu, 2015; Dong, Li, Qin, & Sun, 2021; Zhou et al., 2021), and others (Wang, Chen, Kang, Li, & Guo, 2018; Li & Du, 2020; Fan & Xiao, 2021). In the literature on efficiency research, some scholars have calculated and analyzed the efficiency of green innovation and its influencing factors in different research objects such as province (Wu, 2021; Zhao et al., 2021), industry (He, Li, & Cui, 2021) and urban (Zeng, Skare, & Lafont, 2021). In their study on the efficiency measurement method, many scholars commonly use the data envelopment analysis (DEA) model, such as Luo, Miao, Sun, Meng, and Duan (2019)established the Malmquist-DEA index, and Zhang J. et al. (2021) employed the network EBM model to calculate the GIEs of strategic emerging industries and construction industry in China, respectively. Fan and Xiao (2021) adopted the SBM-DDF model, and Zhang et al. (2020) used the super-SBM model to measure the green economic efficiency of the 30 Chinese provinces. Lin et al. (2021) proposed a two-stage DEA with shared and additional inputs to evaluate the green technology innovation efficiency in Chinese energy-intensive industries. In the studies on influencing factors, most researchers believed that environmental regulation (Wu, Hao, & Ren, 2020), government R&D support (Li & Zeng, 2020), industrial structure (Dong et al., 2021), marketization (Liu, Gao, Ma, & Chen, 2020), and international knowledge spillover (Song, Tao, & Wang, 2015) are the primary factors driving green innovation. Furthermore, from the innovation factor flow perspective, Huang and Wang (2020) discussed the growth effects of the high-speed railway on green innovation in 108 cities of China’s Yangtze River Economic Belt. Zhou et al. (2021) stated that the intensity of R&D funding, environmental investment intensity, the degree of opening, and government support had a positive and unique effect on China’s green innovation development.
Scholars of economic geography are inclined to hold the opinion that innovation is not only affected by its accessible regional knowledge, institutional environments, social culture, technological levels, and other factors but is also by the level of innovation development of neighboring regions (Canils & Verspagen, 2001). That is to say, innovation has noticeable spatial effects, and specialization of innovation factors generates relevant spillover effects (Jaffe & Henderson, 1993; Audretsch & Feldman, 1996). The spatial spillover effect is one of the hot topics in current regional innovation system research. In the literature on spatial spillover effects of regional innovation, the researchers have preliminarily confirmed that geographic proximity between regions has significantly been correlated (Anselin, Varga, & Acs, 1997). Subsequent studies have been broadened to the impacts of social and economic factors on spatial correlations, such as knowledge, institutional, technological, and organizational proximities (Boschma, 2005; Inoue, Souma, & Tamada, 2007; Marrocu, Paci, & Usai, 2013). For example, Li and Fu (2015)revealed the spatial spillover effect of regional innovation at the urban scale. Liu et al. (2021) found that cognitive proximity, institutional proximity, geographical proximity, and technological proximity were all factors promoting the formation of green innovation networks and that geographical proximity has a positive moderating effect.
Regarding research methods, the existing literature on the spatial effects of innovation analysis consists of two main groups. The first group of methods is to measure the regional spatial correlation using various statistical methods and carry out theoretical elaboration. The Gini index, Moran’s index, and Theil coefficient are the most widely utilized indices. For example, Motoyama, Cao, and Appelbaum (2014) employed the Gini index and global Moran’s index to examine whether the geographic concentration of nanotechnology-related patents has persisted over time. Wang, Zhang, Zheng, and Chang (2021)applied Moran’s index to study the changing trend of the spatial pattern of regional innovation output. Xiao, Fan, and Du (2019) adopted the Theil index to analyze the Chinese regional innovation capability difference and evolution. The second group of methods is concerned with the analysis of the spatial effects, including the exploratory spatial data analysis (Tan, Cheng, Lei, & Zhao, 2017), gravity models (Maggioni, Uberti, & Usai, 2011), kernel density functions (Liu, 2018), and spatial econometric models (Li & Fu, 2015; Peng et al., 2021). For example, Shang, Poon, and Yue (2012) used a spatial autoregressive model to test China’s innovation growth’s regional knowledge spillover. Zhang X. et al. (2021) combined the exploratory spatial data analysis and gravity model to describe the spatial characteristics of low-carbon energy technology innovation in China and identify the driving factors. Peng et al. (2021) used the spatial Durbin model (SDM) to test whether green innovation has a significant positive spatial spillover effect on economic development quality. According to the spatial analysis method of geographic information system (GIS), Pan, Chu, Pan, and Wang (2021) adopted the gravity and potential models to identify the change features of spatial correlation effect of urban innovation in China. Wu, Hao, Ren, Yang, and Xie (2021) investigate the relationship between the internet and China’s green total factor energy efficiency (GTFEE) using a dynamic SDM, mediation effect model, and threshold panel model.
In the 1960s, sociologist Harison White et al. established the SNA theory, which uses graph-theoretic techniques to identify connection modes and considers connections as the basis of analysis units (Scott, 2011). The SNA approach has been widely applied in a variety of fields, including economics, management, sociology, behavioral science, and others. Many scholars have used the SNA model to discuss innovation networks. Such as, using patent collaboration data, Cantner and Graf (2006) depicted the evolution of the German Jena innovator network. From the standpoint of SNA in three indicators of network density, network cohesion, and network centrality, Krätke (2010)investigated the structure and properties of regional knowledge networks. Senghore, Campos-Nanez, Fomin, and Wasek (2015) employed the SNA method to test whether three driver elements in competition, social interaction, and network vitality influence innovation. Tseng, Lin, Pai, and Tung (2016)used SNA to explore the relationship between the global semiconductor industry’s innovation network and innovation capability. SNA was utilized by Yang and Liu (2020) to define the spatial correlation properties of low-carbon innovation. In recent years, a unique research system has been proposed to study the structure of innovation spatial association networks. Specifically, the spatial correlation of regional innovation is first estimated using Granger causality tests or gravity models; then, overall, individual and cluster characteristics are analyzed using network density, correlation, centrality, and SNA block models, and finally, the factors affecting the spatial correlation of regional innovation are analyzed using a QAP approach (Li et al., 2015; Yang & Liu, 2020; Fan & Xiao, 2021). The QAP is based on the permutation of the matrix data by comparing the lattice values of the matrices and determining the correlation coefficients while performing non-parametric tests on the coefficients and is often used to examine the relationship by using relational data (Barnes, 1954). Owing to the difficulties of multi-collinearity and autocorrelation that usually exist in network data, the QAP model does not require the assumption of independence and normal distribution, and the results are more robust.
Previous studies on the spatial spillover of regional GIE are relatively common, but there still a needs for further supplementation and improvement.
1) Regarding evaluating regional GIE, the current literature mainly adopts DEA models and spatial econometric methods (i.e., the SDM method). These models have a certain degree of deficiencies. The DEA method tends to ignore the influence of radial proportional changes or slack variables, and the SDM method requires presupposition of a particular form of the production function, which can lead to the deviation of the efficiency value from the actual value.
2) The existing literature seldom analyzes the spatial association network structure of regional GIE and its evolution rules from a network perspective, including the overall characteristics, individual characteristics, and network clustering.
3) The research on the driving mechanism of the spatial association network of regional GIE is still weak. The existing studies have mainly focused on the neighboring regions without considering the influence of non-neighboring regions. Moreover, the research method is confined to the spatial econometric method based on “attribute data”. The SNA is a network analysis tool that can perform a global analysis of “relational data”, which can effectively overcome the limitation of “attribute data” and has been widely applied in the field of carbon emission (Huo et al., 2022; Yu et al., 2022). Few studies have applied the SNA method to the topic of regional GIE.
Therefore, this paper makes improvements to the existing literature in three aspects. First, the EBM model with no expected output is used to recalculate the regional GIE to solve the deviation problem in efficiency evaluation. Second, from a network perspective, the improved gravity model is used to construct the “relational data,” and the SNA method is applied to analyze the spatial association network of regional green innovation and its structure characteristics such as the overall structure, the individual structure, and the block situation. Third, based on the “relational data,” the QAP regression analysis is applied to identify further the influencing factors of the spatial association network of green innovation efficiency. These works expand the existing studies on the spatial spillover effects of regional GIE and provide helpful policy insights for promoting cross-regional green synergistic development and realizing regional green and high-quality development.
The traditional DEA radial model (represented by CCR and BCC) ignores the non-radial slack variables, while the non-radial SBM model lacks the proportion information between the target value and the actual value (Zhang J. et al., 2021). The EBM model proposed by Tone and Tsutsui (2010) introduces the exponent ε to measure the diversity and interdependence between variables. It has a more significant advantage in distinguishing the efficient decision-making unit (DMU). Recently, the EBM model has been a popular efficiency evaluation method due to the consideration of bad output factors.
Assume that there are
where
The social network originates from the concept of sociology. In a network environment, if there is a correlation between two nodes in the network, a straight line is drawn to obtain the sum of the relationships of all nodes. Currently, there are two commonly used methods to establish connections between nodes. One is the Granger causality test based on vector auto regression (VAR) (Wu, Liu, Hsiao, & Huang, 2016), and the other is the gravity model (Fan & Xiao, 2021). As a classical econometric model, the VAR model is susceptible to time lag requirements and unsuitable for cross-section data. As a result, it is unable to depict evolutionary trends and characteristics of the network. In contrast, the gravity model introduced by Reilly (1929) for the first time in population geography can comprehensively consider the factors of economic and geographical distance and reveal the evolution characteristics of spatial correlation. With these considerations, a modified gravity model to measure spatial correlation is constructed in the following:
Where
According to Eq. 2,
where
SNA is a method to accurately quantify the relationships among members in a complicated and changeable network structure and analyze the overall network properties among the nodes (Wang et al., 2018). The overall structural characteristics of the network are characterized by four indicators (Scott, 2007): network density, network correlation, network efficiency, and network hierarchy. The network density denotes the tightness of network members. The formula is:
where
Network correlation degree denotes the degree of interaction between network members. The formula used is:
where
Network efficiency indicates the connection efficiency of members. The formula is:
where E denotes the network efficiency, M is the number of network redundant correlation lines.
Network hierarchy denotes the degree of unsymmetrical reachability among network members. The formula is:
where
Centrality is an important network characteristic that reflects the position and strength size of node members in the network. Centrality includes three indicators of point centrality degree, closeness centrality degree, and betweenness centrality degree (Freeman, 1978). The formula is given by:
where
Closeness centrality degree indicates the degree to which one node in the network is independent of the others (out of control). The more valuable it is and the closer it is to other members, the more possible it will become a core player in the network. The formula is obtained by:
where
Betweenness centrality degree represents a node that dominates over other nodes. The higher the degree is, the stronger the domination ability of the node is. Betweenness centrality
Where
QAP is a method to compare the lattice value in a square matrix, explore the correlation coefficient between two different matrices according to the relational data, and conduct a non-parametric test on the correlation coefficient. The formation of the spatial association network of regional GIE results from spatial aggregation and diffusion by many social factors. According to the existing literature, the geographical factor is an important variable affecting the regional GIE (Liu et al., 2021). Some studies believe that the infrastructure (Tang, Xu, Hao, Wu, & Xue, 2021), environmental regulation (Wu et al., 2020), industrial structure (Zhang, Zhang, Zhang, & Li, 2019), openness (Ren, Hao, & Wu, 2022), urbanization (Zhou & Wang, 2011), economic development level (Zhang J. et al., 2021), and scientific and technological innovation (STI) capacity (Miao et al., 2021) have different directions and intensities of influence on regional GIE. Therefore, this paper selects the regional spatial adjacency relationship matrix (Adj) to represent the geographical factor, and seven factors of the differences in infrastructure (Dif_Infra), differences in environmental regulation (Dif_Er), differences in industrial structure (Dif_Indu), differences in external openness (Dif_Open), urbanization differences (Dif_Urban), differences in economic development level (Dif_Pgdp), and differences in science and technology innovation (Dif_Sti) are choosen as the independent variable to establish the QAP regression model. According to the above consideration, the QAP model can be established as follow:
where
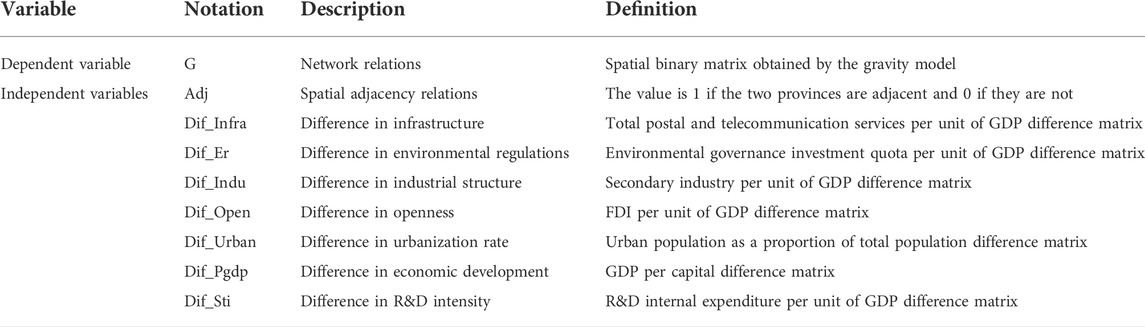
TABLE 1. Variables and data definitions.
An ineffective evaluation system may produce results that are varied or even contradictory. In order to evaluate GIE objectively, as was done in previous studies (Johnstone et al., 2017; Anser, Iqbal, Ahmad, Fatima, & Chaudhry, 2020; Bilan, Mishchuk, Roshchyk, & Kmecova, 2020; Zhang et al., 2020; Zhao et al., 2021), the GIE can be considered as the ratio between the input of innovation activities and its innovation output, economic output and comprehensive environmental output under the constraints of “innovation-driven” and “green development”.
The input indicators include labor input, capital input, and environmental input. The full-time equivalent of R&D personnel is selected as labor input, and the internal expenditure of R&D funds is selected as capital input. It needs to be particularly stated that internal expenditure of R&D funds is more objective than the R&D capital stock indicator. When computing capital stock, it can eliminate errors caused by differing techniques and depreciation rates. In addition, the energy consumption of 10,000 Yuan GDP is employed as environmental input to reflect the consumption of regional resources.
The output indicators include desirable output and undesirable output. The desirable output selects innovation outcomes and economic results, including the number of authorized patent applications and new product sales revenue. The number of patent applications authorized demonstrates the potential of a region’s innovation output and quantitatively reflects the direct consequences of innovation. New product sales revenue reflects the economic capacity of regional innovation output and the economic effect of innovation in terms of quality. Undesirable output selects environmental pollutant emissions to measure innovation activities’ damage to resources and the environment, including industrial pollution emissions: industrial SO2 emissions, industrial wastewater emissions, and industrial waste solid emissions. The indicator system is shown in Table 2.
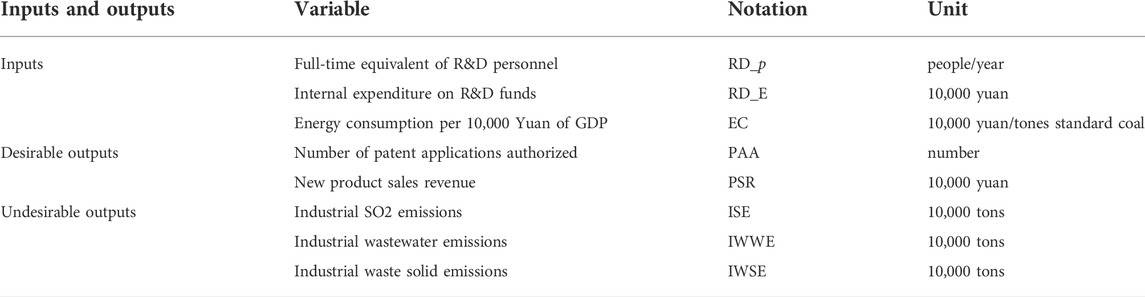
TABLE 2. Regional GIE evaluation indication system.
Due to data availability, this paper selected 30 provinces and cities in China as research units and network nodes. The research period is from 2010 to 2019, excluding Tibet, Hong Kong, Macao, and Taiwan. The input and output indicators data come from the China Statistical Yearbook of Energy, China Statistical Yearbook of Science and Technology, China Environmental Statistical Yearbook, and China Statistical Yearbook. In terms of geographical distance measurement, the 1:400,000 Chinese basic geographic information data provided (http://www.ngcc.cn/ngcc/) was used to calculate the spherical distance between provincial capitals. The descriptive statistics of the efficiency evaluation indicators are shown in Table 3. Since the data used for the QAP analysis are relationship data converted from the “Attribute to the matrix” data tool in UCINET 6.0 software, it is impossible to perform descriptive statistics on an analysis of them.
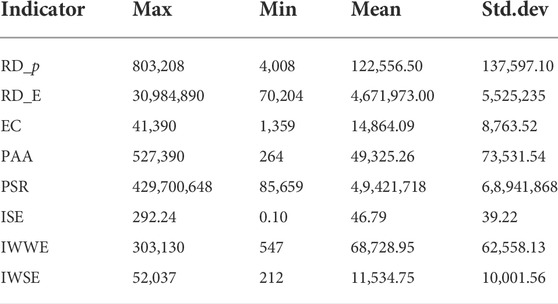
TABLE 3. Descriptive statistics of the efficiency evaluation indicators.
This section describes and analyzes the empirical results. First, the EBM model with undesirable output was adopted to obtain the GIEs of 30 provinces in China (see Table 4). Then, the spatial correlation binary matrix is determined by the modified gravity model, and the spatial association network diagrams of different years (2010, 2013, 2016, and 2019) were drawn using Arcgisl0.8 software (see Figure 3). Then, the network structure characteristics (overall and individual) and the block model are carried out by the SNA approach. Finally, the driving factors were identified by the QAP method for the spatial association network from 2010 to 2019.
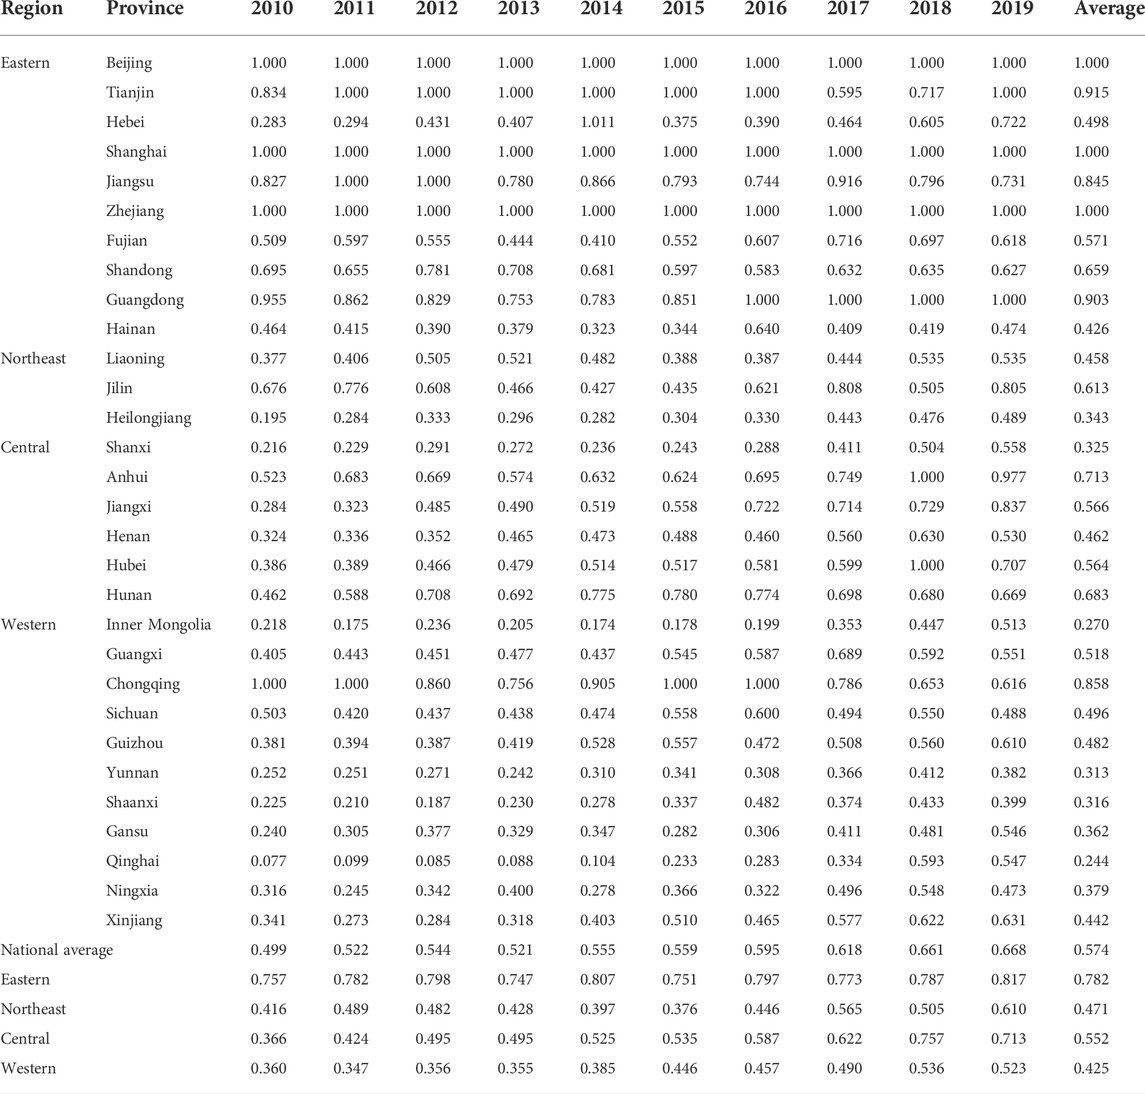
TABLE 4. Evaluation values of GIE in 30 provinces in China from 2010 to 2019.
Table 4 shows that the average value of GIE from 2010 to 2019 is only 0.574, which is at a middle to lower level and has much more potential for improvement. The efficiencies of Beijing, Shanghai, and Zhejiang are equal to 1 per year, closely related to their leadership in green innovation. Meanwhile, the efficiencies of the eastern region are always much greater than that of the northeastern, central, and western regions, with an average value of 0.782 during the study period. The potential explanation is that most provinces in the eastern region belong to the coastal provinces and have unique geographical superiority in innovation development. The reasonable allocation of innovation resources can effectively stimulate regional innovation vitality and put its innovation development level at the forefront of the country. The eastern provinces have effective environmental protection institutions available. They have more advanced technologies and state-of-the-art industrial production processes that consume less energy.
For an in-depth discussion of the regional differences in efficiency. Figure 2 draws the changing trends of GIE in four regions of China. This figure shows significant regional differences in regional GIE in China, showing prominent unbalanced distribution characteristics. Specifically, the eastern region has the highest average efficiency. It is the central zone of green innovation development in China, exhibiting a spatially differentiated characteristic of zones from eastern > northeast > central > western zones at the beginning of the period, later evolving to the zonal difference characteristic of eastern > central > northeast > western zones at the end of the period. Then, from 2010 to 2019, the increase in efficiencies in the eastern region was slow (0.757 in 2010 V.S. 0.782 in 2019). The northeastern region (0.416 in 2010 V.S. 0.471 in 2019), central region (0.366 in 2010 V.S. 0.552 in 2019), and western region (0.360 in 2010 V.S. 0.425 in 2019) have significantly improved their efficiency. Finally, the regional gap in GIE has been narrowing year by year. From 2010 to 2019, in the eastern and central regions, this gap decreased from 0.391 to 0.230; in the eastern and western regions, it decreased from 0.397 to 0.357, and in the eastern and northeastern regions decreased from 0.341 to 0.311.
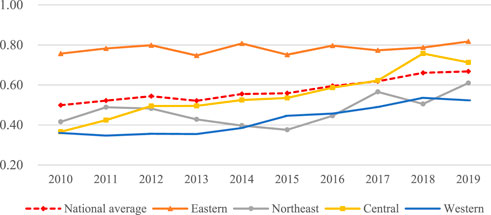
FIGURE 2. Changing trends of GIE in four regions of China.
To present the overall structural features, the gravity value is calculated using Eq. 2, and this study obtains the binary correlation matrices using Eq. 3. Then, the binary correlation matrices are imported into the ArcGIS 10.8 visualization tool to display the spatial association network. To reveal its evolution, spatial association network maps were drawn every 3 years in 2010, 2013, 2016, and 2019 respectively (see Figure 3).
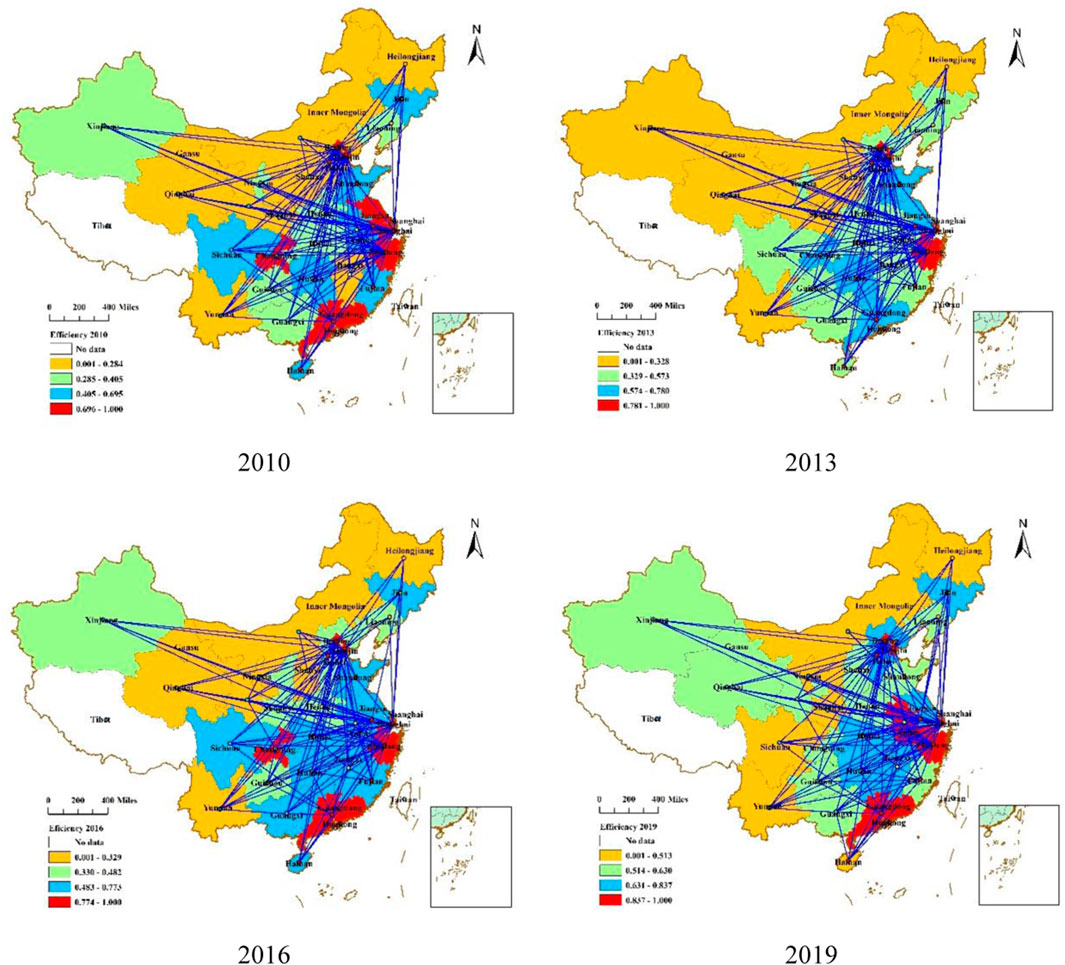
FIGURE 3. Spatial association network map of regional GIEs in China.
Figure 3 shows that China’s regional GIE networks present features of “dense in the eastern” and “sparse in the western”, which exhibits a more complex and multi-threaded spatial network association. The spatial associations are no longer restricted to spillover effects on the efficiency of green innovation in neighboring provinces. However, they are spatially associated with non-neighboring provinces, which indicates that a breakthrough from the traditional geospatial limitation has occurred. In the networks, the correlations of GIE are significantly higher in Shanghai, Beijing, Zhejiang, Jiangsu, and Guangdong provinces and cities than in other provinces. This phenomenon is mainly due to the better infrastructural conditions for innovation capital and talent in these regions, the high number of environmental protection institutions, and the well-developed infrastructure conducive to the exchange and cooperation of green technologies. In terms of the number of spatial relations, from 2010 to 2016, the number of relations remained at about 160. In 2018, the number of relations increased significantly to 183 (the maximum number of relations), with Jiangsu, Zhejiang, Inner Mongolia, and Jiangxi enjoying rising status in the network. In 2019, the number of relations dropped significantly to 156 (the minimum number of relations), mainly due to the sharp decline in the number of relations in Tianjin, Hebei, Liaoning, Jilin, and Heilongjiang, which was closely related to their GDP decline in 2019. Overall, China’s regional GIE network presents typical spatial correlation characteristics with prominent non-equilibrium. It formed a network structure with Beijing, Tianjin, and Yangtze River Delta as the core, showing an obvious eastern-intensive geographical differentiation pattern.
The overall structure characteristics of a network are described with the help of four indicators: network relationship quantity, network density, network efficiency, and network hierarchy. UCINET6.0 software calculates the four indicators to obtain the results, shown in Figure 4.
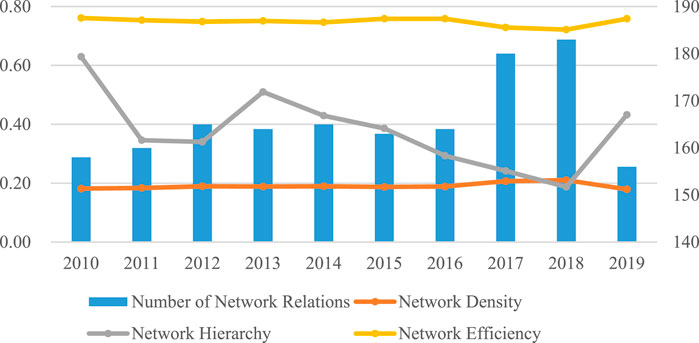
FIGURE 4. Overall network structure characteristic of four indicators.
From Figure 4, the correlation number and network density of regional GIE in China show an upward trend, while the network hierarchy and efficiency show a slow downward trend. Specifically, since 2010, the number of network relations has grown from 158 in 2010 to 165 in 2012, stabilized after 2012, and increased rapidly after 2017, reaching a peak of 0.210 in 2018, suggesting the spatial fluidity of green innovation factor resources has been growing. The network density increased slowly from 2010 to 2018 (0.182 in 2010 V.S. 0.210 in 2018). Still, in 2019, it dropped to 0.180 in some provinces and cities such as Tianjin, Hebei, Jilin, Heilongjiang, and Liaoning, which is deeply related to the decline in their economic development level. It should be pointed out that the number of spatial relations is relatively small during the observation period. There is still a noticeable gap with the maximum possible network relationships (30*29), which indicates that at the provincial level, spatial interaction and spillover effect of GIE are still weak. There is still more room for enhancing the inter-provincial synergistic impact of green innovation development. The overall network hierarchy fluctuates wildly and presents an oscillating downward trend, decreasing 31.42% from 0.630 in 2010 to 0.432 in 2019. The lowest value in 2018 is 0.187, reflecting the gradual disintegration of the internal network level structure. The network efficiency slightly declined, from 0.761 in 2010 to 0.759 in 2019, indicating many spillover channels in the network. Meanwhile, the inter-provincial transmission and spillover cost of GIE is reduced, and the stability of the network structure is gradually enhanced.
Centrality analysis is employed to characterize the structure of individual networks. The study selected data with the maximum and the minimum number of network relationships in 2018 and 2019, respectively. Using the centrality tool in UCINET 6.0, the values of the three indicators of point centrality within and out degrees, closeness centrality degree, and betweenness centrality degree are determined. Table 5 describes the results.

TABLE 5. Network centrality analysis of spatial correlation of regional green efficiency in China.
The average point centrality degrees in 2018 and 2019 are 32.644 and 29.195, respectively. Six provinces and cities, including Beijing, Tianjin, Shanghai, Jiangsu, Zhejiang, and Guangdong, have higher than the average value; all are located in Beijing-Tianjin and Yangtze River Delta. These provinces occupy dominant positions in the network. Furthermore, these provinces and cities have point-in degrees always more significant than the average, which are the beneficiary members of the spatial association network. As for the point-out degrees, 11 provinces and cities, including Jiangxi, Hubei, Hunan, Guangdong, Guangxi, Hainan, Chongqing, Sichuan, Guizhou, Yunnan, and Gansu, have point-out degrees always more significant than the average, which are the overflow members of the spatial association network. Further exploring the spillover-benefit relationship, five provinces, including Beijing, Tianjin, Shanghai, Jiangsu, Zhejiang, and Anhui, have point-in degrees consistently higher than the point-out degrees. The number of beneficial relationships in these regions is greater than the number of spillover relationships. They receive more spillover from other regions in the correlation network, showing noticeable beneficial effects. The reason is that these provinces and cities are situated in well-developed economic regions in China, with a solid economic foundation and the highest level of green innovation development and resource allocation. Especially with the formulation and enforcement of the unified regional development strategy, the capital, technology, and management methods conducive to green innovation development have been spreading to these regions, showing a strong “siphon effect”.
The average values of the closeness centrality degree in 2018 and 2019 are 60.597 and 59.668, respectively. Five provinces and cities, including Beijing, Tianjin, Shanghai, Jiangsu, and Zhejiang, have closeness centrality degrees consistently more significant than the average. The findings show that Beijing-Tianjin and Yangtze River Delta regions can quickly establish their linkages with other provinces and perform a leadership role as hub actors in the network. In comparison, the remaining provinces (except Guangdong province in 2019) have below-average closeness centrality degrees, denoting that the other provinces have little network connections and play a fulcrum and conduction role.
The average betweenness centrality degree in 2018 and 2019 are 2.438 and 2.537, respectively, indicating that the dominant role of central network nodes tended to weaken, and the network structure was characterized by evident disequilibrium. The betweenness centrality degrees of five eastern provinces, including Beijing, Tianjin, Shanghai, Jiangsu, and Zhejiang, consistently have higher than the average. These provinces have more control over resources and elements in the network and have a more vital ability to facilitate the establishment of connections among other provinces, acting as “intermediary” and “bridge” roles in the network. In contrast, western, central, and northeastern provinces maintain a low betweenness centrality degree. They have weak control over the spatial correlation of other provinces, which are easily changed by provinces with higher betweenness centrality degrees.
A block model is an analytical tool that divides the role of each network node to explain network structure features (Su & Yu, 2019). Role division theory is based on the idea of clustering and rearranging the initial matrix with the method of cluster analysis to obtain a structurally coordinated matrix (White, Boorman, & Breiger, 1976). The role division method divides the network into four groups of blocks in terms of “net spillover”, “bidirectional spillover”, “broker”, and “primary beneficial”. Net spillover block usually involves fewer external relationships established through relationships with other block members rather than their own. In contrast, the bidirectional spillover block receives connections from both external and internal members. The broker block receives and transmits external ties but fewer internal, while the primary beneficial block involves numerous external relationships.
The data for the maximum and the minimum number of network relationships (2018 and 2019, respectively) are also selected. The CONCOR tool in UCINET6.0 software set the concentration standard as 0.2 and the maximum segmentation depth as 2. Four blocks were generated by this method. The results are presented in Figure 5 and Table 6.
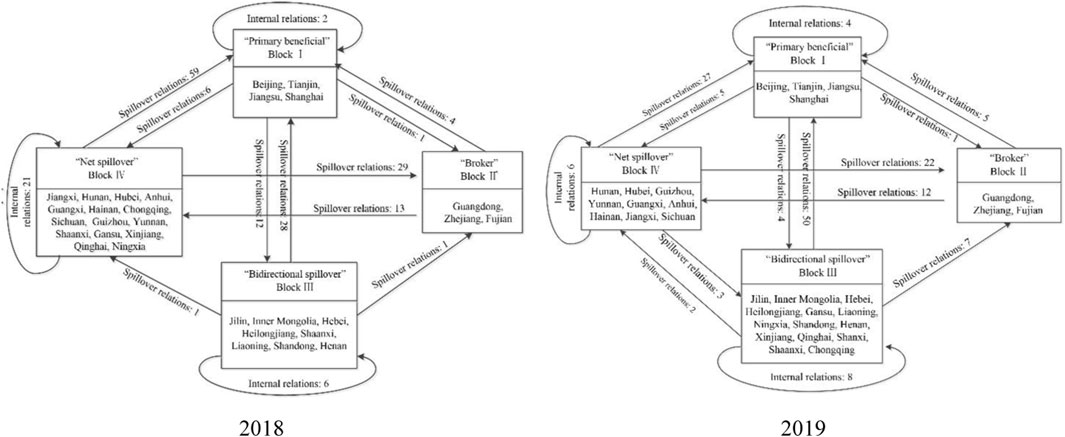
FIGURE 5. The relations between the four blocks of China’s regional GIE.
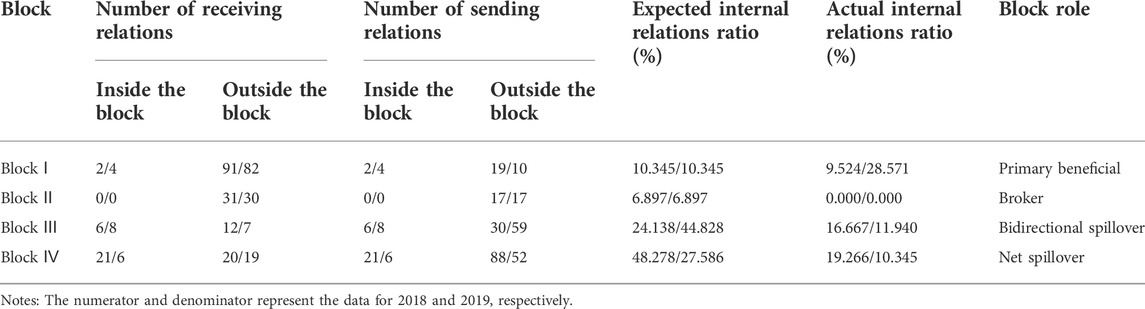
TABLE 6. The spillover effect of four blocks of spatial association network of GIE in China.
From Figure 5, in 2018, four provinces and cities, including Beijing, Tianjin, Jiangsu, and Shanghai, belong to the Block Ⅰ; three provinces, including Guangdong, Zhejiang, and Fujian, belong to the Block Ⅱ; eight provinces, including Jilin, Inner Mongolia, Hebei, Heilongjiang, Shaanxi, Liaoning, Shandong, and Henan, belong to the Block Ⅲ; 15 provinces and cities, including Jiangxi, Hunan, Hubei, Anhui, Guangxi, Hainan, Chongqing, Sichuan, Guizhou, Yunnan, Shaanxi, Gansu, Xinjiang, Qinghai, Ningxia, belong to the Block Ⅳ. In 2019, there is no change in the members of Blocks Ⅰ and Ⅱ, and the number of members of Blocks Ⅲ and Ⅳ changes significantly. Among them, eight provinces and cities in Gansu, Liaoning, Ningxia, Xinjiang, Qinghai, Shanxi, Shaanxi, and Chongqing changed from the Block IV to Block III, the membership of Block IV decreased sharply to only eight provinces and cities, and the membership of Block III increases steeply to 14 provinces. In summary, the members of Block Ⅰ and Block Ⅱ are the eastern economically developed provinces, while the members of Block Ⅲ are mostly provinces in the northeast and western regions, and the members of Block Ⅳ are primarily from the central and western provinces.
Table 6 shows that the total number of maximum relations in the spatial association network of GIE in 2018 is 183. The proportions of inside and outside block relations are 15.846% and 84.154%, respectively. In contrast, the total number of minimum relations in 2019 decreased to 156, and the inside- and outside-block relations proportion are 11.538% and 88.462%, respectively. The spatial spillover effect of regional GIE in China is dominated by outside block spillover. Specifically, in 2018, Block I has 21 sending and 93 receiving relations, respectively. The expected ratio of internal relations (10.345%) exceeds the actual ratio (9.524%). Block I receives more relations than it sends and belongs to a “primary beneficial” block; Block Ⅱ has 17 sending and 31 receiving relations, respectively. The expected ratio of internal relations (6.897%) exceeds the actual ratio (0.000%). The receiving and the sending relations of Block II only come from outside the block, acting as a “bridge” and “intermediary” in the network, and Block II belongs to a “broke” block; Block Ⅲ has 36 sending and 18 receiving relations, respectively. The expected ratio of internal relations (24.138%) exceeds the actual ratio (16.667%). The receiving and the sending relations of Block III occur both inside and outside the block, so it belongs to a “bidirectional spillover” block; Block Ⅳ has 109 sending and 41 receiving relations, respectively. The expected ratio of internal relations (48.278%) exceeds the actual ratio (19.266%). There are significantly more sending relations in Block IV than receiving relations, and Block IV represents a “net overflow” block. In contrast, in 2019, the number of internal receiving and sending relations of Blocks I and Ⅱ remained unchanged, indicating that Blocks I and Ⅱ tended to be stable. In contrast, in 2019, the number of receiving and sending relations of Blocks I and Ⅱ remain unchanged, and the correlation network tends to be stable, consistent with the depiction in Figure 5 (no change in the members of Blocks I and Ⅱ)). The number of sending relations in Block Ⅲ increases significantly, but the number of receiving relations decreases slightly, weakening the “bidirectional spillover” effect. The number of receiving and sending relations inside Block Ⅳ decreases significantly, indicating that the “net spillover” effect is significantly reduced, and the interaction among the members in Block Ⅳ is diminished.
In order to deeply study the spillover relationship among the four blocks, this paper calculates the density matrix of each block and converts it into an image matrix2 (see Table 7), and draws the simplified spillover effect flow chart of the four blocks (see Figure 6). The arrow lines and arcs depict the spillover relations within and between the blocks. In 2018, Block I received the spillover from Blocks II, III, and IV I, indicating that more innovative resources and energy consumption in economically developed provinces come from resource-rich provinces. Block II receives the spillover from Block IV and spillovers to Block IV and Block I. The bidirectional flow trend of green innovation resources between the central, western, and part of the eastern regions strengthens the spillover relations between Block II and Block IV. Block II performs the role of an “intermediary” in the network. Block III receives the spillover of block I, indicating that green innovation resources in eastern provinces can be shared and enhance the frequency of interaction between the two blocks. By comparison, in 2019, Block I increased its internal spillover effect. Still, there is no spillover effect with Block III, which somewhat reduces the spillover relationship between Block I and Block III. The spillover effects of other blocks remain consistent in 2018, and the spillover effects between the blocks generally tend to be stable.
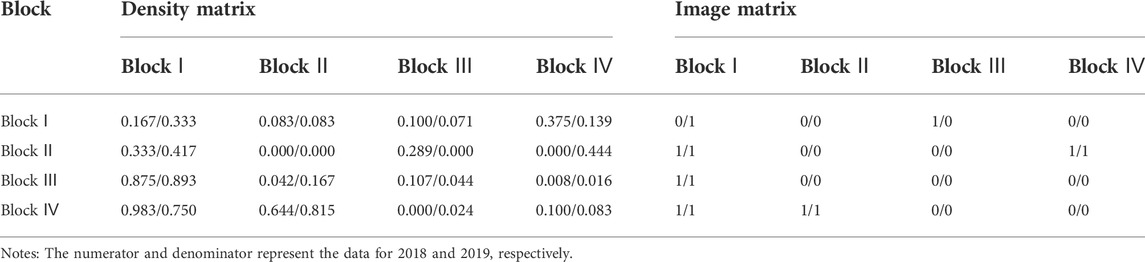
TABLE 7. The density matrix and image matrix of spatial association network of GIE in China.
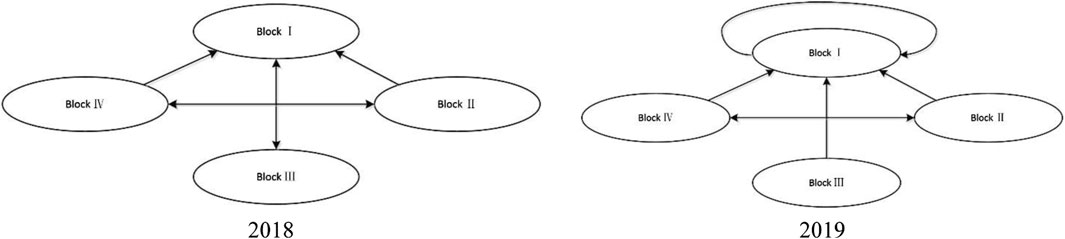
FIGURE 6. Simplified spillover effect flow diagram of four blocks.
In this section, the QAP model is performed to conduct the correlation analysis to explore the spatial correlation matrix of regional GIE in China and its potential influencing factors from 2010 to 2019. Table 8 shows the correlation analysis results of driving factors and regional GIE from 2010 to 2019. According to the correlation analysis results, it can be seen that all variables have passed the significance level test. The correlation coefficient of Dif_Er has a significant negative correlation with the spatial correlation of regional GIE, which reflects that the similarity of environmental regulation can promote the spatial correlation of regional GIE. The correlation coefficient of Adj, Dif_Infr, Dif_Indu, Dif_Open, Dif_Urban, Dif_Pgdp, and Dif_Sti have significant positive correlations, suggesting that the greater differences in such variables can strengthen the spatial association network. The QAP correlation analysis results show significant correlations among multiple factors, which can solve the multicollinearity problem among independent variables to a certain extent. In this study, the inter-provincial differences of eight variables of Adj, Dif_Infr, Dif_Er Dif_Indu, Dif_Open, Dif_Urban, Dif_Pgdp, and Dif_Sti were selected for QAP regression analysis with the spatial intensity of regional GIE.
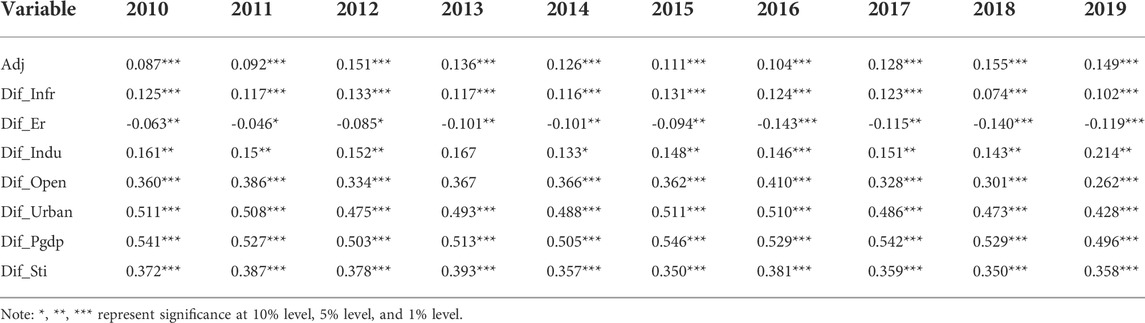
TABLE 8. QAP correlation analysis results of driving factors and regional GIE (2010–2019).
The QAP regression analysis was performed for the data from 2010 to 2019, year by year, with the following principles: 5,000 random permutations were chosen, and UCINET6.0 software was used to obtain the spatial correlation coefficients between the spatial correlation matrix of regional GIE and driving factors. The results are reported in Table 9. The results show that the Adj, Dif_Infr, Dif_Urban, and Dif_Pgdp all pass the significance test (at least 10% statistical level), indicating that these four variables are the significant factors affecting the spatial association network strength of regional GIE in China. In Table 9, Adj-R2 is in the range of 0.312–0.347, all of which have passed the significance test at the 1% level. The good fitting effect indicates that the selected driving factor variables can effectively explain the changes in the spatial connection of GIE in China.
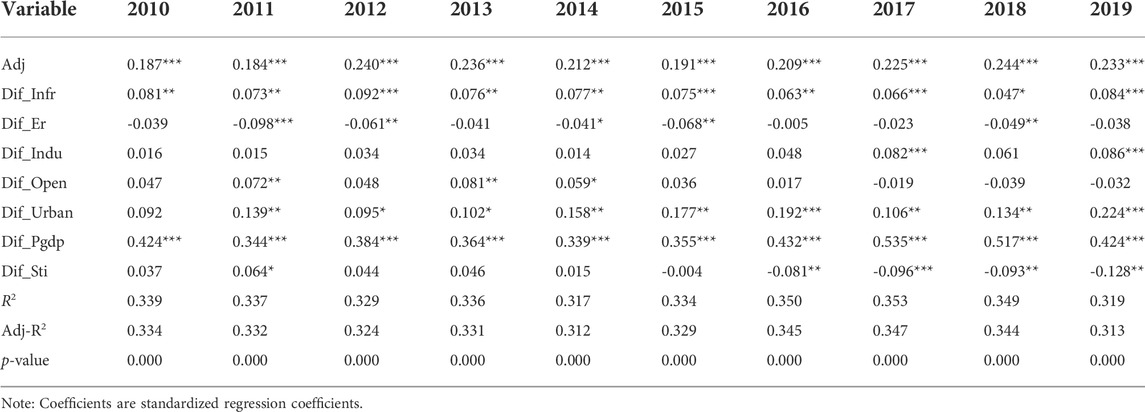
TABLE 9. Results of QAP regression analysis (2010–2019).
The geographical spatial adjacency (Adj) factor has a positive regression coefficient at 1% significance test. Geographical proximity can reduce the costs of transmission and spillover of green innovation resources between provinces (Liu et al., 2021), which enhances the frequency of innovation exchange activities and facilitates the resource flow, as well as the phenomenon of “club convergence”. This finding is consistent with the block analysis in Figure 5, where Fujian, Guangdong, and Zhejiang are clustered into block Ⅱ. Therefore, the closer the region is, the stronger the correlation of regional GIE and the more affected it is by the surrounding regions. The standardized regression coefficients of Dif_Pgdp range from 0.339 to 0.535, which are significant at the 1% level; the standardized regression coefficients of Dif_Infr range from 0.047 to 0.092, and those of Dif_Urban range from 0.095 to 0.192 (except in 2010), all of which are significant at more than 10% level. It suggests that when the other factors stay unchanged, Dif_Pgdp, Dif_Infr, and Dif_Urban significantly affect the strength of this spatial association network. Specifically, Beijing, Tianjin, Jiangsu, and Shanghai are the regions with high levels of economic development. They have the advanced infrastructure, high urbanization, and convenient information flow, which can frequently exchange and cooperate with their more different regions in green innovation activities and strengthen the spatially associated network of regional GIEs. Consequently, these regions not only act as “intermediary” and “bridge” roles in the network (see Table 5) but also benefit from spatial spillover effects (see Figure 5). After 2016, the standardized regression coefficients of the Dif_Sti are significantly negative, suggesting that a similar STI can facilitate strengthening the spatial association network. Analogous to the study of Liu et al. (2021), China’s regions with high green technology levels are mainly located in the eastern region (see Table 4). The smaller the differences in STI levels in these regions, the more convenient the flow of innovation factors such as human resources, capital, knowledge, and technology contributes to strengthening the spatial association network of regional GIE. Conversely, the greater the differences in STI levels, such as the gap between eastern and western regions shown in Figure 2, the existence of technological barriers will also hinder the development and expansion of the spatial association network.
Three factors of the Dif_Indu, Dif_Open, and Dif_Er have passed the significance test only for individual years. Three driving factors on the spatial association network of Chinese regional GIE are relatively weak and have stage characteristics. One possible explanation is that China’s complementary and misaligned regional industrial division system weakens the impact of industrial structure differences. In recent years, the dependence of China’s economic development on foreign trade has gradually decreased, weakening the impact of the difference in openness to the outside world. In addition, similar environmental regulations mean that these regions have roughly the same degree of environmental pollution and have similar demands for resource elements needed for green innovation development, promoting the formation of spatial correlation relationships of regional GIE. Furthermore, environmental regulation policies mainly affect industrial enterprises, and their influence on regions is small, which weakens the influence of environmental regulation differences on the spatial association network strength of regional GIE.
According to the above findings, the differences arising from geographical adjacency factors are inevitable. The local governments should organize regular communication activities to share their advanced innovative approach and philosophy to accomplish some degree of consensus and cooperation. The relevant government departments in each region should organize regular exchange activities to share their advanced innovative methods and ideas in order to reach a certain degree of consensus on cooperation. In this way, the problems caused by geographical differences can be overcome to the greatest extent. By comparison, in the current period, differences in infrastructure, differences in economic development, differences in R&D intensity, and differences in urbanization rates are inherent attributes of each region. Therefore, regional governments should increase infrastructure construction, balance local economic development, improve the intensity of science and technology innovation, adjust the population structure, and strengthen the excellent office role of the related departments to facilitate inter-regional exchanges and cooperation.
This study aims to examine the spatial spillover effects of regional GIEs in China from a network perspective. In response to the current situation of their spatial association networks, the main works of this article are to analyze the characteristics of their overall and individual network structures, explore their block clustering and identify their driving factors. Based on the detailed empirical evidence in this paper, the following conclusions can be drawn:
1) China’s regional GIE is low (the average value is 0.574) from 2010 to 2019, with much space for promotion. In terms of spatial distribution, there is a significant non-equilibrium, gradually showing a zonal divergence over time as the eastern region > central region > northeastern region > western region (see Figure 2). At the cross-provincial level, the efficiency values of Beijing, Shanghai, and Zhejiang in the eastern region consistently equal 1 per year. In contrast, in the western region, those of Inner Mongolia, Shanxi, Qinghai, Anhui, Guizhou, Gansu, Ningxia, and Xinjiang are lower.
2) In terms of the network structure characteristics, during the research period, the network of GIE at the regional level in China exceeded the conventional geographic spatial constraints. It displayed a relatively complicated and cross-threaded network association (see Figure 3). However, the network association number is still far from the maximum possible network relationship number, and the network association structure is relatively loose. Meanwhile, the spatial association network has a specific hierarchical gradient, showing the characteristics of “dense in the eastern” and “sparse in the western”. Hence, increasing the network density and reducing the network hierarchy are the critical elements to reaching the green and sustainable development goals in China’s region. These findings support Ethier (1998)’s proposal for a new concept of new regionalism, whose principles advocate regional integration and coordinated development. Therefore, the joint regional innovation development strategy offers a new way of promoting green development via innovation at this stage.
3) The block model analysis shows that the spatial spillover effect of regional GIE in China is dominated by the spillover outside the block (see Table 6 and Figure 6). Specifically, provinces and cities with high GIE (such as Beijing, Tianjin, Jiangsu, and Shanghai) have no significant impact on the connectivity of other provinces and cities. Nevertheless, these provinces and cities gain more significant green innovation linkage benefits from the others with less outflow of their green innovation factors. By comparison, other eastern economically developed provinces (e.g., Zhejiang, Guangdong, and Fujian) have close spatial connections with other regions in the network and act as “intermediaries” for factor communication. Furthermore, Due to the over-exploitation of natural resources (Yang et al., 2019), the efficiency of green innovation in the northeast region of China (e.g., Liaoning, Jilin, and Heilongjiang) has been stagnant, and the bidirectional spillover effect tends to weaken. The central and western regions with lower GIE play a net spillover role in the network. Therefore, more efforts should be made to focus on green innovation and cleaner production investment in these provinces.
4) Five driving factors of The Adj, Dif_Infr, Dif_Urban, Dif_Pgdp, and Dif_Sti are the fundamental factors influencing the formation of spatial association networks in each province. Among them, Dif_Infr, Dif_Urban, and Dif_Pgdp have positive and significant effects, which are conducive to the formation of a tight spatial association network, while Dif_Sti has a negative effect, which is not conducive to strengthening the spatial association network strength. Three driving factors, Dif_Indu, Dif_Open and Dif_Er, have less influence on the spatial association network.
Based on the results of the study, the following implications are made for the future development of regional GIE in China:
1) From the national level perspective, the spatial correlation should be regarded as a new regional innovation and development engine. The government should implement several measures. For example, it is developing and constructing spatial spillover ties. It is necessary to improve the spatial overflow mechanism and system of GIE. The inter-provincial spatial connection of China’s GIE needs to be strengthened.
2) From the regional perspective, local governments should optimize the green industry structure and pay attention to win-win cooperation with other provinces. Specifically, the eastern region should maximize its radiating and driving effect on other regions. The northeast and western regions, increase its connection with less developed regions and balance the receiving and spillover relationship with provinces and cities to improve the regional GIE significantly. Meanwhile, the central and western regions should reduce their own spillover effects as much as possible and enhance their transmission mechanisms. For example, they can enhance the investment in green innovation technology, deepen the reform of the pollution governance system, and promote regional balance and coordination, so as to improve the efficiency of green innovation in China’s regions
3) Emphasis should be placed on reinforcing the linkages of green innovation resource elements in the four inter-regions, particularly between the northeast and western regions, and break the segmentation between regions to promote the regional joint and collaborative improvement of GIE. Meanwhile, it further strengthens the inter-provincial green innovation connection in the eastern region, particularly the inter-provincial linkage in the north-south direction, and increases the correlation density in the eastern region.
4) It is necessary to emphasize the role of spatial adjacency within the green innovation network. Attention is paid to the coordination and enhancement of GIE between the provinces with relatively short geographical distances, minor differences in economic development, and significant technological innovation differences to promote the overall improvement of GIE in China. Furthermore, the administrative authorities should optimize the investment environment, actively transfer green industries from the eastern region based on resource carrying and environmental capacity, and form a green industrial division of labor layout with staggered and coordinated development.
There are still some deficiencies in this study. First, the spatial clustering mode of regional GIE and the block transmission mechanism are still unclear. Subsequently, the agglomeration type of small groups can be identified by the cohesive subgroup analysis method of the SNA to reveal the block interaction pattern of the spatial association network. Second, this paper only analyzes the spatial association network of GIE at the regional scale in China. In the future, we can refine the research scale to explore the dynamic association relationship and spillover effect of GIE at different spatial scales. Third, forming a spatial association network of regional GIE results from the joint action of many factors. Other factors, such as differences in digitalization level and financing environment between regions, have not yet been considered. Further studies are needed to explore other possible driving factors to grasp more comprehensively the driving mechanism of the spatial correlation of regional GIE. In addition, when measuring the regional GIE, the cross-efficiency method can be considered, and the self-evaluation and peer-evaluation mechanisms of the cross-efficiency method can be considered to obtain the efficiency evaluation matrix. All the above-proposed aspects are important directions that deserve to be deepened.
The original contributions presented in the study are included in the article/Supplementary Material, further inquiries can be directed to the corresponding authors.
Writing—original draft preparation, HZ; writing—review and editing, HL, KZ.
This work was supported by the Social Science Fund Project of Fujian Province, China (Grant No. FJ 2020B028); Education Research Project for Young and Middle-aged Teachers of Educational Commission of Fujian Province, China (Grant No. JAS19138).
The authors declare that the research was conducted in the absence of any commercial or financial relationships that could be construed as a potential conflict of interest.
All claims expressed in this article are solely those of the authors and do not necessarily represent those of their affiliated organizations, or those of the publisher, the editors and the reviewers. Any product that may be evaluated in this article, or claim that may be made by its manufacturer, is not guaranteed or endorsed by the publisher.
1The Data are from China Emission Accounts and Datasets, CEADs (https://www.ceads.net.cn/).
2The image matrix can be obtained by the following method: When the density value is higher than the average, the image density is 1; When the density value is lower than the average, the image density is 0.
Anselin, L., Varga, A., and Acs, Z. (1997). Local geographic spillovers between university research and high technology innovations. J. Urban Econ. 42 (3), 422–448. doi:10.1006/juec.1997.2032
Anser, M. K., Iqbal, W., Ahmad, U. S., Fatima, A., and Chaudhry, I. S. (2020). Environmental efficiency and the role of energy innovation in emissions reduction. Environ. Sci. Pollut. Res. 27 (11), 29451–29463. doi:10.1007/s11356-020-09129-w
Audretsch, D. B., and Feldman, M. P. (1996). R&D spillovers and the geography of innovation and production. Am. Econ. Rev. 86 (3), 630–640.
Barnes, J. A. (1954). Class and committees in a Norwegian island parish. Hum. Relat. 7, 39–58. doi:10.1177/001872675400700102
Bartlett, D., and Trifilova, A. (2010). Green technology and eco-innovation: Seven case-studies from a Russian manufacturing context. Jnl. Manu. Tech. Mnagmnt. 21 (8), 910–929. doi:10.1108/17410381011086757
Bilan, Y., Mishchuk, H., Roshchyk, I., and Kmecova, I. (2020). An analysis of intellecutal potential and its impact on the social and economic development of European countries. J. Compet. 12 (1), 22–38. doi:10.7441/joc.2020.01.02
Boschma, R. A. (2005). Proximity and innovation: A critical assessment. Reg. Stud. 39 (1), 61–74. doi:10.1080/0034340052000320887
Canils, M. C. J., and Verspagen, B. (2001). Barriers to knowledge spillovers and regional convergence in an evolutionary model. J. Evol. Econ. 11 (3), 307–329. doi:10.1007/s001910100085
Cantner, U., and Graf, H. (2006). The network of innovators in Jena: An application of social network analysis. Res. Policy 35 (4), 463–480. doi:10.1016/j.respol.2006.01.002
Cui, Q., Li, Y., and Wei, Y. M. (2018). Comparison analysis of airline energy efficiency under weak disposability and strong disposability using a virtual frontier slack-based measure model. Transp. J. 57 (1), 112–135. doi:10.5325/transportationj.57.1.0112
Dong, F., Li, Y. F., Qin, C., and Sun, J. J. (2021). How industrial convergence affects regional green development efficiency: A spatial conditional process analysis. J. Environ. Manag. 300, 113738. doi:10.1016/j.jenvman.2021.113738
Fan, J. D., and Xiao, Z. H. (2021). Analysis of spatial correlation network of China's green innovation. J. Clean. Prod. 299 (2), 126815. doi:10.1016/j.jclepro.2021.126815
Freeman, L. C. (1978). Centrality in social networks conceptual clarification. Soc. Netw. 1 (3), 215–239. doi:10.1016/0378-8733(78)90021-7
Gente, V., and Pattanaro, G. (2019). The place of eco-innovation in the current sustainability debate. Waste Manag. 88 (APR), 96–101. doi:10.1016/j.wasman.2019.03.026
Giuliani, E., and Bell, M. (2005). The micro-determinants of meso-level learning and innovation: Evidence from a Chilean wine cluster. Res. policy 34 (1), 47–68. doi:10.1016/j.respol.2004.10.008
He, W. C., Li, E. L., and Cui, Z. Z. (2021). Evaluation and influence factor of green efficiency of China's agricultural innovation from the perspective of technical transformation. Chin. Geogr. Sci. 31 (2), 313–328. doi:10.1007/s11769-021-1192-x
Hoekman, J., Frenken, K., and Van Oort, F. (2009). The geography of collaborative knowledge production in Europe. Ann. Reg. Sci. 43 (3), 721–738. doi:10.1007/s00168-008-0252-9
Huang, Y., and Wang, Y. B. (2020). How does high-speed railway affect green innovation efficiency? A perspective of innovation factor mobility. J. Clean. Prod. 265, 121623. doi:10.1016/j.jclepro.2020.121623
Huo, T., Cao, R., Xia, N., Hu, X., Cai, W., and Liu, B. (2022). Spatial correlation network structure of China's building carbon emissions and its driving factors: A social network analysis method. J. Environ. Manag. 320, 115808. doi:10.1016/j.jenvman.2022.115808
Inoue, H., Souma, W., and Tamada, S. (2007). Spatial characteristics of joint application networks in Japanese patents. Phys. A Stat. Mech. its Appl. 383 (1), 152–157. doi:10.1016/j.physa.2007.04.096
Jaffe, A. B., Henderson, T. R., and Henderson, R. (1993). Geographic localization of knowledge spillovers as evidenced by patent citations. Q. J. Econ. 108 (3), 577–598. doi:10.2307/2118401
Johnstone, N., Managi, S., Rodriguez, M. C., Hascic, I., Fujii, H., and Souchier, M. (2017). Environmental policy design, innovation and efficiency gains in electricity generation. Energy Econ. 63 (MAR.), 106–115. doi:10.1016/j.eneco.2017.01.014
Krätke, S. (2010). Regional knowledge networks: A network analysis approach to the interlinking of knowledge resources. Eur. Urban Reg. Stud. 17 (1), 83–97. doi:10.1177/0969776409350794
Li, D., Wei, Y. D., and Wang, T. (2015). Spatial and temporal evolution of urban innovation network in China. Habitat Int. 49, 484–496. doi:10.1016/j.habitatint.2015.05.031
Li, D., and Zeng, T. (2020). Are China's intensive pollution industries greening? An analysis based on green innovation efficiency. J. Clean. Prod. 259, 120901. doi:10.1016/j.jclepro.2020.120901
Li, J., and Du, Y. X. (2020). Spatial effect of environmental regulation on green innovation efficiency——evidence from prefectural-level cities in China. J. Clean. Prod. 286 (1), 125032. doi:10.1016/j.jclepro.2020.125032
Li, T., and Fu, W. Y. (2015). Spatial processes of regional innovation in Guangdong province, China: Empirical evidence using a spatial panel data model. Asian J. Technol. Innovation 23 (3), 304–320. doi:10.1080/19761597.2015.1120499
Lin, Z. A., Jian, L. B., Qd, C., Yang, Z. A., Yw, A., and Yong, W. A. (2021). Green technology innovation efficiency of energy-intensive industries in China from the perspective of shared resources: Dynamic change and improvement path. Technol. Forecast. Soc. Change 170, 120890. doi:10.1016/j.techfore.2021.120890
Liu, C. Y., Gao, X. Y., Ma, W. L., and Chen, X. T. (2020). Research on regional differences and influencing factors of green technology innovation efficiency of China's high-tech industry. J. Comput. Appl. Math. 369, 112597. doi:10.1016/j.cam.2019.112597
Liu, X. H. (2018). Dynamic evolution, spatial spillover effect of technological innovation and haze pollution in China. Energy & Environ. 29 (6), 968–988. doi:10.1177/0958305x18765249
Liu, Y. Q., Shao, X. Y., Tang, M. P., and Lan, H. X. (2021). Spatio-temporal evolution of green innovation network and its multidimensional proximity analysis: Empirical evidence from China. J. Clean. Prod. 283, 124649. doi:10.1016/j.jclepro.2020.124649
Luo, Q., Miao, C., Sun, L., Meng, X., and Duan, M. (2019). Efficiency evaluation of green technology innovation of China's strategic emerging industries: An empirical analysis based on Malmquist-data envelopment analysis index. J. Clean. Prod. 238, 117782. doi:10.1016/j.jclepro.2019.117782
Maggioni, M. A., Uberti, T. E., and Usai, S. (2011). Treating patents as relational data: Knowledge transfers and spillovers across Italian provinces. Ind. Innov. 18 (1), 39–67. doi:10.1080/13662716.2010.528928
Marrocu, E., Paci, R., and Usai, S. (2013). Proximity, networking and knowledge production in Europe: What lessons for innovation policy? Technol. Forecast. Soc. Change 80 (8), 1484–1498. doi:10.1016/j.techfore.2013.03.004
Miao, C.-l., Duan, M.-m., Zuo, Y., and Wu, X.-y. (2021). Spatial heterogeneity and evolution trend of regional green innovation efficiency--an empirical study based on panel data of industrial enterprises in China's provinces. Energy Policy 156, 112370. doi:10.1016/j.enpol.2021.112370
Motoyama, Y., Cao, C., and Appelbaum, R. (2014). Observing regional divergence of Chinese nanotechnology centers. Technol. Forecast. Soc. Change 81, 11–21. doi:10.1016/j.techfore.2013.02.013
Pan, X. F., Chu, J. H., Pan, X. Y., and Wang, M. Y. (2021). A comparative analysis of changes in urban innovation spatial correlation effect in China and its driving factors. Asian J. Technol. Innovation 29 (1), 1–15. doi:10.1080/19761597.2020.1726782
Peng, W., Yin, Y., Kuang, C., Wen, Z., and Kuang, J. (2021). Spatial spillover effect of green innovation on economic development quality in China: Evidence from a panel data of 270 prefecture-level and above cities. Sustain. Cities Soc. 69 (2), 102863. doi:10.1016/j.scs.2021.102863
Reilly, W. J. (1929). Method for the study of retail relationships. Austin, TX: University of Texas Press.
Ren, S., Hao, Y., and Wu, H. (2022). The role of outward foreign direct investment (OFDI) on green total factor energy efficiency: Does institutional quality matters? Evidence from China. Resour. Policy 76, 102587. doi:10.1016/j.resourpol.2022.102587
Scott, J. (2011). Social network analysis: Developments, advances, and prospects. Soc. Netw. Anal. Min. 1 (1), 21–26. doi:10.1007/s13278-010-0012-6
Senghore, F., Campos-Nanez, E., Fomin, P., and Wasek, J. S. (2015). Applying social network analysis to validate mass collaboration innovation drivers: An empirical study of NASA's International Space Apps Challenge. J. Eng. Technol. Manag. 37, 21–31. doi:10.1016/j.jengtecman.2015.08.007
Shang, Q. Y., Poon, J. P. H., and Yue, Q. T. (2012). The role of regional knowledge spillovers on China's innovation. China Econ. Rev. 23 (4), 1164–1175. doi:10.1016/j.chieco.2012.08.004
Song, M., Tao, J., and Wang, S. (2015). FDI, technology spillovers and green innovation in China: Analysis based on data envelopment analysis. Ann. Oper. Res. 228 47–64. doi:10.1007/s10479-013-1442-0
Su, Y., and Yu, Y. Q. (2019). Spatial association effect of regional pollution control. J. Clean. Prod. 213, 540–552. doi:10.1016/j.jclepro.2018.12.121
Tan, D. D., Cheng, C., Lei, M. J., and Zhao, Y. C. (2017). Spatial distributions and determinants of regional innovation in China: Evidence from Chinese metropolitan data. Emerg. Mark. Finance Trade 53 (6), 1442–1454. doi:10.1080/1540496x.2017.1283215
Tang, C., Xu, Y., Hao, Y., Wu, H., and Xue, Y. (2021). What is the role of telecommunications infrastructure construction in green technology innovation? A firm-level analysis for China. Energy Econ. 103, 105576. doi:10.1016/j.eneco.2021.105576
Tone, K., and Tsutsui, M. (2010). An epsilon-based measure of efficiency in DEA – a third pole of technical efficiency. Eur. J. Operational Res. 207 (3), 1554–1563. doi:10.1016/j.ejor.2010.07.014
Tseng, C. Y., Lin, S. C., Pai, D. C., and Tung, C. W. (2016). The relationship between innovation network and innovation capability: A social network perspective. Technol. Analysis Strategic Manag. 28 (9), 1029–1040. doi:10.1080/09537325.2016.1181739
Wang, Q., and Ren, S. (2022). Evaluation of green technology innovation efficiency in a regional context: A dynamic network slacks-based measuring approach. Technol. Forecast. Soc. Change 182, 121836. doi:10.1016/j.techfore.2022.121836
Wang, Y., Chen, W., Kang, Y., Li, W., and Guo, F. (2018). Spatial correlation of factors affecting CO 2 emission at provincial level in China: A geographically weighted regression approach. J. Clean. Prod. 184 (MAY 20), 929–937. doi:10.1016/j.jclepro.2018.03.002
Wang, Y., Zhang, F. Q., Zheng, M. B., and Chang, C. P. (2021). Innovation's spillover effect in China: Incorporating the role of environmental regulation. Environ. Model. Assess. (Dordr). 26 (5), 695–708. doi:10.1007/s10666-021-09763-9
White, H. C., Boorman, S. A., and Breiger, R. L. (1976). Social structure from multiple networks. I. Blockmodels of roles and positions. Am. J. Sociol. 81 (4), 730–780. doi:10.1086/226141
Wu, H., Hao, Y., and Ren, S. (2020). How do environmental regulation and environmental decentralization affect green total factor energy efficiency: Evidence from China. Energy Econ. 91, 104880. doi:10.1016/j.eneco.2020.104880
Wu, H., Hao, Y., Ren, S., Yang, X., and Xie, G. (2021). Does internet development improve green total factor energy efficiency? Evidence from China. Energy Policy 153, 112247. doi:10.1016/j.enpol.2021.112247
Wu, M. R. (2021). Measurement and spatial statistical analysis of green science and technology innovation efficiency among Chinese Provinces. Environ. Ecol. Stat. 28 (2), 423–444. doi:10.1007/s10651-021-00491-7
Wu, P. C., Liu, S. Y., Hsiao, J. M., and Huang, T. Y. (2016). Nonlinear and time-varying growth-tourism causality. Ann. Tour. Res. 59 45–59. doi:10.1016/j.annals.2016.04.005
Xiao, Z. L., Fan, R. G., and Du, X. Y. (2019). Measurement and convergence of China's regional innovation capability. Sci. Technol. Soc. 24 (1), 1–28. doi:10.1177/0971721818806079
Xie, X., Huo, J., and Zou, H. (2019). Green process innovation, green product innovation, and corporate financial performance: A content analysis method. J. Bus. Res. 101 (AUG), 697–706. doi:10.1016/j.jbusres.2019.01.010
Yang, C., and Liu, S. (2020). Spatial correlation analysis of low-carbon innovation: A case study of manufacturing patents in China. J. Clean. Prod. 273 (3), 122893. doi:10.1016/j.jclepro.2020.122893
Yang, Y., Guo, H., Chen, L., Liu, X., Gu, M., and Ke, X. (2019). Regional analysis of the green development level differences in Chinese mineral resource-based cities. Resour. Policy 61, 261–272. doi:10.1016/j.resourpol.2019.02.003
Yin, S., and Li, B. (2018). Transferring green building technologies from academic research institutes to building enterprises in the development of urban green building: A stochastic differential game approach. Sustain. Cities Soc. 39, 631–638. doi:10.1016/j.scs.2018.03.025
Yu, Z., Chen, L., Tong, H., Chen, L., Zhang, T., Li, L., et al. (2022). Spatial correlations of land-use carbon emissions in the Yangtze River Delta region: A perspective from social network analysis. Ecol. Indic. 142, 109147. doi:10.1016/j.ecolind.2022.109147
Zeng, J. Y., Skare, M., and Lafont, J. (2021). The co-integration identification of green innovation efficiency in Yangtze River Delta region. J. Bus. Res. 134, 252–262. doi:10.1016/j.jbusres.2021.04.023
Zhang, G., Zhang, P., Zhang, Z. G., and Li, J. (2019). Impact of environmental regulations on industrial structure upgrading: An empirical study on Beijing-Tianjin-Hebei region in China. J. Clean. Prod. 238, 117848. doi:10.1016/j.jclepro.2019.117848
Zhang, J., Kang, L., Li, H., Ballesteros-Pérez, P., and Zuo, J. (2020). The impact of environmental regulations on urban green innovation efficiency: The case of xi'an. Sustain. Cities Soc. 57, 102123. doi:10.1016/j.scs.2020.102123
Zhang, J., Ouyang, Y., Ballesteros-Pérez, P., Li, H., Skitmore, M., Li, Z., et al. (2021a). Understanding the impact of environmental regulations on green technology innovation efficiency in the construction industry. Sustain. Cities Soc. 65 102647. doi:10.1016/j.scs.2020.102647
Zhang, X., Geng, Y., Tong, Y. W., Kua, H. W., Tian, X., Wu, R., et al. (2021b). Spatial characteristics and its driving factors of low-carbon energy technology innovation in China: A gravity movement and exploratory spatial data analysis. J. Clean. Prod. 295, 126481. doi:10.1016/j.jclepro.2021.126481
Zhao, N., Liu, X., Pan, C., and Wang, C. (2021). The performance of green innovation: From an efficiency perspective. Socio-Economic Planning Sciences 78, 101062. doi:10.1016/j.seps.2021.101062
Zhou, X., and Wang, Y.-C. (2011). Spatial–temporal dynamics of urban green space in response to rapid urbanization and greening policies. Landsc. Urban Plan. 100 (3), 268–277. doi:10.1016/j.landurbplan.2010.12.013
Keywords: spatial spillover effects, green innovation efficiency, social network analysis, driving factors, China
Citation: Zhuang H, Lin H and Zhong K (2022) Spatial spillover effects and driving factors of regional green innovation efficiency in china from a network perspective. Front. Environ. Sci. 10:997084. doi: 10.3389/fenvs.2022.997084
Received: 18 July 2022; Accepted: 26 September 2022;
Published: 11 October 2022.
Edited by:
Muhammad Mohsin, Jiangsu University, ChinaCopyright © 2022 Zhuang, Lin and Zhong. This is an open-access article distributed under the terms of the Creative Commons Attribution License (CC BY). The use, distribution or reproduction in other forums is permitted, provided the original author(s) and the copyright owner(s) are credited and that the original publication in this journal is cited, in accordance with accepted academic practice. No use, distribution or reproduction is permitted which does not comply with these terms.
*Correspondence: Hongxi Lin, bGluaG9uZ3hpQDE2My5jb20=; Kaiyang Zhong, emhvbmdreTA2MjZAMTYzLmNvbQ==
Disclaimer: All claims expressed in this article are solely those of the authors and do not necessarily represent those of their affiliated organizations, or those of the publisher, the editors and the reviewers. Any product that may be evaluated in this article or claim that may be made by its manufacturer is not guaranteed or endorsed by the publisher.
Research integrity at Frontiers
Learn more about the work of our research integrity team to safeguard the quality of each article we publish.