 Hongming Zhang
 Xiang Zhou
 Zui Tao
 Tingting Lv
94% of researchers rate our articles as excellent or good
Learn more about the work of our research integrity team to safeguard the quality of each article we publish.
Find out more
ORIGINAL RESEARCH article
Front. Environ. Sci., 09 September 2022
Sec. Environmental Informatics and Remote Sensing
Volume 10 - 2022 | https://doi.org/10.3389/fenvs.2022.986913
This article is part of the Research TopicRemote Sensing of Aquatic Environment and Its Implication for Environmental ManagementView all 8 articles
Ultraviolet-visible spectroscopy is an effective tool for reagent-free qualitative analysis and quantitative detection of water parameters. Suspended particles in water cause turbidity that interferes with the ultraviolet-visible spectrum and ultimately affects the accuracy of water parameter calculations. This paper proposes a deep learning method to compensate for turbidity interference and obtain water parameters using a partial least squares regression approach. Compared with orthogonal signal correction and extended multiplicative signal correction methods, the deep learning method specifically utilizes an accurate one-dimensional U-shape neural network (1D U-Net) and represents the first method enabling turbidity compensation in sampling real river water of agricultural catchments. After turbidity compensation, the R2 between the predicted and true values increased from 0.918 to 0.965, and the RMSE (Root Mean Square Error) value decreased from 0.526 to 0.343 mg. Experimental analyses showed that the 1D U-Net is suitable for turbidity compensation and provides accurate results.
Due to economic growth and global climate change, the effects of environmental pollution, particularly water pollution, are becoming increasingly serious (Ukaogo et al., 2020). Indeed, studies have reported an increase in water pollution because of industrial development, agricultural activities, and incomplete domestic sewage treatment (Englande et al., 2015; Sasakova et al., 2018). Total organic carbon (TOC) is a measure of the total amount of carbon in a water system or contaminants in purified water (Otson et al., 1979). The United States Pharmacopoeia, Japanese Pharmacopoeia, and European Pharmacopoeia have chosen TOC as the quality standard test for water purity and water standard for injection (Richard and Nissan, 2017). Both chemical and physical technologies are widely used to monitor water parameters (Park et al., 2020; Yaroshenko et al., 2020). Chemical detection methods have many disadvantages, such as time-consuming sample preparation and operation steps, secondary pollution due to chemical reagents, requirements for expensive instrumentation, and complex training requirements for technicians (Zulkifli et al., 2018).
Ultraviolet-visible spectroscopy, a physical method based on Lambert-Beer’s law, is a rapid and cost-effective measurement method (Guo et al., 2020). Combined with other advantages such as high precision, high efficiency, and no secondary chemical pollution, ultraviolet-visible spectroscopy has been widely studied since its development by Langergraber’s group (Langergraber et al., 2004). Johnson and Coletti developed a reflection-mode in situ ultraviolet spectrophotometer that can be immersed in ocean water to a depth of 400 m to measure nitrate, bisulfide, and bromide with high measurement efficiency (Johnson and Coletti, 2002). More recently, a variety of ultraviolet-visible sensors have become commercially available employing multiple types of detectors, light sources, and optical light paths (O'Grady et al., 2021). In addition, the inversion model of the ultraviolet-visible method has progressed from single wavelength and dual wavelength to the current multi-wavelength algorithm.
Although use of the multi-wavelength algorithm has resulted in a marked improvement in accuracy, turbidity-related interference still limits the accuracy of measurements, especially with regard to actual environmental water samples. Various turbidity compensation methods have been developed to decrease or nearly eliminate turbidity interference resulting from suspended particles in water components (Zhang et al., 2020). In methods using the single-wavelength inversion algorithm, the numerical value of the minimum point, such as 350 nm, is subtracted from the full absorption spectrum (Li et al., 2019). Dual-wavelength method have also been proposed to predict turbidity values (Zhang et al., 2020). Smoothing methods using the orthogonal signal correction (OSC) algorithm can remove some variation from data matrix X that is orthogonal to the response matrix Y. Combined with Savitzky-Golay (SG), OSC-based methods can be used to correct additional spectral information associated with turbidity (Wang et al., 2019). Hu et al. (2020) from Zhejiang University used a fourth-derivative method to eliminate particle interference. Fourth-derivative spectra with different turbidities have peaks and valleys at the same wavelength position, so turbidity interference can be eliminated. The Mie scattering method uses a visible-wavelength spectrum to first calculate the particle spread distribution and then estimate the extinction spectrum of particles in the ultraviolet region with inversion of the particle spread distribution (Chen et al., 2021), followed by turbidity compensation using the original spectrum and spectrum data inverted with particle distribution.
The Mie extinction (ME) extended multiplicative scatter correction (EMSC) method is a state-of-the-art powerful preprocessing tool that isolates or removes the light scattering effect to recover pure absorbance spectra (Solheim et al., 2019). The algorithm is part of an iterative method that is approximated by a reference spectrum with a series of components. These components can be calculated based on the particles size and refractive indexes of the sample. However, computations using the ME-EMSC model require adequate knowledge of the sample in order to obtain a sufficient number of parameters. In addition, the ME-EMSC algorithm is computationally intensive and therefore may require weeks for model training.
Tremendous progress has been made in the development of deep learning technologies, which has resulted in noticeable success in various areas such as imaging, healthcare, robotics, autopiloting, and semantic recognition (Lee et al., 2017; Masubuchi et al., 2020). Deep learning methods can be used to construct complex relationships between input and output data without prior knowledge of the samples. In each of these areas, networks are trained with low-quality and high-quality pairs to learn the relationships between them and enable reconstruction of high-quality output data from low-quality inputs. We built a one-dimensional (1D) U-shaped CNN network based on U-Net and trained the model using input data and ME-EMSC–corrected data. We then tested the model using another group of data.
After turbidity compensation, multivariate regression or deep learning methods can be used to determine water parameters. For example, partial least squares regression (PLSR) methods are used to determine chemical oxygen demand (Ye et al., 2018). Ultraviolet-visible spectrophotometry utilizing artificial neural networks represents an alternative approach for determining water quality indexes (Alves et al., 2018).
This review compares several types of turbidity compensation methods with application of PLSR regression to determine the TOC concentration.
The Beer-Lambert law relates the absorption of light to the properties of water through which light travels. The absorption of light is defined in Eq. 1 by the incident intensity I0 and transmitted intensity I (Bustamante and Maestre, 1988).
Bow Brook runs through an agricultural catchment in Hampshire, United Kingdom. Monitoring and sampling equipment were placed close to the confluence of Bow Brook and the Loddon River near Sherfield-on-Loddon. All samples were acquired using ISCO 6712 autosamplers and stored in a refrigerator at 4°C on the return to the laboratory. Daily water quality samples for laboratory analysis were taken at 09.00 am GMT on 08/09/2017 to 08/09/2018. Samples were scanned using a Jenway 7315 spectrophotometer before and after filtering with a 0.7-µm filter. In order to reduce the background noise associated with the use of cuvettes, a baseline scan was performed before sample measurements. In order to avoid possible negative values resulting from subtraction of total inorganic carbon (TIC) from total carbon (TC), the non-purgeable organic carbon (NPOC) method was used.
Turbidity, the primary indicator of pollution associated with rain runoff, can decrease the intensity of absorption spectra (Mullins et al., 2018). In this paper, we propose an analytical approach based on a deep learning method to compensate for turbidity interference.
OSC is a spectral preprocessing method that removes from the spectral matrix data unrelated to the dependent variable. The removal portion of the operation is mathematically orthogonal or nearly orthogonal to the dependent variable (Cheng et al., 2008). The procedure is carried out by suppressing information unrelated to the dependent variable in the spectral matrix, thus guaranteeing preservation of information that will be useful for calibration.
EMSC is frequently used to correct for various types of scattering (Kohler et al., 2005; Martens and Stark, 1991). The main frame of EMSC is based on a least-square fit, so the method is efficient and adaptive. EMSC is a useful tool for correcting for baseline and Mie-distorted interference effects (Rasskazov et al., 2019; Bassan et al., 2010).
The MSC model is given by an additive effect, as shown in Eq. 2:
where
where
where
Polynomials up to quadratic order are used in the basic EMSC model. Further extension of the EMSC model would have the potential to remove other interference effects. In this study, a basic EMSC correction model was used to remove interference effects caused by suspended particles, with the average spectra serving as the reference spectrum. The EMSC tutorial and methodology have been described in many research studies, and the source code is freely available (Solheim et al., 2019). In this study, we used an open-source code to compensate for turbidity interference. The minimum and maximum radii were 3 and 9 μm, and the maximum number of iterations was 5. If the chosen parameter range does not fit the spectral dataset, the EMSC model cannot calculate the Mie scattering of the spectral data, and the correction may be insufficient. In addition, the corrected spectra will exhibit artifacts that render it dissimilar to any of the absorbance spectra. Final regression of unsuccessfully corrected spectra will result in a significantly large RMSE that readily identifies an abnormal correction. The RMSE value is compared to that for uncorrected spectra data and can be used as an indicator to find the proper parameter range. Figure 1 schematically illustrates the flow of the descattering method based on deep learning (i.e., 1D U-Net). A training dataset with spectra corrected using ME-EMSC is used to train the 1D U-Net, and then the trained network model is used to correct new spectra data in the testing routine.
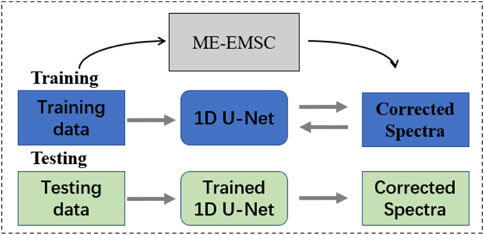
FIGURE 1. Schematic illustration of the deep learning–based descattering method.
In this study, we exploited the advantages of deep learning networks to remove turbidity interference from absorbance spectra. A CNN-based 1D U-shaped network was constructed on the basis of U-Net. In order to construct the model, we considered the turbidity interferential absorbance spectra as the input and the ME-EMSC–corrected spectra as pure absorbance spectra. The model was trained to correct for Mie-scattering effects and reconstruct non-corrupted absorbance spectra that should be similar to the pure absorbance.
Figure 2 illustrates the structure of the U-Net that we used to transform the input corrupted spectra to generate corrected absorbance spectra. The network was inspired by U-Net, which consists of two paths: a contracting path and an expansive path with residual connections (Ronneberger et al., 2015). The input spectra contains 256 data points, which are halved by a “maxpooling” layer in the contracting path and doubled with a “upsampling” layer in the expansive path. The active function “ReLu” is used after each convolutional operation with a kernel size of 3 and padding size of 1. Data augmentation procedures may be used to improve the training efficiency with random shift and offset components (Wu et al., 2021; Ma et al., 2022). A total of 232 samples are used to train the U-Net model, and 94 samples are used as the test data. The training of the network is performed with a batch size of 256 and adaptive learning rate for the Adam algorithm of 0.0001.
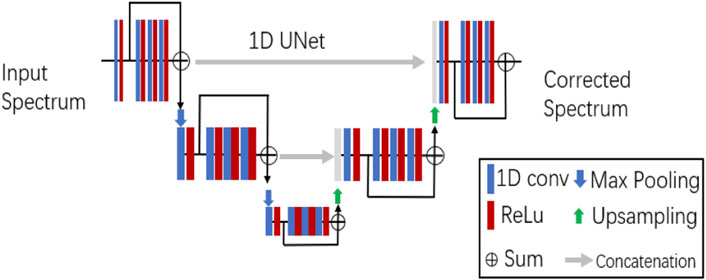
FIGURE 2. Structure of the 1D U-Net.
Full-spectrum data were preprocessed via different methods, and the results are shown in Figure 3. Figure 3A shows the raw absorbance spectra, whereas Figure 3B shows the preprocessed spectra with SG-filter smoothing and OSC correction, and Figure 3C shows the spectra preprocessed via ME-EMSC. The SG-filter width was 5, and the polynomial order was 3. The aim of the filtering operation was to eliminate turbidity-associated noise without removing inherent useful information regarding TOC absorption. The processed spectra shown in Figures 3B,C were plotted after removing turbidity interference components.
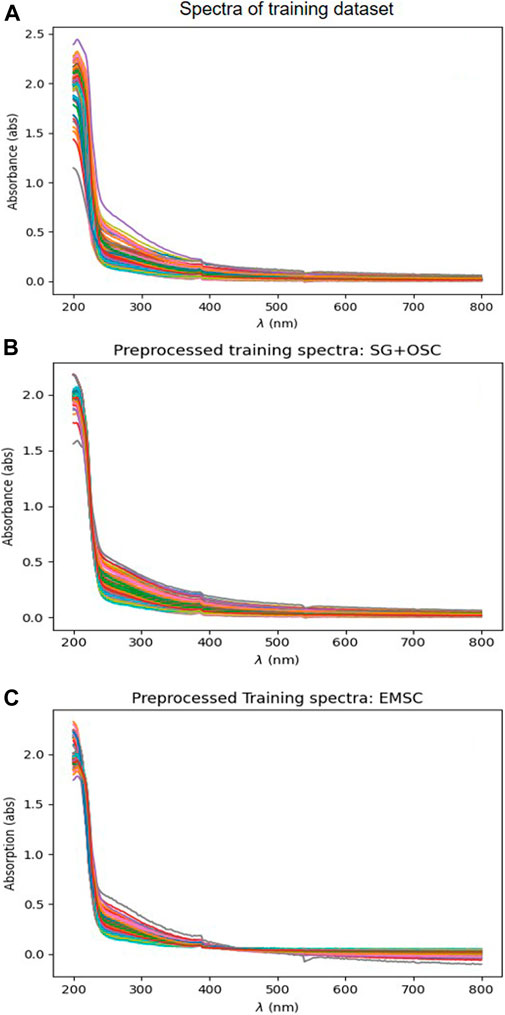
FIGURE 3. Raw spectra and spectra preprocessed using the SG filter and ME-EMSC.
Figure 4 shows the loss changes of the network on the training and validation sets within 1200 epochs. The curve in the figure indicates that the loss declines markedly before epoch 50 and then declines slowly after epoch 300. The loss gradually converges with the increase in epochs and eventually stabilizes. Epoch 964 is used when the loss function value is at the minimum.
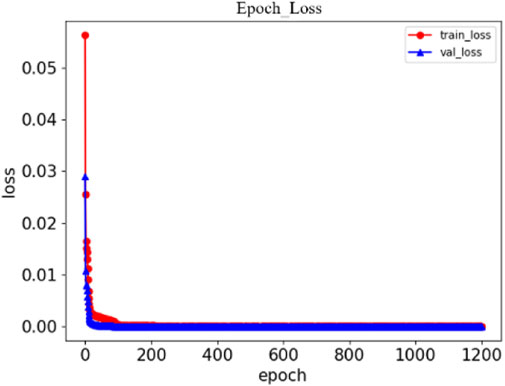
FIGURE 4. Curves showing loss change versus number of epochs.
Figure 5 shows a comparison of results corrected using the ME-EMSC versus 1D U-Net model. The black line shows the preprocessed absorbance spectrum corrected via EMSC, whereas the red line shows the spectrum processed using the 1D U-Net, and the blue line shows the residual. With up to 5 ME-EMSC iterations, the residual of the two correct methods was very small, indicating that the 1D U-Net can learn the function of ME-EMSC and outperform it.
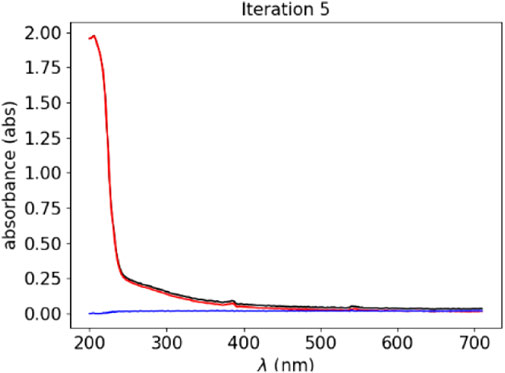
FIGURE 5. Residual values of absorbance spectra preprocessed using EMSC or the 1D U-Net model.
Figure 6 shows the correlation between real data and predicted results calculated by PLS regression and various preprocessing techniques. Figure 6A shows the PLS regression analysis of raw spectral data. Figure 6B shows the results of PLS regression with SG-filter smoothing and OSC. Figure 6C shows the results of PLS regression with ME-EMSC. Figure 6D shows the results of PLS regression with 1D U-Net preprocessed correction. The R2 of the regression on test data with raw spectra, SG-filter smoothing and OSC, ME-EMSC, and 1D U-Net correction were 0.918, 0.937, 0.958, and 0.965, respectively. From these data, it is clear that the PLS regression with 1D U-Net correction resulted in the best results. A detailed comparison of these methods is provided in Table 1.
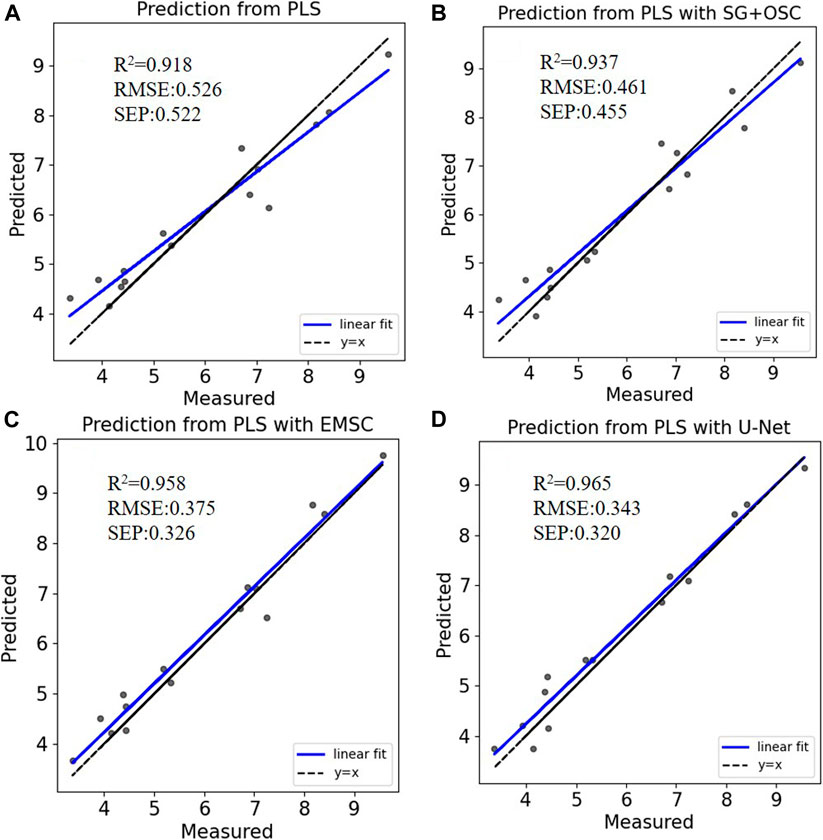
FIGURE 6. Correlation between real and predicted values obtained using different correction models and PLS regression.
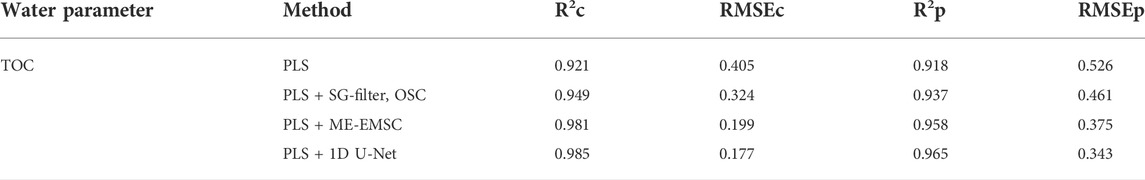
TABLE 1. Comparison of turbidity compensation methods with PLS regression.
It can be seen from Table 1 that the PLS regression method with ME-EMSC and 1D U-Net correction provided optimal correlation coefficients and minimum RMSE values. R2c and RMSEc are the determination coefficient and Root Mean Square Error of training data. R2p and RMSEp are the determination coefficient and Root Mean Square Error of test data. Deep learning methods run much faster than EMSC methods (Raulf et al., 2020). In our study, the 1D U-Net correction method ran in 1.29 s and the ME-EMSC in 13.3 s on a Windows 10 platform with an i7 CPU and RTX 2070 GPU.
The work in this study illustrates how 1D U-Net deep learning method may implement turbidity compensation before regression. With PLS regression method, the Ultraviolet-visible spectroscopy may obtain water parameters with accurate results. Deep learning methods are flexible and may learnt the physical or chemical property of the samples. As mentioned in section 3, EMSC method framework may minimize or eliminate unwanted turbidity interference effects. Several versions of EMSC packages are available on website as a standard tool for preprocessing of spectra dataset. ME-EMSC is a state-of-the-art powerful preprocessing tool that isolates or removes the light scattering effect to recover pure absorbance spectra. However, ME-EMSC model is computationally intensive and therefore may require long time to train the model. 1D U-Net model in this study may behave better performance than ME-EMSC and SG-OSC filter, but calculate much faster.
We describe here a deep learning–based descattering method to remove turbidity interference and recover pure absorbance spectra for water parameter analysis. It was shown that absorbance spectra preprocessing using the 1D U-Net method not only removes noise information but also retains the chemical information better than the state-of-the-art ME-EMSC method. The 1D U-Net method provided even better PLS regression results than the ME-EMSC method with consideration of different turbidity interference patterns and spectral differences between the training data and test data. In other words, the 1D U-Net model was trained to incorporate the rules of physics with the descattering procedure. Because the training data are preprocessed using the ME-EMSC method based on Mie formalism, the trained model is not expected to work for any type of water spectra. In order to achieve much better prediction outcomes, it is necessary to classify the water type first and allocate each type of water to a special model. For a new application or to measure a new parameter, the model must be retrained. This work verifies the potential possibility to monitor water quality in places where there is no infrastructure construction to take the task with a conventional method. Deep learning method may remove turbidity interference with precision and computation speed. In the future work, other deep learning method may be used to investigate the turbidity compensation of river water.
Publicly available datasets were analyzed in this study. This data can be found here: https://doi.org/10.5285/331659d7-da72-48a2-9b52-63c003557990.
HZ: Conceptualization, Methodology, Software, Investigation, Formal Analysis, Writing–Original Draft; XZ: Data Curation, Writing–Original Draft; ZT: Visualization, Investigation; TL: Resources, Supervision; JW: Visualization, Writing–Review and Editing.
This work was supported by the State Key R & D Program of the Ministry of Science and Technology, China (2018YFE0124200), and the National Natural Science Foundation of China (no. 41977154).
The authors declare that the research was conducted in the absence of any commercial or financial relationships that could be construed as a potential conflict of interest.
The reviewer DF declared a shared affiliation with the authors to the handling editor at the time of review.
All claims expressed in this article are solely those of the authors and do not necessarily represent those of their affiliated organizations, or those of the publisher, the editors and the reviewers. Any product that may be evaluated in this article, or claim that may be made by its manufacturer, is not guaranteed or endorsed by the publisher.
Alves, E., Rodrigues, R., Corrêa, C., Fidemann, T., Rocha, J. C., Buzzo, J. L. L., et al. (2018). Use of ultraviolet–visible spectrophotometry associated with artificial neural networks as an alternative for determining the water quality index. Environ. Monit. Assess. 190, 319. doi:10.1007/s10661-018-6702-7
Bassan, P., Kohler, A., Martens, H., Lee, J., Jackson, E., Lockyer, N., et al. (2010). RMieS-EMSC correction for infrared spectra of biological cells: Extension using full Mie theory and GPU computing. J. Biophot. 3, 609–620. doi:10.1002/jbio.201000036
Bustamante, C., and Maestre, M. F. (1988). Statistical effects in the absorption and optical activity of particulate suspensions. Proc. Natl. Acad. Sci. U. S. A. 85, 8482–8486. doi:10.1073/pnas.85.22.8482
Chen, X., Yin, G., Zhao, N., Yang, R., Xia, M., Feng, C., et al. (2021). Turbidity compensation method based on Mie scattering theory for water chemical oxygen demand determination by UV-Vis spectrometry. Anal. Bioanal. Chem. 413, 877–883. doi:10.1007/s00216-020-03042-4
Cheng, Z., Zhu, A. S., and Zhang, L. Q. (2008). Quantitative analysis of electronic absorption spectroscopy by piecewise orthogonal signal correction and partial least square. Guang Pu 28, 860–864. doi:10.3964/j.issn.1000-0593.2008.04.043
Englande, A. J., Krenkel, P., and Shamas, J. (2015). Wastewater treatment &water reclamation. Reference Module Earth Syst. Environ. Sci., 1–32. doi:10.1016/B978-0-12-409548-9.09508-7
Guo, Y., Liu, C., Ye, R., and Duan, Q. (2020). Advances on water quality detection by UV-Vis spectroscopy. Appl. Sci. 10, 6874. doi:10.3390/app10196874
Hu, Y., Zhao, D., Qin, Y., and Wang, X. (2020). An order determination method in direct derivative absorption spectroscopy for correction of turbidity effects on COD measurements without baseline required. Spectrochimica Acta Part A Mol. Biomol. Spectrosc. 226, 117646. doi:10.1016/j.saa.2019.117646
Johnson, K., and Coletti, L. (2002). In situ ultraviolet spectrophotometry for high resolution and long-term monitoring of nitrate, bromide and bisulfide in the ocean. Deep Sea Res. Part I Oceanogr. Res. Pap. 49, 1291–1305. doi:10.1016/s0967-0637(02)00020-1
Kohler, A., Kirschner, C., Oust, A., and Høy, M. (2005). Extended multiplicative signal correction as a tool for separation and characterization of physical and chemical information in Fourier transform infrared microscopy images of cryo-sections of beef loin. Appl. Spectrosc. 59, 707–716. doi:10.1366/0003702054280649
Langergraber, G., Fleischmann, N., Hofstaedter, F., and Weingartner, A. (2004). Monitoring of a paper mill wastewater treatment plant using UV/VIS spectroscopy. Water Sci. Technol. 49, 9–14. doi:10.2166/wst.2004.0004
Lee, J.-G., Jun, S., Cho, Y.-W., Lee, H., Kim, G. B., Seo, J. B., et al. (2017). Deep learning in medical imaging: General overview. Korean J. Radiol. 18, 570–584. doi:10.3348/kjr.2017.18.4.570
Li, J., Tong, Y., Guan, L., Wu, S., and Li, D. (2019). A turbidity compensation method for COD measurements by UV–vis spectroscopy. Optik 186, 129–136. doi:10.1016/j.ijleo.2019.04.096
Ma, F., Li, Y., Ni, S., Huang, S.-L., and Zhang, L. (2022). Data augmentation for audio-visual emotion recognition with an efficient multimodal conditional GAN. Appl. Sci. (Basel). 12, 527. doi:10.3390/app12010527
Martens, H., and Stark, E. (1991). Extended multiplicative signal correction and spectral interference subtraction: New preprocessing methods for near infrared spectroscopy. J. Pharm. Biomed. Anal. 9, 625–635. doi:10.1016/0731-7085(91)80188-f
Masubuchi, S., Watanabe, E., Seo, Y., Okazaki, S., Sasagawa, T., Watanabe, K., et al. (2020). Deep-learning-based image segmentation integrated with optical microscopy for automatically searching for two-dimensional materials. npj 2D Mat. Appl. 4, 3. doi:10.1038/s41699-020-0137-z
Mullins, D., Coburn, D., Hannon, L., Jones, E., Clifford, E., and Glavin, M. (2018). A novel image processing-based system for turbidity measurement in domestic and industrial wastewater. Water Sci. Technol. 77, 1469–1482. doi:10.2166/wst.2018.030
O'Grady, J., Zhang, D., O'Connor, N., and Regan, F. (2021). A comprehensive review of catchment water quality monitoring using a tiered framework of integrated sensing technologies. Sci. Total Environ. 765, 142766. doi:10.1016/j.scitotenv.2020.142766
Otson, R., Williams, D. T., Bothwell, P. D., McCullough, R. S., and Tate, R. A. (1979). Effects of sampling, shipping, and storage on total organic carbon levels in water samples. Bull. Environ. Contam. Toxicol. 23, 311–318. doi:10.1007/bf01769962
Park, J., Kim, K. T., and Lee, W. H. (2020). Recent advances in information and communications technology (ict) and sensor technology for monitoring water quality. Water 12, 510. doi:10.3390/w12020510
Rasskazov, I. L., Singh, R., Carney, P. S., and Bhargava, R. (2019). Extended multiplicative signal correction for infrared microspectroscopy of heterogeneous samples with cylindrical domains. Appl. Spectrosc. 73, 859–869. doi:10.1177/0003702819844528
Raulf, A., Butke, J., Menzen, L., Kupper, C., Gerwert, K., Mosig, A., et al. (2020) Deep neural networks for the correction of Mie scattering in Fourier-transformed infrared spectra of biological samples. Available at: http://arXiv.org/abs/2002.07681 (Accessed August 20, 2022).
Richard, G., and Nissan, C. (2017). Automated release of water using on-line TOC analysis and FDA risk- based cGMP, inspection, and PAT principles. Pharm. Eng. 25.
Ronneberger, O., Fischer, P., and Brox, T. (2015) U-net: Convolutional networks for biomedical image segmentation. Available at: http://arXiv.org/abs/1505.04597.
Sasakova, N., Gregova, G., Takacova, D., Mojzisova, J., Papajova, I., Venglovsky, J., et al. (2018). Pollution of surface and ground water by sources related to agricultural activities. Front. Sustain. Food Syst. 2. doi:10.3389/fsufs.2018.00042
Solheim, J., Gunko, E., Petersen, D., Erüschkamp, F., Gerwert, K., and Kohler, A. (2019). An open‐source code for Mie extinction extended multiplicative signal correction for infrared microscopy spectra of cells and tissues. J. Biophot. 12, e201800415. doi:10.1002/jbio.201800415
Ukaogo, P. O., Ewuzie, U., and Onwuka, C. V. (2020). “21 - environmental pollution: Causes, effects, and the remedies,” in Microorganisms for sustainable environment and health. Editors P. Chowdhary, A. Raj, D. Verma, and Y. Akhter (Netherlands: Elsevier), 419–429.
Wang, C., Li, W., and Huang, M. (2019). High precision wide range online chemical oxygen demand measurement method based on ultraviolet absorption spectroscopy and full-spectrum data analysis. Sensors Actuators B Chem. 300, 126943. doi:10.1016/j.snb.2019.126943
Wu, M., Wang, S., Pan, S., Terentis, A. C., Strasswimmer, J., and Zhu, X. (2021). Deep learning data augmentation for Raman spectroscopy cancer tissue classification. Sci. Rep. 11, 23842. doi:10.1038/s41598-021-02687-0
Yaroshenko, I., Kirsanov, D., Marjanovic, M., Lieberzeit, P. A., Korostynska, O., Mason, A., et al. (2020). Real-time water quality monitoring with chemical sensors. Sensors 20, 3432. doi:10.3390/s20123432
Ye, S., Chen, X., Dong, D., Wang, J., Wang, X., and Wang, F. (2018). Rapid determination of water COD using laser-induced breakdown spectroscopy coupled with partial least-squares and random forest. Anal. Methods 10, 4879–4885. doi:10.1039/c8ay01266k
Zhang, G., Du, Q., Lu, X., and Wang, Y. (2020). A novel hybrid strategy for detecting COD in surface water. Appl. Sci. (Basel). 10, 8801. doi:10.3390/app10248801
Keywords: ultraviolet-visible spectroscopy, turbidity compensation, deep learning, TOC, extended multiplicative signal correction
Citation: Zhang H, Zhou X, Tao Z, Lv T and Wang J (2022) Deep learning–based turbidity compensation for ultraviolet-visible spectrum correction in monitoring water parameters. Front. Environ. Sci. 10:986913. doi: 10.3389/fenvs.2022.986913
Received: 05 July 2022; Accepted: 15 August 2022;
Published: 09 September 2022.
Edited by:
Sijia Li, Northeast Institute of Geography and Agroecology (CAS), ChinaReviewed by:
Dongjie Fu, Institute of Geographic Sciences and Natural Resources Research (CAS), ChinaCopyright © 2022 Zhang, Zhou, Tao, Lv and Wang. This is an open-access article distributed under the terms of the Creative Commons Attribution License (CC BY). The use, distribution or reproduction in other forums is permitted, provided the original author(s) and the copyright owner(s) are credited and that the original publication in this journal is cited, in accordance with accepted academic practice. No use, distribution or reproduction is permitted which does not comply with these terms.
*Correspondence: Zui Tao, dGFvenVpQGFpcmNhcy5hYy5jbg==
Disclaimer: All claims expressed in this article are solely those of the authors and do not necessarily represent those of their affiliated organizations, or those of the publisher, the editors and the reviewers. Any product that may be evaluated in this article or claim that may be made by its manufacturer is not guaranteed or endorsed by the publisher.
Research integrity at Frontiers
Learn more about the work of our research integrity team to safeguard the quality of each article we publish.