 Junru Yin
- 1College of Computer and Communication Engineering, Zhengzhou University of Light Industry, Zhengzhou, Henan, China
- 2School of Resources and Environment, Henan Agricultural University, Zhengzhou, Henan, China
Land-use/cover change (LUCC) caused by human activities is an important factor in changes in global ecosystems; however, the impact of LUCC on ecosystem service value (ESV) has never been previously assessed in Luoyang City, China. This paper explores spatial and temporal evolution patterns of land use pattern change, ESV change and response to LUCC in Luoyang City from 2010 to 2019 through GIS and remote sensing techniques, and employing transfer matrix, ESV spatial autocorrelation analysis and elastic coefficient change. During the study period: 1) Between 2010 and 2019, land-use changes in Luoyang City showed a trend of “two increases and four decreases,” specifically, built-up land and forest areas increased, while the extent of cropland, grassland, water, and unused land areas decreased. 2) The recorded land-use conversion in Luoyang City is complex, with forest and cropland land uses increasing and decreasing fastest, respectively, with the proportion of forest increasing by 10.19% and cropland decreasing by 3.37% — the reason for this change is the transition from cropland and grassland to forest and occupation of cropland by built-up land. 3) The ESV change in Luoyang City was U-shaped, with the total ESV increasing 1.96% from ¥44.78 billion to ¥45.66 billion; additionally, the ESV provided by forest areas increased by 23.83%. 4) From 2010 to 2019, Luoyang’s hydrological regulation, climate regulation and soil and water conservation contributed the most to Luoyang’s ESV, accounting for 63.89% of the total ESV in 2019. 5) The overall ESVs of the townships in Luoyang City have obvious clustering and are not completely randomly spatially distributed. With the optimization of land-use allocation, the ESV high–high clusters have expanded. 6) The overall elasticity coefficient is high in Luoyang City and ESV responds intensely to LUCC, with the most significant response shown by the forests of Luolong District. The findings of this survey are practical for helping Luoyang City to optimize land resource usage scientifically.
1 Introduction
Ecosystem services are life-supporting products and services obtained directly or indirectly through the structure, processes, and functions of ecosystems (Costanza et al., 1997; Ye et al., 2018), including provisioning services (e.g., food production, water supply, raw material production), regulating services (e.g. climate regulation, hydrological regulation), and cultural ser-vices (e.g. recreation, landscape aesthetics) that directly affect humans. Additionally, support services have an indirect impact on humans (e.g. soil conservation and maintenance of biodiversity) (de Groot et al., 2012; Wang et al., 2017). Overall, these ecosystem services form the material basis from which human societies sustain their survival and development (Zhang and Wang, 2022).
Land-use/cover change (LUCC) is a significant element of global ecosystem change caused primarily by human activities. As a result of global population boom, urban spread and rapid economic development. Land-use/cover has changed significantly at both global and regional scales (Zhang et al., 2007; Song, 2017; Zhang H. et al., 2022); according to the Millennium Ecosystem Assessment (Berry et al., 2018), about 60% of global ecosystem services have decreased in the past 50 years, with the rapid conversion of natural ecosystems to cropland, built-up land, etc. Around 13 million hectares of forest are converted to agricultural land globally every year (Foley, 2005), and about 40% of the Earth’s habitable surface is used for agriculture, such as croplands (Fu et al., 2009). Ecosystems are now facing increasingly serious threats (Zhang J. et al., 2022), representing a global problem that limits sustainable human development.
As public good has not been captured by global markets, the economic value of ecosystem services is not well understood by policymakers and the public; accordingly, identifying how to better quantify ecosystem services and analyze value changes are challenges that have attracted widespread attention from researchers (Xie et al., 2008). Based on Costanza’s research, Xie et al. developed the Chinese ecosystem service value (ESV) equivalent factors and ESV coefficients with reference to Chinese geographic conditions after several revisions, this research has provided a basis for Chinese scholars to assess the value of regional ecosystem services and has been broadly applied in China (Millennium Ecosystem Assessment, 2005). In recent years, more studies has emphasized the impacts of LUCC on ecosystem service functions and values. Bisui et al. analyzed the value of ecosystem service functions through the value transfer method; their study found that total ecosystem services in tropical rainforest areas decreased by 31.20% due to deforestation and there were differences in the values of individual ecosystem service functions, which play a crucial role in ecosystem services as a whole (Bisui et al., 2020). Assefa et al. analyzed the value of wetland ecosystem services in the city of Bahada, Ethiopia, over 35 years (1984–2019) using the corresponding global value coefficients and found that the extension of built-up land areas was the principal driver of wetland ecosystem loss and that ESV loss led to changes in soil acidification (Assefa et al., 2021). Using a value transfer approach, Song et al. explored LUCC over the last 30 years in China, concluding that ESV changes in China from 2000 to 2008 were relatively benign compared to ESV changes in other countries worldwide over a similar period (Song, 2017). Meng et al. used remote sensing and landscape indicators to analyze the wetlands of Nansi Lake, China, from 1987 to 2017; these authors found that LUCC was driven by human manufacturing and that economic advancement led to a decrease in ESV (Meng and Dong, 2019).
Located in the western part of Henan Province, it is a national key development zone and the sub-center of the Central Plains urban agglomeration. Luoyang City is the ancient capital of nine dynasties and has been known as “the middle of the world” and “the hinterland of nine states and the thoroughfare of ten provinces” since ancient times. Influenced by the differences in topography and resource conditions between the north and the south, the land re-sources of Luoyang City and their utilization have obvious regional characteristics. Luoyang City has diverse ecosystems, rich species, prominent contradictions between social and economic construction and ecological environmental protection, and complex and diverse ecological environment conditions. The total area of the existing nature reserves is 2058.86 square kilometers, and the coverage rate of nature reserves is 14%. Species in the north-south transition zone are widely distributed. The forest covers a wide range, and the main types are deciduous broad-leaved forest dominated by oak trees, coniferous forest, shrubs and artificially cultivated trees. From an ecological point of view, it faces greater pressure in preventing soil erosion and protecting biodiversity. Focusing on the strategic goals of building an international cultural tourism city, a model city for the coordinated development of “three cultures” and an important economic growth area in the Central Plains Ecological Zone, an ecologically pleasant mountainous city, a new industrialized city with obvious characteristics and a vice central city of Henan Province, Luoyang City shoulders the heavy responsibility of land ecological environment construction and ecological environmental protection. Some LUCC studies have been conducted in several counties in Luoyang; for example, Zekai et al. used ecosystem factor weighting and spatial autocorrelation analysis to assess ESV changes in response to land-use change in Song County, located in the south of Luoyang, finding that the expansion of land for urban construction and the continued reclamation of cropland have driven ESV loss throughout the townships (Yin et al., 2020). However, research to date has mostly focused on the impacts of LUCC on the ESV in a certain area or eco-system in Luoyang, while relatively few studies have investigated these factors on a city-wide scale. Therefore, this paper aims to: 1) constrain LUCC and associated spatial patterns during the period from 2010 to 2019; 2) evaluate the reaction of total ESV to changes in LUCC and individual ecosystem service functions according to modified coefficients; 3) discussion of the spatial-temporal features of ESV using exploratory spatial data analysis; and 4) discern the elasticity of ESV changes in response to LUCC.
2 Materials and methods
2.1 Study area
The research area is the entirety of Luoyang City, located in the western part of Henan Province, China (Figure 1), straddling the north and south banks of the middle and lower reaches of the Yellow River with a gross territorial area of 15,230 km2 and a temperate monsoon climate, located in the region 112° 16′–112° 37′ E and 34° 32′–34° 45′ N. The study area comprises seven municipal districts and six counties: Change District (CHH), Jianxi District (JX), Laocheng District (LCH), Luanchuan County (LC), Luolong District (LL), Luoning County (LN), and Mengjin District (MJ), in addition to Ruyang County (RY), Song County (SX), Xigong District (XG), Xin’an County (XA), Yanshi District (YSH), and Yichuan County (YCH). The city has a total population of approximately 7 million. Guided by the development strategies of “strong industrial city, strong tourism city, strong science and education city” and “double-driven project attraction”, Luoyang City is actively exploring the road of coordinated development of new industrialization, urbanization and agricultural modernization, and the city’s economy and society are developing steadily and rapidly. The city’s economy and society are developing steadily and rapidly. In 2020, Luoyang City’s annual gross domestic product (GDP) was estimated at ¥ 512.84 billion, with an average annual GDP growth of 3% at comparable prices, exceeding the national average by 0.7 percentage points and the provincial average by 1.7 percentage points.
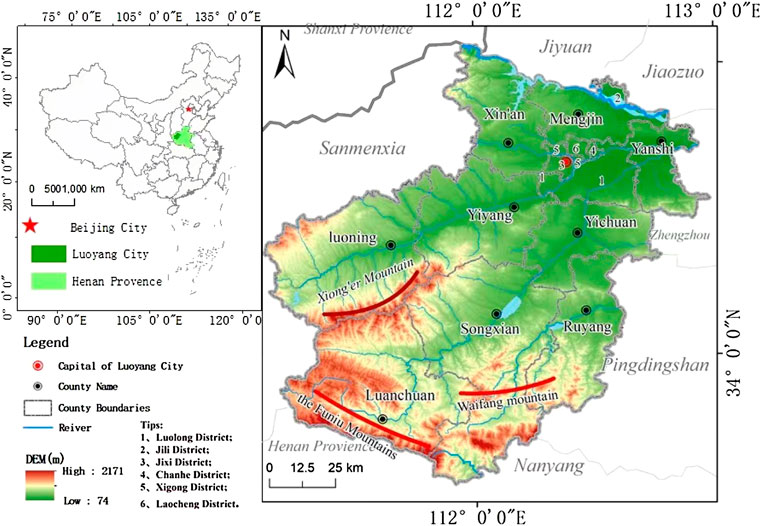
FIGURE 1. Location of Luoyang city.
2.2 Data sources
The primary source of time point data of land-use policy and economic development rate was the database of the Third Land Survey of Luoyang City from 2010 to 2019. In 2010, the overall land-use plan of Luoyang City emphasized the need to strengthen cropland protection, especially basic cropland, and strictly control the scale of built-up land. By 2015, Luoyang City had adjusted the structure of land supply, transformed land use approaches, and switched to a full state-owned built-up land supply plan in macro-control to facilitate rapid development of the city’s economy and society. In 2019, the gross domestic product of Luoyang City was ¥503.49 billion, with citizens’ per capita income economy having increased substantially. The socio-economic data were obtained from the Luoyang City Statistical Yearbook and published on the official Luoyang City government website (http://www.ly.gov.cn/html/1//2/64/index.html) (Luoyang Municipal People’s Government, 2022).
2.3 Land-use/cover change analysis
In this paper, the dynamic analysis of LUCC in Luoyang City is carried out through the two aspects of land use patterns and temporal and spatial characteristics of land use change, and the temporal and spatial changes of LUCC in Luoyang City are explored through Markov model. The practical application of the Markov model in the direction of land use is reflected by the land use transition matrix. The goal of the land use transition matrix is to more dynamically and directly reflect the structural characteristics and transition directions between various land use types through a two-dimensional table, while including the static information of different land types and areas, it explains the transfer-in and transfer-out information of different land use types, so it can intuitively reflect the dynamic process of land use change. Based on the previous research results, this paper investigates the characteristics of LUCC using a Markov transfer matrix (Liu W. et al., 2021).
Among them,
2.4 Calculation of ecosystem service value
The ESV equivalent for food production per hectare of cropland was assumed to be 1 by Xie et al. (Zhang et al., 2010), with the ESV of cropland food production per unit area taken to be equivalent to 1/7 of the product of the national average output of grain. The purchase price of grain, and the ESV equivalent factors of other land types, are defined relative to the service value of cropland food production (Xie et al., 2008). Based on the actual production capacity of Luoyang, the grain yield correction method was then applied. The specific correction process is as follows. The main food types were assumed to be corn, wheat, peanuts, and soybeans; the average price of these crops was set using prices in the province in 2019 as a benchmark. By consulting the 2010–2019 Luoyang Statistical Yearbook, the value of a single ecosystem equivalent in Luoyang was finally derived as ¥1,639.40 per hectare according to (1):
Where
To investigate the ESV of Luoyang, this paper uses the ESV assessment system proposed by Xie for China (Hu et al., 2019) and the equivalence factors are then modified by the ecosystem service equivalence factor system proposed in previous literature (Yin et al., 2020); the ecological service value coefficients per unit area of various land-use type in Luoyang City are then calculated according to (2), as shown in Table 1.
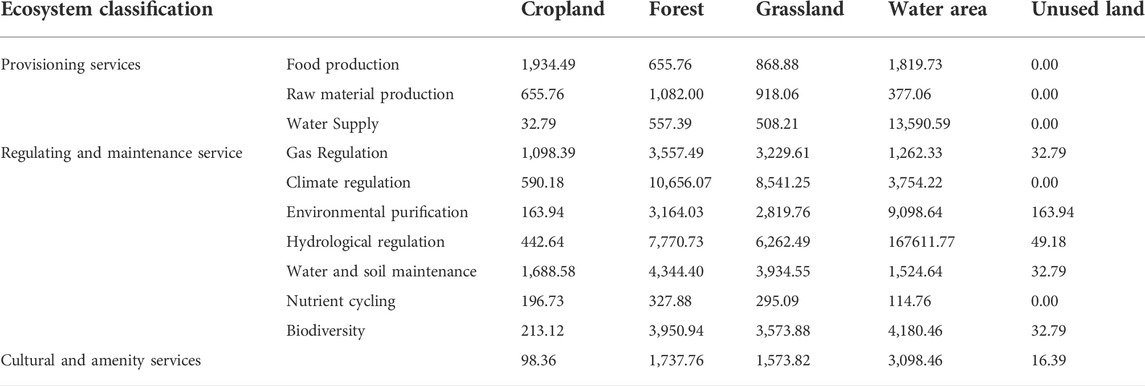
TABLE 1. ESV per unit area in Luoyang (RMB/ha).
The value of ecosystem services supplied by each land-use type (Zhou et al., 2018; Jw et al., 2019; Ylab et al., 2020) can be estimated by:
Where
2.5 Spatial statistics
Spatial autocorrelation analysis is mainly used to measure the degree of correlation in the spatial distribution of a variable based on its values in adjacent areas; The importance of spatial autocorrelation is that it helps to determine the importance of spatial features affecting objects in space and whether there is a clear relationship between objects and spatial properties; thus, spatial autocorrelation can express the correlations and differences of a given spatial phenomenon (Cabrera et al., 2012; Zhu et al., 2021). This paper takes the township as a unit, and explores the spatial correlation between the ecosystem service value of each town in Luoyang City through spatial autocorrelation analysis.
The basis of spatial correlation analysis is the spatial weight matrix. Considering that the land is continuously distributed, this paper determines the weight matrix by choosing Queen adjacency that considers both common vertices and common edges. Moran’s I is a spatial autocorrelation measure; where I>0, the data are positively spatially correlated, with larger values indicating stronger correlation, high-high (HH) or low-low (LL) local clustering of ESV values within local spatial cells. Conversely, when Moran’s I<0, the data show negative spatial correlation, the more negative the value, the greater the spatial difference between adjacent areas, high-low (HL) or low-high (LH) local clustering of ESV values within local spatial cells. When Moran’s I = 0, the spatial distribution is random (i.e., no correlation). Moran’s I is calculated as:
Where
2.6 Elasticity of ecosystem service value change in relation to land-use/cover change
The elasticity coefficient (E) is used to gauge the rate of change of ESV over time in response to LUCC; this describes the contribution of LUCC to the total ESV and its im-portance (Yuan et al., 2019).
E is calculated through (4) and (5):
where E is the elasticity coefficient between ESV and LUCC, s and e denote the coefficients of ecological service value at the initiation and termination of the study, respectively, L describes the proportion of land change conversion,
3 Results
3.1 Land-use/cover patterns
The areas of the various land types from 2010 to 2019 are shown in Table 2 and Figure 2. The spatial distribution of Luoyang’s land types in 2010, 2015, and 2019 are presented in Figure 3. In 2010, forest represented the predominant land type, covering about 42.34% of the total study area. The cropland areas were also large, covering a proportion of 33.30%, while the remaining land types (i.e., built-up land, grassland, water, and unused land) make up 24.36% of Luoyang’s total land area (Table 2), with proportions of 9.42%, 9.16%, 3.89%, and 1.90%, respectively.
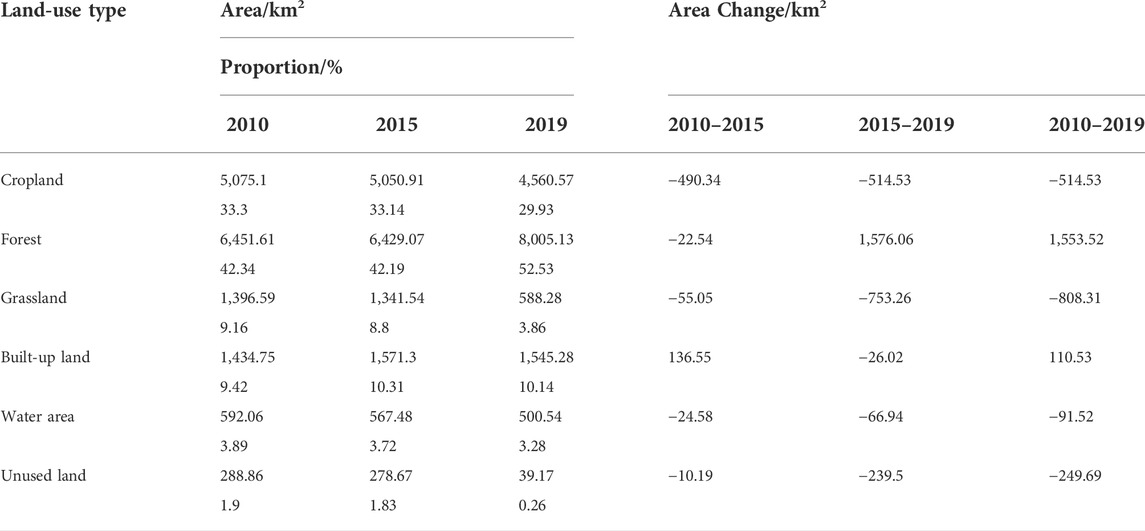
TABLE 2. LUCC patterns in Luoyang(km2).
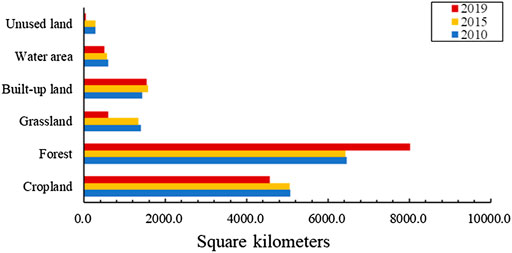
FIGURE 2. Area of each land-use type in Luoyang (km2).
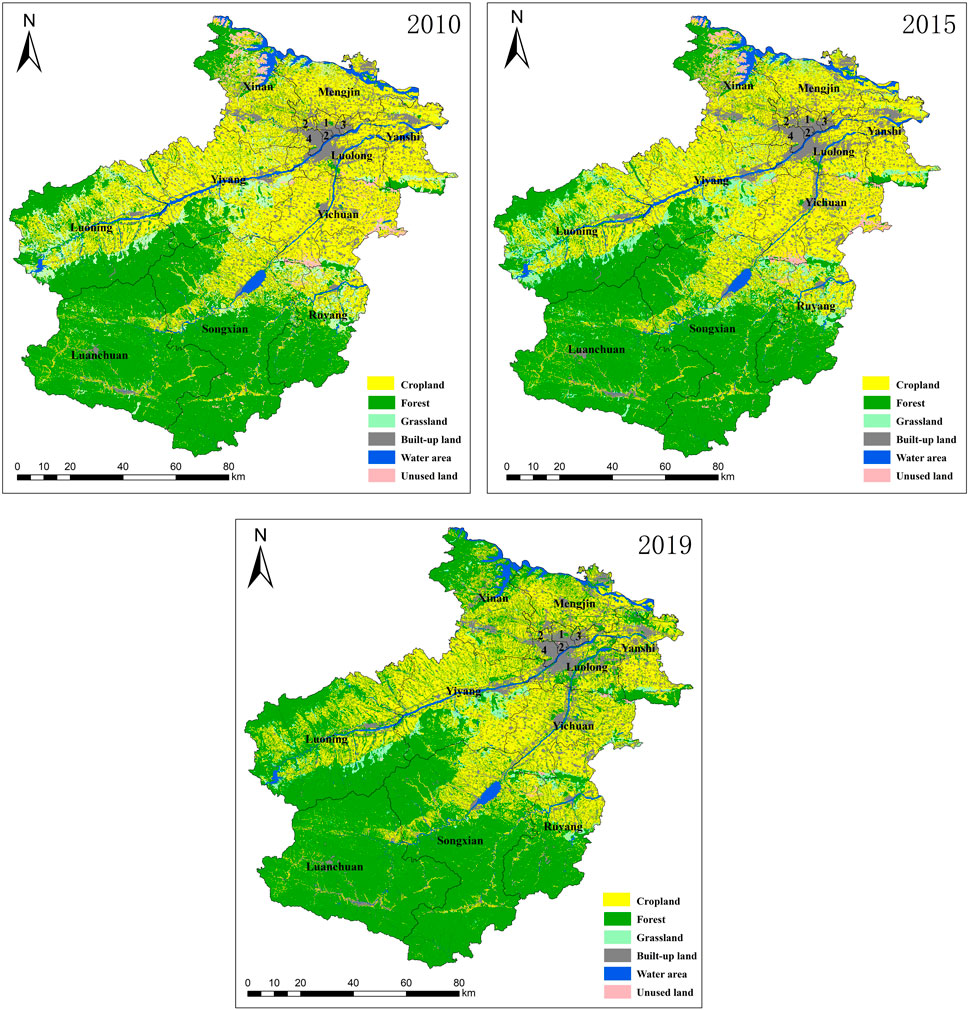
FIGURE 3. Spatial distribution of LUCC in Luoyang in 2010, 2015, and 2019. Key: 1. Laocheng District, 2. Xigong District, 3. Chanhe District, and 4. Jianxi District.
As shown in Figure 3, in 2019, forest land was mainly distributed in the southern parts of the study area with higher elevations, including SX (27.01%), LC (26.82%), LN (16.91%), RY (8.96%), and XA (6.20%). In total, these areas accounted for 85.90% of the total forest land area. The cropland area was widely distributed but mainly concentrated around the central city, including YY (18.28%), LN (13.93%), YCH (12.82%), SX (12.19%), and XA (12.07%) areas, which accounted for (69.29%) of the total cropland land in Luoyang. Built-up land areas were mainly scattered around the central part of Luoyang, including YSH (12.00%), YCH (10.75%), XA (10.67%), and YY (10.53%). Water occurred largely in SX (16.76%), in which the Luhun Dam is located, Xiaolangdi Dam, and XA (16.03%), in which the Yellow River Basin was located. Grassland was mainly located in LN (28.65%) and YY (21.42%). Unused land was mainly distributed in YCH (39.22%) and YY (35.90%).
3.2 Temporal-spatial characteristics of land-use/cover change
During the study period, the area of built-up land and forest increased in Luoyang City, while cropland, grassland, water, and unused land areas decreased; of these, forest and cropland classes showed the largest increase and decrease, respectively, and also represented the land use with the fastest growth rate and the fastest decrease. During this period, forest increased by 1,559.63 km2, accounting for a 10.20% increase and cropland decreased by 512.13km2, accounting for a decrease of 3.38%.
The vector data of land use in Luoyang City in 2010, 2015, and 2019 were fused and intersected using ArcGIS 10.5 to derive the land-use transfer matrices for Luoyang City from 2010 to 2015 and 2015 to 2019 (Tables 3, 4).
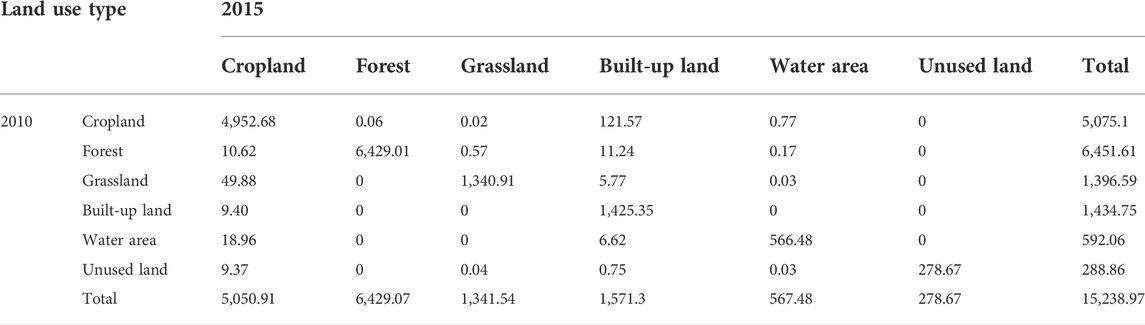
TABLE 3. 2010–2015 Land Use Transfer Matrix (values in square kilometers).
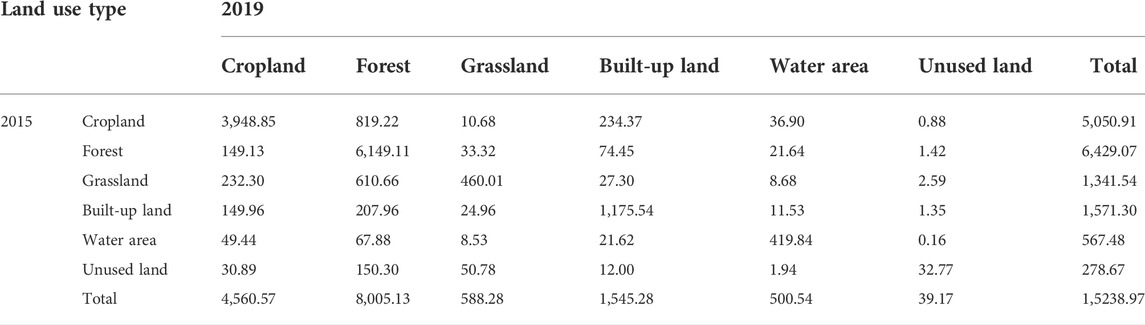
TABLE 4. 2015–2019 Land Use Transfer Matrix (values in square kilometers).
As shown in Figure 4, the most transferred area was forest at 1,856.08 km2; of this, the main sources of transfer are cropland, grassland, and built-up land. The transferred area of cropland is 1,224.48 km2; this was the most transferred land type, while its main sources of transfer were forest, built-up land, and grassland. Built-up land is the most comprehensively transformed land type by humans, with cropland, forest, and grassland representing its main sources of transfer.
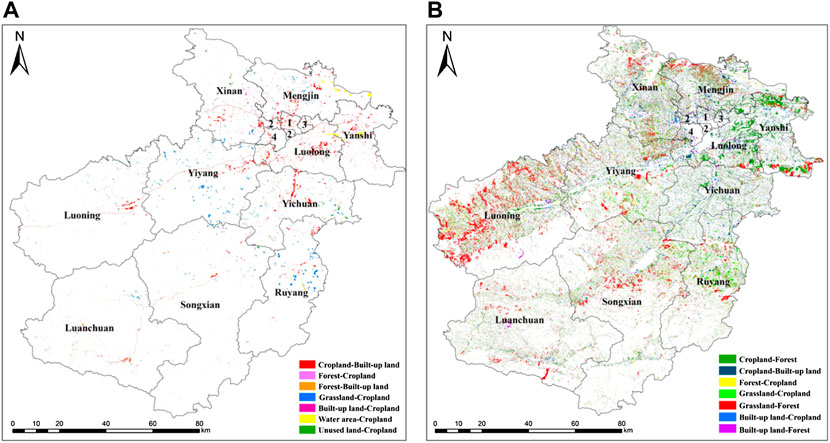
FIGURE 4. Land use transfer matrix in (A) 2010–2015; and (B) 2015–2019. Key: 1. Laocheng district, 2. Xigong district, 3. Chanhe district, and 4. Jianxi district.
In terms of the scale of interchange between forest, cropland, and built-up land in the study area, extensive areas of cropland were replaced by built-up land. The con-current increase in forested areas during the study period is mainly due to the official issuance of the Forest Luoyang Ecological Construction Plan (2018–2027), which has resulted in better protection and management of forests in Luoyang City, in addition to substantial progress in ecological engineering construction. This has protected forest resources to a certain extent, with additional economic and social benefits.
3.3 Changes in ecosystem service
3.3.1 Change in total ecosystem service value
Based on data from the Third Survey of Luoyang City Land, the study area’s ESV was estimated, with the results showing that forests and areas of water provided more than 80% of Luoyang City’s total ESV. Forests have the highest ESV contribution, ac-counting for more than 54% of the area’s total ESV. From 2010 to 2019, the total ESV increased from ¥447.75 billion to ¥456.54 billion (Table 5), an increase of 1.96%. This increase was influenced by the changes in the unit area economic value of different ecosystems (Figure 5A). Between 2010 and 2019, ESV in Luoyang City increased by 3.14% from natural ecosystems (i.e., forests, grasslands, and water bodies), from ¥41.15 billion to ¥42.45 billion per year. Among the total ESV growth of these natural landscapes, forests changed the most, with a recorded increase of 23.83%. In contrast, the total ESV of man-made ecosystems (i.e., cropland, unused land, and built-up land) de-creased by 11.35%, from ¥3.62 billion to ¥3.61 billion per year, with 95.50% of this contribution due to decreases in the extent of cropland. Overall, the total ESV of Luoyang City increased by ¥8.79 billion from 2010 to 2019, with an average annual growth rate of 2.16%.
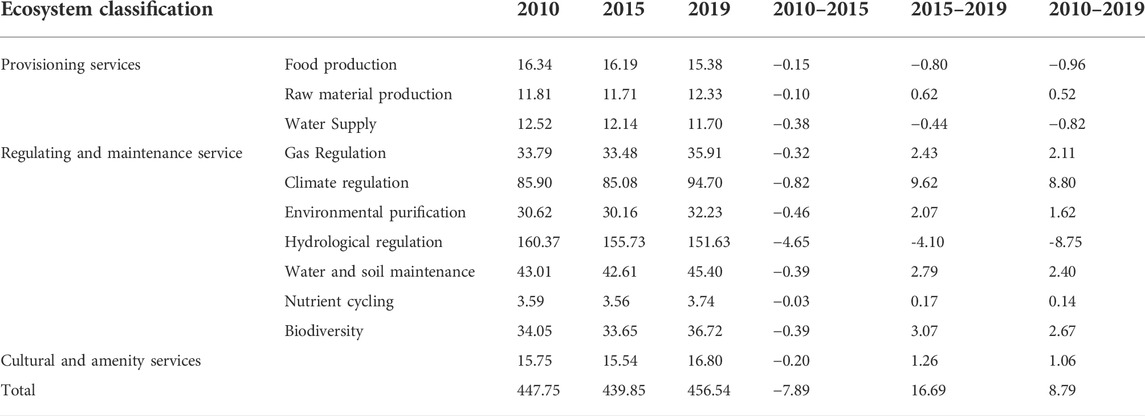
TABLE 5. Estimated values for different ecosystem functions in Luoyang in 2010–2019.
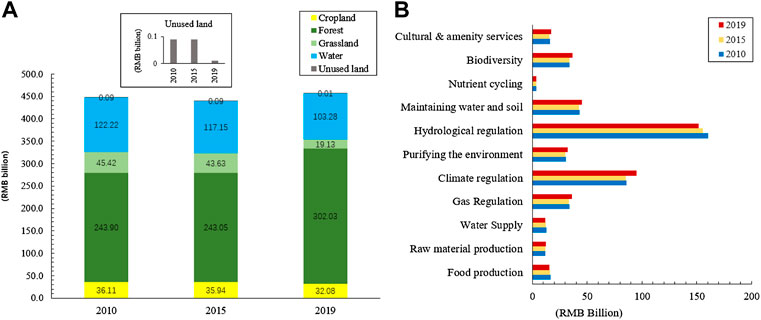
FIGURE 5. (A) ESV for different land-use types (RMB billion); (B) ESV of individual ecosystem service functions (RMB billion).
3.3.2 Changes in ecosystem service values of different ecosystem services
In addition to the overall ESV change in Luoyang City, we also quantified and contrasted the contributions of individual ecosystem functions to the total ESV. The most important components were hydrological regulation, climate regulation, and soil and water conservation (Figure 5B). In 2010, these ecosystem service functions ac-counted for 35.82%, 19.18%, and 9.61% of the total, in 2015, they accounted for 35.41%, 19.34%, and 9.69% of the total, and in 2019, they accounted for 33.21%, 20.74%, and 9.94% of the total, respectively. Between 2010 and 2019, all ecosystem service functions increased, except for water supply, food production, and hydrological regulation, which decreased by 6.54%, 5.88%, and 5.46%, respectively. Among these, climate regulation services increased the most (10.24%), followed by biological diversity (7.84%), aesthetic landscape (6.73%), gas regulation (6.24%), soil conservation (5.58%), environmental purification (5.29%), and raw material production (4.40%), with nutrient cycling showing the smallest increase (3.90%).
3.3.3 Ecosystem service value spatial patterns based on the local Getis–Ord G* index
Based on analysis of Getis-Ord G* statistics, the ESVs of townships within Luoyang City consistently showed significant spatial autocorrelation over the 10 years, with significant aggregation. The spatial association patterns of the attributes of regional units and those of surrounding units are shown by Moran’s I scatter plots, which show that ESV scatter is mainly dispersed in the first quadrant (HH) and the third quadrant (LL), while the scatter dispersed in the second quadrant (LH) and the fourth quadrant (HL) are relatively small (Figure 6). Combined with the Moran’s I index, the ESV of each township in Luoyang City shows a strong positive spatial correlation and a relatively consistent distribution pattern. From 2010 to 2019, the local Moran’s I index showed an increasing trend—the scatter of points along the trend line first increased and then decreased, reflecting an initial increase and subsequent decrease in local spatial autocorrelation degree in the study area. The spatial clustering of ESVs and the spatial divergence of ESVs in each district and county are broadly similar.
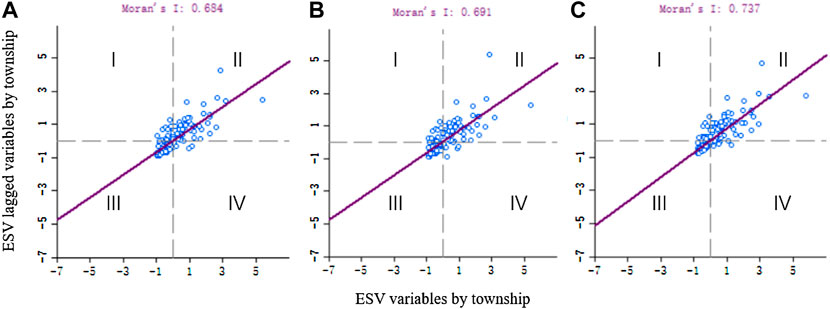
FIGURE 6. Moran’s I scatterplots of ESV in Luoyang City, in (A) 2010; (B) 2015; and (C) 2019.
In 2010, the ESV HH clusters areas are distributed in five counties such as LN, LC, SX, and RY in the south of Luoyang, and XA in the north. These areas have high elevations, mostly mountainous areas, forest cover, and are less influenced by factors such as urban land expansion; these areas also contain scenic locales such as Laojun Mountain Scenic Area in LC, Baiyun Mountain Scenic Area in SX, XA Longtan Grand Can-yon Scenic Area, etc. Five districts (LCH, XG, CH, LL, and JX) are LL clusters, mainly due to the low ESV values caused by the concentrated distribution of built-up land and the relatively small extent of natural ecosystems. LH clusters are distributed in LC and SX, while the HL cluster occurs in MJ—based on land use type, these areas mainly comprise water and the junction between cropland and built-up land areas, such as Xiaolangdi Dam and the area of cropland surrounding the reservoir (Figure 7A). In 2019, the value range of the LN, XA, LC, SX, and RY HH clusters further expanded, while those of the LL clusters showed a decreasing trend (Figure 7B and Figure 7C).
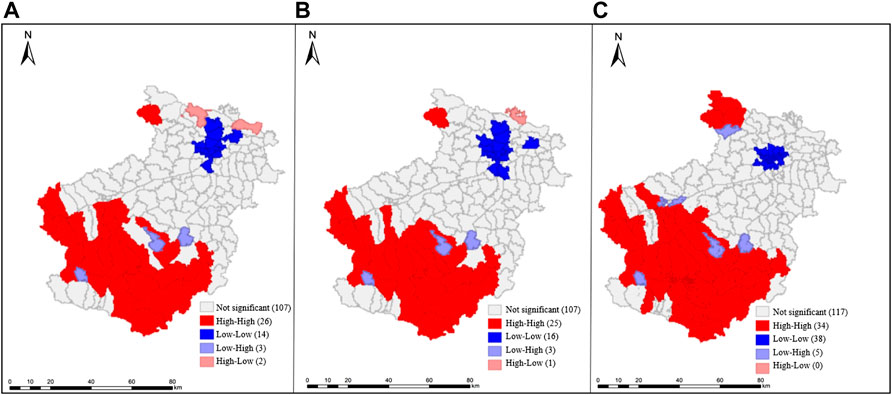
FIGURE 7. Local indicator of spatial association (LISA) maps of ESV in the Luoyang City area in (A) 2010; (B) 2015; and (C) 2019.
3.4 Elasticity of ecosystem service change with respect to land-use/cover change
To measure the response relationship between ESV and LUCC in Luoyang City, the elasticity coefficient was used to explore the response of ESV changes to LUCC changes in the periods 2010–2015 and 2015–2019 in each region of the study area, the results of which are shown in Figure 8. The higher the elasticity value, the greater the ESV response to land-use changes. From 2010 to 2015, high elasticity values occurred in grassland, cropland, and unused land areas in LL, with values of 25.27, 17.10, and 12.88, respectively. It shows that every 1% of land use conversion will lead to the average ESV changes in the region of 25.27%, 17.10% and 12.88%, respectively. The corresponding elasticity values of each land-use type in the other districts are low during this period, indicating that LUCC changes do not significantly impact ESV (Figure 8A). From 2015 to 2019, a high elasticity value is recorded in forest land in LL (23.25), followed by forest land in YCH (19.44); XG, MJ, CHH, JX, YSH, and LCH all showed large changes in the elasticity value of forests (Figure 8B). The areas where ESV changes are most sensitive to LUCC are the areas with low ESV values, which are mainly concentrated in 5 towns in the north of Luoyang City (XG, MJ, CHH, JX, YSH). During 2010–2019, the overall high elasticity values indicate that ESV responds strongly to LUCC, especially in the forest area of LL, where an elasticity value of 91.15 was recorded, indicating that forests have a significant impact on the value of ecosystem services in Luoyang City (Figure 8C). Since 2015, Luoyang’s forestry ecological construction has revolved around the development strategy of “foresting on the mountains, landscapes under the mountains, landscapes around the city, along the rivers and roads, and rural pastoralism”, and promotes the transformation of forestry from afforestation to landscaping, wealth creation, and benefits and greening. Change to beautification, culture and industrialization. Comprehensively promote and optimize the layout of the space bar, and Luanchuan County has made every effort to build an ecological conservation area in southern Luoyang. The forest coverage rate increases, and the contribution of forest land to ESV in Luoyang gradually increases.
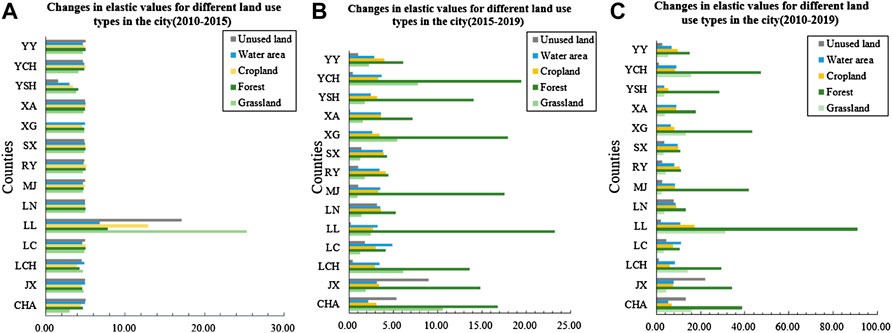
FIGURE 8. Changes in elastic values for different land-use types in the study area in (A)2010–2015; (B)2015-2019; (C) 2010-2019.
4 Discussion
In general, drastic changes in land-use models can harm ecosystems (Qiao et al., 2020; Deng et al., 2021; Xi et al., 2021). The sustainable development of cities cannot be achieved without studying the evolution of the value of urban ecosystem services, such as forest ecosystems, which provide gas regulation, hydrological regulation, etc. Cropland ecosystems ensure food security for people as well as benefits such as providing raw materials for production. Furthermore, forest and grassland ecosystems represent important recreational sites. In this paper, using the ESV coefficients determined by Xie et al. for China, six land types were analyzed to reveal the main factors affecting ESV changes in Luoyang City. Most significantly, expansion of forest land areas tends to lead to an increase in ESV. Previous studies have shown that during 2000–2018, the ESV of the Central Plains urban agglomeration in Henan Province exhibited a trend of steady improvement in the early stage and rapid decrease in the later stage of this period (Liu M. et al., 2021). However, this differs from our findings due to the rich ecological resources of Luoyang City and the differing development strategy focuses in the urban areas of Henan Province. The value of ecosystem services in Luoyang City increased by 1.96% (¥8.79 billion) between 2010 and 2019 under the influence of rapid urbanization. This aggressive change is primarily due to the strengthening of forest protection and management and the effective protection of forest land resources through ecological projects such as the “Returning Cultivated Land to Forests Project”, “Natural Forest Protection Project”, and “Afforestation Program”. These initiatives have resulted in an increase in forested areas and significant ecological, economic, and social benefits, offsetting the reduction of ecosystem service functions caused by the loss of natural ecosystems such as water and grassland areas during the study period. Despite the increase in total ESV, the loss of net ESV provided by grasslands and watersheds is noteworthy—the value of ecosystem services provided by watersheds and grasslands in Luoyang decreased by ¥2.63 billion (57.88%) and ¥1.90 billion (15.50%), respectively, between 2010 and 2019, accounting for 10.10%. The leading causes of this phenomenon is the development of some mudflats areas into agricultural land such as cropland and, additionally, economic development has prompted some counties to convert water bodies to built-up land, resulting in a reduction in water area. Furthermore, in plain areas, grasslands are mostly developed as cropland or occupied by built-up land, while in mountainous areas, mainly due to agricultural restructuring, grassland areas are widely reclaimed as forests or cropland. These changes result in a substantial decrease in grassland area, thus leading to a decrease in the ecosystem service functions provided by water and grassland. This is consistent with the findings of many other studies globally that have identified that urban expansion adversely affects the provision of other key ecosystem services (e.g., water supply, food production, and hydrological regulation) (Li et al., 2007).
During the study period, grassland areas were increasingly occupied by arable land due to urban expansion and population growth, with the grassland area in Luoyang City decreasing by 808.31 km2 during the decade, of which 25.03% was transformed into cropland. The decrease in water area in Luoyang City is a significant problem. This decrease is mainly driven by factors such as man-made transitional exploitation, lake reclamation, irrigation, siltation by sediment, raising of the lake bed, and other natural factors. Additionally, the decrease in freshwater resources in Luoyang City is not conducive to the development of freshwater aquaculture, while these issues are further compounded by the decrease in unused land, which has also reduced the area’s land reserve resources.
During 2010–2019, the total output of grain in Luoyang 2019 was 2.378 million tons, with an annual growth of 5.09%. The construction of high-standard farmland in Luoyang City continues to promote a policy of “hiding food in the land, hiding food in technology,” which greatly ensures the food security of Luoyang City; however, the 11.15% decline in arable land in Luoyang City is still a problem that cannot be ignored, and future development should focus on protecting arable land resources. In addition, Luoyang City fully supports the construction of energy-saving and environmental protection industries, closely links ecological and environmental protection with urban development, and optimizes land-use allocation. Since 2010, the extent of ESV high–high concentration areas has spread and low–low concentration areas have continued to decrease. The overall elasticity coefficient of Luoyang City is high, thus, changes in land use will cause a strong reaction in the ecosystem, among which, the forest has a drastic impact on the ecosystem; In the future, focusing on the goal of building an ecological Luoyang and a livable Luoyang, we should continue to strengthen ecological environmental protection and governance, build ecological corridor projects along the Yellow River, and implement ecological protection projects such as ecological forests in mountainous areas and reforestation in wetlands, so as to make forest ecosystems practical. The people of Luoyang get benefits.
The ESV calculation method is fully supported by theory. However, there are still has some inconclusive and limitations in the present study. First, although the calculation of the ESV coefficient in Xie has been widely used in scientific research, the results may not fully reflect the needs or desires of local residents. While ecologists have a better theoretical understanding of ESV than the general public, this study also focused on estimating the economic benefits of ESV without considering the intentions of the area’s residents. As the area with the greatest and most concentrated human activities, construction land plays an important role in providing ecosystem services (Zhu et al., 2017). However, due to the lack of relevant data and demonstrable methods, this paper does not estimate the ecosystem service value of the construction land ecosystems such as transportation land and scenic spots that are greatly affected by human activities, so this work needs further research. In future studies, social surveys can be conducted in the local area and their results can be compared with those of current studies. The ESV coefficients in Luoyang City can then be adjusted accordingly to allow them to more accurately reflect the local ecosystem conditions in the area by considering factors such as inflation, income differences, and consumption willingness. Because of differences in the criteria used for dividing the 2015 and 2019 land survey data in Luoyang City, there are also slight deviations between the transfer matrix processing results and the calculated actual land transfer area that require to be further addressed in subsequent studies.
5 Conclusion
In this paper, we use Luoyang City as a case study to quantitatively assess the impacts of dynamic changes in land use on ecosystem services generated by various districts and counties. Between 2010 and 2019, land-use changes in Luoyang City showed a trend of “two increases and four decreases”, specifically, built-up land and forest areas increased, while the extent of cropland, grassland, water, and unused land areas decreased; among these changes, forest and cropland areas showed the greatest increase and decrease, respectively, and were also the land-use types with the fastest growth and decrease, respectively. These changes are mainly due to the implementation of forest land protection policies such as the protection of existing forest land and the return of farmland areas to forest, which has resulted in a large-scale switch from cropland and grassland to forest. Due to the rapid expansion and development of cities and towns, built-up land in Luoyang City has inevitably occupied cropland and forest land. During 2010–2019, the change of ESV in Luoyang City was U-shaped, decreasing first and then increasing, primarily due to the implementation of forest land protection policies and the strengthening of environmental protection concepts among residents, which has led to the expansion of forest land area in Luoyang City and greater contribution of single ecosystem services such as hydrological regulation, climate regulation, and soil conservation. With the optimization of land-use allocation in Luoyang City, the area of ESV HH clusters in Luoyang has expanded since 2010, mainly in the LN, XA, LC, SX, and RY areas, while the area of LL clusters has shrunk. The overall elasticity coefficient of land use to ESV in Luoyang is higher and ESV responds strongly to LUCC, especially in forest areas in LL, MJ, XG, and YCH; thus, sustainable development in Luoyang must continue to prioritize the concept of “ecological protection first”. It is worth noting that the decrease in hydrological regulation and water supply services in Luoyang may significantly impact the economic development of the area, therefore, the urban development of Luoyang must take into account the adverse impacts of sudden decreases in water area on the natural ecosystem. Future development should aim to protect land reserve resources and the decreasing freshwater resources, while also making the best efforts to reduce pressure on land resources and protect the natural ecosystem of Luoyang.
Data availability statement
The data analyzed in this study is subject to the following licenses/restrictions: Part of the data comes from the government and cannot be made public. Requests to access these datasets should be directed to Junru Yin, yinjr@zzuli.edu.cn.
Author contributions
Conceptualization, JY and XL; methodology, JY and XL; software, HW and WH; validation, EC, HW, and XL; formal analysis, XL.; investigation, JY, HW, EC, and WH; resources, HW; data curation, XL and JY; writing—original draft preparation, JY and XL; writing—review and editing, HW and XL; visualization, WH; supervision, EC; and project ad-ministration, WH. All authors have read and agreed to the published version of the manuscript.
Funding
The research was funded by the Key scientific and technological projects in Henan Province, grant number 212102210105, 222102210046, the Young Backbone College Teacher Foundation of Henan Province], grant number 2020GGJS130,and Research Projects of Humanities and Social Sciences in Colleges and Universities of Henan Province: Research on the Transformation and Regulation of Cultivated Land Use in the Middle Reaches of the Yellow River—Taking Luoyang City as an Example, grant number 2021-ZZJH-157.
Conflict of interest
The authors declare that the research was conducted in the absence of any commercial or financial relationships that could be construed as a potential conflict of interest.
Publisher’s note
All claims expressed in this article are solely those of the authors and do not necessarily represent those of their affiliated organizations, or those of the publisher, the editors and the reviewers. Any product that may be evaluated in this article, or claim that may be made by its manufacturer, is not guaranteed or endorsed by the publisher.
References
Assefa, W. W., Eneyew, B. G., and Wondie, A. (2021). The impacts of land-use and land-cover change on wetland ecosystem service values in peri-urban and urban area of bahir dar city, upper blue nile basin, northwestern Ethiopia. Ecol. Process. 10, 39. doi:10.1186/s13717-021-00310-8
Berry, K., Bayham, J., Meyer, S. R., and Fenichel, E. P. (2018). The allocation of time and risk of Lyme: A case of ecosystem service income and substitution effects. Environ. Resour. Econ. (Dordr). 70, 631–650. doi:10.1007/s10640-017-0142-7
Bisui, S., Roy, S., Sengupta, D., Bhunia, G. S., and Shit, P. K. (2020). Conversion of land use land cover and its impact on ecosystem services in a tropical forest. Springer-Nature, 25.
Cabrera, A. R., Deadman, P., Moran, E., Brondízio, E. S., and Vanwey, L. K. (2012). Exploring demographic and lot effects in an abm/lucc of agriculture in the brazilian amazon. Nether: Springer, 663–676.
Costanza, R., D’Arge, R., Groot, R. D., Farber, S., Grasso, M., Hannon, B., et al. (1997). The value of the world's ecosystem services and natural capital. Nature 387, 253–260. doi:10.1038/387253a0
de Groot, R., Brander, L., van der Ploeg, S., Costanza, R., Bernard, F., Braat, L., et al. (2012). Global estimates of the value of ecosystems and their services in monetary units. Ecosyst. Serv. 1, 50–61. doi:10.1016/j.ecoser.2012.07.005
Deng, C., Liu, J., Nie, X., Li, Z., Xiao, L., Xiao, H., et al. (2021). How trade-offs between ecological construction and urbanization expansion affect ecosystem services. Ecol. Indic. 122, 107253. doi:10.1016/j.ecolind.2020.107253
Foley, J. A., DeFries, R., Asner, G. P., Barford, C., Bonan, G., Carpenter, S. R., et al. (2005). Global consequences of land use. Science 309, 570–574. doi:10.1126/science.1111772
Fu, B. J., Zhou, G. Y., Bai, Y. F., Song, C. C., and Xie, G. D. (2009). The main terrestrial ecosystem services and ecological security in China. Advan. Earth. Sci. 24, 571–576. doi:10.11867/j.issn.1001-8166.2009.06.0571
Hu, M., Li, Z., Wang, Y., Jiao, M., Li, M., and Xia, B. (2019). Spatio-temporal changes in ecosystem service value in response to land-use/cover changes in the pearl river delta. Resour. Conserv. Recycl. 149, 106–114. doi:10.1016/j.resconrec.2019.05.032
Jw, A., Wza, B., Stap, C., Wy, A., and Wl, A. (2019). A multiscale analysis of urbanization effects on ecosystem services supply in an urban megaregion. Sci. Total Environ. 662, 824–833. doi:10.1016/j.scitotenv.2019.01.260
Li, R. Q., Dong, M., Cui, J. Y., Zhang, L. L., Cui, Q. G., and He, W. M. (2007). Quantification of the impact of land-use changes on ecosystem services: A case study in pingbian county, China. Environ. Monit. Assess. 128, 503–510. doi:10.1007/s10661-006-9344-0
Liu, M., Zhao, S., and Wang, Y. (2021). Study on the spatial-temporal variation of ecosystem service value in central plains urban agglomeration. GWP 43, 17–22. 28.
Liu, W., Meng, Q., Allam, M., Zhang, L., and Menenti, M. (2021). Driving factors of land surface temperature in urban agglomerations: A case study in the pearl river delta, China. Remote Sens. (Basel) 13, 2858. doi:10.3390/rs13152858
Luoyang Municipal People's Government (LMPG) (2022). Data release[internet]. Luoyang: Luoyang:LMPG. Available from: http://www.ly.gov.cn/html/1//2/64/index.html.
Millennium Ecosystem Assessment (2005). Ecosystems and human well-being: Biodiversity synthesis. Island Press, Washington D.C: World Resources Institute. Available at: http://millenniumassessment.org/documents/document.354.aspx.pdf (Accessed January 26, 2017).
Meng, L., and Dong, J. (2019). Lucc and ecosystem service value assessment for wetlands: A case study in Nansi Lake, China. Water 11, 1597. doi:10.3390/w11081597
Qiao, B., Zhu, C. X., Cao, X. Y., Xiao, J. S., Shi, F. F., Yan, Y. Q., et al. (2020). Spatial autocorrelation analysis of land use and ecosystem service value in maduo county, qinghai province, China at the grid scale. J. Appl. Ecol. 31, 1660–1672. doi:10.13287/j.1001-9332.202005.014
Song, W., and Deng, X. (2017). Land-use/land-cover change and ecosystem service provision in China. Sci. Total Environ. 576, 705–719. doi:10.1016/j.scitotenv.2016.07.078
Wang, X., Dong, X., Liu, H., Wei, H., Fan, W., Lu, N., et al. (2017). Linking land use change, ecosystem services and human well-being: A case study of the Manas River Basin of Xinjiang, China. China. Ecosyst. Serv. 27, 113–123. doi:10.1016/j.ecoser.2017.08.013
Xi, H., Cui, W., Cai, L., Chen, M., and Xu, C. (2021). Evaluation and prediction of ecosystem service value in the zhoushan islands based on lucc. Sustainability 13, 2302. doi:10.3390/su13042302
Xie, G. D., Zhen, L., Chun-Xia, L. U., Xiao, Y., and Chen, C. (2008). Expert knowledge based valuation method of ecosystem services in China. J. Nat. Res. 23, 911–919. doi:10.11849/zrzyxb.2008.05.019
Ye, Y., Bryan, B. A., Zhang, J., Connor, J. D., Chen, L., Zhong, Q., et al. (2018). Changes in land-use and ecosystem services in the guangzhou-foshan metropolitan area, China from 1990 to 2010: Implications for sustainability under rapid urbanization. Ecol. Indic. 93, 930–941. doi:10.1016/j.ecolind.2018.05.031
Yin, Z. K., Tan, L. F., and Jia, Q. (2020). Land use change and ecosystem service value response in mountainous counties: Taking Song county as an example. Sci. Technol. Eng. 20, 14743–14751.
Ylab, C., Xlac, E., Bsab, C., and Chao, W. D. (2020). Assessing and predicting changes in ecosystem service values based on land use/cover change in the bohai rim coastal zone. Ecol. Indic. 111, 106004. doi:10.1016/j.ecolind.2019.106004
Yuan, S., Zhu, C., Yang, L., and Xie, F. (2019). Responses of ecosystem services to urbanization-induced land use changes in ecologically sensitive suburban areas in hangzhou, China. Int. J. Environ. Res. Public Health 16, 1124. doi:10.3390/ijerph16071124
Zhang, H., and Wang, Z. (2022). Human activities and natural geographical environment and their interactive effects on sudden geologic hazard: A perspective of macro-scale and spatial statistical analysis. Appl. Geogr. 143, 102711. doi:10.1016/j.apgeog.2022.102711
Zhang, H., Wang, Z., Liu, J., Chai, J., and Wei, C. (2022). Selection of targeted poverty alleviation policies from the perspective of land resources-environmental carrying capacity. J. Rural. Stud. 93, 318–325. doi:10.1016/j.jrurstud.2019.02.011
Zhang, J., Li, X., Zhang, C., Yu, L., Shi, T., Wu, X., et al. (2022). Assessing spatiotemporal variations and predicting changes in ecosystem service values in the guangdong–Hong Kong–macao greater bay area. GIsci. Remote Sens. 59, 184–199. doi:10.1080/15481603.2021.2022427
Zhang, Z. G., Zhang, X. P., and Zhang, Q. (2007). Soil and water conservation ecological rehabilitation and its existing problems in China. Soil. Water. Conserv. China. 15 (11), 38–58.
Zhang, B., Li, W., and Xie, G. (2010). Ecosystem services research in China: Progress and perspective. Ecol. Econ. 69, 1389–1395. doi:10.1016/j.ecolecon.2010.03.009
Zhou, D., Tian, Y., and Jiang, G. (2018). Spatio-temporal investigation of the interactive relationship between urbanization and ecosystem services: Case study of the jingjinji urban agglomeration, China. Ecol. Indic. 95, 152–164. doi:10.1016/j.ecolind.2018.07.007
Zhu, X. L., Zhang, J. J., Cheng, F. M., and Xu, Q. (2017). A study on transfer of ecosystem service values in mining cities by meta-analysis. J. Nat. Resour. 32, 434–448. doi:10.11849/zrzyxb.20160295
Keywords: ecosystem service value, land-use/cover change, elasticity coefficient, spatial correlation, GIS
Citation: Yin J, Liu X, Wang H, Huang W and Cai E (2022) Spatio-temporal variations of ecosystem service values in response to land use/cover change in Luoyang city. Front. Environ. Sci. 10:984888. doi: 10.3389/fenvs.2022.984888
Received: 02 July 2022; Accepted: 18 July 2022;
Published: 17 August 2022.
Edited by:
Qingsong He, Huazhong University of Science and Technology, ChinaReviewed by:
Yang Zhang, Capital University of Economics and Business, ChinaLaomo Zhang, Henan Institute of Engineering, China
Copyright © 2022 Yin, Liu, Wang, Huang and Cai. This is an open-access article distributed under the terms of the Creative Commons Attribution License (CC BY). The use, distribution or reproduction in other forums is permitted, provided the original author(s) and the copyright owner(s) are credited and that the original publication in this journal is cited, in accordance with accepted academic practice. No use, distribution or reproduction is permitted which does not comply with these terms.
*Correspondence: Junru Yin, yinjr@zzuli.edu.cn