 Yang Zhang
 Ping Jiang
 Liye Cui4
95% of researchers rate our articles as excellent or good
Learn more about the work of our research integrity team to safeguard the quality of each article we publish.
Find out more
ORIGINAL RESEARCH article
Front. Environ. Sci. , 23 August 2022
Sec. Land Use Dynamics
Volume 10 - 2022 | https://doi.org/10.3389/fenvs.2022.982734
This article is part of the Research Topic Land Governance, Integrated Socio-Ecosystem and Sustainable Development View all 33 articles
With the rapid development of China’s economy and the acceleration of urbanization, the rapid expansion of urban space has led to a growing demand for land that has resulted in the destruction and expropriation of a large amount of ecological land in China. In the face of the current situation of China’s resource constraints, environmental degradation, and ecosystem destruction, it is necessary to thoroughly study the territorial ecological space of China and its evolution rules. Based on previous studies on the classification of ecological land use, this study proposes the concept of territorial ecological space and distinguishes it from urban space and agricultural space. A matching ecological space classification system has been established, which may help in understanding the ecosystem model and related ecological processes. According to the constructed ecological space classification system, ecological spatial data processing was conducted. The standard deviation ellipse model was used to analyze the pattern of various ecological spaces in China and the migration of their barycenter. The results of the study show the following: 1) China’s territorial ecological space area showed a downward trend from 2000 to 2015. From the aspect of flow, the area of ecological space mainly flows into urban space, followed by agricultural space. According to the division of the first-level ecological space, the main ecological space structure of China is grassland ecological space and woodland ecological space. 2) The spatial distribution characteristics of China’s territorial ecological space are more prominent, and the distribution is very uneven. During the study period, the variation of the standard deviation ellipse angle θ of the ecological space is small, and the migration of the barycenter is not obvious, indicating that China’s territorial ecological space is in a relatively stable state. 3) It is necessary to implement a differentiated policy on the optimization and control of territorial ecological space according to the non-equilibrium of territorial space, and build a unified and coordinated territorial space management and control system. Such a differentiation policy would provide a basis for decision making and a reference for formulating strategies for the sustainable development of the regional ecological environment and optimizing the spatial layout of the territory.
With the rapid development of China’s economy and the acceleration of urbanization, the rapid expansion of urban space has led to a growing demand for land, resulting in the destruction and expropriation of a large amount of ecological land in China (Zhang et al., 2017; Cui et al., 2020). Land with special ecological significance gradually lost its original ecological function during the process of being damaged and overpopulated, which further exacerbated the instability of the ecosystem and exposed many ecological safety issues (Nelson et al., 2009; Bennett et al., 2009). The conflict and transformation of different types of land use is actually the versatility of land use (Gao et al., 2021; Willcock et al., 2016). The competition between different land uses is the game, with conflict between different functions and targets (Chou et al., 2016; Wu and WangZhang, 2019; Zhang et al., 2020). In the face of the current situation of China’s resource constraints, environmental degradation, and ecosystem destruction, it is necessary to thoroughly study the spatial variation of China’s territorial ecological space and its evolution rules and then rationally allocate and optimize the quantity and pattern of ecological space. There is no universal consensus on the definition of ecological space. However, many scholars and institutions have put forward their own analytical framework for the classification of ecological space or ecological land use. The division of ecological space has been carried out at the regional scale and mesoscale, and research on the classification of ecological land has been carried out, with relatively rich research results obtained. Summarizing the current research literature, we find that most scholars consider that ecological systems (land units) and spatial sites, which are important for maintaining key ecological processes at different spatial scales, are part of ecological land (Galloza et al., 2018; Kursad and Serkan, 2010). The Canadian Committee on Ecological (Biophysical) Land Classification (CCELC) proposes six levels of ecosystem classification: eco-zone, eco-province, eco-region, eco-district, ecology eco-site and eco-element (Wiken and Ironside, 1977). Zonneveld proposes different levels of land ecosystems: ecotope, land facet, land system, and main landscape (Zonneveld, 1989; Zonneveld, 1990). Klijn proposed a grade and system of ecological land classification and illustrated the practical significance and value of the hierarchical classification method (Klijn and de Haes, 1994). Capotorti proposed an ecological classification system for Italian land and studied whether the land units generated by the classification could serve as a reliable framework for coarse-scale environmental analysis and be used to implement national conservation strategies (Capotorti et al., 2012). Ulrich Walz and Christian Stein discussed the concepts of “closeness to nature” and “hemeroby”, and they thought that indicators of hemeroby can be a meaningful supplement to information provided by other national indicator systems (Walz and Stein, 2014). Grondin proposed a new classification method called “ecological land classification of homogeneous vegetation landscapes”. He thought that this method is more comprehensive than previous ELC methods (traditional approaches to ecological land classification) in that it combines the concepts and goals of both landscape ecology and ecosystem-based management (Grondin et al., 2014). Szilassi found that scale had a strong impact on the sign of the correlation between the naturalness of the vegetation and the landscape structure. They can predict the change in the naturalness of vegetation based on the spatial changes in the land cover pattern (Szilassi et al., 2017). Guo integrated these three features and used China’s current land use classification system to reconstruct ecological land classifications with four major grades (basic ecological land, auxiliary ecological land, productive ecological land and daily living ecological land) (Guo et al., 2018). Looking at the above understanding of ecological land by Chinese and foreign scholars, we can see that the concept of ecological land has not yet reached a consensus. However, the practical importance of this research area will allow more scholars to devote additional effort to in-depth research. We can find that the concept of “ecological land” is gradually becoming the same or similar. For the classification of ecological land, most scholars divide the ecological land into different categories according to the differences in the research area. The scholars who study the classification of ecological land are more concerned with the concept and classification of ecological land itself, from the perspective of human intervention. There is a lack of comprehensive exploration of the ecological space needed or occupied by macroscopically stable organisms. Ecological space is an important prerequisite for supporting human beings in the achievement of production and living (Chen et al., 2015; Liu et al., 2016a). Ensuring the stability and optimization of the basic support functions of ecological space is the key to coordinating a man-land system balance and building an ecologically civilized system (Costanza et al., 2014; Liu et al., 2015; Liu et al., 2016b). While China has achieved world-renowned economic development speed and volume, eco-environmental issues have always been the biggest obstacle to China’s transformation to high-quality development. In China, the policies of the country and its leaders have an important influence on the socioeconomic development (Zhao, 2011; Zhang et al., 2018). Therefore, it is both interesting and meaningful to study the changes and variation rules of ecological space in China.
Based on the definition of ecological space, we analyzed the differentiating characteristics and changing laws of territorial ecological space in China based on the standard deviation ellipse (Hereinafter referred to as SDE) method. We then proposed the non-equilibrium of the territorial space, implemented a differentiated territorial ecological space optimization and control policy, and delineated three areas (urban space, agricultural space, ecological space) and three lines (urban development boundary line, permanent basic farmland protection red line and ecological protection red line) to build a unified, coordinated territorial space management and control system. This study has certain practical significance for strengthening the protection of land ecological space, promoting the reform of the territorial resource management system and the construction of ecological civilization. It is expected to provide a basis for decision making and a reference for comprehensively grasping the regional ecosystem structure and succession rules, formulating strategies for the sustainable development of the regional ecological environment and optimizing the spatial distribution of the territories.
Broadly speaking, ecological land can be understood as all land on Earth (Costanza et al., 1997; Wouter et al., 2015). Ecological land is spatial carriers of ecosystem services (Hadi and Elham, 2019). To facilitate the management of land resources, the Ministry of Natural Resources of China divides land use into three types of land: agricultural, construction, and ecological. The Ministry defines ecological land as land other than agricultural space and urban space, including land used by humans but for purposes other than agricultural and construction, land used directly by organisms other than humans, or land used by humans or other organisms indirectly that mainly plays a role in maintaining biodiversity and the regional or global ecological balance and in maintaining Earth’s original environment. It can be seen from the above that ecological land corresponds to construction land and agricultural land. This concept is more suitable for the government’s management of land use activities and land resource allocation, and it belongs to the two-dimensional plane quantitative category. The authors believe that the connotation of ecological space is more abundant. It is not only the area that humanity has used or is about to intervene in and use but also the sum total of the environment that organisms need or occupy under macroscopic stability. From viewpoint, any organism needs to maintain certain environmental conditions for its existence and reproduction. Human intervention should not break the balance and rules of this space. Therefore, it is not a flat land but a vertically integrated space. Therefore, we propose a conceptual model of ecological space. The conceptual model of ecological space is as follows:
Ecological space = ecological land (woodland, grassland, water, etc.) + biological chain (biological and food chain) + abiotic factors (light, temperature, water, air, etc.). Schematic diagrams of a single ecological space and a compound ecological space are shown in Figure 1. The ecological land is a two-dimensional concept, which only refers to the ecological functional land with area attribute. The biological chain connects the material flow, energy flow and information flow in this space. The abiotic factors are abiotic factors existing in the living environment of living organisms, such as sunlight, temperature, water, air, soil, etc. The Figure 1A explains the connotation of the same ecological space, and the Figure 1B explains the relationship between different ecological spaces.
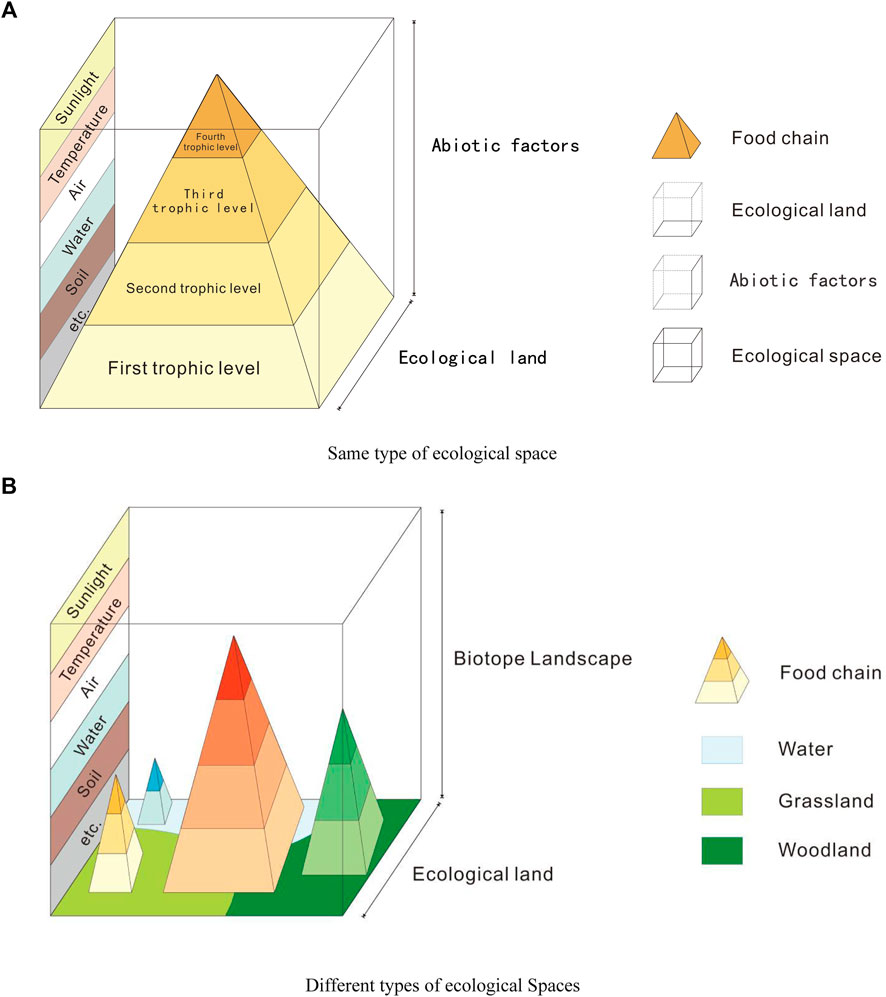
FIGURE 1. Ecological space schematic. (A) Same type of ecological space, (B) Different types of ecological Spaces.
The authors believe that to define an ecological space, it needs to be distinguished from other spaces first. According to the principle of leading functions, we can divide the territorial space into urban space, agricultural space and ecological space. This preliminary method of division does not mean that urban and agricultural space does not include ecologically functional land. Urban space is the territorial space that provides urban residents with leading functions such as production and living. Agricultural space refers to the territorial space that provides rural residents with leading functions such as production and living. Therefore, combined with the concept model of ecological space, we can define the territorial ecological space as follows.
Territorial ecological space refers to the territorial space that provides important ecological products and ecological services for the country or region in addition to agricultural space and urban space in a certain country or region and is composed of different functional ecological land, a complete food chain and a stable biological habitat. The ecological space mainly includes all the ecologically significant spaces outside the agricultural space and the urban space, such as forest, grassland, marsh, wetland, river, lake, beach, shore line, ocean, desert, the Gobi desert, glacier, alpine tundra, uninhabited island and other space.
To facilitate research, the corresponding type space that constitutes the ecological space is divided based on the following principles.
(1) Emphasize the ecological service function of ecological land use. Ecological land use should provide ecological services, such as environmental regulation and biological conservation, as the primary functions and play an important role in maintaining regional ecological balance and sustainable development. Among them, the environmental regulation function mainly refers to climate regulation, hydrological regulation, soil regulation and control, interference regulation, etc. The biological conservation function mainly refers to providing habitats, rich gene banks, and biological control functions for organisms other than humans.
(2) Focus on ecological heterogeneity and the integrity of the spatial structure. Ecosystems have different levels and scales, and the internal structure of the system varies widely. The characteristics of different types of ecosystems at various levels are quite different, and their performances are not the same. Adopting the heterogeneity of an ecosystem as the determining standard for ecological land is more in line with the objective conditions of the ecosystem. For any type of ecological land to play its ecological service function, it must first ensure the integrity of its spatial structure.
(3) Pay attention to the connection with the land use status classification system. The “Classification Standards for Land Status” (GB/T21010-2007) has been promulgated as a national standard in China. Linking to the land status classification system facilitates the extraction of various types of ecological space and reduces the workload. Therefore, the classification of ecological land types can be carried out on the basis of the currently widely used “Classification Standards for Land Status” (GB/T21010-2007) in China to save manpower, material resources, and financial resources. This not only makes the data fully current but also realizes the connection with historical data.
Using the will survey and evaluation method, through questionnaires and expert opinions, the classification of ecological space is determined based on the above three principles. The type of ecological land is determined to specifically include the following first-level and second-level land types (Table 1). The first-level and second-level types are described in the “Classification Standards for Land Status” (GB/T21010-2007) and the “Second China Land Survey Technical Regulations”.
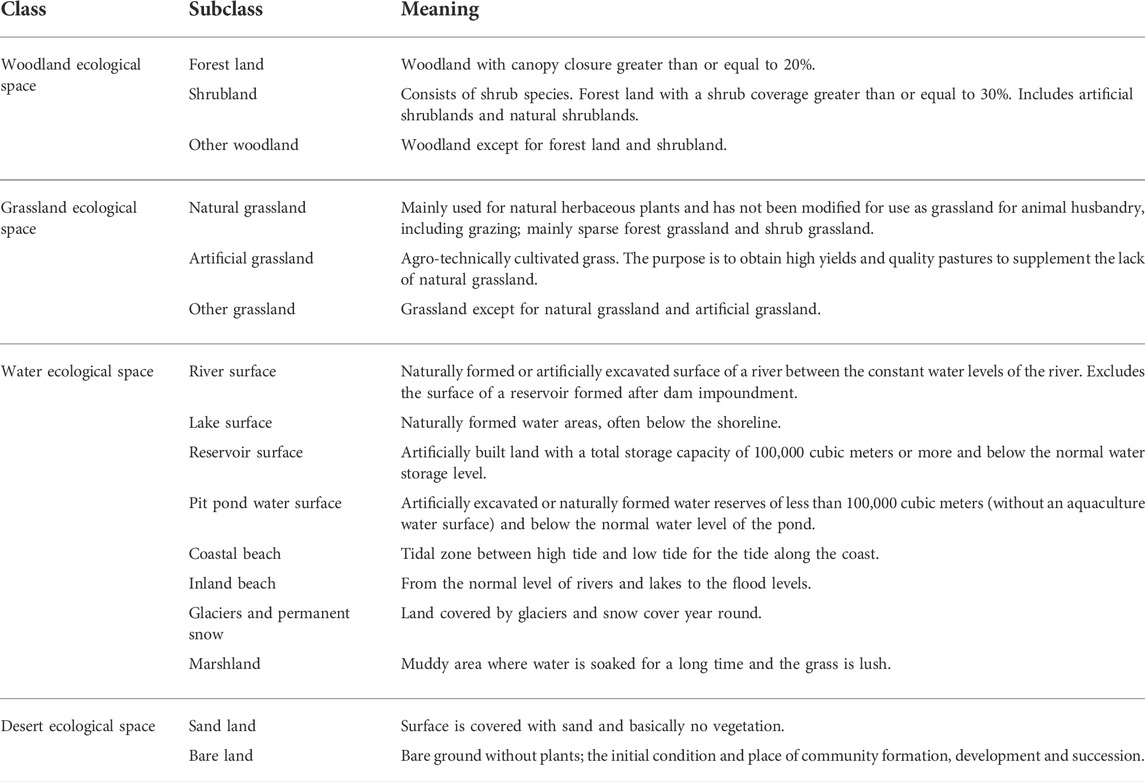
TABLE 1. Ecological space type classification system based on classification standards for land status in China.
Ecological space data came from the merger and extraction of land use data for 2000 and 2015. Data for 2000 and 2001–2014 were obtained from China Institute of Land Surveying and Planning. Data for 2015 were obtained from the Second National Land Survey published by the Ministry of Natural Resources (Table 2).
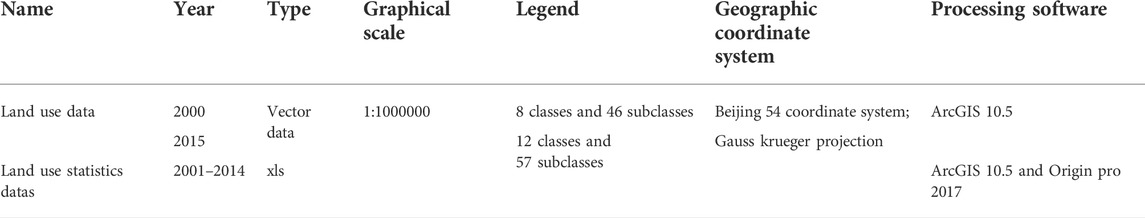
TABLE 2. Data.
SDE method is a geostatistics method that can accurately reveal the spatial distribution characteristics of various types of geographical features (Wong, 1999; Li et al., 2016). This method was first proposed by the sociologist Lefever. It was mainly used to reveal the spatial relationship of geographical factors. Later, it was widely used in many fields as a method for descriptive exploration of geographical space. This method is also applicable to the comparison of descriptive analyses and spatial distribution changes over time. The SDE method can better describe the deviation direction of a group of geographical elements in terms of their spatial distribution, can calculate the mean center of geographical feature objects, and can be either weighted or unweighted. In this study, the weighted average center was used to obtain the average of the coordinates of each point and was calculated based on the weight of the ecological space density attribute variable.
The calculation method is as follows. It can be implement in ArcGIS (Wang and Gao, 2014).
Weighted average center:
Ellipse direction:
X-axis standard deviation:
Y-axis standard deviation:
In the formula,
Based on the analysis of the data of ecological land in 2015, it can be calculated that the total area of ecological space in China is 732.3704 million hectares, accounting for approximately 76.28% of the country’s land area. According to the division of first-class land types, the ecological space structure of China is mainly grassland ecological space and woodland ecological space. Among them, the grassland, woodland, water and desert areas are 286.4020 million hectares, 25299.200 million hectares, 41.063 million hectares and 151.97 million hectares, respectively, accounting for 39.11%, 34.54%, 5.60%, and 20.75%, respectively, of the total ecological space. Divided by second-class land types, China’s ecological spatial structure is dominated by natural pastures and forest lands, of which natural pasturage, forest land, bare land, other grassland, shrubland, and other woodland have areas of 217.596 million hectares, 187.1142 million hectares, 99.1592 million hectares, 66.9813 million hectares, 43.2866 million hectares and 22.5912 million hectares, respectively, accounting for 29.71%, 25.55%, 13.54%, 9.15%, 5.91%, and 3.08%, respectively, of the total ecological space (Table 3).
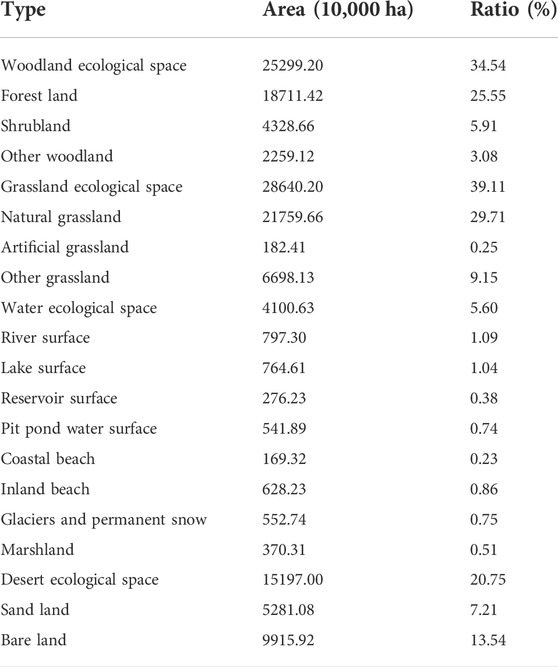
TABLE 3. Area of ecological space types in 2015.
From the perspective of provinces (Figures 2, 3 and Table 4), Xinjiang, Tibet, Inner Mongolia and Qinghai have large ecological space. The total area is 150.38 million ha, 118.9759 million ha, 101.778 million ha and 64.6276 million ha, respectively. The provinces with high ratios of ecological space and jurisdiction over the region in 2015 were Xinjiang, Tibet, Inner Mongolia, and Qinghai at 91.96%, 98.97%, 89.02%, and 92.77%, respectively. The provinces with less ecological space were Tianjin, Shanghai and Beijing. It can be seen that there is a significant difference in the spatial distribution of China’s territorial ecological space. This distribution pattern is in line with the “Heihe-Tengchong Line”, which mainly focuses on the geographically sparsely populated areas in the northwest. The densely populated and socioeconomically developed regions have relatively small ecological space, population and society-economy distribution, and the ecosystem service supply regions are seriously out of balance.
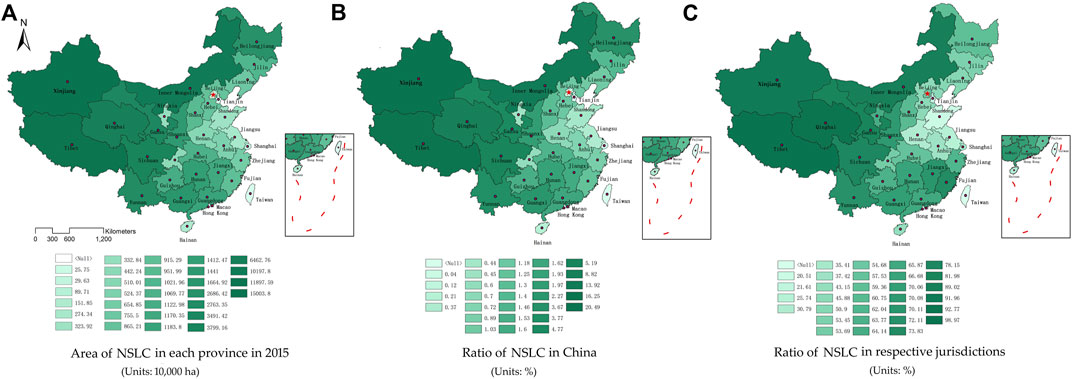
FIGURE 2. Area and ratio of ecological space in 2015.

FIGURE 3. Ratio of China’s ecological space, GDP and population in 2015.
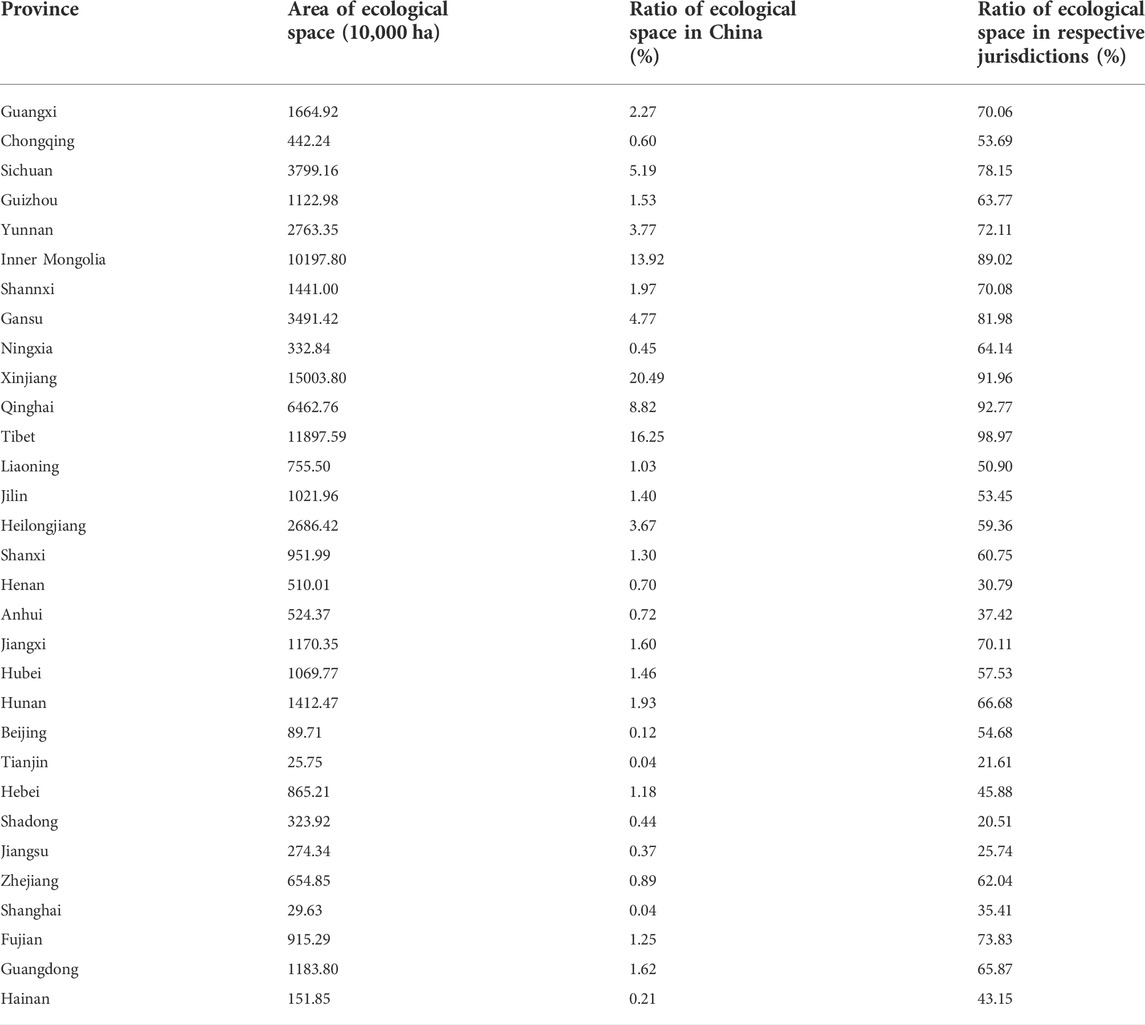
TABLE 4. Area and ratio of ecological space in 2015.
Judging from the area of ecological space types in each province (Table 5), the provinces with larger woodland ecological space included Inner Mongolia, Yunnan, Sichuan and Heilongjiang. The provinces with larger grassland ecological space included Tibet, Inner Mongolia, Xinjiang, and Qinghai. The provinces with larger water ecological areas included Tibet, Xinjiang, Qinghai, Heilongjiang, Inner Mongolia, and Jiangsu. The largest desert area was in Xinjiang. From the perspective of the proportion of regional ecological space, the provinces with relatively large woodland ecological space were mainly the three northeastern provinces and the eastern and central provinces. The provinces with relatively large grassland ecological space were mainly in the northwestern provinces of Inner Mongolia, Xinjiang, and Qinghai. The provinces with relatively large water ecological space were mainly Jiangsu (88.69%), Shanghai (83.51%) and Tianjin (74.02%). The provinces with relatively large desert ecological space were mainly Xinjiang (57.50%) and Gansu (39.56%).

TABLE 5. Area and ratio of ecological space types in respective jurisdictions in 2015.
From the spatial distribution of the SDE (Figure 4), the spatial distribution of China’s territorial ecological space presents a spatial pattern of “east (slightly south)-west (slightly north)” direction. In 2015, the barycenter of the territorial ecological space was located in Qinghai Province (X: 135632.81, Y: 4027018.11). The spatial distribution of woodland ecological space presents a spatial pattern of “northeast-southwest” direction. The barycenter of the woodland ecological space was in Shaanxi Province (X:902459.11, Y: 3725595.22). The distribution of grassland ecological space presents a spatial pattern of “northeast-southwest” direction. In terms of space, it extends from “Tibet-Qinghai-Gansu-Inner Mongolia”. In 2015, the barycenter of grassland ecological space was located in Qinghai Province (X: -220179.14, Y: 4998648.82). The spatial distribution of water ecological space shows a spatial pattern of “east (slightly north)-west (slightly south)” direction. The barycenter of the water ecosystem was located in Gansu Province (X: 545335.37, Y: 3935717.66). The spatial distribution of desert ecology shows a spatial pattern that is more obvious in the “southeast-northwest” direction. Spatially extended in the direction of “Xinjiang-Gansu-Qinghai”, the barycenter of the desert ecological space was located in the Xinjiang Uygur autonomous region (X: -581147.67, Y: 4418779.70).
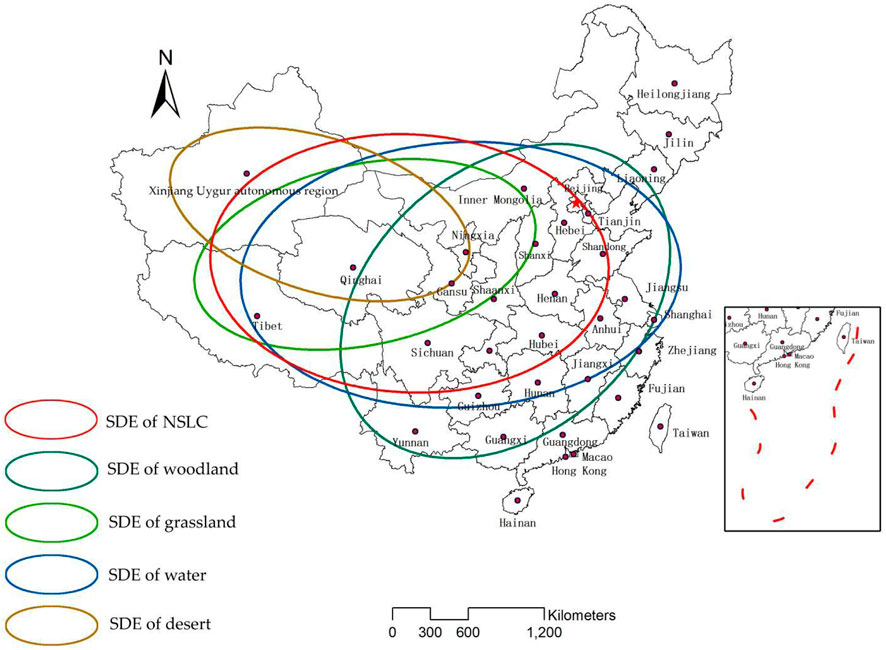
FIGURE 4. SDE spatial distribution of ecological space types in 2015.
Based on the SDE, China’s territorial ecological spatial distribution was calculated. The change of China’s total territorial ecological space from 2000 to 2015 is shown in Figure 4. The standard deviation parameters and changes are shown in Tables 3, 4. In 2000, the barycenter of the territorial ecological space was located in Qinghai Province (X:122518.31, Y:4021943.55). In 2015, the barycenter of the territorial ecological space changed little, and it changed to the position in Qinghai Province of (X: 135632.81, Y: 4027078.11). From 2000 to 2015, the total displacement of China’s territorial ecological space center was 14.08 km, of which 13.11 km was eastwards and 5.1 km was northwards, showing a general trend of moving eastwards. From 2000 to 2015, the standard deviation of China’s territorial ecological spatial distribution of the ellipse tends to shrink in the x-axis and grow in the y-axis, with the x-axis shortened by 1.53 km and the y-axis grew by 16.03 km. It can be seen that China’s territorial ecological space has contracted in the “east-west” directions and grown in the “south-north” directions, and the y-axis grown velocity is faster than the x-axis contraction velocity. This situation is in line with China’s territorial ecological spatial distribution. With the acceleration of urbanization in China, the speed of the transformation of ecological space into urban space has also accelerated. Although there is a small amount of arable land, garden land, and construction land inflows, the outflow amount far exceeds the inflow volume, and the transformation of ecological space into urban space is obvious, followed by the transformation into agricultural space. From 2000 to 2015, the area of ecological space in China continued to decline. In 2015, it decreased by a total of 18.18 million hectares compared with 2000, a drop of 2.42% (Figure 5).
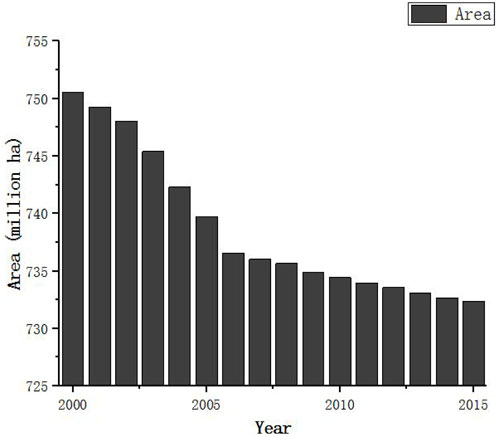
FIGURE 5. Area change of China’s ecological space from 2000 to 2015.
According to the analysis of the secondary classes contained in the ecological space in 2000 and 2015 (Figure 6), the area of the woodland and water were increasing, and the area have increased by 31.7 and 6.44 million hectares in the past 15 years. The grassland and desert have been cut back. The area have reduced by 16.21 and 40.11 million hectares in the past 15 years. The increase in woodland and water was attributed to the long-term implementation of the Chinese government’s policies which were “returning farmland to forests” and “returning farmland to lakes” (in Chinese: “tui geng huan cao”and “tui geng huan hu”). The reduction of grassland was related to the rapid urbanization of the central-western china. In the process of urbanization in the central-western china, urban space occupied a large number of grassland. The reason for the decline of the desert was mainly the desertification control of the China government.
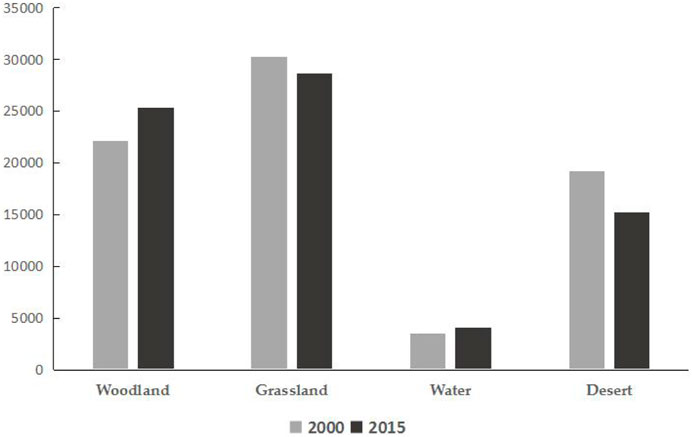
FIGURE 6. Area change of China’s ecological space in 2000 and 2015.
The parameters of the SDE of various ecological spaces and their changes are shown in Tables 6, 7. SDE spatial distribution and center of gravity changes are shown in Figure 7 and Figure 8. It can be seen that the barycenter of the woodland ecological space in 2000 was located in Hubei Province (X: 998696.96, Y: 3646692.92). In 2015, the barycenter of the woodland ecological space changed little and changed to the Shanxi Province (X: 902459.11, Y: 3725595.22) position. From 2000 to 2015, the total displacement of the barycenter of the woodland ecological space was 124.45 km, including 96.24 km westward and 78.90 km northward, showing a general trend of moving westward. This trend also reflects the flow of woodland ecological space. Regarding the change of woodland in all provinces of China, the provinces with the largest transformation to areas are Chongqing, Hunan, Inner Mongolia and Xinjiang; the provinces with the largest transformation from areas are Guangdong, Hunan, Jiangxi and Guizhou. From 2000 to 2015, the standard deviation of woodland ecological spatial distribution of the ellipse tends to shrink in the x-axis and grow in the y-axis, with the x-axis shortened by 70 km and the y-axis grew by 30.57 km. It can be seen that the distribution of woodland territorial ecological space is discrete in its distribution direction; the x-axis contraction rate is faster than the y-axis growth rate, and the woodland ecological space is increasingly dispersed.
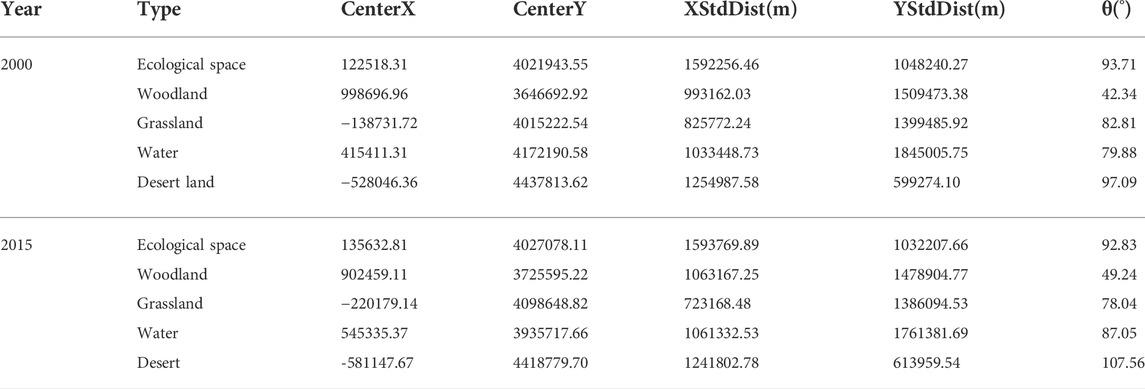
TABLE 6. SDE parameters of ecological space types from 2000 to 2015.
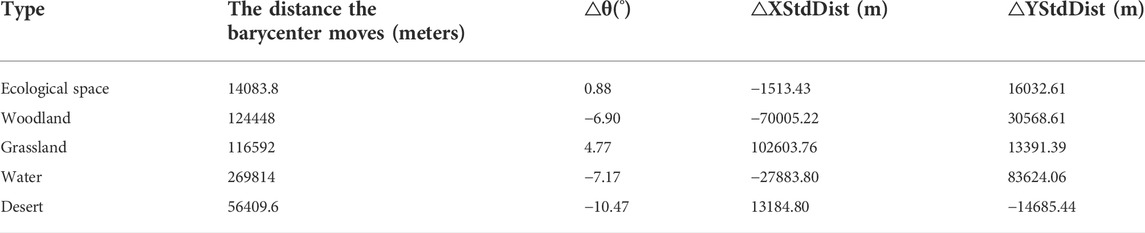
TABLE 7. SDE parameter changes of ecological space types from 2000 to 2015.
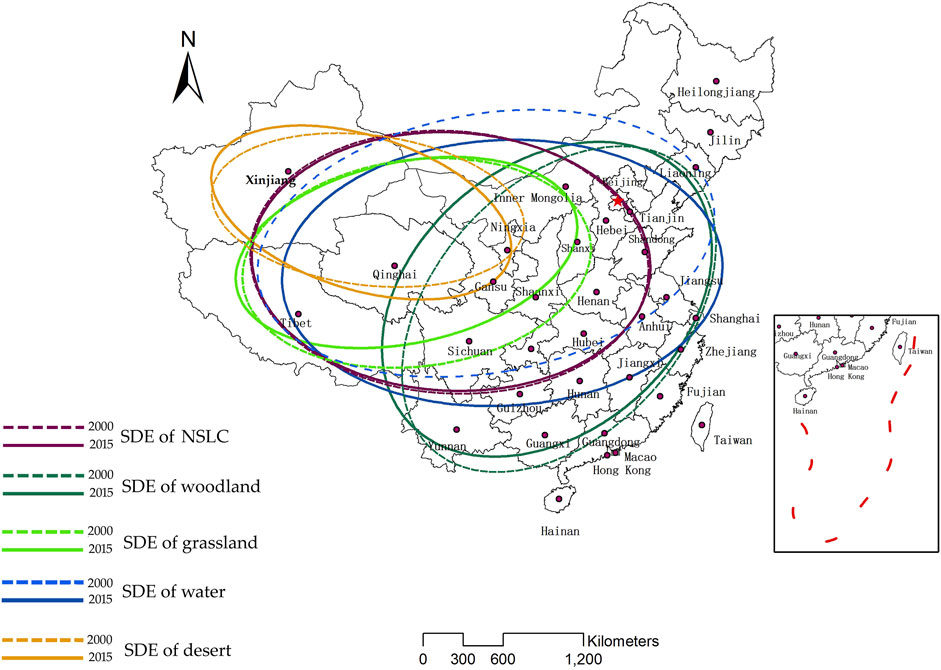
FIGURE 7. SDE spatial distribution of ecological space types from 2000 to 2015.
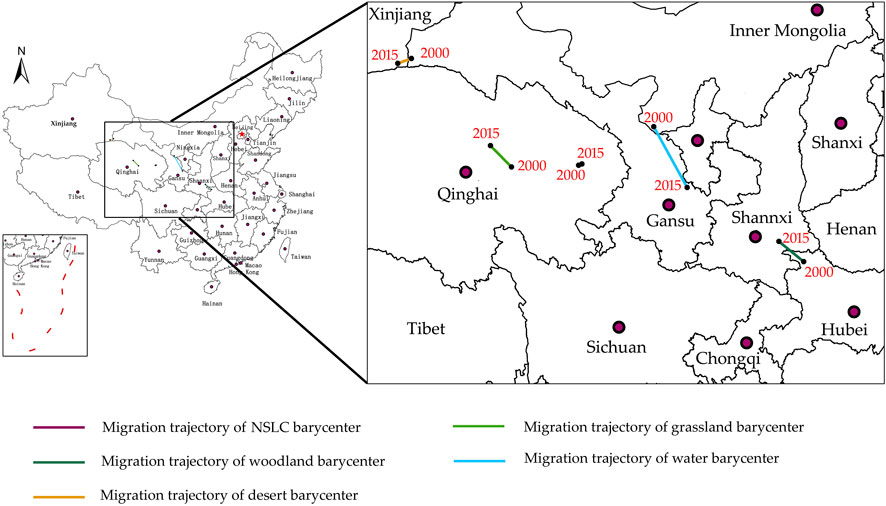
FIGURE 8. Migration trajectory of ecological space baryleft from 2000 to 2015.
In 2000, the barycenter of grassland ecological space was located in the position in Qinghai province of (X: -138731.72, Y: 4015222.54). In 2015, the barycenter of the grassland ecological space changed to the position in Qinghai province of (X: -220179.14, Y: 4098648.82). From 2000 to 2015, the total displacement of the grassland ecological space barycenter was 116.59 km, including 81.45 km westwards and 83.43 km southwards, showing a general trend of moving northwest. From 2000 to 2015, the SDE of the grassland ecological spatial distribution showed a contraction trend on the x-axis and y-axis, with the x-axis shortened by 102.6 km and the y-axis shortened by 13.39 km. It can be seen that the grassland territorial ecological space has been contracting in its distribution direction.
In 2000, the barycenter of the water ecosystem was located in Inner Mongolia (X: 415411.31, Y: 4172190.58). In 2015, the barycenter of the water ecosystem changed greatly, and it changed to the position in Gansu Province of (X:545335.37, Y:3935717.66). From 2000 to 2015, the total displacement of the water ecological space barycenter was 269.81 km, of which 129.92 km was eastwards and 236.47 km was southwards, showing a general trend of moving southeast wards. The main reason is that many water areas have been turned into urban built-up area. The areas in which water-use land is converted into urban built-up area are commonly found in Jiangsu, Henan, Zhejiang, and Guangdong Provinces. From 2000 to 2015, the standard deviation of water ecological spatial distribution of the ellipse tends to shrink in the x-axis and grow in the y-axis, with the x-axis shortened by 27.88 km and the y-axis grew by 83.62 km. The y-axis grown velocity is faster than the x-axis contraction velocity.
In 2000, the barycenter of the desert ecological space was located in Inner Mongolia (X:-528046.36, Y: 4437813.62). In 2015, the barycenter of the desert ecological space changed to the position in the Xinjiang Uygur autonomous region of (X: -581147.67, Y: 4418779.70). From 2000 to 2015, the total displacement of the desert ecological space barycenter was 56.41 km, including 53.10 km westwards and 19.03 km southwards, showing a general trend of moving southwest. From 2000 to 2015, the SDE spatial distribution of desert ecological space showed growth trends on the x-axis and contraction trends on the y-axis, with the x-axis grew by 13.18 km and the y-axis shorted by 14.69 km.
Territory ecological space is a complex ecological giant system with complex natural-societal-economic interactions, which is of great significance to the development of new space, new kinetic energy and the construction of ecological civilization in China. Based on the eco-spatial data from 2000 to 2015, the ecological space pattern of China in 15 years was analyzed. Based on the SDE model, we analyze the spatial differentiation and change rule of China’s territorial ecological space, with a view to providing a basis for decision making and a reference for formulating strategies for the sustainable development of the regional ecological environment and optimizing the spatial layout of the territory.
The results of the study show the following:
1) In 2015, the total area of ecological space in China was 732.3704 million hectares, accounting for 76.28% of China’s total land area. According to the division of first-level ecological space, the ecological spatial structure of China is mainly grassland ecological space and woodland ecological space. From 2000 to 2015, China’s territorial ecological space area showed a downward trend. From the aspect of flow, the area of ecological space mainly flows into urban space, followed by agricultural space. That is, a large amount of ecological land has been transformed into urban built-up area and cultivated land.
2) The directional characteristics of the distribution of China’s territorial ecological space are more prominent, and the distribution is very uneven. The ecological space is mostly concentrated in the sparsely populated and socioeconomically underdeveloped regions of the northwest, whereas in the eastern regions, the population is concentrated and the socioeconomically developed regions are less distributed. This shows that the spatial distribution of China’s population and socioeconomic and ecological system service supply areas are in an imbalanced spatial configuration state. From 2000 to 2015, the changes in the SDE rotation angle of ecological space were small, and the shift of the barycenter was not obvious. It indicated that China’s territorial ecological space is in a relatively stable state. However, the SDE rotation angles of the four types has changed greatly.
3) The basic ecological functions of China’s ecological space are concentrated in the west, and the beneficial areas are concentrated in the east. However, the western ecological environment is fragile, and if it is not protected, it will lose basic ecological functions. Therefore, according to the imbalance of territorial space, we should implement differentiated policies of territorial ecological space optimization and control. In accordance with the overall requirements of promoting “intensive and efficient production space, livable and moderate living space, green and vitalecological space”, the urban space, agricultural space and ecological space are delineated within the limits of territorial space, the management and control of ecological space are strengthened, the urban growth boundaries and permanent basic farmland protection red line are delimited, and the urban built-up area occupation of agricultural space and ecological space is strictly controlled. Meanwhile, system and mechanism innovation, construction of a territorial space planning system, and construction of a unified and coordinated territorial space management and control system could provide support for the optimization of territorial ecological space, comprehensive management and ecological civilization construction.
Based on the SDE model, the law of ecological spatial differentiation was researched in China from 2000 to 2015. Through demonstration, it can be found that the SDE model is suitable for the study of ecological spatial differentiation. In the context of global warming, the study of ecological space is of great significance for the emission peak and carbon neutrality. Therefore, the study of the differentiation law of ecological space needs long-term tracking, and we will continue to track this interesting problem in the future.
The original contributions presented in the study are included in the article/supplementary material, further inquiries can be directed to the corresponding author.
YZ proposed the overall research program and the technical route, PJ was responsible for the communication and editing, and other academics did the data analysis.
This research was supported by the Major projects of National Social Science Fund (ID:20ZDA086), Fundamental Research Funds for the Capital University of Economics and Business (ID:QNTD202009 and QNTD202209), Major project of Beijing Social Science Foundation (19ZDA03) and Open Research Fund Program of Key Laboratory of Digital Mapping and Land Information Application Engineering, NASG (ID: ZRZYBWD201908).
The authors declare that the research was conducted in the absence of any commercial or financial relationships that could be construed as a potential conflict of interest.
All claims expressed in this article are solely those of the authors and do not necessarily represent those of their affiliated organizations, or those of the publisher, the editors and the reviewers. Any product that may be evaluated in this article, or claim that may be made by its manufacturer, is not guaranteed or endorsed by the publisher.
Bennett, E. M., Peterson, G. D., and Gordon, L. J. (2009). Understanding relationships among multiple ecosystem services. Ecol. Lett. 12, 1394–1404. doi:10.1111/j.1461-0248.2009.01387.x
Capotorti, G., Guida, D., Siervo, V., Smiraglia, D., and Blasi, C. (2012). Ecological classification of land and conservation of biodiversity at the national level: The case of Italy. Biol. Conserv. 147, 174–183. doi:10.1016/j.biocon.2011.12.028
Chen, L., Tang, L., Ren, Y., and Liao, J. (2015). Ecological land classification: A quantitative classification and ordination of forest communities adjacent to a rapidly expanding urban area in southeast coastal China. Acta Ecol. Sin. 35, 46–51. doi:10.1016/j.chnaes.2014.12.002
Chou, W., Lee, C., and Chang, C. (2016). Relationships between urban open spaces and humans’ health benefits from an ecological perspective: a study in an urban campus. Landsc. Ecol. Eng. 12, 255–267. doi:10.1007/s11355-016-0295-5
Costanza, R., D’Arge, R., De Groot, R., Farber, S., Grasso, M., Hannon, B., et al. (1997). The value of the world’s ecosystem services and natural capital. Nature 387, 253–260. doi:10.1038/387253a0
Costanza, R., de Groot, R., Sutton, P., van der Ploeg, S., Anderson, S. J., Kubiszewski, I., et al. (2014). Changes in the global value of ecosystem services. Glob. Environ. Change 26, 152–158. doi:10.1016/j.gloenvcha.2014.04.002
Cui, L., Wang, J., Sun, L., and Lv, C. (2020). Construction and optimization of green space ecological networks in urban fringe areas: A case study with the urban fringe area of Tongzhou district in beijing. J. Clean. Prod. 276, 124266–124310. doi:10.1016/j.jclepro.2020.124266
Galloza, M. S., Webb, N. P., Bleiweiss, M. P., Winters, C., Herrick, J. E., and Ayers, E. (2018). Exploring dust emission responses to land cover change using an ecological land classification. Aeolian Res. 32, 141–153. doi:10.1016/j.aeolia.2018.03.001
Gao, J., Liu, X., Wang, C., Wang, Y., Fu, Z., Hou, P., et al. (2021). Evaluating changes in ecological land and effect of protecting important ecological spaces in China. J. Geogr. Sci. 31, 1245–1260. doi:10.1007/s11442-021-1896-y
Grondin, P., Gauthier, S., Borcard, D., Bergeron, Y., and Noel, J. (2014). A new approach to ecological land classification for the Canadian boreal forest that integrates disturbances. Landsc. Ecol. 29, 1–16. doi:10.1007/s10980-013-9961-2
Guo, X., Chang, Q., Liu, X., Bao, H., Zhang, Y., Tu, X., et al. (2018). Multi-dimensional eco-land classification and management for implementing the ecological redline policy in China. Land Use Policy 74, 15–31. doi:10.1016/j.landusepol.2017.09.033
Hadi, S., and Elham, J. (2019). A conceptual framework to assess ecological quality of urban green space: a case study in Mashhad city, Iran. Environ. Dev. Sustain. 21, 1781–1808. doi:10.1007/s10668-018-0103-5
Klijn, F., and de Haes, H. A. U. (1994). A hierarchical approach to ecosystems and its implications for ecological land classification. Landsc. Ecol. 9, 89–104. doi:10.1007/BF00124376
Kursad, O., and Serkan, G. (2010). Ecological land classification and mapping based on vegetation-environment hierarchical analysis- a case study of Buldan forest district (Turkey). Pol. J. Ecol. 58, 55–67.
Li, P., Chen, T., and Liu, S. (2016). Spatiotemporal Dynamics and drivers of farmland changes in panxi mountainous region, China. Sustainability 8 (11), 1209. doi:10.3390/su8111209
Liu, Y., Feng, Y., Zhao, Z., Zhang, Q., and Su, S. (2016a). Socioeconomic drivers of forest loss and fragmentation: A comparison between different land use planning schemes and policy implications. Land Use Policy 54, 58–68. doi:10.1016/j.landusepol.2016.01.016
Liu, Y., Luo, T., Liu, Z., Kong, X., Li, J., and Tan, R. (2015). A comparative analysis of urban and rural construction land use change and driving forces: Implications for urban–rural coordination development in Wuhan, Central China. Habitat Int. 47, 113–125. doi:10.1016/j.habitatint.2015.01.012
Liu, Y., Wei, X., Li, P., and Li, Q. (2016b). Sensitivity of correlation structure of class- and landscape-level metrics in three diverse regions. Ecol. Indic. 64, 9–19. doi:10.1016/j.ecolind.2015.12.021
Nelson, E., Mendoza, G., Regetz, J., Polasky, S., Tallis, H., Cameron, D., et al. (2009). Modeling multiple ecosystem services, biodiversity conservation, commodity production, and tradeoffs at landscape scales. Front. Ecol. Environ. 7, 4–11. doi:10.1890/080023
Szilassi, P., Czucz, B., Molnar, Z., Mezosi, G., Bata, T., and Szabó, Sz. (2017). The link between landscape pattern and vegetation naturalness on a regional scale. Ecol. Indic. 81, 252–259. doi:10.1016/j.ecolind.2017.06.003
Walz, U., and Stein, C. (2014). Indicators of hemeroby for the monitoring of landscapes in Germany. J. Nat. Conserv. 22, 279–289. doi:10.1016/j.jnc.2014.01.007
Wang, L., and Gao, J. (2014). The spatial coupling relationship between settlements and land-water resources in zhangye irrigation districts. Ecol. Geogr. 2, 21. doi:10.1201/b16699-38
Wiken, E. B., and Ironside, G. (1977). The development of ecological (biophysical) land classification in Canada. Landsc. Plan. 4, 273–275. doi:10.1016/0304-3924(77)90029-6
Willcock, S., Phillips, O. L., Platts, P. J., Swetnam, R. D., Balmford, A., Burgess, N. D., et al. (2016). Land cover change and carbon emissions over 100 years in an African biodiversity hotspot. Glob. Chang. Biol. 22, 2787–2800. doi:10.1111/gcb.13218
Wong, D. W. S. (1999). Several fundamentals in implementing spatial statistics in GIS: using centrographic measures as examples. Ann. GIS 5, 163–174. doi:10.1080/10824009909480525
Wouter, p., Jo, D., and Sigrid, S. (2015). Towards an integration of the ecological space Paradigm and the Capabilities approach. J. Agric. Environ. Ethics 28, 479–496. doi:10.1007/s10806-014-9498-7
Wu, J., Wang, S., Zhang, Y., Zhang, A., and Xia, C. (2019). Urban landscape as a spatial representation of land rent: A quantitative analysis. Comput. Environ. Urban Syst. 74, 62–73. doi:10.1016/j.compenvurbsys.2018.12.004
Zhang, H., Xu, E., and Zhu, H. (2017). Ecological-living-productive land classification system in China. J. Resour. Ecol. 8, 121–128. doi:10.5814/j.issn.1674-764x.2017.02.002
Zhang, Y., Jiang, P., Zhang, H., and Cheng, P. (2018). Study on urban heat island intensity level identification based on an improved restricted Boltzmann machine. Int. J. Environ. Res. Public Health 15, 186. doi:10.3390/ijerph15020186
Zhang, Y., Wang, H., Xie, P., Rao, Y., and He, Q. (2020). Revisiting spatio-temporal changes in global urban expansion of 1995 to 2015. Complexity 2020, 6139158. doi:10.1155/2020/6139158
Zhao, P. (2011). Managing urban growth in a transforming China: Evidence from Beijing. Land Use Policy 28, 96–109. doi:10.1016/j.landusepol.2010.05.004
Zonneveld, I. S. (1990). Scope and concepts of landscape ecology as an emerging science. New York: Springer, 3–20.
Zonneveld, I. S. (1989). The land unit: A fundamental concept in landscape ecology and its applications. Landsc. Ecol. 3, 67–86. doi:10.1007/BF00131171
CenterX center of gravity x
CenterY center of gravity y
XStdDist X-axis standard deviation
YStdDist Y-axis standard deviation
θ Rotation angle
△θ Difference between two elliptical rotation angles
△XStdDist Difference between two XStdDist
△YStdDist Difference between two YStdDis
Keywords: standard deviation ellipse, territorial ecological space, spatial variation, land use, China
Citation: Zhang Y, Jiang P, Cui L, Yang Y, Ma Z, Wang Y and Miao D (2022) Study on the spatial variation of China’s territorial ecological space based on the standard deviation ellipse. Front. Environ. Sci. 10:982734. doi: 10.3389/fenvs.2022.982734
Received: 30 June 2022; Accepted: 21 July 2022;
Published: 23 August 2022.
Edited by:
Qingsong He, Huazhong University of Science and Technology, ChinaReviewed by:
Enxiang Cai, Henan Agricultural University, ChinaCopyright © 2022 Zhang, Jiang, Cui, Yang, Ma, Wang and Miao. This is an open-access article distributed under the terms of the Creative Commons Attribution License (CC BY). The use, distribution or reproduction in other forums is permitted, provided the original author(s) and the copyright owner(s) are credited and that the original publication in this journal is cited, in accordance with accepted academic practice. No use, distribution or reproduction is permitted which does not comply with these terms.
*Correspondence: Ping Jiang, bG9uZ2thbmdrYW5nQHdodS5lZHUuY24=
Disclaimer: All claims expressed in this article are solely those of the authors and do not necessarily represent those of their affiliated organizations, or those of the publisher, the editors and the reviewers. Any product that may be evaluated in this article or claim that may be made by its manufacturer is not guaranteed or endorsed by the publisher.
Research integrity at Frontiers
Learn more about the work of our research integrity team to safeguard the quality of each article we publish.