 Runwei Li
- Department of Civil, Construction and Environmental Engineering, North Carolina State University, Raleigh, NC, United States
In the past two decades, global manufacturing of per- and polyfluoroalkyl substances (PFAS) has shifted from long-chain compounds to short-chain alternatives in response to evidence of the health hazards of long-chain formulations. However, accumulating data indicate that short-chain PFAS also pose health risks and are highly mobile and persistent in the environment. Because short-chain PFAS are relatively new chemicals, comprehensive knowledge needed to predict their environmental fate is lacking. This study evaluated the capacity of machine-learned Bayesian networks (BNs) to predict risks of exposure to short-chain PFAS in a Minnesota region affected by PFAS releases from the 3M Cottage Grove facility. Models were trained using long-term monitoring data provided by the Minnesota Department of Health (n = 12,406), which we coupled to a comprehensive dataset created by curating 88 other variables that describe potential PFAS sources, soil and hydrogeologic characteristics, and land use. Model performance was assessed using the area under the receiver-operating characteristic curve (AUC), a common measure of the accuracy of machine-learned classification algorithms. In addition, exposure risks were visualized spatially by coupling model predictions to a geographic information system. We found that machine-learned BN models had robust predictive performance, with AUCs above 0.96 in cross-validation. Significant risk factors identified by the BNs include distance to the 3M factory, distance to a former landfill, and areal extent of wetlands and developed land. We also found that risks of exposure to and the areal extent of perfluorosulfonic acids were greater than for perfluorocarboxylic acids with the same carbon number. The results suggest that machine-learned BNs could provide a promising screening tool for assessing short-chain PFAS exposure risks in groundwater.
Introduction
Per- and polyfluoroalkyl substances (PFAS) are a large family of anthropogenic chemicals with similar molecular structures consisting of a partially or fully fluorinated carbon chain and a terminal functional group (e.g., carboxylate or sulfonate). PFAS have been widely used in commercial and industrial products ranging from food packaging to waterproof clothing to stain-resistant furnishings. They also have been used in industrial applications, including in firefighting foams and as additives and surfactants in manufacturing processes. Consequently, PFAS have been widely dispersed in the environment (Ahrens, 2011; Goosey and Harrad, 2012; Kirchgeorg et al., 2016; Brusseau et al., 2020). Because of their inert nature, PFAS are highly resistant to abiotic or biotic degradation and, as a result, accumulate in the environment. An increasing number of studies have revealed the linkage between PFAS exposure and a series of health issues such as kidney cancer, decreased immunity to infectious diseases, and fertility problems (Joensen et al., 2009; Steenland et al., 2010; DeWitt et al., 2012).
Due to their ubiquitous distribution, environmental persistence, and adverse health effects, the U.S. and international organizations have issued regulations or health advisories for some of the most commonly used PFAS. In 2006, the U.S. Environmental Protection Agency (EPA) and eight major PFAS manufacturers signed the 2010/2015 PFOA Stewardship Program, aiming to reduce the emissions and product content levels of perfluorooctanoic acid (PFOA) and precursor chemicals (U.S. EPA, 2006). In the European Union, both perfluorooctane sulfonic acid (PFOS) and PFOA are restricted (EU, 2006). Regulations on these traditionally used long-chain PFAS resulted in a global manufacturing shift to short-chain alternatives (Ateia et al., 2019).
Although short-chain PFAS are considered less bioaccumulative than their longer-chain predecessors (Bowman, 2015), they may still pose significant risks to humans and ecosystems (Brendel et al., 2018). Short-chain PFAS tend to be more mobile due to their higher solubility in water and lower adsorption to soil particles. Therefore, they tend to migrate over a longer distance and pose health threats to people in areas far away from contaminated sites (Wang et al., 2015). Vierke et al. conducted a PFAS transport study using saturated sediment column experiments and observed tracer-like breakthrough curves for perfluorobutanoic acid (PFBA), perfluorobutanesulfonic acid (PFBS), perfluorohexanoic acid (PFHxA), and perfluorohexanesulfonic acid (PFHxS). In the same study, transport of long-chain PFAS such as PFOA was much slower under the same experimental conditions, with estimated retardation factors over 20 (Vierke et al., 2014). Previous field studies have found similar differences between transport of short- and long-chain PFAS in unsaturated soil (Washington et al., 2010; Sepulvado et al., 2011). Nonetheless, it is important to note that in addition to carbon chain length, the functional group associated with PFAS species also plays an important role in their transport in the environment. For example, in a bench-scale experiment, McKenzie et al. observed that PFBS (with a four-carbon chain and a sulfonic acid functional group) had a higher retardation factor than PFOA (with an eight-carbon chain and carboxylic acid functional group) (McKenzie et al., 2015). Also contributing to potential risk differences between short- and long-chain PFAS is that higher amounts of short-chain PFAS are usually used in manufacturing to achieve technical performance similar to long-chain compounds (Brendel et al., 2018; Ateia et al., 2019).
Because of their ubiquitous use and high mobility after being released, short-chain PFAS are widely distributed in the environment. At some contaminated sites, concentrations of short-chain PFAS are even higher than those of long-chain homologs, especially in aquatic phases. For example, short-chain PFAS are dominant and reach up to 88.8% of the total PFAS concentration in water samples from the Yellow River in China, while long-chain PFAS prevail in the sediment (Zhao et al., 2016).
Evidence also indicates that short-chain PFAS are as persistent as long-chain compounds. Common processes (e.g., chlorination, sand filtration, and anaerobic digestion) at wastewater treatment plants are not effective in removing short-chain PFAS. Short-chain PFAS have been observed in all process steps in wastewater plants due to their resistance to microbial degradation, limited adsorption to activated sludge, and transformation from longer-chain precursors (Gallen et al., 2018; Houtz et al., 2018; Lorenzo et al., 2019). As a consequence, treatment plant discharges can be a source of pollution in receiving water bodies. In a field investigation of the spatial distribution of organic contaminants in England’s rivers, Wilkinson et al. found that the PFBS concentration in water downstream from wastewater treatment plants was about twice as high as that in upstream water (Wilkinson et al., 2017). Moreover, although the ecological and human toxicities of short-chain PFAS remain largely unknown, previous studies have reported experimental evidence for their toxicity. For example, Butenhoff et al. reported that exposure to PFBA caused increased liver weight and histopathological changes in male rats (Butenhoff et al., 2012). More recently, Feng et al. reported that exposure to PFBS caused developmental abnormalities (e.g., decreased perinatal body weight and delayed eye-opening) in female offspring of exposed pregnant mice (Feng et al., 2017).
Despite the manufacturing shift from long-chain to short-chain PFAS, knowledge about short-chain alternatives is very limited. One relatively recent review found three times as many studies of long-chain PFAS as of short-chain alternatives (Ateia et al., 2019). The absence of comprehensive knowledge poses a major challenge to predicting the environmental fate of these emerging contaminants using traditional mechanistic fate-and-transport models. For example, the lack of understanding of the physicochemical properties of most short-chain PFAS impedes model development, because mechanistic models require parameters describing physicochemical processes (e.g., sorption to soil-water and water-air interfaces, abiotic/biotic transformation from various precursors, and complexation with natural colloids or ligands) controlling contaminant fate (Li et al., 2019; Zeng et al., 2021). Parametrizing these processes requires detailed experiments repeated under different geochemical conditions. Furthermore, simulating real-world scenarios requires an understanding of how these parameters vary in the heterogeneous soil matrix, along with consideration of potential co-transporters (Sima and Jaffé, 2021). A further challenge to mechanistic modeling is the large diversity of molecular structures among thousands of PFAS (Naidu et al., 2020). The complex array of potential PFAS sources is another barrier. Direct and indirect short-chain PFAS sources include (but are not limited to) manufacturing facilities, fire stations, wastewater treatment plants, landfills, land applications of wastewater biosolids and sludge, and irrigation. It is impossible to accurately estimate PFAS mass fluxes from these potential sources without long-term monitoring data (Li et al., 2021; Sharifan et al., 2021).
Bayesian networks (BNs) constructed using machine-learning algorithms provide a potential approach to the abovementioned obstacles to characterizing the risks of exposure to PFAS in groundwater. Instead of relying on a mechanistic description of specific environmental transport processes, BNs can estimate contaminant occurrence by describing conditional dependencies among variables in observational data sets. The estimation of water flow, contaminants’ mass flux from sources, sorption, transformation, and other detailed parameters is not necessary. In recent years, some researchers have started to investigate the application of BNs to predict contaminants’ occurrence in environmental media. Bilal et al. developed a BN-based tool to assess the environmental distribution of engineered nanomaterials (Bilal et al., 2017). Lee et al. proposed a mass-balance integrated BN model to assess the fate of natural estrogen in a swine waste lagoon system (Lee et al., 2014). In our previous work, a BN model was trained to predict the risk of exposure to GenX (a short-chain PFAS) in private well water around the Chemours Fayetteville facility in North Carolina (Roostaei et al., 2021).
In this study, long-term monitoring data for PFAS in the Minneapolis East Metropolitan Area (East Metro) were leveraged to test the capability of machine-learned BNs to predict the occurrence of four different short-chain PFAS in groundwater. We combined these data with data on factors that could potentially influence the occurrence and environmental fate of PFAS (for example, soil and aquifer characteristics, land use and land cover, locations of known and potential PFAS sources, and meteorological conditions) available from public sources. Using this curated data set, we
1) trained BNs to predict the risks of exposure to concentrations above health-based guidelines for four short-chain PFAS: PFBA, PFBS, PFHxA, and PFHxS;
2) assessed the accuracy of the models in predicting exposure risks;
3) identified variables most predictive of exposure risks; and
4) used the trained models to map the spatial distributions of risks.
Our main goal was to test whether this approach could provide accurate predictions of short-chain PFAS in groundwater across a relatively large geographic area based on spatially incomplete prior sampling. We sought to develop further evidence of the generalizability of the modeling approach, even if the specific models may not generalize to other geographic locations. A secondary goal was to gain insights on environmental factors most associated with the occurrence, fate and transport of specific short-chain PFAS in a complex, real-world setting.
Methods
Study area and PFAS concentration data
The Minnesota Pollutant Control Agency (MPCA) and the Minnesota Department of Health (MDH) have continuously monitored PFAS concentrations in groundwater samples in the East Metro area for more than two decades, accumulating more than 12,000 measurements of multiple PFAS (Figure 1). This widespread sampling occurred in response to concerns about PFAS releases from a local 3M factory that produced PFOA from the late 1940s until 2002 and that continues to produce short-chain alternatives, such as PFBS. Other major PFAS sources in the area include four historic dumpsites used by 3M (and others): the Washington County landfill, the Woodbury disposal site, the Oakdale disposal site, and the former Pig’s Eye landfill (Figure 1).
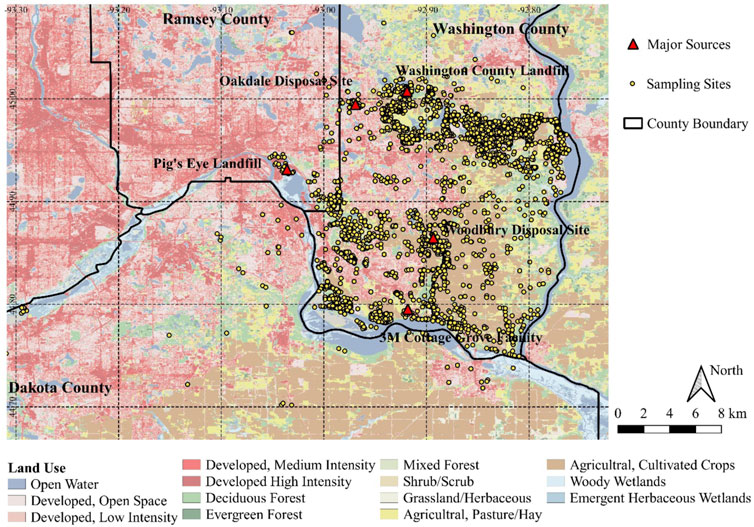
FIGURE 1. Locations of major sources and sampling sites in the study area.
MDH data provided all PFAS data collected between 2001 and 2019. In addition to PFAS concentrations, the monitoring data also included reporting limits, method detection limits, sampling dates, and sampling site geocoordinates. This study focused on four specific short-chain PFAS: PFBA, PFBS, PFHxA, and PFHxS. For each PFAS, an exposure risk threshold was selected according to the health advisory value published by MDH (MDH, 2018; MDH, 2020; MDH, 2021; MDH, 2022), summarized in Table 1. PFAS concentrations were converted to a binary variable according to the risk thresholds. Specifically, PFAS measurements with concentrations greater than or equal to the corresponding threshold were designated as “at risk."
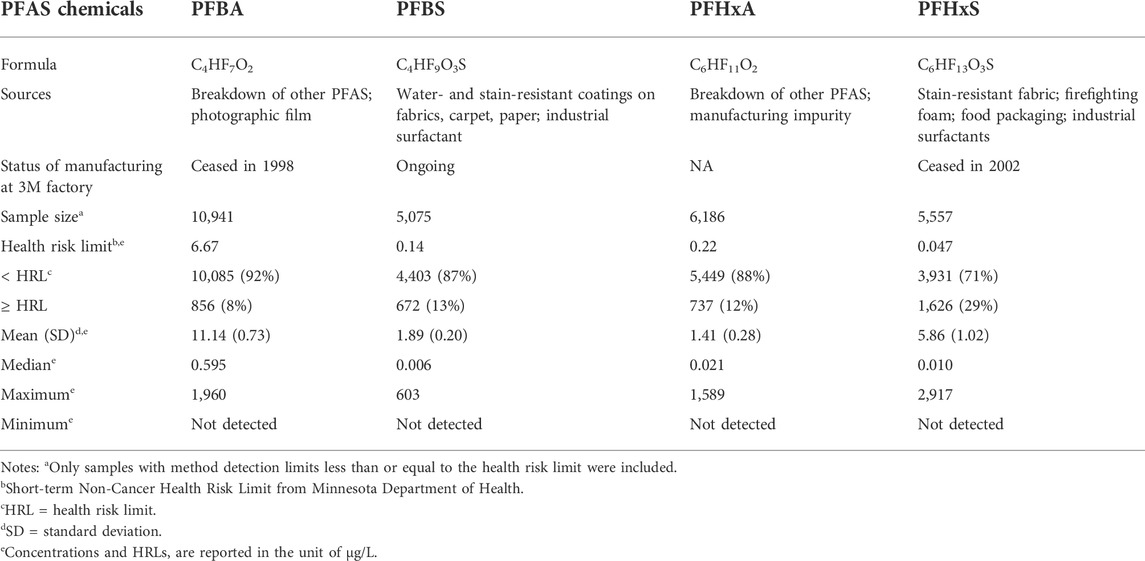
TABLE 1. Four short-chain PFAS investigated in this study.
PFAS measurements included in this data set were collected by multiple agencies, including MDH, MPCA, 3M, and their contractors, each of which might apply different procedures in sampling, chemical analysis (including PFAS species measured), and reporting. The differences among data sources led to a varying level of data accuracy, which might weaken the reliability of trained models. In addition, the improvement of PFAS detection methods over time further contributes to this inconsistency. Therefore, the PFAS data were screened to ensure satisfactory data accuracy. Briefly, a screening threshold was selected for each PFAS: PFAS measurements with a method detection limit above the threshold were discarded from the raw data. In this study, the screening threshold was set to be equal to the corresponding health risk limit shown in Table 1 to guarantee a confident binary variable for PFAS risk screening.
Supplementary Tables S2–S5 show summary statistics for the full set of reported measurements for each compound and for the screened data sets used for model training. For PFBA, all variables in the screened and full data sets have similar distributions, except for the year of sample collection (mean = 2013 for the screened data set versus 2012 for the full data set). However, for the other three PFAS compounds, the full and screened data sets differ significantly along many of the variables. For these three compounds, screened data sets have higher mean concentrations of contaminants than the full data sets (though the difference is not statistically significant for PFHxA). This latter finding reflects the lowering of detection limits over time (and therefore the inabilisty of samples collected in earlier years to adequately detect samples above the health risk limit). Supplementary Figure S1 shows histograms of the distribution of samples by year for the full data set (including measurements for any PFAS) and for each data set used in model training. As shown, observations were sparse before the year 2006. However, when training the models, the variable “year” was discretized into multi-year bins to ensure adequate training data for each time period (see Supplementary Tables S3–S6 for variable discretizations).
Data curation
A comprehensive dataset was created by compiling data on 88 variables that could be predictors of PFAS occurrence. Potential variables were identified based on a review of previous studies of factors influencing the occurrence of PFAS in groundwater. These variables can be divided into three categories, describing PFAS contamination sources, soil or hydrogeologic characteristics, and land use. PFAS sources include the 3M factory and the four waste disposal sites shown in Figure 1, wastewater treatment plants, wastewater discharge sites, fire stations, airports, septic systems, and sites where biosolids (such as from wastewater treatment plants) are disposed of on land. Supplementary Table S1 describes all 88 variables and their sources. These variables were linked to the PFAS data using the geocoordinates of sampling sites in a geographic information system, QGIS version 3.6.3 (QGIS Development Team, 2016).
Overview of bayesian network modeling assumptions and approach
Bayesian networks were pioneered in the 1980s in the artificial intelligence and computer science fields as means to encode expert knowledge and compress large data sets, the latter by providing an efficient means of capturing statistical relationships among variables (Frey et al., 1998; Pearl, 1998). Since then, with the rapid growth in computing power, BNs have been developed as prediction and decision aids in a wide variety of applications, ranging from medical diagnostics (such as predicting the probability of a patient having a disease from a set of symptoms) to credit risk scoring (Leong, 2016; Arora et al., 2019).
Formally, a Bayesian network is a graphical representation of relationships among variables. A BN model has two components:
1) A directed acyclic graph in which variables are represented as nodes and relationships among them as directed edges (one-way arrows), and
2) A set of conditional probability distributions for each included variable representing its statistical dependencies with other variables in the network.
If a given BN contains a directed edge from node (variable) A to node B, then A is called a “parent” of B, and B is a “child” of A. The only assumption required of a BN is that each variable is independent of all of its predecessors in the graph, conditional on its parents. With this assumption (known as the Markov condition), the joint probability distribution of all the variables can be represented as
where
BNs impose no requirements on the distributional form of the included variables (e.g., variables can be skewed, multi-modal, or have other non-normal distributions). Likewise, they impose no restrictions on the functional form of the relationships among variables; these relationships can be linear or nonlinear, and they need not even be monotonic. The only requirement is the Markov condition. Major advantages of Bayesian networks over traditional statistical modeling methods include their ability to handle nonlinear relationships among variables (since they do not require a priori assumptions about the nature of these relationships) and to include multiple, potentially highly correlated predictor variables in one model (Koller and Friedman, 2009).
Data pre-processing
Separate BN models were trained for each short-chain PFAS. In each case, 87 potential predictor variables (except ‘year’) were evaluated for their potential influence on occurrence of the particular PFAS. BaysiaLab version 10.0 was used to develop all BN models (Conrady and Jouffe, 2015). The training process was adapted from our previous work (Roostaei et al., 2021). First, continuous variables were discretized into five bins using BayesiaLab’s built-in R2-GenOpt algorithm. Then, curated variables were partitioned into closely-related clusters using the ‘variable clustering’ and ‘multiple clustering’ functions in the BaysiaLab. Each cluster was represented by a created latent variable. Clusters for which the latent variable was not significantly correlated (p > 0.05) to the occurrence of the specific PFAS above its health risk limit were removed from subsequent steps. Retained variables were re-discretized to better describe their relationships with the exposure risk using the tree algorithm. The variable ‘year’ was not involved in the pre-processing because it contained information from different times, while the other variables were created at a single time point. The variable ‘year’ was directly discretized with regard to the target variable using the tree algorithm.
Model training
Then, supervised learning was conducted. The minimum description length (MDL) score was used to evaluate alternative BN structures, and the structures with the lowest scores were selected. The MDL score balances model accuracy with model complexity, penalizing more complex models to avoid over-fitting. It represents the number of bits needed to encode a given network structure plus the number of bits needed to encode the data set given the model structure (for details, see Friedman et al., 1997). BayesiaLab’s supervised learning algorithms identify the network structure with the lowest MDL score given specified structural constraints (such as the number of allowable parents per network node). Multiple constraints on model structure were compared, and final models were selected by comparing the MDL scores of the different structural forms, selecting the form with the lowest score. The structure types compared were naive Bayes, augmented naive Bayes (allowing up to three parents per network node), tree augmented naive Bayes, sons and spouses, Markov blanket, augmented Markov blanket, and tree augmented Markov blanket. For all four contaminants, augmented naïve Bayes models had lower MDL scores than the other model forms and were therefore selected as the final models (Supplementary Table S2).
Model evaluation
The performance of the final BNs was also evaluated using receiver operating characteristic curves (ROCs) and areas under these curves (AUCs). An AUC greater than 0.8 indicates good classification performance (Safari et al., 2016). After model training, selected BNs were further tested in fivefold cross-validation. To better understand modeling performance, the validation was repeated by 20 times with randomly generated seeds. Based on the validation results, mean and 95% confidence intervals for each model’s AUC were estimated.
Exposure risk maps
Predictions from the trained BNs were used to create maps of exposure risk. Specifically, the study area was divided into 688 grids with a side length of 790 m. An evidence dataset (only containing model-selected variables) was created for centroids of all grids. Then, the trained BNs were applied to predict the probability of occurrence of each short-chain PFAS above its corresponding health advisory level. Each prediction was repeated 10,000 times in the BayesiaLab software to obtain confidence intervals. The estimated mean, lower, and upper limits of 95 percent confidence interval were curated with the geocoordinates of corresponding grid centroid for subsequent spatial visualization using QGIS. A minor difference was found between the sampling site distribution of four short-chain PFAS. In order to compare the exposure risk of different short-chain PFAS, parts of the study area were discarded since the observation could not well represent the exposure risk of all studied PFAS. For example, the study area located in Dakota County had a low sampling site density, and only PFBA was detected in this area. The observations discarded in the spatial visualization were less than 2% of the sampling size.
Results
Short-chain PFAS occurrence
Among the four short-chain PFAS included in this study, PFHxS was most frequently detected above its health risk limit (0.047 μg/L), with 29% of observations at or above the limit (Table 1). This reflects in part that PFHxS has the lowest health risk limit among the four compounds. The highest mean (11.1 μg/L) and median (0.595 μg/L) concentrations were for PFBA, for which 8% of observations exceeded the health risk limit (6.67 μg/L). For all these compounds, mean values were much larger than medians (Table 1), suggesting extremely skewed distributions with most observations clustered at the low end. The skewness of the distributions is also reflected in the very high observed maximum concentrations; maxima were 3,000 to nearly 300,000 times as high as medians.
BN model structures
The directed acyclic graphs (DAGs) of trained BN models are presented in Figure 2. Within each DAG, the central node was the focus of the study and set as the target node in supervised learning processing. The explanatory variables around the target nodes were selected by the supervised learning algorithms as part of the optimal (lowest MDL score) model. Arcs connecting these explanatory variables show interactions among them.
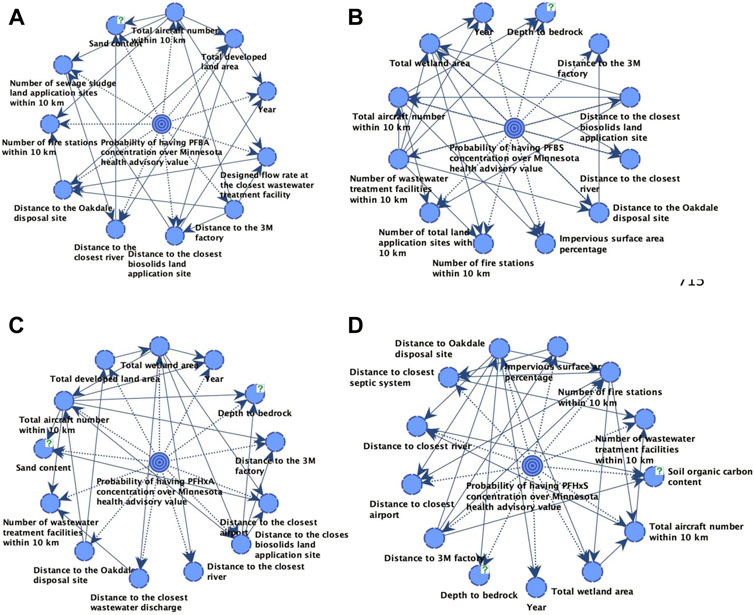
FIGURE 2. The directed acyclic graphs of (A) PFBA, (B) PFBS, (C) PFHxA, and (D) PFHxS.
The variables with significant predictive capability varied with the individual compound, with each final model containing 11 to 13 predictors. Most selected explanatory variables related to PFAS sources in the study area (12 out of 20 variables selected by at least one BN), indicating that contamination source (in terms of number and relative location) plays a more significant role than soil and hydrogeologic characteristics or land-use information. Among the 20 variables selected by at least one BN, four were selected in all BNs: distance to the 3M factory, distance to the former Oakdale disposal site, the total number of aircraft within 10 km, and distance to the nearest large river (Table 2). Nine variables were selected by multiple BNs, although they were not included in all models.
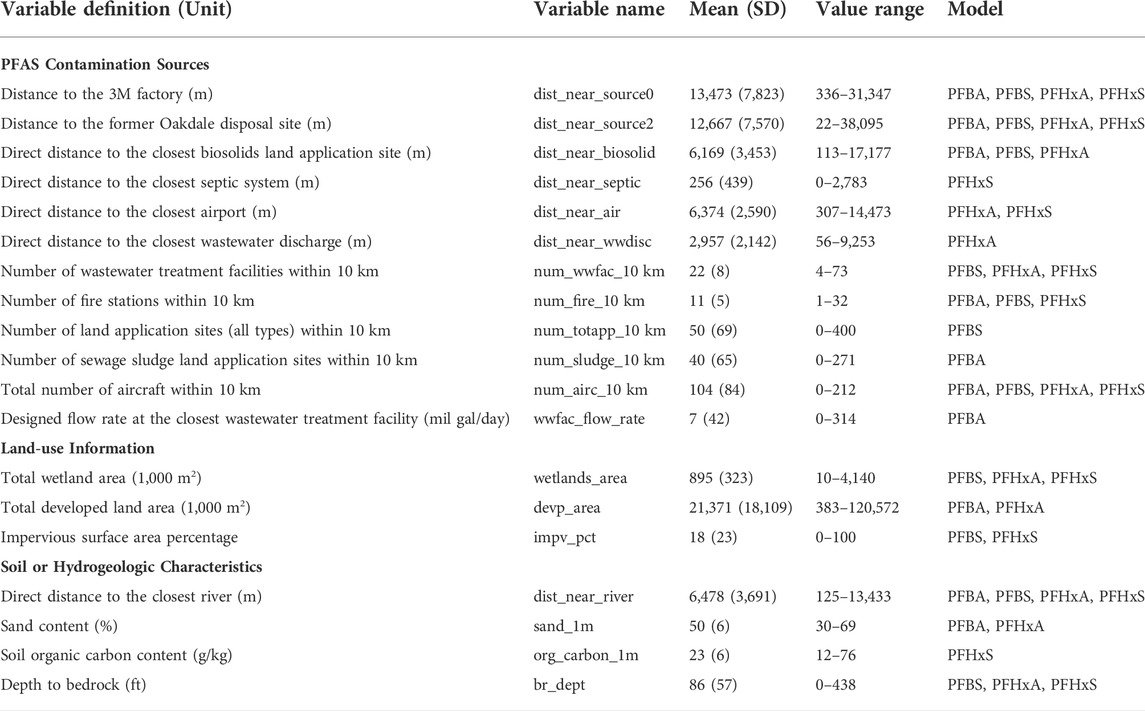
TABLE 2. Variables selected by automated algorithms in at least one of the four Bayesian networks.
It is important to note that the arcs in these networks represent correlations among variables and do not necessarily indicate causal associations. For example, the PFBA model includes an arc from “total aircraft number within 10 km” to “sand content.” This link does not imply that the presence of an airport alters the soil sand content. Instead, these relationships are probabilistic in nature and may be driven by other, unobserved spatial processes influencing each variable independently.
Model accuracy
All models were highly accurate when trained with the full data set, with AUCs above 0.97 (Figure 3). The BN for PFHxA had the highest AUC (0.99), followed by the BNs for PFBA, PFBS, and PFHxS. The high AUCs were maintained in multiple iterations of cross-validation, in which models were trained on 80% of the data set, and their accuracy was tested on the remaining samples. For each model, AUCs in cross-validation (Figure 4) were very close to those achieved with the full data set. The largest decrease was observed for the PFHxS, for which the mean AUC in validation was 0.004 less than the AUC in training. The AUC decrease for the other three short-chain PFAS was even smaller. Therefore, the trained BNs were considered not overfitted. In addition, all 95% confidence intervals were narrow in the validation, suggesting that trained BNs could provide a reliable prediction performance with low variation (Kelley, 2007).
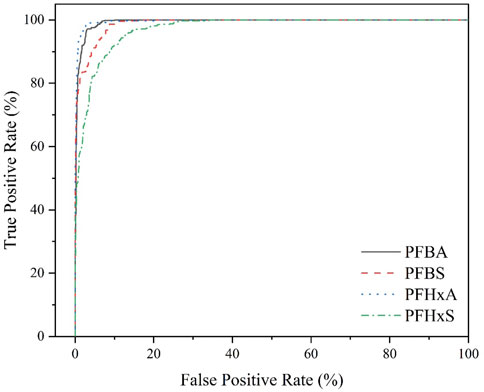
FIGURE 3. Receiver operating characteristic curves for short-chain PFAS.
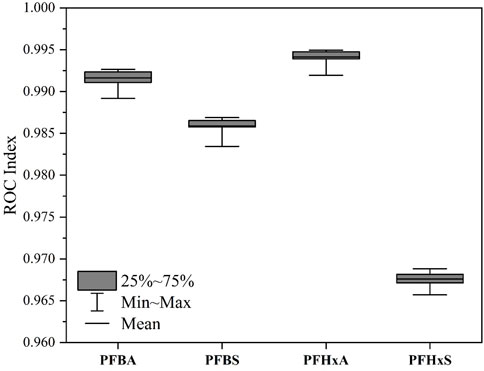
FIGURE 4. 95% confidence intervals for area under the receiver operating characteristic curve of each model in 5-fold cross-validation. Note: validation was repeated 20 times.
We also conducted a sensitivity analysis to assess potential spatial variability in model performance, using PFBA as an example. The study area was divided into four quadrants, and model accuracy in predicting PFBA occurrence above the health-based threshold was assessed in each. High AUCs (close to 0.99 or above) were observed in each (Supplementary Figure S2).
Notably, differences in sample size had a very limited impact on the BNs’ performance. For example, although there were nearly twice as many observations for PFBA as for PFHxS, the difference between their BNs’ AUCs was negligible, suggesting sample sizes were enough to predict exposure risk in this study. On the other hand, the measurements for PFBA had the lowest prior probability of exposure above the health risk limit, which led to a comparable number of observations of concentrations exceeding the selected exposure threshold as was the case for the other three contaminants.
Another finding of potential interest is that the BNs for the two perfluoroalkyl carboxylic acids (PFCAs) had slightly higher AUCs than the BNs for the perfluorosulfonic acid (PFSAs) with the same carbon number (Figure 4). For PFBA, the lower 95% of the confidence interval for the AUC was higher than the upper 95% confidence interval of the AUC for a PFBS. Similarly, the confidence interval for the PFHxA model’s AUC was above that of the PFHxS model.
Comparisons among risk factors
The importance of each risk factor included in at least one model was compared by computing each variable’s relative mutual information with the probability of PFAS occurrence above the health risk level (Figure 5). Among the three variable categories, variables describing PFAS sources had the most influence on PFAS exposure risks. However, the contribution of different contamination sources was PFAS species dependent. For the two PFCAs, the distance to the 3M factory had the largest relative mutual information with the probability of exposure above the health risk limit (33.5% for PFBA and 42.2% for PFHxA). Distances to other potential PFAS sources were more important for the two PFSAs. For PFBS, the most influential risk factor was the distance to the nearest biosolids land application site (“dist near_biosolid,” relative mutual information = 39.3%). For PFHxS, distance to the nearest septic system (“dist_near_septic,” relative mutual information = 29.0%) was most important. Other sources also were relatively strongly associated with the occurrence of one or more of these PFAS. These included the direct distance to the nearest airport, distance to the nearest wastewater discharge, the number of wastewater treatment plants with 10 km, the number of fire stations within 10 km, the number of sites where wastewater sludge is disposed of on land, and the number of aircraft at the nearest airport. Another interesting finding was that the year in which the sample was collected was more important in predicting the occurrence of the two short-chain PFSAs than in predicting PFCA occurrence, with relative mutual information above 27% for both PFBS and PFHxS, compared to less than 10% for PFBA and PFHxA.
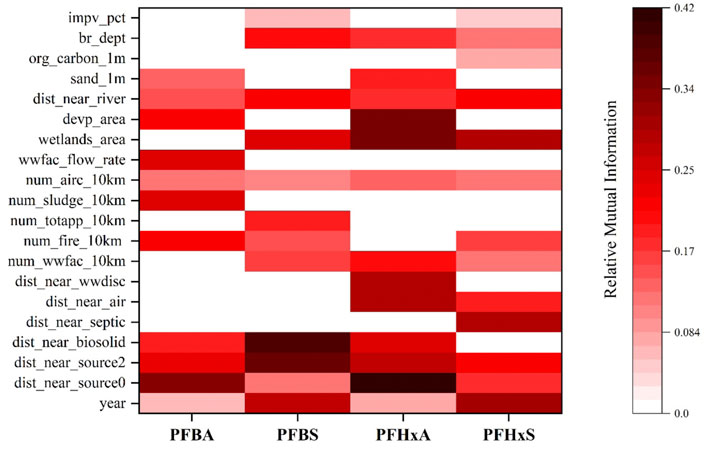
FIGURE 5. Heat map for relative mutual information of risk factors. Note: Variable definitions are provided in Table 2.
A striking conclusion from Figure 5 is that although the curated data set included a wide range of soil characteristics (such as soil type, pH, bulk density, and organic carbon content), these characteristics had limited to no predictive power. Instead, the occurrence of these short-chain PFAS was driven almost entirely by PFAS sources. Two land-use variables (the areal extents of wetlands and developed area) were important for some of the PFAS. In particular, wetland area was the second-most important variable for predicting the occurrence of PFHxA and PFHxS.
Exposure risk maps
Figure 6 shows the spatial distribution of mean exposure risks for each short-chain PFAS as predicted by the trained BNs (see Supplementary Figures S3, S4 for maps of 95% confidence intervals for these predictions). The maps highlight that the 3M factory and historical dump sites are the most important contributors to short-chain PFAS contamination in the East Metro area. Groundwater in the areas surrounding these major sources tended to have a higher probability of being contaminated with short-chain PFAS above health-risk limits. Nonetheless, some contamination hotspots were distant from the major PFAS sources. For example, the northeastern side of the study area had higher risks for PFBS and PFHxA but was more than 5 km away from the closest major source (the Washington County Landfill). Similar contamination hotspots were also identified in a few other regions of the study area. Other potential PFAS sources (e.g., fire stations, airports, wastewater discharge sites and wastewater treatment plants) might be responsible for these hotspots.
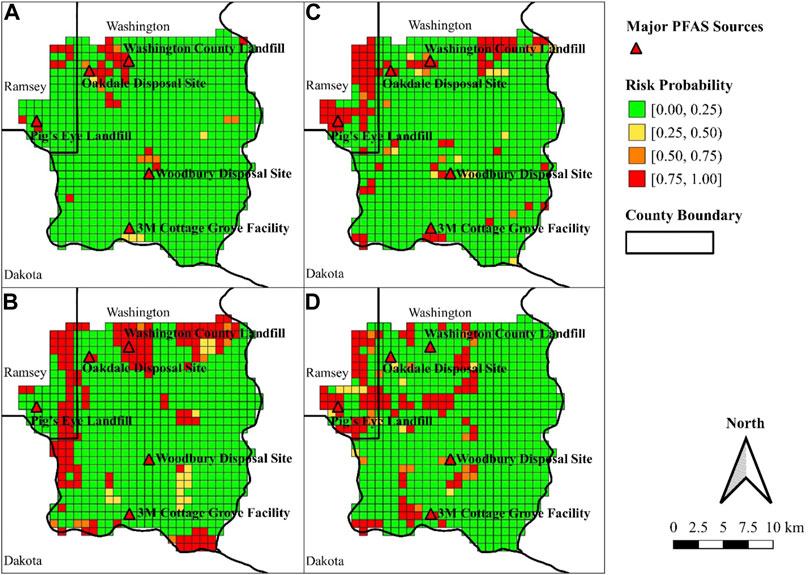
FIGURE 6. Predicted exposure risk maps for (A) PFBA, (B) PFBS, (C) PFHxA, and (D) PFHxS (mean predictions at center of each grid cell from trained Bayesian networks).
Compared with PFCAs having the same carbon number, PFSAs had a broader impact on groundwater in the study area. In the risk prediction maps, risks of exposure to PFBA and PFHxA above health risk limits were above 50% in 37 and 72 of mapped grids, respectively. In the case of PFSAs, there were 79 and 100 grids in the study area with predicted risks of more than 50% for PFBS and PFHxS exposure above heath advisory levels. Slightly different results might be obtained by shifting risk thresholds but would not change the general trend. It was also noticed that the prediction confidence was PFAS species dependent. For example, the western side of the study area had a lower uncertainty as compared to other regions for PFBA, PFHxA, and PFHxS (Supplementary Figures S1, S2). The smaller number and simpler profile of PFAS sources in this rural area might contribute to a more reliable prediction. However, PFBS risk prediction had a larger uncertainty in the same region, especially in the southeastern corner of the study area (Supplementary Figures S1B, S2B).
Discussion
The trained BNs in this study predicted the risks of exposure to selected short-chain PFAS with robust performance, with AUCs above 0.96 in cross-validation. These models had better or comparable prediction performance than in the limited number of previous studies employing machine learning methods to preduct PFAS occurrence. Hu et al. evaluated two different machine learning methods (random forests and logistic regression) to predict PFAS in 2,300 private wells in New Hampshire. The trained random forest models had AUCs ranging from 0.78 to 0.86 for short-chain PFCAs (Hu et al., 2021). George and Dixit trained linear regression and random forest models based on a monitoring database for California groundwater. Their study reported a random forest classifier that successfully discerned total PFAS concentrations over 70 ppt with an AUC of 0.90 (George and Dixit, 2021). In another recent study, McMahon et al. trained boosted regression trees for predicting whether one or more of 24 PFAS was above the detection limit in 254 groundwater samples, which was the case for 54% of the samples; the AUC for the complete data set was 0.97 but decreased to 0.90 in cross-validation (McMahon et al., 2022). The robust performance of the classification models in our study might result from the much larger sample size. In our study, the long-term monitoring program in Minnesota guaranteed more than 5,000 observations for all selected short-chain PFAS (Table 1). This study also had other potential advantages compared to regression trees. First, the graphical structure of BNs provides a transparent view to assess the dependencies among involved variables. In addition, the large sample size allowed model development to target the probability of exceeding health advisory values of each short-chain PFAS rather than that of PFAS detection, providing more useful information for environmental and public health decision-making.
In the training of BN models, 20 explanatory variables in the curated dataset were identified as significant predictors for at least one of the four selected short-chain PFAS. Most predictors (12 of 20) described PFAS sources within the study area. Among the remaining 7 predictors, 4 pertained to soil or hydrogeologic characteristics, and 3 described land-use information. According to the comparison of relative mutual information (Figure 5) and the spatial mapping of the BNs’ predictions (Figure 6), the major PFAS sources have the most significant impacts on exposure risks in groundwater. The distances from a sampling site to the 3M factory and the former Oakdale disposal site were selected as influential predictors for all short-chain PFAS. In one of our previous applications of BNs, we trained a model to predict the occurrence of GenX (a short-chain PFAS) in a three-county area of North Carolina around a Chemours facility (Roostaei et al., 2021). Similar to in this study, the distance to the chemical factory was also identified as one of the most significant predictors, with the probability of exceeding the GenX health risk threshold increasing from 6.2% to 35% as the distance from the chemical factory decreased from beyond 7.0 km to less than 3.6 km. In another study of PFAS contamination around the same Chemours facility, it was found that some of the most abundant short-chain PFAS were detected in more than 98% of groundwater samples collected within a 5 km radius around the facility (Pétré et al., 2021). Like our study, other studies also have documented the migration of PFAS from current and decommissioned landfills into groundwater (Kim et al., 2015; Lang et al., 2017; Hepburn et al., 2019; Propp et al., 2021).
In addition to PFAS sources, three land-use characteristics (wetlands area, developed area, and impervious surfaces) were important predictors of the occurrence of some of the PFAS. The wetland area could be considered a risk factor for PFAS contamination in groundwater since a larger wetland area would increase the possibility of PFAS migration from potential sources. Previous studies reported relatively high concentrations of common short-chain PFAS in wetland water samples, especially in wetlands near point sources such as wastewater treatment plants (Dalahmeh et al., 2018; Sharp et al., 2021). The other land-use characteristics important in this study were the developed area and amount of impervious surface around sampling sites. According to the mapped BN predictions (Figure 6), the northwestern side of the study area had higher exposure risks than other regions (except hotspots near major sources). Most of this area is located in or close to the Minneapolis metropolitan area, which is highly developed and has numerous potential PFAS sources, including fire stations, local airports, and wastewater treatment facilities. In contrast, the rest of the study area is more rural, especially in Washington County. McMahon et al. investigated the relationship between land use and PFAS occurrence in groundwater and reported that sampling sites having PFAS detections tended to have a significantly larger percentage of urban land within 500 m than sites with no detections (McMahon et al., 2022).
Although the BNs trained in this study were accurate classifiers of risk, several limitations should be noted. First, there are an infinite number of potential BNs to represent the data set used in this research, due to the infinite potential options for discretizing the continuous variables in the model, and current algorithms do not guarantee an optimal combination of discretization and model structures. However, given a specific set of discretized variables, it has been proven that the network with the lowest minimum description length score (the scoring method used to select among possible networks in this research) is asymptotically optimal, given constraints on the allowable number of parents for the independent variables in the network (Friedman et al., 1997). A second limitation is that the BNs were trained to predict the probability of exceeding the short-chain PFAS health advisories, not absolute concentrations. Nonetheless, this approach is useful for screening because it allows direct comparisons with available health-based standards. It is possible to build BNs to represent continuous outcomes; such BNs could be explored in the future. In addition, the density of sampling sites varied across the study area. For example, more samples were collected near known PFAS sources. Having additional observations from locations more distant from known sources could challenge the current model outputs. Moreover, water quality parameters other than PFAS concentrations were not available. Previous studies have indicated that chemical parameters such as pH and ionic strength affect PFAS migration (Lyu and Brusseau, 2020; Li et al., 2021). The presence of co-transporters would also affect the fate and transport of PFAS (Sima and Jaffé, 2021). An additional limitation is that depth of sampling well was not available in our dataset. Like other aquatic contaminants, PFAS migration would lead to a site-specific vertical concentration pattern (Weber et al., 2017). Generally, shallower wells would have a higher exposure risk (Roostaei et al., 2021). Including well depth may further strengthen model performance and allow for three dimensional visualization of risks. Also lacking from the data set was information about wind direction at each sampling location, which might be helpful for explaining patterns of dispersion from air deposition of PFAS contaminants released from the 3M facility (Roostaei et al., 2021). In addition, the models may fail to account for edge effects—the occurrence of PFAS sources beyond the study area boundaries. Despite these limitations, the trained models were highly accurate, robust classifiers of risk. The available data contained patterns useful for discriminating locations at risk from PFAS, even though the observed relationships may not directly represent mechanistic processes.
Conclusion
In this study, BNs were trained to assess the risks of exposure to four short-chain PFAS (PFBA, PFBS, PFHxA, and PFHxS) in the East Metro area around Minneapolis, Minnesota. Trained BNs were able to provide highly accurate predictions for whether a specific short-chain PFAS concentration exceeded corresponding health advisory values in groundwater, evidenced by the robust performance in cross-validation with AUCs above 0.96. Among 19 identified risk factors, proximity to the 3M factory and the former Oakdale disposal site had relatively high impacts on the exposure risks of all studied short-chain PFAS. Land-uses (such as wetlands and developed areas) also played important roles in predicting risks. In addition, the model prediction outputs were used to generate exposure risk maps for the study area. Mapping of risk predictions illustrated that risks from PFSAs were distributed more widely across space compared to PFCAs with the same carbon number.
This study indicates the potential for BNs to serve as screening tools to identify areas where groundwater used for drinking water may be at risk from short-chain PFAS above health-based guidelines. While research to characterize partitioning behavior of PFAS is advancing (Brusseau et al., 2019), information to understand this behavior for the thousands of PFAS varieties circulating in the environment under real-world conditions is unlikely to be available in the near future. Complicating this task is evidence that partitioning behavior cannot be predicted from bulk soil properties (Barzen-Hanson et al., 2017). BNs could be used to prioritize geographic areas for more detailed investigation, including additional groundwater sampling and the development of mechanistic fate-and-transport models.
Data availability statement
The data analyzed in this study is subject to the following licenses/restrictions: The PFAS concentration data were used in agreement with the Minnesota Department of Health. Requests to access these datasets should be directed to Ginny Yingling, virginia.yingling@state.mn.us.
Author contributions
RL performed the machine-learning and GIS analysis. RL wrote the first draft of the manuscript. JM conceptualized the study and secured funding. All authors contributed to the analysis plan, edited the manuscript draft, and approved the submitted version.
Funding
This work was supported by the United States Environmental Protection Agency (USEPA) under EPA grant number R840081.
Acknowledgments
The authors thank Ginny Yingling, from the Minnesota Department of Health, for providing PFAS monitoring data. The authors thank Dr. Carl Stenoien from the Minnesota Pollutant Control Agency, for providing data for land applications in the study area. The authors also thank Emily Gable, Katie Dowlding, and Tyler Dale, for providing data for septic systems in the study area.
Conflict of interest
The authors declare that the research was conducted in the absence of any commercial or financial relationships that could be construed as a potential conflict of interest.
Publisher’s note
All claims expressed in this article are solely those of the authors and do not necessarily represent those of their affiliated organizations, or those of the publisher, the editors and the reviewers. Any product that may be evaluated in this article, or claim that may be made by its manufacturer, is not guaranteed or endorsed by the publisher.
Supplementary material
The Supplementary Material for this article can be found online at: https://www.frontiersin.org/articles/10.3389/fenvs.2022.958784/full#supplementary-material
References
Ahrens, L. (2011). Polyfluoroalkyl compounds in the aquatic environment: A review of their occurrence and fate. J. Environ. Monit. 13 (1), 20–31. doi:10.1039/c0em00373e
Arora, P., Boyne, D., Slater, J. J., Gupta, A., Brenner, D. R., and Druzdzel, M. J. (2019). Bayesian networks for risk prediction using real-world data: A tool for precision medicine. Value Health 22 (4), 439–445. doi:10.1016/j.jval.2019.01.006
Ateia, M., Maroli, A., Tharayil, N., and Karanfil, T. (2019). The overlooked short-and ultrashort-chain poly-and perfluorinated substances: A review. Chemosphere 220, 866–882. doi:10.1016/j.chemosphere.2018.12.186
Barzen-Hanson, K. A., Davis, S. E., Kleber, M., and Field, J. A. (2017). Sorption of fluorotelomer sulfonates, fluorotelomer sulfonamido betaines, and a fluorotelomer sulfonamido amine in national foam aqueous film-forming foam to soil. Environ. Sci. Technol. 51 (21), 12394–12404. doi:10.1021/acs.est.7b03452
Bilal, M., Liu, H., Liu, R., and Cohen, Y. (2017). Bayesian network as a support tool for rapid query of the environmental multimedia distribution of nanomaterials. Nanoscale 9 (12), 4162–4174. doi:10.1039/c6nr08583k
Bowman, J. S. (2015). Fluorotechnology is critical to modern life: The FluoroCouncil counterpoint to the madrid statement. Environ. Health Perspect. 123 (5), A112–A113. doi:10.1289/ehp.1509910
Brendel, S., Fetter, É., Staude, C., Vierke, L., and Biegel-Engler, A. (2018). Short-chain perfluoroalkyl acids: Environmental concerns and a regulatory strategy under REACH. Environ. Sci. Eur. 30 (1), 9–11. doi:10.1186/s12302-018-0134-4
Brusseau, M. L., Anderson, R. H., and Guo, B. (2020). PFAS concentrations in soils: Background levels versus contaminated sites. Sci. Total Environ. 740, 140017. doi:10.1016/j.scitotenv.2020.140017
Brusseau, M. L., Yan, N., Van Glubt, S., Wang, Y., Chen, W., Lyu, Y., et al. (2019). Comprehensive retention model for PFAS transport in subsurface systems. Water Res. 148, 41–50. doi:10.1016/j.watres.2018.10.035
Butenhoff, J. L., Bjork, J. A., Chang, S. C., Ehresman, D. J., Parker, G. A., Das, K., et al. (2012). Toxicological evaluation of ammonium perfluorobutyrate in rats: Twenty-eight-day and ninety-day oral gavage studies. Reprod. Toxicol. 33 (4), 513–530. doi:10.1016/j.reprotox.2011.08.004
Conrady, S., and Jouffe, L. (2015). Bayesian networks and BayesiaLab: A practical introduction for researchers (vol. 9). Franklin: Bayesia USA.
Dalahmeh, S., Tirgani, S., Komakech, A. J., Niwagaba, C. B., and Ahrens, L. (2018). Per-and polyfluoroalkyl substances (PFASs) in water, soil and plants in wetlands and agricultural areas in Kampala, Uganda. Sci. Total Environ. 631, 660–667. doi:10.1016/j.scitotenv.2018.03.024
DeWitt, J. C., Peden-Adams, M. M., Keller, J. M., and Germolec, D. R. (2012). Immunotoxicity of perfluorinated compounds: Recent developments. Toxicol. Pathol. 40 (2), 300–311. doi:10.1177/0192623311428473
EU (2006). Regulation EC No. 1907/2006 of the European parliament and of the council. Luxembourg: Official Journal of the European Union, 278.
Feng, X., Cao, X., Zhao, S., Wang, X., Hua, X., Chen, L., et al. (2017). Exposure of pregnant mice to perfluorobutanesulfonate causes hypothyroxinemia and developmental abnormalities in female offspring. Toxicol. Sci. 155 (2), 409–419. doi:10.1093/toxsci/kfw219
Frey, B. J., Brendan, J. F., and Frey, B. J. (1998). Graphical models for machine learning and digital communication. Cambridge, Massachusetts, United States: MIT press.
Friedman, N., Geiger, D., and Goldszmidt, M. (1997). Bayesian network classifiers. Mach. Learn. 29 (2), 131–163. doi:10.1023/a:1007465528199
Gallen, C., Eaglesham, G., Drage, D., Nguyen, T. H., and Mueller, J. F. (2018). A mass estimate of perfluoroalkyl substance (PFAS) release from Australian wastewater treatment plants. Chemosphere 208, 975–983. doi:10.1016/j.chemosphere.2018.06.024
George, S., and Dixit, A. (2021). A machine learning approach for prioritizing groundwater testing for per-and polyfluoroalkyl substances (PFAS). J. Environ. Manag. 295, 113359. doi:10.1016/j.jenvman.2021.113359
Goosey, E., and Harrad, S. (2012). Perfluoroalkyl substances in UK indoor and outdoor air: Spatial and seasonal variation, and implications for human exposure. Environ. Int. 45, 86–90. doi:10.1016/j.envint.2012.04.007
Hepburn, E., Madden, C., Szabo, D., Coggan, T. L., Clarke, B., and Currell, M. (2019). Contamination of groundwater with per-and polyfluoroalkyl substances (PFAS) from legacy landfills in an urban re-development precinct. Environ. Pollut. 248, 101–113. doi:10.1016/j.envpol.2019.02.018
Houtz, E., Wang, M., and Park, J. S. (2018). Identification and fate of aqueous film forming foam derived per-and polyfluoroalkyl substances in a wastewater treatment plant. Environ. Sci. Technol. 52 (22), 13212–13221. doi:10.1021/acs.est.8b04028
Hu, X. C., Ge, B., Ruyle, B. J., Sun, J., and Sunderland, E. M. (2021). A statistical approach for identifying private wells susceptible to perfluoroalkyl substances (PFAS) contamination. Environ. Sci. Technol. Lett. 8 (7), 596–602. doi:10.1021/acs.estlett.1c00264
Joensen, U. N., Bossi, R., Leffers, H., Jensen, A. A., Skakkebæk, N. E., and Jørgensen, N. (2009). Do perfluoroalkyl compounds impair human semen quality? Environ. health Perspect. 117 (6), 923–927. doi:10.1289/ehp.0800517
Kelley, K. (2007). Sample size planning for the coefficient of variation from the accuracy in parameter estimation approach. Behav. Res. Methods 39 (4), 755–766. doi:10.3758/bf03192966
Kim, M., Li, L. Y., Grace, J. R., Benskin, J. P., and Ikonomou, M. G. (2015). Compositional effects on leaching of stain-guarded (perfluoroalkyl and polyfluoroalkyl substance-treated) carpet in landfill leachate. Environ. Sci. Technol. 49 (11), 6564–6573. doi:10.1021/es505333y
Kirchgeorg, T., Dreyer, A., Gabrielli, P., Gabrieli, J., Thompson, L. G., Barbante, C., et al. (2016). Seasonal accumulation of persistent organic pollutants on a high altitude glacier in the Eastern Alps. Environ. Pollut. 218, 804–812. doi:10.1016/j.envpol.2016.08.004
Koller, D., and Friedman, N. (2009). Probabilistic graphical models: Principles and techniques. Cambridge, Massachusetts, United States: MIT press.
Lang, J. R., Allred, B. M., Field, J. A., Levis, J. W., and Barlaz, M. A. (2017). National estimate of per-and polyfluoroalkyl substance (PFAS) release to US municipal landfill leachate. Environ. Sci. Technol. 51 (4), 2197–2205. doi:10.1021/acs.est.6b05005
Lee, B., Kullman, S. W., Yost, E., Meyer, M. T., Worley-Davis, L., Williams, C. M., et al. (2014). A Bayesian network model for assessing natural estrogen fate and transport in a swine waste lagoon. Integr. Environ. Assess. Manag. 10 (4), 511–521. doi:10.1002/ieam.1538
Leong, C. K. (2016). Credit risk scoring with bayesian network models. Comput. Econ. 47 (3), 423–446. doi:10.1007/s10614-015-9505-8
Li, R., Ibeanusi, V., Hoyle-Gardner, J., Crandall, C., Jagoe, C., Seaman, J., et al. (2019). Bacterial-facilitated uranium transport in the presence of phytate at Savannah River Site. Chemosphere 223, 351–357. doi:10.1016/j.chemosphere.2019.02.064
Li, Z., Lyu, X., Gao, B., Xu, H., Wu, J., and Sun, Y. (2021). Effects of ionic strength and cation type on the transport of perfluorooctanoic acid (PFOA) in unsaturated sand porous mediafluorooctanoic acid (PFOA) in unsaturated sand porous media. J. Hazard. Mater. 403, 123688. doi:10.1016/j.jhazmat.2020.123688
Lorenzo, M., Campo, J., Suárez-Varela, M. M., and Picó, Y. (2019). Occurrence, distribution and behavior of emerging persistent organic pollutants (POPs) in a Mediterranean wetland protected area. Sci. Total Environ. 646, 1009–1020. doi:10.1016/j.scitotenv.2018.07.304
Lyu, Y., and Brusseau, M. L. (2020). The influence of solution chemistry on air-water interfacial adsorption and transport of PFOA in unsaturated porous media. Sci. Total Environ. 713, 136744. doi:10.1016/j.scitotenv.2020.136744
McKenzie, E. R., Siegrist, R. L., McCray, J. E., and Higgins, C. P. (2015). Effects of chemical oxidants on perfluoroalkyl acid transport in one-dimensional porous media columns. Environ. Sci. Technol. 49 (3), 1681–1689. doi:10.1021/es503676p
McMahon, P. B., Tokranov, A. K., Bexfield, L. M., Lindsey, B. D., Johnson, T. D., Lombard, M. A., et al. (2022). Perfluoroalkyl and polyfluoroalkyl substances in groundwater used as a source of drinking water in the eastern United States. Environ. Sci. Technol. 56 (4), 2279–2288. doi:10.1021/acs.est.1c04795
Minnesota Department of Health (MDH), 2022. Toxicological summary for: Perfluorobutane sulfonate. Available at: https://www.health.state.mn.us/communities/environment/risk/docs/guidance/gw/pfbssummary.pdf (accessed date May 19, 2022).
Minnesota Department of Health (MDH), 2018. Toxicological summary for: Perfluorobutanoate. Available at: https://www.health.state.mn.us/communities/environment/risk/docs/guidance/gw/pfba2summ.pdf (accessed date May 19, 2022).
Minnesota Department of Health (MDH), 2020. Toxicological summary for: Perfluorohexane sulfonate. Available at: https://www.health.state.mn.us/communities/environment/risk/docs/guidance/gw/pfhxs.pdf (accessed date May 19, 2022).
Minnesota Department of Health (MDH), 2021. Toxicological summary for: Toxicological summary for: Perfluorohexanoate. Available at: https://www.health.state.mn.us/communities/environment/risk/docs/guidance/gw/pfhxa.pdf (accessed date May 19, 2022).
Naidu, R., Nadebaum, P., Fang, C., Cousins, I., Pennell, K., Conder, J., et al. (2020). Per-and poly-fluoroalkyl substances (PFAS): Current status and research needs. Environ. Technol. Innovation 19, 100915. doi:10.1016/j.eti.2020.100915
Pearl, J. (1988). Probabilistic reasoning in intelligent systems: Networks of plausible inference. Burlington, Massachusetts, United States: Morgan kaufmann.
Pétré, M. A., Genereux, D. P., Koropeckyj-Cox, L., Knappe, D. R., Duboscq, S., Gilmore, T. E., et al. (2021). Per-and polyfluoroalkyl substance (PFAS) transport from groundwater to streams near a PFAS manufacturing facility in North Carolina, USA. Environ. Sci. Technol. 55 (9), 5848–5856. doi:10.1021/acs.est.0c07978
Propp, V. R., De Silva, A. O., Spencer, C., Brown, S. J., Catingan, S. D., Smith, J. E., et al. (2021). Organic contaminants of emerging concern in leachate of historic municipal landfills. Environ. Pollut. 276, 116474. doi:10.1016/j.envpol.2021.116474
QGIS Development Team (2016). QGIS geographic information system. Beaverton, OR: Open source geospatial foundation project.
Roostaei, J., Colley, S., Mulhern, R., May, A. A., and Gibson, J. M. (2021). Predicting the risk of GenX contamination in private well water using a machine-learned Bayesian network model. J. Hazard. Mater. 411, 125075. doi:10.1016/j.jhazmat.2021.125075
Safari, S., Baratloo, A., Elfil, M., and Negida, A. (2016). Evidence based emergency medicine; part 5 receiver operating curve and area under the curve. Emerg. 4 (2), 111–113. doi:10.22037/aaem.v4i2.232
Sepulvado, J. G., Blaine, A. C., Hundal, L. S., and Higgins, C. P. (2011). Occurrence and fate of perfluorochemicals in soil following the land application of municipal biosolids. Environ. Sci. Technol. 45 (19), 8106–8112. doi:10.1021/es103903d
Sharifan, H., Bagheri, M., Wang, D., Burken, J. G., Higgins, C. P., Liang, Y., et al. (2021). Fate and transport of per-and polyfluoroalkyl substances (PFASs) in the vadose zone. Sci. Total Environ. 771, 145427. doi:10.1016/j.scitotenv.2021.145427
Sharp, S., Sardiña, P., Metzeling, L., McKenzie, R., Leahy, P., Menkhorst, P., et al. (2021). Per-and polyfluoroalkyl substances in ducks and the relationship with concentrations in water, sediment, and soil. Environ. Toxicol. Chem. 40 (3), 846–858. doi:10.1002/etc.4818
Sima, M. W., and Jaffé, P. R. (2021). A critical review of modeling Poly-and Perfluoroalkyl Substances (PFAS) in the soil-water environment. Sci. Total Environ. 757, 143793. doi:10.1016/j.scitotenv.2020.143793
Steenland, K., Fletcher, T., and Savitz, D. A. (2010). Epidemiologic evidence on the health effects of perfluorooctanoic acid (PFOA). Environ. Health Perspect. 118 (8), 1100–1108. doi:10.1289/ehp.0901827
U.S. EPA, 2006. 2010/2015 PFOA stewardship program - guidance on reporting emissions and product content. Available at: https://www.epa.gov/assessing-and-managing-chemicals-under-tsca/201015-pfoa- stewardship-program-guidance-reporting (accessed date May 6, 2022).
Vierke, L., Möller, A., and Klitzke, S. (2014). Transport of perfluoroalkyl acids in a water-saturated sediment column investigated under near-natural conditions. Environ. Pollut. 186, 7–13. doi:10.1016/j.envpol.2013.11.011
Wang, Z., Cousins, I. T., Scheringer, M., and Hungerbuehler, K. (2015). Hazard assessment of fluorinated alternatives to long-chain perfluoroalkyl acids (PFAAs) and their precursors: Status quo, ongoing challenges and possible solutions. Environ. Int. 75, 172–179. doi:10.1016/j.envint.2014.11.013
Washington, J. W., Yoo, H., Ellington, J. J., Jenkins, T. M., and Libelo, E. L. (2010). Concentrations, distribution, and persistence of perfluoroalkylates in sludge-applied soils near Decatur, Alabama, USA. Environ. Sci. Technol. 44 (22), 8390–8396. doi:10.1021/es1003846
Weber, A. K., Barber, L. B., LeBlanc, D. R., Sunderland, E. M., and Vecitis, C. D. (2017). Geochemical and hydrologic factors controlling subsurface transport of poly-and perfluoroalkyl substances, Cape Cod, Massachusetts. Environ. Sci. Technol. 51 (8), 4269–4279. doi:10.1021/acs.est.6b05573
Wilkinson, J. L., Hooda, P. S., Swinden, J., Barker, J., and Barton, S. (2017). Spatial distribution of organic contaminants in three rivers of Southern England bound to suspended particulate material and dissolved in water. Sci. Total Environ. 593, 487–497. doi:10.1016/j.scitotenv.2017.03.167
Zeng, J., Brusseau, M. L., and Guo, B. (2021). Model validation and analyses of parameter sensitivity and uncertainty for modeling long-term retention and leaching of PFAS in the vadose zone. J. Hydrology 603, 127172. doi:10.1016/j.jhydrol.2021.127172
Keywords: Bayesian network (BN), exposure risk, short-chain PFAS, groundwater, spatial visualization, machine learning (ML)
Citation: Li R and MacDonald Gibson J (2022) Predicting the occurrence of short-chain PFAS in groundwater using machine-learned Bayesian networks. Front. Environ. Sci. 10:958784. doi: 10.3389/fenvs.2022.958784
Received: 01 June 2022; Accepted: 10 October 2022;
Published: 03 November 2022.
Edited by:
Elena Moltchanova, University of Canterbury, New ZealandReviewed by:
Bridger Ruyle, Harvard University, United StatesBeverley Horn, Institute of Environmental Science and Research (ESR), New Zealand
Copyright © 2022 Li and MacDonald Gibson. This is an open-access article distributed under the terms of the Creative Commons Attribution License (CC BY). The use, distribution or reproduction in other forums is permitted, provided the original author(s) and the copyright owner(s) are credited and that the original publication in this journal is cited, in accordance with accepted academic practice. No use, distribution or reproduction is permitted which does not comply with these terms.
*Correspondence: Jacqueline MacDonald Gibson, jmacdon@ncsu.edu