 Shanhe Jin
 Xin Liu
 Jiajia Yang1*
94% of researchers rate our articles as excellent or good
Learn more about the work of our research integrity team to safeguard the quality of each article we publish.
Find out more
ORIGINAL RESEARCH article
Front. Environ. Sci., 24 October 2022
Sec. Environmental Informatics and Remote Sensing
Volume 10 - 2022 | https://doi.org/10.3389/fenvs.2022.1032584
This article is part of the Research TopicMeta-Scenario Computation for Social-Geographical SustainabilityView all 60 articles
Land use/Land cover (LULC) change seriously affects ecosystem services and ecosystem functions. In order to maintain ecological security and orderly social development, habitat quality assessment based on Land use/Land cover change is worth exploring. Based on multi-source land use data and Google remote sensing data from 1985 to 2017, land use transfer matrix and habitat quality index were used to study land use change, spatial-temporal evolution of habitat quality, and driving factors influencing habitat quality change in Sanjiang Plain. The results showed that Land use/Land cover changed significantly from 1985 to 2017, especially paddy land increased by 22,184.92 km2, while unutilized land decreased by 11,533.53 km2. The increase of construction land was mainly at the expense of dry land. There was a polarization in habitat quality, and the high intensity of land use utilization and development resulted in a significant decrease in habitat quality. From 1985 to 2017, the largest change in habitat quality was grassland, which decreased from 0.99 to 0.91.
With the rapid development of cities, there have been negative effects on the global climate, living environment, and ecological environment (Yang et al., 2019b; Guo et al., 2020; Chen Y. et al., 2022; Zhang et al., 2022b; Ren et al., 2022; Yu et al., 2022), The CPC Central Committee has given prominence to the construction of ecological civilization, comprehensively strengthened the construction of ecological civilization, and carried out a series of efforts to control mountains, rivers, forests, fields, lakes, grass and sand in an integrated manner (Du et al., 2021; Meng et al., 2021). Therefore, understanding the changes of habitat quality caused by land use transformation is of great significance for the construction of ecological civilization.
Land is the spatial carrier of human economic and social activities, and the huge transformation of land use/land cover (LULC) has brought about a series of environmental problems (Shan et al., 2019; Wang et al., 2019). The development and utilization of land resources not only affects the ecological structure and ecosystem services, but also directly affects habitat quality and biodiversity (Duo et al., 2022; He et al., 2022), Rational land development can achieve a win-win situation between human resource demand and sustainable ecosystem development (Tan et al., 2020). Land use is the main driving factor of urban landscape pattern change (Feng et al., 2016; Yang et al., 2019a), and land use type is the determinant of ecological service value, population growth and changes in farming methods, is the main driving force of LULC changes (Liyew et al., 2019), and in the simulation of different ecological restoration and land reclamation, returning farmland to forest increases all the Ecosystem services, among which the scenario of returning farmland to grassland has the greatest impact on ecosystem services, and the natural succession scenario of shrub land has the least impact on ecosystem services (Yang et al., 2018). The occupation of cultivated land and grassland for construction land leads to serious losses of ESV(Chuai et al., 2016; Yang et al., 2022), some studies have also shown that at the economic level, the expansion of cultivated land will lead to an increase in the value of ecosystem services, and the loss of services such as climate, water and air regulation in natural ecosystems may lead to economic losses, thereby reducing the value of ecological services (Arowolo et al., 2018). Land development and use restrictions are conducive to maintaining the stability and sustainability of ecosystem services (Hu et al., 2019).
Habitat quality refers to the ability of an ecosystem to provide suitable living conditions for the sustainable development of individuals and populations, which can reflect ecosystem service functions and ecosystem health to a certain extent (Hall et al., 1997). Habitat quality models are used to assess overlaps and trade-offs between biodiversity conservation, ecosystem service provision and land use patterns (Terrado et al., 2016; Han et al., 2019). In recent years, with the continuous development of computer technology, GIS, and remote sensing technology, and the continuous updating of data acquisition methods, ecosystem service assessment models have been widely used to quantitatively assess habitat quality. There are many factors that affect habitat quality, and changes such as urban growth, socioeconomic development, and climate can degrade and lose large amounts of habitat quality, thereby threatening biodiversity. The natural environment determines the overall distribution pattern of habitats, while human activities play a leading role in habitat changes (Bai et al., 2019; Huang et al., 2020; Song et al., 2020; Zhang H et al., 2020), and nighttime lighting and land urbanization rates are negatively correlated with habitat quality. From the perspective of landscape pattern, landscape aggregation index was positively correlated with habitat quality (Zhu et al., 2020). At present, the commonly used methods for studying ecological services at home and abroad include the Integrated Valuation of Ecosystem Services and Trade-offs (InVEST) model, the Ecological Suitability model, and the artificial intelligence ecosystem assessment model (Artificial Intelligence for Ecosystem Services (ARIES) model and Social Values for Ecosystem Services (SolVES) model (Costa et al., 2010; Bagstad et al., 2013; Open-File Report, 2015; Moreira et al., 2018), of which the InVEST model is the most widely used. A set of model systems for assessing the capacity and economic value of ecosystem services, supporting ecosystem management and decision-making, including three types of ecosystem service assessment models: terrestrial, freshwater and marine (Richard et al., 2018; Tang et al., 2020; Zhang X et al., 2020), the InVEST model is now widely used in Ecological assessment (Claudia et al., 2020; Hu et al., 2020).
This paper takes the Sanjiang Plain as the research area, explores the impact of LULC on the habitat quality of the Sanjiang Plain from 1985 to 2017, quantitatively assessed habitat quality in Sanjiang Plain, and explored the relationship between habitat quality and natural and social influencing factors, so as to provide valuable reference for ecological civilization construction.
Sanjiang Plain is located in the northeast of Heilongjiang Province (45°01′05″N∼48°27′56″N, 130°12′01″E∼135°05′26″E), “Sanjiang” refers to Heilongjiang, Wusuli River, Songhua River, the three rivers alluvial formed this piece of flat fertile soil. Including Jiamusi City, Hegang City, Shuangyashan City, Qitaihe City, 21 counties (cities) under Jixi City and Yilan County under Harbin City (Figure 1). The climate type is a mid-temperate continental monsoon climate, with an average temperature of 2.5–3.6°C, an accumulated temperature of ≥10°C of 2,200–2,500°C, and an annual precipitation of 500–600 mm. Influenced by comprehensive factors such as topography and landform, land property differences and social economy, Sanjiang Plain mainly develops agriculture, with relatively high land use intensification and serious population loss. These changes have been accompanied by massive biodiversity loss and habitat degradation.
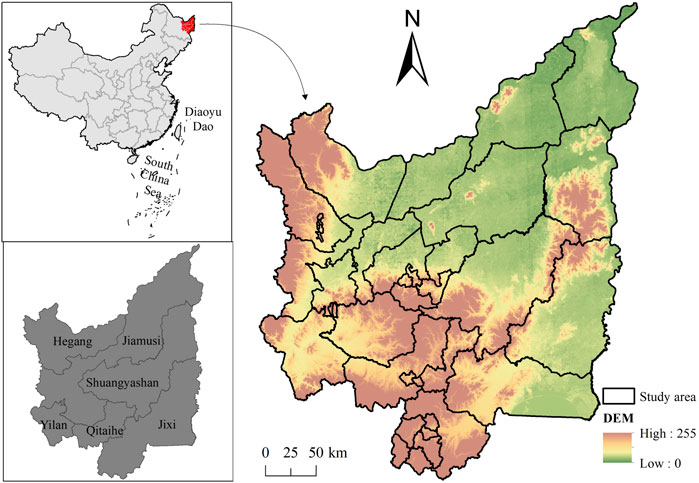
FIGURE 1. The location of the study area.
Land use data in this paper comes from the project of the Shenyang Center of China Geological Survey (Table 1). The original remote sensing images of landsat5 and landsat7 in 1985 and 2000 were downloaded by USGS, and the GF-1 image in 2017 was obtained through project application. Data preprocessing is to perform radiometric calibration, atmospheric correction and image enhancement on the original image, and destrip the original Landsat7 TM data.
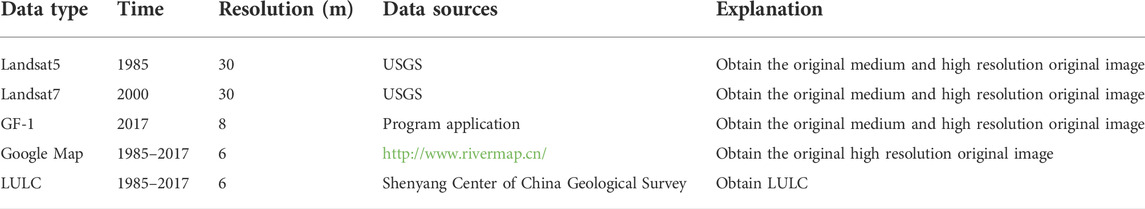
TABLE 1. Data sources and descriptions.
In order to extract LULC data in the research area, remote sensing images were initially classified by the supervised classification method in ENVI. Secondly, Google historical remote sensing images with a scale of 1:1 million and a spatial resolution of 6 m were downloaded from water micromaps, and the supervised classification results were corrected by manual visual interpretation and interpretation. In addition, 300 points were randomly selected for field verification and field verification, and the LULC data of Sanjiang Plain in 1985, 2000 and 2017 were finally obtained (Figure 2, Figure 3).

FIGURE 2. Data pre-processing process.
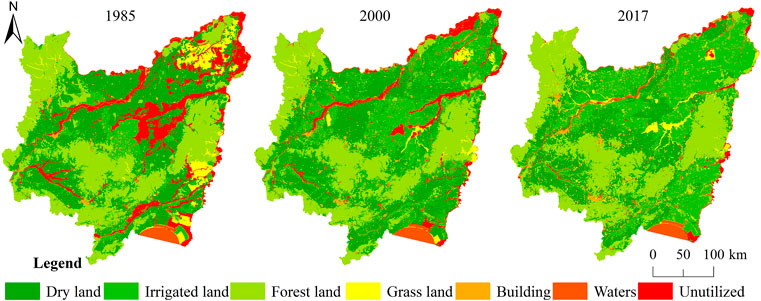
FIGURE 3. 1985–2017 Land use/Land cover.
Land use transition matrix is a quantitative description of the system state and state transition in the system analysis, which can reflect the transition of land use types in two periods. The calculation formula is as follows:
The habitat degradation index is used to describe the negative impact of threat sources on habitats. The habitat quality is mainly affected by four factors: the relative impact of each threat, the relative sensitivity of each habitat to each threat factor, the distance between the habitat and the threat source, and the level of legal protection of land. The higher the sensitivity of the habitat to the threat factor, the greater the habitat degradation index will be. The calculation formula is as follows:
The habitat quality is calculated based on the habitat degradation index, and the calculation formula is as follows:
Each habitat quality type is affected by its own habitat suitability and sensitivity to threat sources, the higher the habitat suitability, the better the habitat quality, and the stronger the sensitivity to threat sources, indicating the lower the anti-disturbance ability and the worse the habitat quality. Since the Sanjiang Plain is mainly agricultural and animal husbandry, this study divides the cultivated land into irrigated land and dry land. There are three types of threat sources, namely irrigated land, dry land and construction land (Table 2). Refer to the InVest User Guide for the maximum impact distance, first set to 0.5 and adjusted by the degradation index data, the facility is 0.095. The spatial impact of threat was mainly affected by the distance between threat factor and habitat and the attenuation mode. The decay mode is composed of linear decay and exponential decay (Table 2, Table 3).
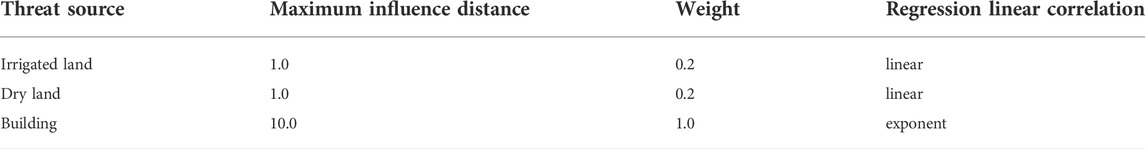
TABLE 2. Weight and maximum influence distance of threat sources.
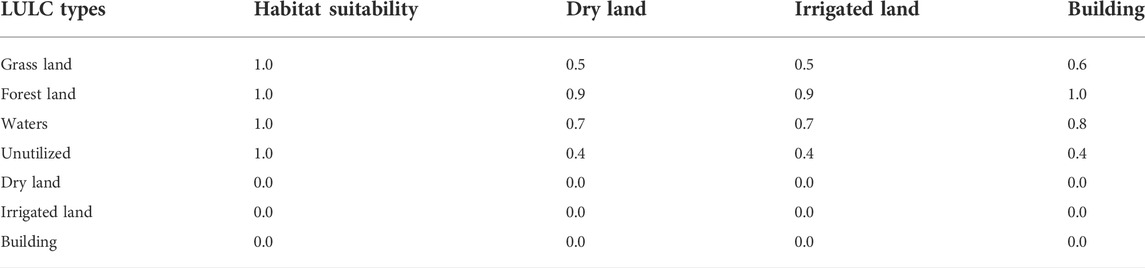
TABLE 3. Habitat suitability of land use types and their sensitivity to various threat sources.
By calculating the area change of each LULC type and the proportion of each type of LULC from 1985 to 2017 (Figure 4), it can be seen that land use has undergone huge changes. In 1985, the Sanjiang Plain occupied the largest area of cultivated land, including dry land and irrigated land, covering an area of 34,157.88 km2 and 9,141.66 km2, respectively. Dry land accounted for 34.3%, forest land accounted for 33.8%, and construction land area was at least 1,659.53 km2, accounting for 1.7%. In 2000, the irrigated land area doubled to 24,908.22 km2, accounting for 25.02%, and unutilized land was greatly reduced. In 2017, dry land continued to decrease, covering an area of 25,032.21 km2, while irrigated land continued to increase, increasing to 31,326.58 km2, accounting for 31.47% From 1985 to 2017, irrigated land continued to grow, dry land and unutilized land continued to decrease, forest land first decreased and then increased, and other land types did not change significantly. In 1985 and 2000, dry land accounted for the largest proportion of land types, but irrigated land accounted for the largest proportion of land types in 2017.
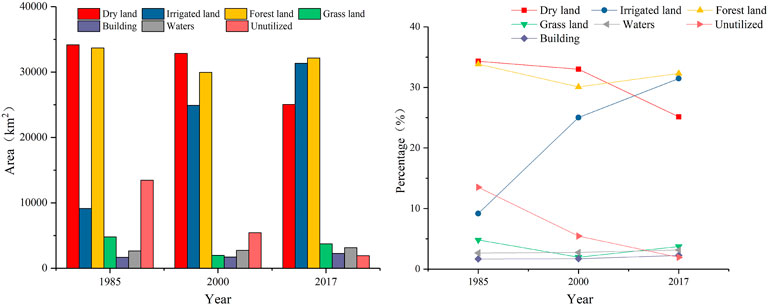
FIGURE 4. Land use/Land cover change.
It can be seen that the Sanjiang Plain is rich in black soil resources and water resources, mainly for agricultural production, so the conversion of LULC shows the continuous increase of irrigated land. In addition, the growth rate of construction land is very small, mainly in the west. The accelerated urbanization process and the continuous growth of population have led to the growth of construction land. However, urban expansion is not obvious, and industrial development is slow.
From the land use matrix (Figure 5), it can be seen that from 1985 to 2000, the conversion of unutilizedland into irrigated land and dry land was the most obvious, especially in the middle of the study area, followed by the conversion of grassland into irrigated land, mainly in the northeast. From 2000 to 2017, it was mainly the mutual conversion between dry land and irrigated land, which was distributed in the north and southeast of the study area, followed by the conversion of dry land to forest land, which was distributed in the southwest. In addition, it can be seen that the increase in construction land is mainly due to the conversion of dry land to construction land. Quantitative analysis of land use transfer changes (Table 4, Table 5) shows that from 1985 to 2000, irrigated land increased by 15,766.56 km2 and unutilized land decreased by 8,026.13 km2. From 2000 to 2017, irrigated land increased by 6,417.58 km2, dry landdecreased by 7,813.74 km2, and unused land decreased by 8,026.13 km2. Reduced by 3,507.40 km2. This paper analyzes and organizes the information of LULC in the study area in the past 30 years, and it is of great significance to grasp the changing law and direction of LULC in the study area.
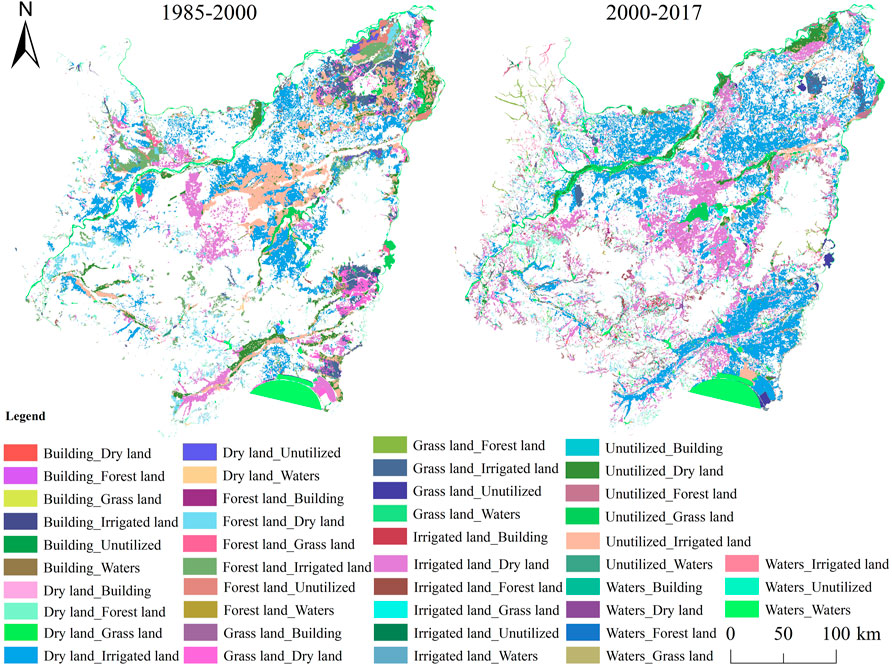
FIGURE 5. Land use/cover transfer from 1985 to 2017.
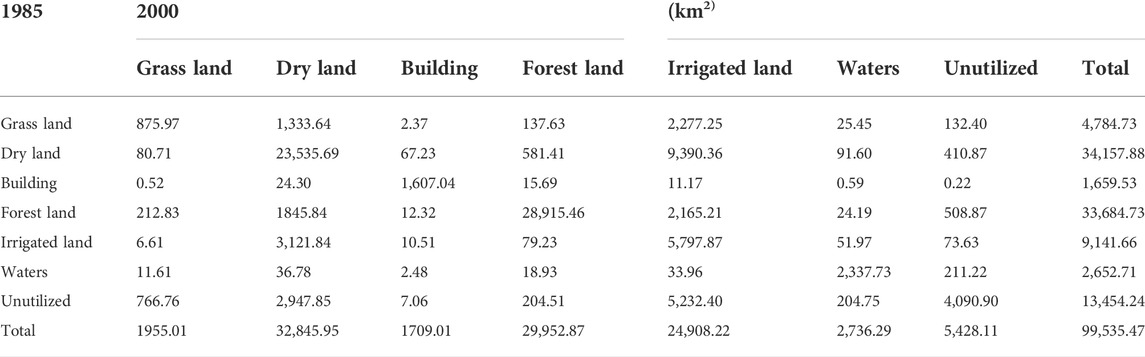
TABLE 4. Land use transition matrixes between 1985 and 2000.
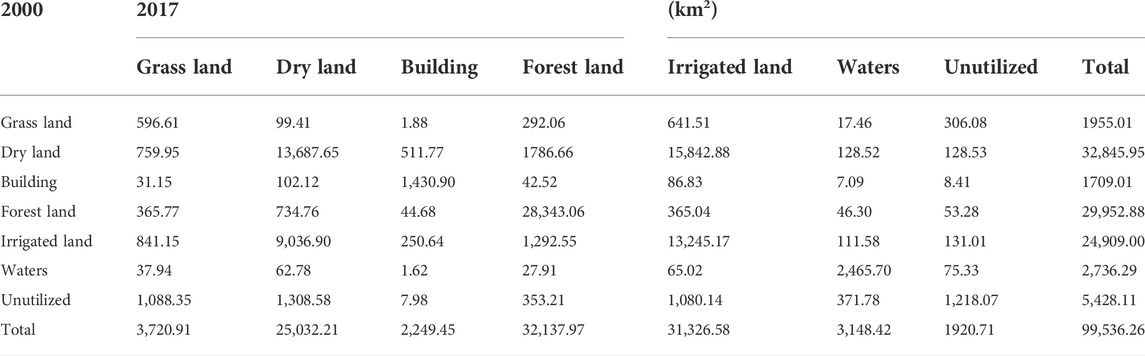
TABLE 5. Land use transition matrixes between 2000 and 2000.
The habitat quality ranges from 0 to 1, and the closer it is to 1, the higher the habitat quality. From 1985 to 2017, the habitat quality of the Sanjiang Plain showed a phenomenon of polarization, and the habitat quality decreased year by year. Among them, the habitat quality decreased significantly from 1985 to 2000, mainly in the northeast and southeast of the study area, and the habitat quality from 2000 to 2017. The quality change is not obvious, but it can be seen that the habitat quality in the northeastern part of the study area is significantly reduced, showing a circular shape and gradually spreading inward, and the habitat quality in the southwestern part is significantly increased (Figure 6).
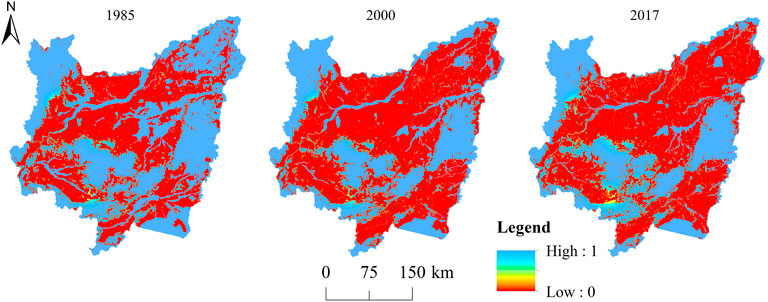
FIGURE 6. Spatial-temporal changes in habitat quality from 1985 to 2017.
Quantitative analysis shows that in 1985, the habitat quality was good, and the habitat quality value was above 0.8, reaching 30%. However, in 2000 and 2017, the habitat quality value was below 0.2, reaching more than 90%. Due to the high-intensity development and utilization of land, resulting in a sharp decline in habitat quality.
The assessment of habitat quality by the InVest model includes many aspects, and the degree of degradation reflects the degree of habitat quality decline. From 1985 to 2017, the degree of habitat degradation increased year by year, and the areas with the highest degree of degradation occurred in the west and northwest of the study area, near towns, industrial and mining, residential land, and near various watersheds (Figure 7). The damage is the worst. The areas with a high degree of degradation are irrigated land and dry land, and human activities have had a negative impact on the ecological environment. The places with low degree of degradation are forest land and grass land, and the vegetation cover has a positive impact on the ecological environment.
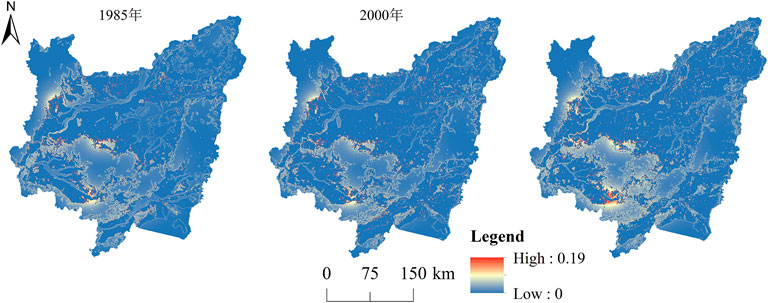
FIGURE 7. Spatial-temporal changes of degradation dgree.
Land use change will have positive and negative impacts on habitat quality, and the area with obvious changes in habitat quality is the concentrated area of land use change. Statistical analysis of the average habitat quality from 1985 to 2017 shows that the habitat quality of dry land, irrigated land and construction land is 0, and the habitat quality of grassland, forest land and unutilized land is above 0.90 (Table 6). In recent years, due to the development of unutilized land by agricultural production, the increase of construction land and the loss of grassland, the habitat quality has been reduced.

TABLE 6. Average habitat quality of different LULC types.
Analyzing the changes of habitat quality during different LULC conversions, it was found that when the land was converted to urban and rural, industrial and mining, and residential land, the habitat quality decreased the most, especially when the unutilized land was converted to construction land, the habitat quality decreased the fastest, followed by the conversion of forest land to construction land. The habitat quality of irrigated land and dry land also decreased, and the habitat quality of irrigated land decreased more than that of dry land. The habitat quality increased when converted to grassland, unutilized land and forest land, and the grassland habitat quality increased the most.
In order to further study the effect of LULC change on habitat quality change, the results of habitat quality from 1985 to 2017 were superimposed and analyzed to obtain the habitat quality change (Figure 8). From 1985 to 2017, most of the habitat quality remained unchanged, while a small part of the habitat quality improved, and more areas of the habitat quality deteriorated than improved. In the first 15 years, the habitat quality became worse, and in the last 17 years, the habitat quality became better. Combined with Figure 4, it can be seen that the deterioration of habitat quality from 1985 to 2000 was due to the reduction of grass land and forest land, and the improvement of habitat quality from 2000 to 2017 was due to the conversion of other land to forest land.
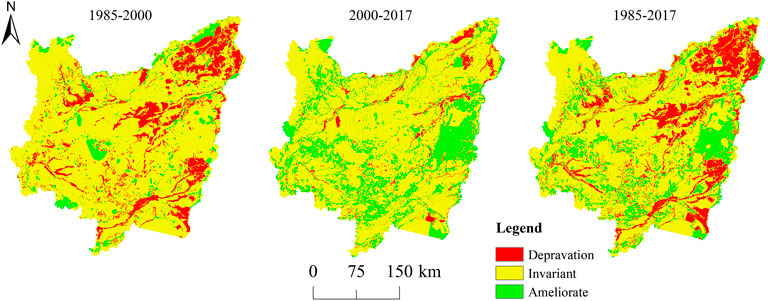
FIGURE 8. Changes in habitat quality.
This paper obtains LULC types in the study area through remote sensing technology and field verification, which improves the accuracy of data compared with traditional classification methods (Xie and Wang, 2015), studies land use transfer and habitat quality change, quantitatively analyzes the driving mechanism of habitat quality change, and provides scientific reference for ecological environment construction in the Sanjiang Plain. Analyzing the impact of land use change on habitat quality could provide meaningful reference for optimizing habitat quality in the Sanjiang Plain. The LULC variation in Sanjiang Plain is affected by topography, climate, social and economic factors (Wang et al., 2015; Chen H. et al., 2022). In the late 1985s, the domestic industry was transformed, and the demand for cultivated land increased significantly, which led to the transformation of LULC type to cultivated land (Yang et al., 2013, 2000–2009), so irrigated land were gradually increasing. With China’s emphasis on the ecological environment (Jiang et al., 2021; Hu et al., 2022), grass land and forest land have also increased since 2000. The uncertainty of LULC type data leads to great differences in ecological environment results, and this uncertainty also shows great differences between different biological communities and soil types (Ouyang et al., 2013; Song, 2018; Wang et al., 2022). Therefore, LULC change is a direct factor affecting ecosystem services. LULC change is closely related to national policies and social and economic development (Yang et al., 2021). In order to further strengthen the control of LULC spatial conversion, the speed of LULC conversion should be slowed down, the conversion of land with good habitat quality should be reduced, and the degree of landscape fragmentation should be reduced.
Habitat quality change is affected by many aspects and is a complex process. LULC change is one of the main driving factors leading to the change of habitat quality. We found that construction land was the most threatening to habitat quality, and human activities seriously damaged urban climate and ecological environment (Zhang et al., 2022a). Agricultural activities pose a greater threat due to the effects of fertilizers and pesticides, mechanical activities during harvest or human trampling on the land (Yang et al., 2012), but farming is not entirely negative for the ecological environment (Zhang et al., 2012). In order to promote the ecological environment, on the premise of ensuring food security, the use of fallow irrigated land can protect the ecological environment (Luo et al., 2020). In order to slow down the degradation of habitat quality, it is necessary to make reasonable planning for urban expansion and strive for greater ecological benefits.
With the change of land use pattern, habitat quality also changed. In the future planning of land use pattern in Sanjiang Plain, we should pay attention to the protection of grassland and woodland, rationally control the amount of cultivated land and construction land, optimize the landscape pattern of woodland, grassland, cultivated land and construction land, and pay attention to ecological benefits while pursuing economic benefits, so as to achieve the coordinated development of human-land system.
This paper only analyzes the habitat quality from the perspective of land use, and draws some conclusions that are beneficial to the construction of regional ecological civilization. There are differences in the impact of LULC types on habitat quality. Due to the aggregation of agricultural production in the Sanjiang Plain, this paper divides the cultivated land types into irrigated land and dry land. However, subdividing LULC types can explore LULC changes more microscopically (Yan and Zhang, 2019; Luo et al., 2022). In addition, the source of habitat quality threat is not only the impact of human economic activities, but also natural disasters under unstable factors.
Sanjiang Plain plays an important role in regional and national food security. This paper integrates the land use/cover situation of the Sanjiang Plain in the past 30 years through remote sensing data, and uses the Invest model to calculate the habitat quality of the study area and evaluate the impact of LULC change on the habitat quality, and provide a scientific basis for ecological protection in the study area. The conclusion is as follows: 1) From 1985 to 2017, the most obvious land use changes were irrigated land and unutilized land. The Sanjiang Plain is rich in black soil resources. With the breakthrough of rice technology, a large number of farmers have opened up wasteland and the area of irrigated land has continued to grow. Due to serious population loss and slow economic development in Northeast China, although construction land have increased, they are extremely slow. After 2000, China has attached great importance to ecological protection, and the forest land and grassland have decreased first and then increased. 2) From 1985 to 2017, the habitat quality showed a downward trend year by year, and the increase of urban, industrial and mining, residential land and agricultural land was the main reason for the change of habitat quality. 3) Land use change and land development intensity, along with the change of habitat quality, the habitat quality of the Sanjiang Plain is getting worse and worse, indicating that agricultural production has a negative impact on the habitat quality. LULC and habitat quality were significantly correlated in Sanjiang Plain. When LULC types were forest land and grass land, the habitat quality was significantly improved, and with the social development, the habitat quality was significantly worse when irrigated land increased.
The original contributions presented in the study are included in the article/supplementary material, further inquiries can be directed to the corresponding authors.
SJ contributed to all aspects of this work and wrote the main manuscript text; XL and JY wrote the data analysis section, JL, YG, JY, RY, and YS conducted the experiment and analyzed the data. All authors reviewed the manuscript.
This research study was supported by the Shenyang Center of China Geological Survey (Grant No.DD20211389-2).
The authors would like to acknowledge all colleagues and friends who have voluntarily reviewed the translation of the survey and the manuscript of this study.
The authors declare that the research was conducted in the absence of any commercial or financial relationships that could be construed as a potential conflict of interest.
All claims expressed in this article are solely those of the authors and do not necessarily represent those of their affiliated organizations, or those of the publisher, the editors and the reviewers. Any product that may be evaluated in this article, or claim that may be made by its manufacturer, is not guaranteed or endorsed by the publisher.
Arowolo, A. O., Deng, X., Olatunji, O. A., and Obayelu, A. E. (2018). Assessing changes in the value of ecosystem services in response to land-use/land-cover dynamics in Nigeria. Sci. Total Environ. 636, 597–609. doi:10.1016/j.scitotenv.2018.04.277
Bagstad, K. J., Johnson, G. W., Voigt, B., and Villa, F. (2013). Spatial dynamics of ecosystem service flows: A comprehensive approach to quantifying actual services. Ecosyst. Serv. 4, 117–125. doi:10.1016/j.ecoser.2012.07.012
Bai, L., Xiu, C., Feng, X., and Liu, D. (2019). Influence of urbanization on regional habitat quality:a case study of Changchun City. Habitat Int. 93, 102042. doi:10.1016/j.habitatint.2019.102042
Chen, H., Meng, F., Yu, Z., and Tan, Y. (2022a). Spatial–temporal characteristics and influencing factors of farmland expansion in different agricultural regions of Heilongjiang Province, China. Land Use Policy 115, 106007. doi:10.1016/j.landusepol.2022.106007
Chen, Y., Yang, J., Yang, R., Xiao, X., Xia, J., and Cecilia), (2022b). Contribution of urban functional zones to the spatial distribution of urban thermal environment. Build. Environ. 216, 109000. doi:10.1016/j.buildenv.2022.109000
Chuai, X., Huang, X., Wu, C., Li, J., Lu, Q., Qi, X., et al. (2016). Land use and ecosystems services value changes and ecological land management in coastal Jiangsu, China. Habitat Int. 57, 164–174. doi:10.1016/j.habitatint.2016.07.004
Claudia, C., Carlos, M. J., Cunha Pedro, P., and Teixeira, Z. (2020). Ecosystem services as a resilience descriptor in habitat risk assessment using the InVEST model. Ecol. Indic. 115, 106426. doi:10.1016/j.ecolind.2020.106426
Costa, G. C., Nogueira, C., Machado, R. B., and Colli, G. R. (2010). Sampling bias and the use of ecological niche modeling in conservation planning: A field evaluation in a biodiversity hotspot. Biodivers. Conserv. 19, 883–899. doi:10.1007/s10531-009-9746-8
Du, W., Yan, H., Feng, Z., Yang, Y., and Liu, F. (2021). The supply-consumption relationship of ecological resources under ecological civilization construction in China. Resour. Conservation Recycl. 172, 105679. doi:10.1016/j.resconrec.2021.105679
Duo, L., Li, Y., Zhang, M., Zhao, Y., Wu, Z., and Zhao, D. (2022). Spatiotemporal pattern evolution of urban ecosystem resilience based on “resistance-adaptation-vitality”: A case study of nanchang city. Front. Earth Sci. 10, 902444. doi:10.3389/feart.2022.902444
Feng, Y., Yang, J., and Wu, M. (2016). Land cover transition in the shuanghe natural reserve area, Heilongjiang province:A study based on landscape transfer matrix. Geol. Resour. 25, 500–504. doi:10.13686/j.cnki.dzyzy.2016.05.014
Guo, A., Yang, J., Sun, W., Xiao, X., Xia Cecilia, J., Jin, C., et al. (2020). Impact of urban morphology and landscape characteristics on spatiotemporal heterogeneity of land surface temperature. Sustain. Cities Soc. 63, 102443. doi:10.1016/j.scs.2020.102443
Hall, L. S., Krausman, P. R., and Morrison, M. L. (1997). The habitat concept and a plea for standard terminology. Wildlife Society Bulletin. 25, 173–182.
Han, Y., Kang, W., Thorne, J., and Song, Y. (2019). Modeling the effects of landscape patterns of current forests on the habitat quality of historical remnants in a highly urbanized area. Urban For. Urban Green. 41, 354–363. doi:10.1016/j.ufug.2019.04.015
He, F., Yang, J., Zhang, Y., Sun, D., Wang, L., Xiao, X., et al. (2022). Offshore island connection line: A new perspective of coastal urban development boundary simulation and multi-scenario prediction. GIScience Remote Sens. 59, 801–821. doi:10.1080/15481603.2022.2071056
Hu, M., Li, Z., Wang, Y., Jiao, M., Li, M., and Xia, B. (2019). Spatio-temporal changes in ecosystem service value in response to land-use/cover changes in the Pearl River Delta. Resour. Conservation Recycl. 149, 106–114. doi:10.1016/j.resconrec.2019.05.032
Hu, P., Zhou, Y., Zhou, J., Wang, G., and Zhu, G. (2022). Uncovering the willingness to pay for ecological red lines protection: Evidence from China. Ecol. Indic. 134, 108458. doi:10.1016/j.ecolind.2021.108458
Hu, W., Li, G., Gao, Z., Jia, G., Wang, Z., and Li, Y. (2020). Assessment of the impact of the Poplar Ecological Retreat Project on water conservation in the Dongting Lake wetland region using the InVEST model. Sci. Total Environ. 733, 139423. doi:10.1016/j.scitotenv.2020.139423
Huang, J., Tang, Z., Liu, D., and He, J. (2020). Ecological response to urban development in a changing socio-economic and climate context: Policy implications for balancing regional development and habitat conservation. Land Use Policy 97, 104772. doi:10.1016/j.landusepol.2020.104772
Jiang, L., Liu, Y., Wu, S., and Yang, C. (2021). Analyzing ecological environment change and associated driving factors in China based on NDVI time series data. Ecol. Indic. 129, 107933. doi:10.1016/j.ecolind.2021.107933
Liyew, B. M., Atsushi, T., Nigussie, H., Tsegaye, M. D., Enyew, A., Mitsuru, T., et al. (2019). Exploring land use/land cover changes, drivers and their implications in contrasting agro-ecological environments of Ethiopia. Land Use Policy 87, 104052. doi:10.1016/j.landusepol.2019.104052
Luo, C., Fu, X., Zeng, X., Cao, H., Wang, J., Ni, H., et al. (2022). Responses of remnant wetlands in the Sanjiang Plain to farming-landscape patterns. Ecol. Indic. 135, 108542. doi:10.1016/j.ecolind.2022.108542
Luo, C., Liu, H., Fu, Q., Guan, H., Ye, Q., Zhang, X., et al. (2020). Mapping the fallowed area of paddy fields on Sanjiang Plain of Northeast China to assist water security assessments. J. Integr. Agric. 19, 1885–1896. doi:10.1016/S2095-3119(19)62871-6
Meng, F., Guo, J., Guo, Z., Lee, J. C. K., Liu, G., and Wang, N. (2021). Urban ecological transition: The practice of ecological civilization construction in China. Sci. Total Environ. 755, 142633. doi:10.1016/j.scitotenv.2020.142633
Moreira, M., Fonseca, C., Marta, V., Helena, C., and Gil, A. (2018). Spatial assessment of habitat conservation status in a macaronesian island based on the InVEST model: A case study of pico island (azores, Portugal). Land Use Policy 78, 637–649. doi:10.1016/j.landusepol.2018.07.015
Open-File Report (2015). Open-file Report. United States: U.S. Department of the Interior, U.S. Geological Survey.
Ouyang, W., Xu, Y., Hao, F., Wang, X., Siyang, C., and Lin, C. (2013). Effect of long-term agricultural cultivation and land use conversion on soil nutrient contents in the Sanjiang Plain. CATENA 104, 243–250. doi:10.1016/j.catena.2012.12.002
Ren, J., Yang, J., Zhang, Y., Xiao, X., Xia, J. C., Li, X., et al. (2022). Exploring thermal comfort of urban buildings based on local climate zones. J. Clean. Prod. 340, 130744. doi:10.1016/j.jclepro.2022.130744
Richard, S., Rebecca, C.-K., Spencer, W., Anne, G., Heather, T., Taylor, R., et al. (2018). InVEST user’s Guide. United States: The Natural Capital Project, Stanford University, University of Minnesota. doi:10.13140/RG.2.2.32693.78567
Shan, W., Jin, X., Ren, J., Wang, Y., Xu, Z., Fan, Y., et al. (2019). Ecological environment quality assessment based on remote sensing data for land consolidation. J. Clean. Prod. 239, 118126. doi:10.1016/j.jclepro.2019.118126
Song, S., Liu, Z., He, C., and Lu, W. (2020). Evaluating the effects of urban expansion on natural habitat quality by coupling localized shared socioeconomic pathways and the land use scenario dynamics-urban model. Ecol. Indic. 112, 106071. doi:10.1016/j.ecolind.2020.106071
Song, X.-P. (2018). Global estimates of ecosystem service value and change: Taking into account uncertainties in satellite-based land cover data. Ecol. Econ. 143, 227–235. doi:10.1016/j.ecolecon.2017.07.019
Tan, Z., Guan, Q., Lin, J., Yang, L., Luo, H., Ma, Y., et al. (2020). The response and simulation of ecosystem services value to land use/land cover in an oasis, Northwest China. Ecol. Indic. 118, 106711. doi:10.1016/j.ecolind.2020.106711
Tang, F., Fu, M., Li, W., and Zhang, P. (2020). Land-use change in Changli County, China: Predicting its spatio-temporal evolution in habitat quality. Ecol. Indic. 117, 106719. doi:10.1016/j.ecolind.2020.106719
Terrado, M., Sabater, S., Chaplin-Kramer, B., Mandle, L., Ziv, G., and Acuña, V. (2016). Model development for the assessment of terrestrial and aquatic habitat quality in conservation planning. Sci. Total Environ. 540, 63–70. doi:10.1016/j.scitotenv.2015.03.064
Wang, C., Jiang, Q., Shao, Y., Sun, S., Xiao, L., and Guo, J. (2019). Ecological environment assessment based on land use simulation: A case study in the heihe river basin. Sci. Total Environ. 697, 133928. doi:10.1016/j.scitotenv.2019.133928
Wang, Q., Kang, Q., Zhao, B., Li, H., Lu, H., Liu, J., et al. (2022). Effect of land-use and land-cover change on mangrove soil carbon fraction and metal pollution risk in Zhangjiang Estuary, China. Sci. Total Environ. 807, 150973. doi:10.1016/j.scitotenv.2021.150973
Wang, Z., Mao, D., Li, L., Jia, M., Dong, Z., Miao, Z., et al. (2015). Quantifying changes in multiple ecosystem services during 1992–2012 in the Sanjiang Plain of China. Sci. Total Environ. 514, 119–130. doi:10.1016/j.scitotenv.2015.01.007
Xie, S., and Wang, Z. (2015). Study on the dynamic change of land use in Shenyang based on Object-oriented classification technology. Geol. Resour. 24, 255–260. doi:10.13686/j.cnki.dzyzy.2015.03.015
Yan, F., and Zhang, S. (2019). Ecosystem service decline in response to wetland loss in the Sanjiang Plain, Northeast China. Ecol. Eng. 130, 117–121. doi:10.1016/j.ecoleng.2019.02.009
Yang, D., Lou, Y., Zhang, P., and Jiang, L. (2022). Spillover effects of built-up land expansion under ecological security constraint at multiple spatial scales. Front. Ecol. Evol. 10, 907691. doi:10.3389/fevo.2022.907691
Yang, J., Guo, A., Li, Y., Zhang, Y., and Li, X. (2019a). Simulation of landscape spatial layout evolution in rural-urban fringe areas: A case study of ganjingzi district. GIScience Remote Sens. 56, 388–405. doi:10.1080/15481603.2018.1533680
Yang, J., Wang, Y., Xiao, X., Jin, C., Xia, J., Cecilia), , and Li, X. (2019b). Spatial differentiation of urban wind and thermal environment in different grid sizes. Urban Clim. 28, 100458. doi:10.1016/j.uclim.2019.100458
Yang, J., Yang, R., Chen, M.-H., Su, C.-H., Joan), , Zhi, Y., and Xi, J. (2021). Effects of rural revitalization on rural tourism. J. Hosp. Tour. Manag. 47, 35–45. doi:10.1016/j.jhtm.2021.02.008
Yang, S., Bai, Y., Wang, S., and Feng, N. (2013). Evaluating the transformation of China’s industrial development mode during 2000–2009. Renew. Sustain. Energy Rev. 20, 585–594. doi:10.1016/j.rser.2012.12.034
Yang, S., Zhao, W., Liu, Y., Wang, S., Wang, J., and Zhai, R. (2018). Influence of land use change on the ecosystem service trade-offs in the ecological restoration area: Dynamics and scenarios in the Yanhe watershed, China. Sci. Total Environ. 644, 556–566. doi:10.1016/j.scitotenv.2018.06.348
Yang, W., Cheng, H., Hao, F., Ouyang, W., Liu, S., and Lin, C. (2012). The influence of land-use change on the forms of phosphorus in soil profiles from the Sanjiang Plain of China. Geoderma 189–190, 207–214. doi:10.1016/j.geoderma.2012.06.025
Yu, W., Yang, J., Sun, D., Yu, H., Yao, Y., Xiao, X., et al. (2022). Spatial-temporal patterns of network structure of human settlements competitiveness in resource-based urban agglomerations. Front. Environ. Sci. 10, 893876. doi:10.3389/fenvs.2022.893876
Zhang, D., Min, Q., Liu, M., and Cheng, S. (2012). Ecosystem service tradeoff between traditional and modern agriculture: A case study in congjiang county, guizhou province, China. Front. Environ. Sci. Eng. 6, 743–752. doi:10.1007/s11783-011-0385-4
Zhang, D., Zhou, C., and He, B.-J. (2022a). Spatial and temporal heterogeneity of urban land area and PM2.5 concentration in China. Urban Clim. 45, 101268. doi:10.1016/j.uclim.2022.101268
Zhang, D., Zhou, C., Zhou, Y., and Zikirya, B. (2022b). Spatiotemporal relationship characteristic of climate comfort of urban human settlement environment and population density in China. Front. Ecol. Evol. 10, 953725. doi:10.3389/fevo.2022.953725
Zhang H, H., Zhang, C., Hu, T., Zhang, M., Ren, X., and Hou, L. (2020). Exploration of roadway factors and habitat quality using InVEST. Transp. Res. Part D Transp. Environ. 87, 102551. doi:10.1016/j.trd.2020.102551
Zhang X, X., Song, W., Lang, Y., Xiaomiao, F., Yuan, Q., and Wang, J. (2020). Land use changes in the coastal zone of China’s Hebei Province and the corresponding impacts on habitat quality. Land Use Policy 99, 104957. doi:10.1016/j.landusepol.2020.104957
Keywords: land use transfer, habitat Quality, inVEST model, Sanjiang plain, land use/cover change (LUCC)
Citation: Jin S, Liu X, Yang J, Lv J, Gu Y, Yan J, Yuan R and Shi Y (2022) Spatial-temporal changes of land use/cover change and habitat quality in Sanjiang plain from 1985 to 2017. Front. Environ. Sci. 10:1032584. doi: 10.3389/fenvs.2022.1032584
Received: 31 August 2022; Accepted: 10 October 2022;
Published: 24 October 2022.
Edited by:
Bing Xue, Institute for Advanced Sustainability Studies (IASS), GermanyReviewed by:
Dahao Zhang, Sun Yat-sen University, ChinaCopyright © 2022 Jin, Liu, Yang, Lv, Gu, Yan, Yuan and Shi. This is an open-access article distributed under the terms of the Creative Commons Attribution License (CC BY). The use, distribution or reproduction in other forums is permitted, provided the original author(s) and the copyright owner(s) are credited and that the original publication in this journal is cited, in accordance with accepted academic practice. No use, distribution or reproduction is permitted which does not comply with these terms.
*Correspondence: Xin Liu, MzA2NTQxNDkzQHFxLmNvbQ== Jiajia Yang, aGFpeGlhbnhpYW9tZWlAMTYzLmNvbQ==
Disclaimer: All claims expressed in this article are solely those of the authors and do not necessarily represent those of their affiliated organizations, or those of the publisher, the editors and the reviewers. Any product that may be evaluated in this article or claim that may be made by its manufacturer is not guaranteed or endorsed by the publisher.
Research integrity at Frontiers
Learn more about the work of our research integrity team to safeguard the quality of each article we publish.