 Alan D. Steinman
 Michael Hassett1
- 1Annis Water Resources Institute, Grand Valley State University, Muskegon, MI, United States
- 2USDA-Agricultural Research Service, National Soil Erosion Research Laboratory, West Lafayette, IN, United States
Eutrophication is a major problem in lakes and rivers throughout the world. One such system is Lake Macatawa, located in West Michigan, which hydrologically connects to Lake Michigan. Lake Macatawa and its watershed suffer from excess phosphorus and sediment loads. The total maximum daily load for the lake calls for a total phosphorus (TP) reduction of 75%, which would reduce the water column total phosphorus concentration from 125 μg/L to 50 μg/L. Understanding how P moves through this landscape, into Lake Macatawa, and ultimately to Lake Michigan and the St. Lawrence Seaway, is critical to managing and controlling P runoff. A potentially significant source of P to Lake Macatawa occurs through agricultural tile drainage. Various best management practices (BMPs) have been implemented in the Macatawa watershed to reduce P loading, especially surface runoff, but their overall effectiveness has been limited. Electric arc furnace (EAF) slag, a waste product from the steel industry, can chemically bind P and has been used previously in agricultural settings. Three iron slag filters were installed at the end of agricultural tile lines in the Macatawa watershed and evaluated to assess their effectiveness in removing P, while also monitoring for the presence of potentially toxic chemicals leaching from the slag. After 1 year of slag filter performance, both SRP (soluble reactive phosphorus) and TP decreased in the tile drain effluent: percent reductions of soluble reactive phosphorus and TP ranged from 7.4% to 57.3% and 59.5–76.5%, respectively. Absolute concentrations of TP were reduced to between 100 and 329 μg/L, which still exceeds the 50 μg/L goal for Lake Macatawa. Concentrations of toxic metals, polycyclic aromatic hydrocarbons compounds, and cyanide all were at levels below drinking water standards. Our preliminary conclusions are that the installation of these filters should be targeted to areas where tile drain effluent P levels are very high (SRP > 250 μg/L) to obtain an optimal cost/benefit ratio. While they are not a panacea, when installed in combination with other BMPs (Best Management Practices), EAF slag filters may play an important localized role in reducing P to Lake Macatawa and farther downstream.
Introduction
Excess phosphorus is resulting in the eutrophication of water bodies throughout the world (Paerl et al., 2016), often resulting in harmful algal blooms in both freshwater and marine systems (Boesch, 2019; Wurtsbaugh et al., 2019). Agricultural runoff is one of the main sources of excess nutrient loading to aquatic systems (Carpenter et al., 1998; Mrdjen et al., 2018); controlling this runoff, through either structural or non-structural Best Management Practices (BMPs), is the conventional means to reduce eutrophication. Implementing and enforcing regulatory measures is far less common, although litigation to enforce numeric nutrient standards is known to occur (Fumero and Rizzardi, 2000).
Lake Macatawa and its watershed suffer from excess phosphorus (P) (Walterhouse, 1999). The TMDL (total maximum daily load) for the lake calls for a P reduction of 55,000 lb/yr from the estimated load of 138,500 lb/yr, with the majority of that load reduction coming from nonpoint sources (Walterhouse, 1999). If fully implemented, the model results indicate that the water column total phosphorus (TP) concentration will be reduced to 50 μg/L, thereby meeting the TMDL goal.
It is well established that land use, and especially hydrologic connectivity in the watershed, plays a major role in nutrient loading to lakes (Soranno et al., 2015). Previous research has demonstrated that agriculture is a major source of nonpoint P in the Macatawa watershed (Steinman et al., 2018; Iavorivska et al., 2021). Although overland flow is generally considered the major transport mechanism for P, there are situations when significant P transport occurs through agricultural tile drainage (King et al., 2015; Michaud et al., 2019), which provides direct input to surface drains via outfalls. It is currently uncertain how much P enters Lake Macatawa from surface runoff vs. subsurface runoff, but very high concentrations of both TP and bioavailable P were measured in tile drain effluent from agricultural fields in the watershed (Clement and Steinman, 2017). Similar findings have been reported for agricultural areas in other parts of the Midwest, including central Ohio (Mrdjen et al., 2018) and the western basin of Lake Erie (Calhoun et al., 2002; Smith et al., 2015), which in both cases led to harmful algal blooms (Michalak et al., 2013; Wynne and Stumpf, 2015; Mrdjen et al., 2018).
Various BMPs have been implemented in the Macatawa watershed to reduce P loading, including among others, grassed waterways, cover crop plantings, gypsum application, two-stage ditches, and wetland restoration, although their effectiveness has been questioned (Steinman et al., 2018; Kindervater and Steinman, 2019). Iron slag, a waste product from the steel industry, can chemically bind P and has been implemented previously in agricultural settings (Hua et al., 2016; Roychand et al., 2020). Interest was expressed as to whether these slag filters may be an effective management practice in the Macatawa watershed. To that end, various public and private entities involved in Project Clarity (https://outdoordiscovery.org/project-clarity/), an initiative to restore Lake Macatawa, committed to install a series of EAF slag filters at the end of agricultural tile lines in the watershed. Our goal was to evaluate the efficiency of systems that have been in operation at least 1 year in removing P, while also monitoring for the presence of potentially toxic chemicals leaching from the EAF slag, which may be released into surface waterways. Although these filters have been installed in Ohio, to our knowledge, this is their first usage in Michigan.
Materials and Methods
Study Area
The Macatawa watershed (464 km2) is located in Ottawa and Allegan Counties (MI) and drains into Lake Macatawa (Figure 1). Land use is dominated by agriculture (46%) and developed (33%), which has contributed to the loss of 86% of the watershed’s natural wetlands (MWP, 2012). The watershed includes the cities of Holland and Zeeland and parts of 13 townships. Lake surface area is 7.2 km2. This drowned river mouth lake is relatively shallow, with an average depth of 3.6 m and a maximum depth of 12 m in the western basin. The Macatawa River, the main tributary to the lake, flows into the lake’s shallow eastern basin. A navigation channel at the western end of the lake connects Lake Macatawa with Lake Michigan.
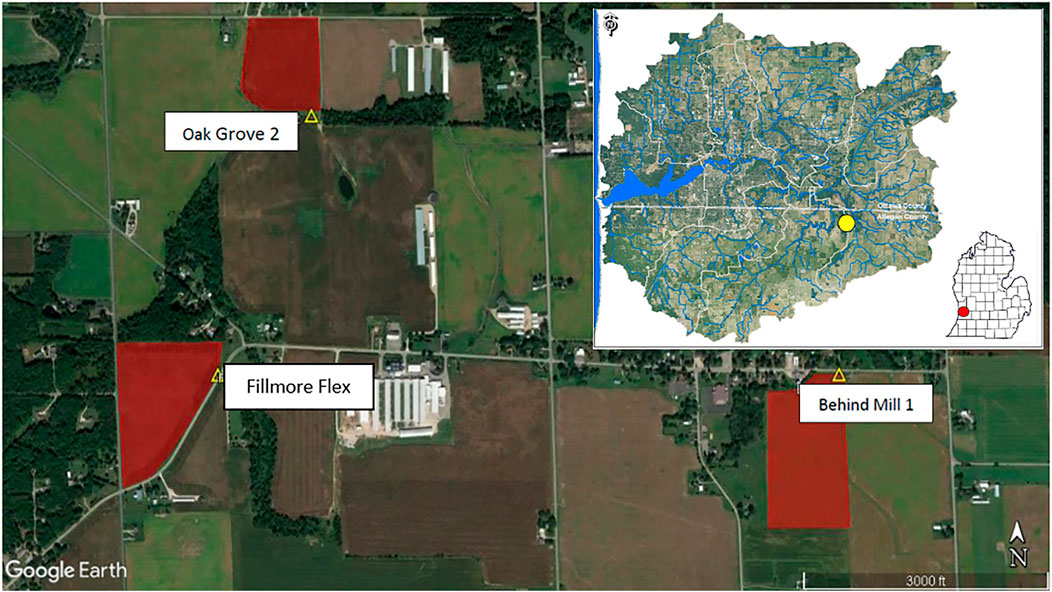
FIGURE 1. Completed EAF slag filter sites are indicated by yellow triangles, the red polygons represent the adjoining fields being drained, each approximately 30 acres. Fillmore Flex and Oak Grove 2 sites flow into the south branch of the Macatawa River, which later joins the main branch of the Macatawa River. Behind Mill 1 flows into Peter’s Creek. Insert: location of sites within the Macatawa watershed (yellow circle) and location within the lower peninsula of Michigan (red circle).
Multiple sites throughout the watershed were sampled prior to installation to determine which locations were best suited for EAF slag filter installation. Of the three filters discussed in this paper, two were completed in April 2019 (Behind Mill 1 and Oak Grove 2) and the third (Fillmore Flex) in September 2019 (Figure 1). Due to the COVID-19 pandemic, sampling was halted for several months in spring 2020 due to the state of Michigan’s “stay-at-home” executive order. Sampling resumed once the order was lifted.
Filters are designed to work passively, receiving water after it infiltrates through soils into subsurface tiled drains (Figure 2). Each of the three structures were designed with P-Trap software (Penn et al., 2021) utilizing several inputs: steel slag physical and chemical properties, annual flow volume, typical dissolved P concentrations, maximum flow rate, hydraulic head, and target retention time, flow rate, lifetime, and cumulative P removal. Annual flow volume and maximum flow rate through the subsurface main was estimated based on the drainage area, drainage coefficient (0.3), pipe diameter and slope, and Manning’s pipe equation (Penn and Bowen, 2017). Typical dissolved P concentrations were obtained from pre-installation sampling. Because each structure utilized a bottom-up flow regime (Figures 2, 3), hydraulic head was equal to the diameter of the subsurface main pipe that was plumbed into the inflow (10, 15, or 20 cm, depending on site). Material used in all structures was electric arc furnace (EAF) slag sourced from Levy Co. (Dearborn, MI, United States). A P removal design curve for the slag was obtained by the lab flow-through technique described by Stoner et al. (2012). For this design, the slope and intercept of the P removal curve was −0.01 and 100, and input into P-Trap software. Minimum target retention time at peak flow rate for all structures was 10 min. Target flow rates for the structures were set to equal the peak flow rates estimated for each site. Each structure utilized a water table control structure plumbed up-pipe of the P removal structure, with a “T“ fitting to allow water to by-pass directly to ditch outlet if clogging occurred.
The Behind Mill 1 structure was designed to remove 40% of the cumulative 6-month load and handle 130 L s−1 flow. Initially, P removal will be near 100% but decreases with continued loading as further Ca is consumed. Because of the large drainage area (therefore volume), this removal goal required approximately 41 metric tons and two tanks (slag depth = 150 cm). Inflow water was split evenly between the two buried slag tanks with a “Y” fitting. The Oak Grove 2 structure (20 metric tons in a single tank) was designed to remove 40% of the cumulative 1-year load and handle at least 32 L s−1. The Filmore Flex structure was constructed in the same manner as the Behind Mill 1 structure, although with a greater expected flow rate and volume.
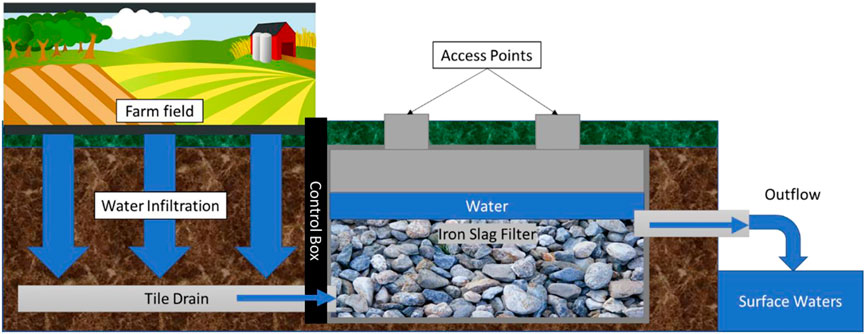
FIGURE 2. Stylized cross-section of EAF slag filters design/function. Figure is not to scale as EAF slag filter size is dependent on multiple factors (e.g., size of the tiled field, water velocity from the tile drains, soil type). See text for more detail on how the filters function. Image credit: Maggie Oudsema.
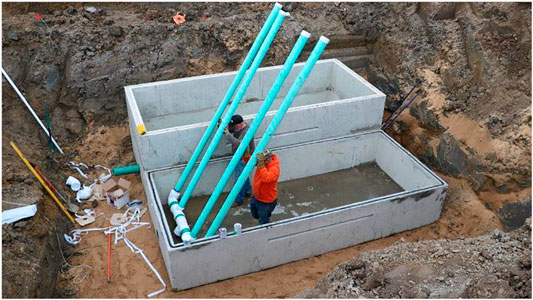
FIGURE 3. Inlet pipes being laid in the bottom of an EAF slag filter. Drainage water enters at the bottom, moves up through the EAF slag material (not yet installed) and leaves out a pipe near the top (not pictured) that leads to a nearby surface drain (not pictured). Photo credit: Macatawa Area Coordinating Council.
This observational study was designed to assess P removal effectiveness in the field on working farms. As a consequence, we could not control inflow volume or residence times, which varied based on local environmental conditions.
Field and Laboratory Processes
Prior to installation, grab samples were taken monthly at the outflow pipe, which at that time was a direct open connection from the tile drain pipes to adjacent agricultural ditches. Pre-installation sampling dates are provided in Table 1. Post-installation samples were collected bimonthly; sampling approaches varied among sites due to differences in filter design and implementation (Figure 4). Post-installation sampling occurred at the inflow using a hand pump and hose to siphon water accessed through an inflow pipe at Behind Mill 1 (Figure 4A) and through a control box at Oak Grove 2 and Fillmore Flex (Figures 1, 4B). Outflow was sampled at the original outflow pipe (Figure 4E; which remained after installation) for all sites; however, when the outflow pipe was inaccessible due to being underwater (the surface ditches are very flashy and water levels can rise quickly after a rain event (Steinman et al., 2018), submerging the outflow pipes), samples were taken via one of the access points on top of the tank using a hand pump and hose without disturbing the calcium carbonate top layer (Figures 4C,D).
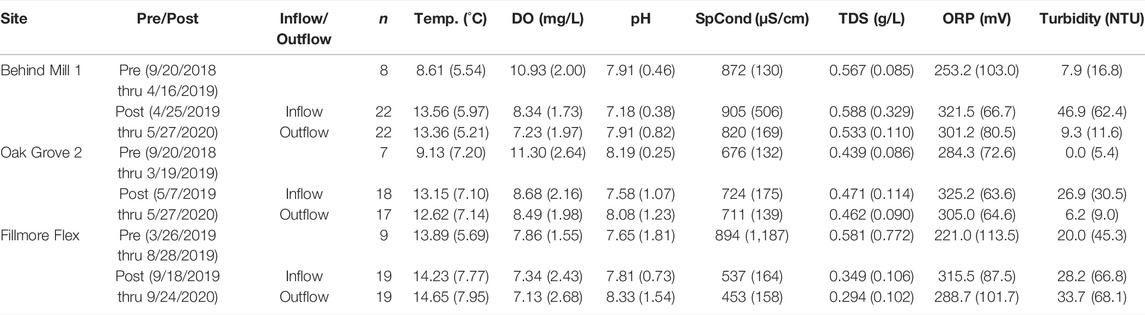
TABLE 1. Mean (1 standard deviation [SD]) values of selected water quality parameters for tile drain in/outflow iron slag pre- and post-installation monitoring. Date of first sampling is provided below each Pre/Post. Data are shaded to improve readability. n = number of successful sampling events per site, abbreviations in main text.
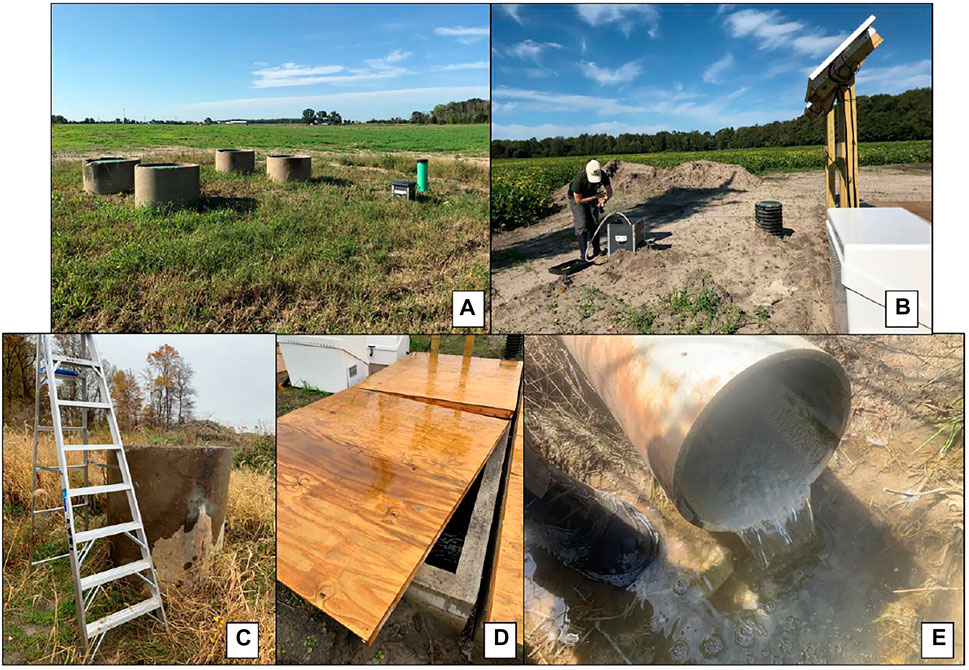
FIGURE 4. Photos of different sampling locations. (A) Behind Mill 1 with completed iron slag filters in place. The green tube (far right) is an inflow sampling port that was installed only at this location. Access ports (for cement upright tubes) are for two slag filter basins (considered to be one slag filter site) that receive tile drain water from the adjoining field (in background) and are used to sample outflow. (B) Sampling via a hand pump siphon to sample from a below-ground control box (inflow) at Fillmore Flex; Oak Grove 2 has a similar constructed inflow access (not shown). (C) Slag filter outflow access point for Oak Grove 2, which required a ladder to remove the large plastic cap to sample outflow water. (D) Slag filter outflow access point at Fillmore Flex, which is covered with large plywood lids. (E) Outflow pipe at Behind Mill 1 directly after installation. Photo credit: Maggie Oudsema.
General water quality was monitored with a YSI 6600 data sonde (temperature, dissolved oxygen [DO], pH, specific conductivity [SpCond], total dissolved solids [TDS], redox potential [ORP], and turbidity). Grab samples were collected for analysis of TP and soluble reactive P (SRP). All samples were placed in a cooler on ice and brought back to the lab, usually within 4 h, where they were stored and processed appropriately. Water for SRP analyses was syringe-filtered through 0.45-μm membrane filters into scintillation vials and refrigerated until analysis. TP and SRP were analyzed on a SEAL AQ2 discrete automated analyzer (U.S. EPA, 1993). Any values below detection were calculated as ½ the detection limit.
Metals and PAHs
Chemical analysis sampling for metals (mercury, arsenic, barium, cadmium, chromium, cobalt, copper, lead, molybdenum, nickel, selenium, silver and zinc), low-level mercury, Polycyclic Aromatic Hydrocarbons ([PAHs] 2-Methylonaphthalene, Acenaphthene, Acenaphthylene, Anthracene, Benzo (a) anthracene, Benzo (a) pyrene, Benzo (b) fluoranthene, Benzo (g,h,i) perylene, Benzo (k) fluoranthene, Chrysene, Dibenz (a,h) anthracene, Fluoranthene, Fluorene, Indeno (1,2,3-cd) pyrene, Naphthalene, Phenanthrene, and Pyrene) and available cyanide was conducted three times post-installation (1-week, 6-months, and 1-year). Analyses were conducted at TRACE Analytical Laboratories, Inc. (Muskegon, MI) using Standard Methods (U.S. EPA, 1993). Reporting detection limits for chromium increased in sensitivity between pre-construction and 1-week post-construction sampling at Behind Mill 1 and Oak Grove 2 sites, changing the detection limit from <0.050 mg/L to <0.005 mg/L. Any values below analytical detection methods were calculated as ½ their detection limits.
Data Analysis
Among-site comparisons were not conducted because these filters were installed on working farms, and therefore experienced different agricultural and natural conditions (including irrigation, groundwater, and precipitation) throughout the sampling period that were outside of our control. Within each site, we tested the effects of the constructed EAF slag filters by pairing inflow and outflow water quality data on each day that we sampled. Data from any given sampling day were not incorporated into statistical tests if inflow/outflow data were unpaired (e.g., no flow conditions on hot dry summer months). SRP, TP, and turbidity samples were analyzed using paired t-tests when data were normally distributed or Wilcoxon signed rank tests when the data were non-normally distributed. Normality assumptions were tested using Shapiro-Wilk tests. Significance was set at α = 0.05. Data analysis was conducted using R (version 3.4.2 R core Team, Vienna, Austria). Percent reductions were calculated for the paired mean inflow and mean outflow measurements post-installation for SRP and TP by calculating the difference between mean inflow and mean outflow concentrations, dividing that number by the mean inflow concentration, and multiplying by 100. Negative percent reduction values indicate an increase in P concentration. Additional statistical information is included in the supplemental table.
Results and Discussion
Pre-Installation Sampling
Pre-installation mean water temperatures varied between sites and ranged from 8.61–13.89°C, with lower mean temperatures associated with Behind Mill 1 and Oak Grove 2, when the majority of sampling occurred in the winter months, whereas most of Fillmore Flex sampling occurred during warmer months (Table 1). Mean DO ranged from 7.86–11.30 mg/L with the lowest mean DO found at Fillmore Flex (Table 1). All sites had similarly circumneutral pH (Table 1). Mean SpCond ranged 676–894 μS/cm, the lowest being at Oak Grove 2, while Behind Mill 1 and Fillmore Flex specific conductivities were similar (Table 1). Mean ORP prior to installation was similar among all sites (Table 1). Mean turbidity was lower at Behind Mill 1 and Oak Grove 2 than at Fillmore Flex, with all sites <25 NTU (Table 1).
Mean pre-installation SRP concentrations at the three sites ranged from 135 to 267 μg/L (Table 2); these sites were selected for installation due to their relatively high initial SRP concentrations, which allowed the slag filters to have the greatest impact on P reduction. Mean TP concentrations ranged from 167 to 721 μg/L (Table 2). Among-site variance was high, reflecting differences in field management, drainage, and time of year sampled. The highest mean P concentrations were measured at Fillmore Flex (Table 2).
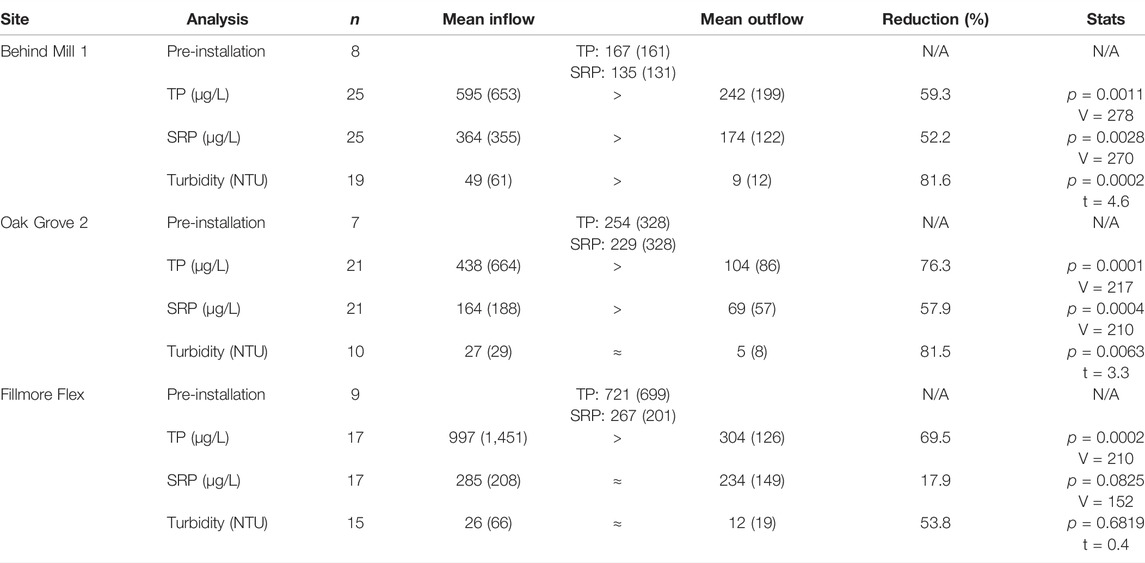
TABLE 2. Mean water quality parameters (1 standard deviation [SD]) for paired inflow and outflow at each site for TP, SRP and Turbidity. Data are shaded to improve readability. n = number of successful sampling events per site. α = 0.05. V = Wilcoxon test statistic; t = test statistic for the t-test. N/A = not applicable.
Post-Installation Sampling
Following installation, mean DO, conductivity, TDS, and ORP showed modest declines in the outflow compared to the inflow (Table 1). In contrast, pH increased in the outflow due to the alkaline nature of EAF slag.
Turbidity declined significantly at Behind Mill 1 and Oak Grove 2, but it increased slightly at Fillmore Flex (Table 2; Figure 5). Reduction in turbidity between inflow and outflow was anticipated as water velocity decreases when water enters the iron slag filter, allowing sediment particles to settle out of the solution before the water reaches the surface waters. The Fillmore Flex outflow pipe is angled and below grade (not pictured). It has been observed to experience backflow from the drainage ditch into the outflow pipe if water levels are sufficiently high. This could result in backflow into the slag filter outflow pipe, which may explain the higher levels of turbidity in the outflow than inflow, as well as the higher variability in the data (Table 1; Figure 5). We did not measure sediment load within the pipes pre-or post-installation.
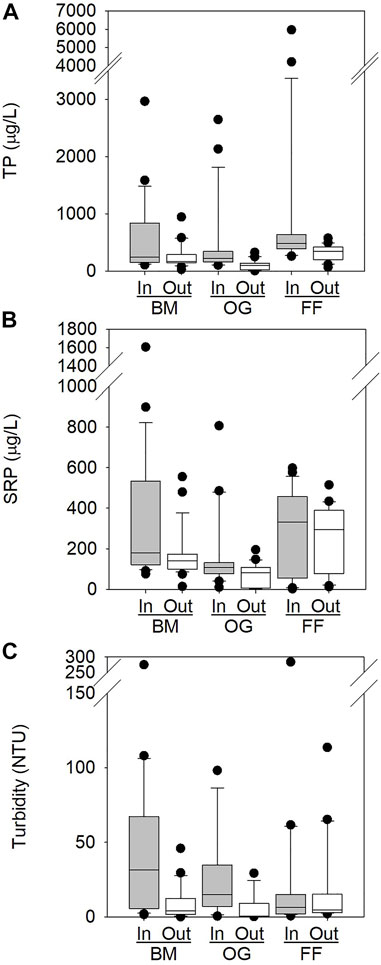
FIGURE 5. Box and whisker plots showing distribution of (A) TP, (B) SRP, and (C) Turbidity of EAF slag filter inflows and outflows. Boxes represent upper quartile (75%), median (50%), and lower quartile (25%) of datasets. Whiskers indicate the maximum and minimum values of datasets excluding outliers, which are shown as dots.
After installation of the slag filters, both SRP and TP decreased in the tile drain effluent: percent reductions of SRP ranged from 57.3% (Oak Grove 2) to 7.4% (Fillmore Flex); percent reductions of TP ranged from 76.5% (Oak Grove 2) to 59.5% (Behind Mill 1) (Table 2; Figure 5). Analysis of paired inflow and outflow samples at each of the sampling sites revealed significant reductions of TP at Behind Mill 1 and Oak Grove 2 and of SRP; Table 2). Fillmore Flex had a marginally significant reduction of SRP and a statistically significant reduction of TP (Table 2; Figure 5).
The EAF slag filter functions by precipitating P with Ca due to the ability of the EAF slag to maintain pH ∼8 and release high concentrations of Ca into solution (Wang et al., 2020). However, Ca-rich and alkaline media such as EAF slag have short lifetimes in P removal structures installed on subsurface drainage such as the current site locations. Briefly, bicarbonate-rich subsurface drainage water precipitates a new Ca carbonate mineral with the Ca-rich and alkaline solution, which not only consumes soluble Ca that would otherwise precipitate with P but also fills the pore space with the new mineral and reduces hydraulic conductivity. Precipitation of the new mineral was visibly evident as a layer formed on the surface of the EAF slag (Figure 4E). The problem of bicarbonate interference was observed in two P removal structures presented by Penn et al. (2020) that utilized EAF slag from the same source as the current study. In the current study and Penn et al. (2020), P removal was initially near 100%, but decreased rapidly with time as a result of the bicarbonate competition with P. As a result, those authors recommended that EAF slag be replaced regularly (at least once per year) if it is to be used to treat subsurface drainage water. In contrast, EAF slag can remove dissolved P for several years from surface runoff due to lesser bicarbonate interference. For example, Gonzalez et al. (2020) removed at least 45% of the two-year cumulative P load with no reduction in flow rate.
There are parallels in the P sorption capacity of these iron slag filters to constructed wetlands (Kadlec, 2006; Vymazal, 2007; Vohla et al., 2011), where chemical adsorption, absorption, and precipitation can remove P from the water stream. The presence of Al, Fe, and Ca increases the P sorption capacity of influent (Xu et al., 2006) although modified biomaterials and industrial byproducts (Carvalho et al., 2011; Vohla et al., 2011; Klimeski et al., 2014), as used in the present study, also have been shown to bind P. The form of the binding material is critical for P binding; for example, CaO is more reactive than CaCO3 (Vohla et al., 2011). Nonetheless, Penn et al. (2017) concluded that Fe-rich sorption materials remove more P per unit mass than Ca-based materials, such as slag and gypsum.
Binding efficiency is influenced both by contact between the filter material and influent and by the hydraulic loading rate (Ronkanen et al., 2016). In this study, contact was enhanced by the upward flow through the EAF slag medium. Hydraulic loading rate of the P removal structure varied as a function of the flow rate within the inflow pipe, hydraulic head, and hydraulic conductivity of the EAF medium. By raising the riser boards on the water table control structure, all drainage was diverted into the P removal structure. For excessively high flow-rate events, this effectively reduces field drainage rate to that of the P removal structure flow rate (i.e. the more limiting rate). If that drainage rate is not acceptable, then the field manager can remove riser boards from the water control structure and allow excess water to by-pass the P removal structure. Based on measurements from another study utilizing the same slag material (Penn et al., 2020), the hydraulic conductivity of the slag bed decreased with time (due to Ca carbonate formation) and therefore decreased the maximum possible flow rate through the P removal structure.
Prior studies have confirmed the ability of iron slag to bind P, with orthophosphate percent removals of 95% in metal-free and mixed-metal solutions of synthetic stormwater (Okochi and McMartin, 2011) and a TP removal percentage of 77% (Shilton et al., 2006) at a treatment plant, although P removal effectiveness dropped off after 5 years, presumably due to saturation of binding sites. It is possible that chemical stripping of P from the iron binding sites, with subsequent recapture of the released P for reuse, would lengthen the slag filters’ period of optimal performance. One knowledge gap of P retention in the iron slag filters is the role of the microbial community; the microbes can be net sinks due to biotic uptake but also can release P via enzymatic or hydrolytic processes (Orihel et al., 2017).
P removal efficiency is also influenced by hydraulic residence time (HRT; Scott and Penn, 2021; Shilton et al., 2013), with longer HRT resulting in more P removal due to enhanced contact time. We were unable to measure HRT in these field-scale P removal filters, but each structure was designed to operate at a 10 min HRT at the maximum flow rate. This means that under most conditions, the HRT was much greater than 10 min. In addition, HRT would increase with time since max flow rate was likely decreasing due to slow clogging attributed to formation of Ca carbonate mineral. Scott and Penn (2021), in experiments using much shorter residence times, found P removal to be much greater at ∼10 min compared to <1 min. They recommended designs that allow for longer contact times between P-rich influent and the P sorption materials, and when that is impractical, Al-coated slags should be used. This principle is similar to alum treatment in lakes to control internal loading of phosphorus (Steinman et al., 2004).
The TP reductions of ∼60–75% in the tile drain effluent represent an important step in meeting the TMDL for Lake Macatawa. However, these reductions equate to mean outflowing TP concentrations of 100–329 μg/L, which are still far above the 50 μg/L goal for Lake Macatawa. There will likely be additional removal of P due to biotic uptake and abiotic adsorption as the nutrient flows downstream to the lake, although it is uncertain to what degree this removal will be offset by additional P sources entering the drainage system. Hence, while EAF slag filters clearly can reduce P, their installation is only part of the solution, and will need to be complemented by other BMPs, and perhaps ultimately, a more holistic public works project involving large-scale chemical inactivation.
Metals and PAHs
Metals were measured during pre-installation and 1-week, 6-months and 1-year post installation at all sites. Behind Mill 1 and Oak Grove 2 were sampled a few months past the 1-year mark because of COVID-19 restrictions. All metals, PAH compounds, and available cyanide were below U.S. Environmental Protection Agency (EPA; source: https://www.epa.gov/dwstandardsregulations/secondary-drinking-water-standards-guidance-nuisance-chemicals) and World Health Organization (WHO; source: https://www.wqa.org/learn-about-water/common-contaminants) standards for drinking water. Recreational water standards are unavailable.
Mercury was below 12 ng/L for all sites, which is two orders of magnitude below the drinking water standards for 2,000 ng/L (EPA) and 6,000 ng/L (WHO). Behind Mill 1 showed a slight increase in mercury concentration between pre-installation and 6-month post-installation, although the 1-year post installation concentration was below pre-installation. Oak Grove 2 and Fillmore Flex remained relatively steady, with Fillmore Flex having the highest levels (Figure 6A). Arsenic was found in detectable amounts only at Fillmore Flex pre-installation and was below both the EPA and WHO standard of 0.010 mg/L (Figure 6B). Barium was below detection at the 1-week post installation samplings at Behind Mill 1 and Oak Grove 2 and at the 1-year date at Fillmore Flex, with all samples well below the drinking standards of 2.0 mg/L (EPA) and 0.7 mg/L (WHO). Behind Mill 1 and Oak Grove 2 had similar although reduced values, where Fillmore Flex experienced a decline in concentrations over time to below detection (Figure 6C). Chromium was detected 1-week post installation at Oak Grove 2 and Fillmore Flex, and 1-year post installation only at Fillmore Flex, but all were below both the EPA (0.10 mg/L) and WHO (0.05 mg/L) standards (Figure 6D).
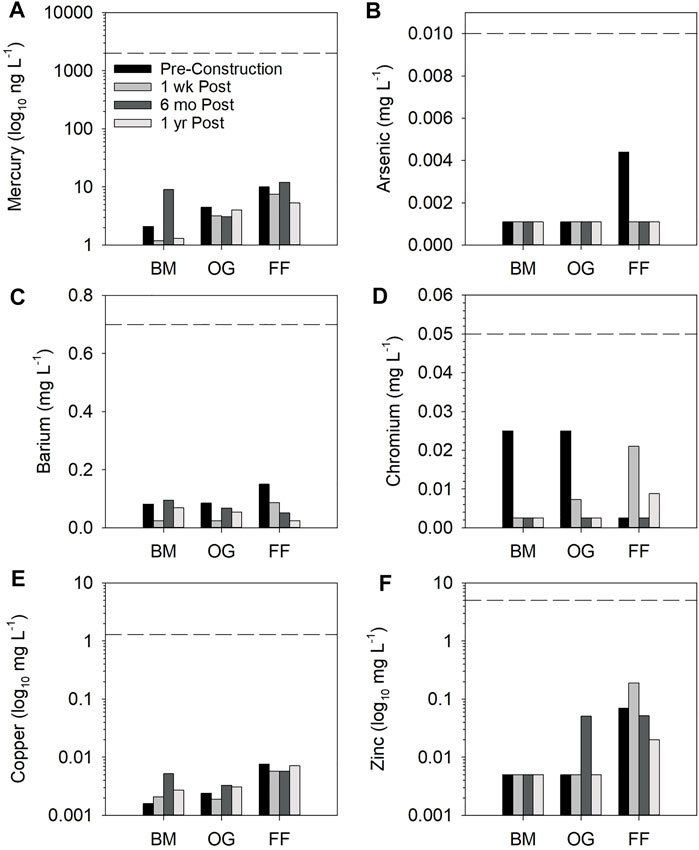
FIGURE 6. Metals for pre-installation, 1-week, 6-month and 1-year post installation at Behind Mill 1 (BM), Oak Grove 2 (OG), and Fillmore Flex (FF). The black dashed line represents the drinking water standard from either the EPA or WHO, whichever was the smaller of the two standards for the given chemical. The legend in (A) applies to (B–F). Note: y-axes for panel (A), (E), and (F) have logarithmic scale.
Copper concentrations increased at Behind Mill 1 and Oak Grove 2 from pre-installation to 1-year post installation, while Fillmore Flex copper levels declined from pre- to 1-year post installation (Figure 6E), although absolute concentrations were very low and well below both the EPA (1.0 mg/L) and WHO (2.0 mg/L) standards. Nonetheless, copper was the only metal shown to inhibit P removal in a study examining the effect of common metals on P removal using EAF slag (Okochi and McMartin, 2011). Zinc was above the detection level only at Oak Grove 2 in the 6-month post-installation sample but was always detected for Filmore Flex. The highest concentration was found 1-week post installation, although there was an overall 71% reduction from pre- to 1-year post (Figure 6F). Again, all the levels for zinc found were below the EPA standard (5.0 mg/L), while the WHO does not have a limit established.
Cadmium, cobalt, lead, molybdenum, nickel, selenium, silver, Naphthalene, 2-Methylnaphthalene, Acenaphthylene, Acenaphthene, Fluorene, Phenanthrene, Anthracene, Fluoranthene, Pyrene, Benzo (a) anthracene, Chrysene, Benzo (b) fluoranthene, Benzo (k) fluoranthene, Benzo (a) pyrene, Indeno (1,2,3-cd) pyrene, Dibenz (a,h) anthracene, Benzo (g,h,i) perylene, Nitrobenzene-d5, 2-Fluorobiphenyl, and Terphenyl-d14, were all below detection limits for all sites and sampling dates (data not shown). Cyanide (available) was detectable only at Fillmore Flex at 6-month post installation (0.0027 mg/L).
Studies have shown that there are no detrimental effects to human health or to the environment as a result of leaching from steel slags. Due to the very high temperatures applied in their formation, heavy metals are bound tightly together within the slag matrix (Proctor et al., 2002; Shilton et al., 2006; Johansson Westholm, 2010), which is consistent with our data.
Summary
The fate and transport of P across the landscape, as the nutrient moves from land to sea, is dependent on a variety of factors. The first consideration is the form of P in the terrestrial environment; is it organic (e.g., manure) or inorganic (e.g., chemical fertilizer), and is it particulate or dissolved? Obviously, dissolved P will travel faster than particulate P, assuming no adsorption or uptake. The second consideration is once it reaches an aquatic medium, does the P move overland, via groundwater, or through subsurface tile drains. The rate of P movement, as well as its fate (transformation), will be strongly influenced by its mode of transport. Finally, once it reaches a receiving water body, what is the distance the P must travel before it reaches the marine environment? A phosphate molecule delivered from the Macatawa Watershed and into Lake Michigan has a much longer journey to reach the marine environs of the Gulf of St. Lawrence, with greater opportunities for transformation and deposition, than a phosphate ion in stormwater that runs off the Jefferson Memorial in Washington, DC and travels down the Potomac River to Chesapeake Bay. But irrespective of form, transport, or distance, managing and controlling P at its source is absolutely necessary to reduce eutrophication of water bodies.
The EAF slag filters assessed as part of this study have shown that after 1 year of performance, they are effective at removing P from tile drain effluent. We observed considerable variation in the percent reduction among the three sites, indicating the importance of site selection and environmental context in their P reduction effectiveness, which is consistent with findings from other studies (Penn et al., 2017; Hauda et al., 2020). While overall P removal performance during the 1-year observation period was appreciable, P removal decreased rapidly with time, presumably due to bicarbonate interference as observed by Penn et al. (2020) and in laboratory studies conducted with increasing inflow bicarbonate concentrations (Kordijazi, 2021). For this reason, EAF slag is best utilized for treating surface runoff rather than subsurface drainage (Gonzalez et al., 2020). For treatment of subsurface drainage, it is better to utilize Al and Fe-based filter media. If subsurface drainage is to be treated with EAF slag, plan on replacing the media at least annually.
Although both the percent and absolute reductions in P were substantial, they were still well above the 50 μg/L TMDL goal. Encouragingly, there was no indication that the EAF slag is releasing toxic metals, PAH compounds, or cyanide at levels that would cause concerns for drinking water standards. To maximize performance effectiveness, we recommend that the installation of EAF slag filters should be targeted to areas where tile drain effluent SRP levels exceed 250 μg/L. Continued monitoring will determine how long they remain effective at reducing P. While they are not a panacea, when installed in combination with other BMPs, EAF slag filters can play an important localized role in reducing P in watersheds that are underlain with tile drains.
Data Availability Statement
The raw data supporting the conclusions of this article will be made available by the authors, without undue reservation.
Author Contributions
AS conceived of the research and its design, led the manuscript writing, and was responsible for acquisition of funding. MH assisted with field collections, lab processing, data analysis, and manuscript writing. MO led the field collections and assisted with lab processing, data analysis, and manuscript writing. CP conceived the slag filter design, reviewed and helped write the manuscript.
Funding
This work was funded by the Michigan Department of Agriculture and Rural Development (Grant #190000000158), with additional funding from Project Clarity as part of the ODC Network and the Allen and Helen Hunting Research and Innovation Fund held at the Annis Water Resources Institute.
Conflict of Interest
The authors declare that the research was conducted in the absence of any commercial or financial relationships that could be construed as a potential conflict of interest.
Publisher’s Note
All claims expressed in this article are solely those of the authors and do not necessarily represent those of their affiliated organizations, or those of the publisher, the editors and the reviewers. Any product that may be evaluated in this article, or claim that may be made by its manufacturer, is not guaranteed or endorsed by the publisher.
Acknowledgments
Our sincere thanks to Travis Williams, Dan Callam, Rob Vink, and David Nyitray of the ODC Network for all their help and knowledge of the area, as well as the other partners of Project Clarity including Kelly Goward and Steve Bulthuis formerly of the MACC, Todd Losee and Steve Niswander of Niswander Environmental, Aaron Best, Sarah Brokus, and Randy Wade of Hope College, and the Dykhuis Farms and their family for sampling access and participation in this project. We gratefully acknowledge the AWRI field and lab support provided by Emily Kindervater, Rachel Orzechowski, and Hannah Sholke. Brian Scull preformed P analysis in the laboratory. Two reviewers provided helpful comments and we express our appreciation to Solange Duhamel for her invitation to participate in this research topic.
References
Boesch, D. F. (2019). Barriers and Bridges in Abating Coastal Eutrophication. Front. Mar. Sci. 6, 123. doi:10.3389/fmars.2019.00123
Calhoun, F. G., Baker, D. B., and Slater, B. K. (2002). Soils, Water Quality, and Watershed Size. J. Environ. Qual. 31, 47–53. doi:10.2134/jeq2002.4700a10.2134/jeq2002.0047
Carpenter, S. R., Caraco, N. F., Correll, D. L., Howarth, R. W., Sharpley, A. N., and Smith, V. H. (1998). Nonpoint Pollution of Surface Waters with Phosphorus and Nitrogen. Ecol. Appl. 8, 559–568. doi:10.1890/1051-0761(1998)008[0559:nposww]2.0.co;2
Carvalho, W. S., Martins, D. F., Gomes, F. R., Leite, I. R., Gustavo da Silva, L., Ruggiero, R., et al. (2011). Phosphate Adsorption on Chemically Modified Sugarcane Bagasse Fibres. Biomass and Bioenergy 35, 3913–3919. doi:10.1016/j.biombioe.2011.06.014
Clement, D. R., and Steinman, A. D. (2017). Phosphorus Loading and Ecological Impacts from Agricultural Tile Drains in a West Michigan Watershed. J. Great Lakes Res. 43 (1), 50–58. doi:10.1016/j.jglr.2016.10.016
Fumero, J. J., and Rizzardi, K. W. (2000). The Everglades Ecosystem: from Engineering to Litigation to Consensus-Based Restoration. Thomas L. Rev. 13, 667–696.
Gonzalez, J. M., Penn, C. J., and Livingston, S. J. (2020). Utilization of Steel Slag in Blind Inlets for Dissolved Phosphorus Removal. Water. 12 (6), 1593. doi:10.3390/w12061593
Hauda, J. K., Safferman, S. I., and Ghane, E. (2020). Adsorption media for the Removal of Soluble Phosphorus from Subsurface Drainage Water. Ijerph 17 (20), 7693. doi:10.3390/ijerph17207693
Hua, G., Salo, M. W., Schmit, C. G., and Hay, C. H. (2016). Nitrate and Phosphate Removal from Agricultural Subsurface Drainage Using Laboratory Woodchip Bioreactors and Recycled Steel Byproduct Filters. Water Res. 102, 180–189. doi:10.1016/j.watres.2016.06.022
Iavorivska, L., Veith, T. L., Cibin, R., Preisendanz, H. E., and Steinman, A. D. (2021). Mitigating lake Eutrophication through Stakeholder-Driven Hydrologic Modeling of Agricultural Conservation Practices: A Case Study of Lake Macatawa, Michigan. J. Great Lakes Res. 47 (6), 1710–1725. doi:10.1016/j.jglr.2021.10.001
Johansson Westholm, L. (2010). The Use of Blast Furnace Slag for Removal of Phosphorus from Wastewater in Sweden-A Review. Water 2, 826–837. doi:10.3390/w2040826
Kadlec, R. H. (2006). Free Surface Wetlands for Phosphorus Removal: the Position of the Everglades Nutrient Removal Project. Ecol. Eng. 27, 361–379. doi:10.1016/j.ecoleng.2006.05.019
Kindervater, E., and Steinman, A. D. (2019). Two‐Stage Agricultural Ditch Sediments Act as Phosphorus Sinks in West Michigan. J. Am. Water Resour. Assoc. 55, 1183–1195. doi:10.1111/1752-1688.12763
King, K. W., Williams, M. R., and Fausey, N. R. (2015). Contributions of Systematic Tile Drainage to Watershed-Scale Phosphorus Transport. J. Environ. Qual. 44, 486–494. doi:10.2134/jeq2014.04.0149
Klimeski, A., Uusitalo, R., and Turtola, E. (2014). Screening of Ca- and Fe-Rich Materials for Their Applicability as Phosphate-Retaining Filters. Ecol. Eng. 68, 143–154. doi:10.1016/j.ecoleng.2014.03.054
Kordijazi, A. (2021). Applying a Statistical Approach to Develop a Sustainable Technology for Capturing Phosphorous from an Agricultural Tile Drainage System Using By-Product Phosphorous Sorbing Materials (PSM). Milwaukee, WI: University of Wisconsin-Milwaukee.
Michalak, A. M., Anderson, E. J., Beletsky, D., Boland, S., Bosch, N. S., Bridgeman, T. B., et al. (2013). Record-setting Algal Bloom in Lake Erie Caused by Agricultural and Meteorological Trends Consistent with Expected Future Conditions. Proc. Natl. Acad. Sci. 110, 6448–6452. doi:10.1073/pnas.1216006110
Michaud, A. R., Poirier, S.-C., and Whalen, J. K. (2019). Tile Drainage as a Hydrologic Pathway for Phosphorus export from an Agricultural Subwatershed. J. Environ. Qual. 48 (1), 64–72. doi:10.2134/jeq2018.03.0104
Mrdjen, I., Fennessy, S., Schaal, A., Dennis, R., Slonczewski, J. L., Lee, S., et al. (2018). Tile Drainage and Anthropogenic Land Use Contribute to Harmful Algal Blooms and Microbiota Shifts in Inland Water Bodies. Environ. Sci. Technol. 52 (15), 8215–8223. doi:10.1021/acs.est.8b03269
MWP (Macatawa Watershed Project) (2012). Macatawa Watershed Management Plan. Holland, Michigan: Macatawa Area Coordinating Council.Available at: http://www.the-macc.org/wp-content/uploads/Macatawa-Watershed-Mgt-Plan_FINAL-NARRATIVE.pdf (Accessed January 4, 2022).
Okochi, N. C., and McMartin, D. W. (2011). Laboratory Investigations of Stormwater Remediation via Slag: Effects of Metals on Phosphorus Removal. J. Hazard. Mater. 187, 250–257. doi:10.1016/j.jhazmat.2011.01.015
Orihel, D. M., Baulch, H. M., Casson, N. J., North, R. L., Parsons, C. T., Seckar, D. C. M., et al. (2017). Internal Phosphorus Loading in Canadian Fresh Waters: a Critical Review and Data Analysis. Can. J. Fish. Aquat. Sci. 74, 2005–2029. doi:10.1139/cjfas-2016-0500
Paerl, H. W., Scott, J. T., McCarthy, M. J., Newell, S. E., Gardner, W. S., Havens, K. E., et al. (2016). It Takes Two to Tango: When and where Dual Nutrient (N & P) Reductions Are Needed to Protect Lakes and Downstream Ecosystems. Environ. Sci. Technol. 50, 10805–10813. doi:10.1021/acs.est.6b02575
Penn, C., Chagas, I., Klimeski, A., and Lyngsie, G. (2017). A Review of Phosphorus Removal Structures: How to Assess and Compare Their Performance. Water 9 (8), 583. doi:10.3390/w9080583
Penn, C., Livingston, S., Shedekar, V., King, K., and Williams, M. (2020). Performance of Field-Scale Phosphorus Removal Structures Utilizing Steel Slag for Treatment of Subsurface Drainage. Water 12, 443. doi:10.3390/w12020443
Penn, C. J., and Bowen, J. M. (2017). Design and Construction of Phosphorus Removal Structures for Improving Water Quality. Switzerland: Springer.
Penn, C. J., Frankenberger, J., and Livingston, S. (2021). Introduction to P‐TRAP Software for Designing Phosphorus Removal Structures. Agric. Environ. Lett. 6 (1), e20043. doi:10.1002/ael2.20043
Proctor, D. M., Shay, E. C., Fehling, K. A., and Finley, B. L. (2002). Assessment of Human Health and Ecological Risks Posed by the Uses of Steel-Industry Slags in the Environment. Hum. Ecol. Risk Assess. Int. J. 8, 681–711. doi:10.1080/20028091057150
Ronkanen, A.-K., Marttila, H., Celebi, A., and Kløve, B. (2016). The Role of Aluminium and Iron in Phosphorus Removal by Treatment Peatlands. Ecol. Eng. 86, 190–201. doi:10.1016/j.ecoleng.2015.11.011
Roychand, R., Kumar Pramanik, B., Zhang, G., and Setunge, S. (2020). Recycling Steel Slag from Municipal Wastewater Treatment Plants into concrete Applications - A Step towards Circular Economy. Resour. Conservation Recycling 152, 104533. doi:10.1016/j.resconrec.2019.104533
Scott, I. S. P. C., and Penn, C. J. (2021). Estimating the Variability of Steel Slag Properties and Their Influence in Phosphorus Removal Ability. Chemosphere 276, 130205. doi:10.1016/j.chemosphere.2021.130205
Shilton, A., Chen, L., Elemetri, I., Pratt, C., and Pratt, S. (2013). Active Slag Filters: Rapid Assessment of Phosphorus Removal Efficiency from Effluent as a Function of Retention Time. Environ. Tech. 34, 195–200. doi:10.1080/09593330.2012.689365
Shilton, A. N., Elmetri, I., Drizo, A., Pratt, S., Haverkamp, R. G., and Bilby, S. C. (2006). Phosphorus Removal by an 'active' Slag Filter-A Decade of Full Scale Experience. Water Res. 40, 113–118. doi:10.1016/j.watres.2005.11.002
Smith, D. R., King, K. W., Johnson, L., Francesconi, W., Richards, P., Baker, D., et al. (2015). Surface Runoff and Tile Drainage Transport of Phosphorus in the Midwestern United States. J. Environ. Qual. 44, 495–502. doi:10.2134/jeq2014.04.0176
Soranno, P. A., Cheruvelil, K. S., Wagner, T., Webster, K. E., and Bremigan, M. T. (2015). Effects of Land Use on lake Nutrients: the Importance of Scale, Hydrologic Connectivity, and Region. PLoS One 10, e0135454. doi:10.1371/journal.pone.0135454
Steinman, A. D., Hassett, M., and Oudsema, M. (2018). Effectiveness of Best Management Practices to Reduce Phosphorus Loading to a Highly Eutrophic lake. Ijerph 15, 2111. doi:10.3390/ijerph15102111
Steinman, A., Rediske, R., and Reddy, K. R. (2004). The Reduction of Internal Phosphorus Loading Using Alum in Spring Lake, Michigan. J. Environ. Qual. 33, 2040–2048. doi:10.2134/jeq2004.2040
Stoner, D., Penn, C., McGrath, J., and Warren, J. (2012). Phosphorus Removal with By‐Products in a Flow‐Through Setting. J. Environ. Qual. 41 (3), 654–663. doi:10.2134/jeq2011.0049
U.S. EPA (1993). Methods for Chemical Analysis of Inorganic Substances in Environmental Samples. EPA600/4-79R-93-020/100.
Vohla, C., Kõiv, M., Bavor, H. J., Chazarenc, F., and Mander, Ü. (2011). Filter Materials for Phosphorus Removal from Wastewater in Treatment Wetlands-A Review. Ecol. Eng. 37, 70–89. doi:10.1016/j.ecoleng.2009.08.003
Vymazal, J. (2007). Removal of Nutrients in Various Types of Constructed Wetlands. Sci. Total Environ. 380, 48–65. doi:10.1016/j.scitotenv.2006.09.014
Walterhouse, M. (1999). Total Maximum Daily Load for Phosphorus in Lake Macatawa, January 20, 1999. MDEQ Submittal to U.S. Environmental Protection Agency. Available at: https://www.michigan.gov/documents/deq/wrd-swas-tmdl-macatawa_451047_7.pdf (Accessed January 4, 2022).
Wang, L., Penn, C., Huang, C. H., Livingston, S., and Yan, J. (2020). Using Steel Slag for Dissolved Phosphorus Removal: Insights from a Designed Flow-Through Laboratory Experimental Structure. Water 12 (5), 1236. doi:10.3390/w12051236
Wurtsbaugh, W. A., Paerl, H. W., and Dodds, W. K. (2019). Nutrients, Eutrophication and Harmful Algal Blooms along the Freshwater to marine Continuum. WIREs Water 6, e1373. doi:10.1002/wat2.1373
Wynne, T., and Stumpf, R. (2015). Spatial and Temporal Patterns in the Seasonal Distribution of Toxic Cyanobacteria in Western Lake Erie from 2002-2014. Toxins 7, 1649–1663. doi:10.3390/toxins7051649
Keywords: phosphorus, slag filters, Great Lakes, tile drains, eutrophication, TMDL
Citation: Steinman AD, Hassett M, Oudsema M and Penn CJ (2022) Reduction of Phosphorus Using Electric Arc Furnace Slag Filters in the Macatawa Watershed (Michigan). Front. Environ. Sci. 10:863137. doi: 10.3389/fenvs.2022.863137
Received: 26 January 2022; Accepted: 28 February 2022;
Published: 05 April 2022.
Edited by:
Solange Duhamel, University of Arizona, United StatesReviewed by:
J. David Allan, University of Michigan, United StatesÜlo Mander, University of Tartu, Estonia
Copyright © 2022 Steinman, Hassett, Oudsema and Penn. This is an open-access article distributed under the terms of the Creative Commons Attribution License (CC BY). The use, distribution or reproduction in other forums is permitted, provided the original author(s) and the copyright owner(s) are credited and that the original publication in this journal is cited, in accordance with accepted academic practice. No use, distribution or reproduction is permitted which does not comply with these terms.
*Correspondence: Alan D. Steinman, c3RlaW5tYWFAZ3ZzdS5lZHU=