- 1School of Economics and Management, North China University of Technology, Beijing, China
- 2Business School, Aalborg University, Aalborg, Denmark
Improving urban ecological efficiency is an integral part of ecological protection and high-quality development of the Yellow River Basin. We used the super-efficiency slacks-based model with unexpected output to measure the ecological efficiency of 62 prefecture-level cities in the Yellow River Basin from 2005 to 2018. Its spatial distribution characteristics and convergence are discussed. The influencing factors and spatial spillovers of the ecological efficiency are assessed through the spatial Dubin model. The results show that: 1) The ecological efficiency is highest in cities in the lower reaches of the Yellow River Basin, mid-level in the upper reaches, and lowest in the middle reaches. 2) There is no σ convergence in the ecological efficiency of the Yellow River Basin, but there is absolute β convergence and conditional β convergence. 3) Economic development, financial development, and technological innovation significantly promote ecological efficiency, and the spatial spillover effects are significant. Increased connection with the outside world can significantly improve ecological efficiency, but there is no apparent spatial spillover effect for these connections. The industrial structure and urbanization rate reduced ecological efficiency and have a significant negative spillover effect. The energy consumption structure reduces the level of ecological efficiency, and the spillover effect is not significant.
1 Introduction
China has identified ecological protection and high-quality development in the Yellow River Basin as among its critical national strategies (Symposium on Ecological Protection and High-quality Development in the Yellow River Basin, 2019). The Yellow River Basin, although rich in resources, is characterized by large gaps in regional economic development levels, a fragile ecological environment, and large differences in natural resource endowments among different regions. These issues pose severe challenges to sustainable development. Strengthening ecological protection and management, and continuously improving ecological efficiency, have become inevitable choices for the sustainable development of the Yellow River Basin. The term “eco-efficiency” was first proposed by German scholars Schaltegger and Sturm (1990) and is promoted by the Organisation for Economic Co-operation and Development (OECD). According to the OECD (1998), the target of eco-efficiency is a typical input-output process that can achieve more economic value with fewer environmental impacts. Estimating the ecological efficiency value, analyzing spatial distribution characteristics, influencing factors, and spatial spillover effects are imperative to provide a reference for the government to formulate effective ecological protection and high-quality development policies.
The existing methods of measuring ecological efficiency include the single ratio method, data envelopment analysis (DEA), stochastic frontier analysis (SFA), and parameter analysis. In the ratio method, ecological efficiency is the ratio of the ecological cost of a product or service to the actual market price (Vogtländer et al., 2002). The ratio method is relatively simple and cannot distinguish the impact on different environments, making it challenging to measure ecological efficiency comprehensively. It is necessary to use multiple input-output indicators and form a more comprehensive evaluation system (Wang et al., 2011). DEA and SFA have the advantage of objective weighting, so they are widely used to measure ecological efficiency (Huang et al., 2014; Orea and Wall, 2017; Yue et al., 2017). In addition, some scholars use ecological footprints (Yang and Yang, 2019), life cycle assessments (Avadí et al., 2014; Lorenzo-Toja et al., 2015; Beltrán-Estevea et al., 2017), and other methods. The outcomes of different models and methods have different coverage and accuracy. The measurement results of the basic DEA model are not comprehensive, so researchers have put forward two-stage and three-stage DEA methods (Zhang et al., 2017; Shao et al., 2019).
In order to study the evolution of ecological efficiency gap, we need to conduct convergence analysis. Xu et al. (2021) found a severe ecological imbalance in 11 eastern and western provinces along the Yangtze River Economic Belt. Camarero et al. (2013) assessed the convergence in eco-efficiency of a group of 22 OECD countries over the period 1980–2008 and found that both the most eco-efficient countries (and the worst) tend to form groups of convergence. Kounetas et al. (2021) used the nonparametric distribution dynamics method based on a Markov chain to study the convergent and divergent hypothesis of ecological efficiency of American states from 1990 to 2017; they revealed the existence of regional clusters and at least two convergence groups in the United States. Huang et al. (2018) found that the ecological efficiency of urban agglomerations has an echo effect on the ecological efficiency of non-urban agglomerations and reduces the convergence rate of ecological efficiency.
After understanding the spatial distribution characteristics and trends of ecological efficiency, it is necessary to explore its underlying driving mechanisms. This branch of literature has identified some main factors are scale, structure, technology, economy, and policy. Chen W. et al. (2020) found that better innovation could improve the ecological efficiency of cities in China. There was a U-shaped relationship between educational investment in innovative talents and urban ecological efficiency, whereas there was an inverted U-shaped relationship between capital investment and innovation performance. Dan et al. (2021) found that the impact of economic development level and urbanization on the ecological efficiency of western Chinese cities was U-shaped, and the proportion of the secondary industry, FDI, trade activities, environmental regulations, and technological innovation capacity had a positive impact on the ecological efficiency. Tong et al. (2020) applied the panel smooth transition regression (PSTR) model and found that FDI harms ecological efficiency at low economic development levels, and it promotes the improvement of ecological efficiency when the economic level exceeds a certain threshold. Zhou et al. (2018) estimated the eco-efficiency of 21 cities in Guangdong province over the period 2005–2014 and found that technical innovation had the greatest positive influence on eco-efficiency, followed by government regulation, openness, and population density.
Spatial spillover and diffusion effects of geospatial factors on inter-regional ecological efficiency are becoming increasingly evident. It is difficult to fully understand the causes of differences in ecological efficiency only from a single region’s development mode and characteristics. It is useful to start from the perspective of a whole system, considering the impact of spatial interactions between regions on the efficiency differences and their related mechanisms. Zhou et al. (2019) discussed eco-efficiency using data envelopment analysis on 48 cities in Bohai Rim and suggested negative spillover effects of industrial structure upgrades on surrounding cities, which reflects an industry transfer phenomenon related to eco-efficiency. Peng et al. (2020) studied a spatial correlation network and its characteristics of energy eco-efficiency and found spatial heterogeneity in energy eco-efficiency. However, the spatial correlation network was unevenly distributed, and the spillover effect between areas was relatively low. Chen P. et al. (2020) found that environmental regulation has a significant positive impact on the ecological efficiency of neighboring cities, and the significant increase in the ratio of direct and indirect effects of industrial structure upgrading and technological progress indicates that the positive spatial externalities of the two are enhanced. Yao et al. (2021) used panel data of Chinese provinces and found that local social urbanization inhibits the ecological efficiency of surrounding areas, whereas the local urbanization level could promote the ecological efficiency of surrounding areas.
High-quality development and ecological protection in the Yellow River Basin are important development targets in China, and thus the ecological efficiency of the Yellow River basin has become a focal research area. Sun (2020) calculated the energy ecological efficiency considering the unexpected output with the SBM-DEA model, discussed the spatial difference of different regions in the Yellow River Basin, and analyzed the internal and external influence of factors. Chen M. et al. (2020) analyzed the influencing factors of the ecological efficiency of the Yellow River Basin and put forward policy recommendations for the upper, middle, and lower reaches. Li et al. (2021) measured industrial eco-efficiency with the super-SBM model, analyzed the spatial differentiation characteristics, and investigated the influencing factors of industrial eco-efficiency with an econometric model. Yan and Tu (2021) divided the resource-based cities in the Yellow River Basin into four types and analyzed the heterogeneity of their ecological efficiency. Chen et al. (2021) constructed a MINDs model and explored the spatial difference and dynamic evolution of eco-efficiency using a Dagum-Gini coefficient and kernel density estimation method. With this, they investigated the driving factors of the spatio-temporal evolution of eco-efficiency with a geographical component.
Building on existing research, this paper attempts to supplement research on the ecological efficiency of the Yellow River Basin in the following aspects. First, in terms of research content, the ecological efficiency convergence and spatial spillover effects in the upper, middle, and lower reaches of the Yellow River Basin are analyzed, providing for more spatially-explicit insights. Therefore, this paper analyzes the convergence of ecological efficiency, to provide a theoretical basis for the coordinated development of cities in the Yellow River Basin. The Basin has a large spatial span, and the similarities in upstream and downstream reaches can be relatively small. Therefore, this paper analyzes the spatial spillover effects of the ecological efficiency both for the Yellow River Basin as a whole and for individual reaches. Second, in terms of research methods, the geographic economic weight matrix and the geographic economic-nested weight matrix are used for spatial econometric analysis of key influencing factors. Simple geographic distance metrics cannot explain the economic significance of certain variables and their regional relevance in economic development. Therefore, this paper extends the spatial geographic weight matrix, with geographic proximity and economic proximity, an approach that may help identify the most important influencing factors in the Basin.
2 Materials and Methods
2.1 Study Area
For the Yellow River Basin, we selected the prefecture-level cities that the Yellow River main channel flows through and the prefecture-level cities that are adjacent. Based on data availability, the research samples included 62 cities in eight provinces. The samples were divided into three regions: upstream areas, (including Qinghai, Gansu, and Ningxia), midstream areas (including Shanxi, Shaanxi, and Inner Mongolia), and downstream areas (including Henan and Shandon, according to the “Sustainable Development Planning of the National Resource-Based Cities (2013–2030)” issued by the State Council of China (2013) (see Table 1).
2.2 Research Method
2.2.1 Super Efficiency SBM Model
This paper uses the super efficiency, SBM, undesirable model improved by Tone (2002) to calculate the ecological efficiency. The model includes slack variables and uses unexpected output as input to overcome the problem of ignoring additional environmental and resource factors in measuring efficiency. Additionally, the super-efficiency model solves the ranking problem of effective decision-making units to reflect the essence of the ecological efficiency of cities. Assuming that the ecological efficiency of n decision-making units (DMUs) is measured, each DMU has m inputs, represented as xi (i = 1, 2,..., m) and q outputs, in which the expected output is represented as yr (r = 1, 2,..., q1) and the unexpected output is recorded as bt (t = 1, 2,..., q2). As such, the super efficiency SBM model is:
In Eq. 1, ρ is the relative efficiency value of the kth decision-making unit, si-, sr+, stb- represent the slack variables of the input variable, expected output, and unexpected output, respectively, xij is the ith input of the jth decision-making unit, yrj is the rth expected output of the jth decision-making unit, btj is the tth unexpected output of the jth decision-making unit, and λj is the weight of the jth decision-making unit. If ρ ≥ 1, the DMU has reached DEA validity, and the larger the DEA, the better the coordination between resource utilization and ecological protection. If 0 < ρ < 1, DMU has not reached DEA validity.
2.2.2 Convergence Analysis Method
2.2.2.1 σ Convergence
The σ convergence is used to reflect the dynamic evolution of a research object deviating from an overall development level over time. In our case, it is used to analyze whether the ecological efficiency gap of different research objects in the region shrinks over time and whether there is a trend between low-value cities to high-value cities. In this study, the σ convergence of ecological efficiency is calculated by the σ index (Rezitis, 2010). The formula is:
where N represents the number of prefecture-level cities, and
2.2.2.2 Absolute β Convergence
Absolute β convergence indicates that as time passes, the lagging DMU catches up with the leading DMU because of its higher growth rate, and eventually, each DMU moves to the same steady-state level. In other words, the ecological efficiency of cities can reach the same value as that of advanced cities through a faster growth rate. The model of absolute β convergence is (Barro and Sala-I-Martin, 1997):
where EEi,0 and EEi,T represent the eco-efficiency value of the ith prefecture-level city at the initial stage and the T stage, respectively, ln (EEi,T/EEi,0)/T represents the annual average growth rate of ecological efficiency of the ith prefecture-level city from the initial stage to T period, α is a constant, β is the coefficient of initial ecological efficiency, and εi,t is the random error term. If β < 0 and is significant, the growth rate of eco-efficiency in each region is inversely proportional to the initial eco-efficiency level, that is, absolute β convergence exists. Conversely, if β > 0 and is significant, there is no absolute β convergence. The speed λ of absolute β convergence can be expressed as:
2.2.2.3 Conditional β Convergence
Conditional β convergence assumes that the economic basis and characteristics of each region are different, and each region will develop along with its steady-state level, but the absolute differences of variables between regions always exist (Barro and Sala-I-Martin, 1992). From the above analysis, it can be seen that under the assumption of the same economic basis in all regions, the ecological efficiency of the overall, the upper, the middle, and the lower reaches of the Yellow River Basin cannot reach the same steady-state growth level. Therefore, to better understand the real-world situation, it is necessary to test the conditional β convergence of ecological efficiency of the overall system and upper, middle, lower reaches.
Two methods of conditional β convergence test are used in the existing literature. One is to add explanatory variables to the absolute β convergence regression model and test them based on manipulating these variables. The second is the panel data fixed-effect model. The panel data fixed-effect model cannot analyze the impact of various influencing factors on ecological efficiency convergence but we resolve this issue in the subsequent sections of this paper. Therefore, this study uses the panel data fixed-effect model for the conditional β convergence test. The advantages of this model are: 1) There is no need to add explanatory variables, which avoids the subjectivity and incompleteness of selecting variables, and 2) It can avoid the multicollinearity problem caused by too many variables. The conditional β convergence model constructed in this paper is:
where EEi,t-1 and EEi,t represent the eco-efficiency values of the ith prefecture-level city in period t and t-1, respectively; ln (EEi,t/EEi,t-1)/T represents the annual average growth rate of ecological efficiency of the ith prefecture-level city from period t-1 to period t; T is the time interval between two periods; α is a constant; β is the coefficient of initial ecological efficiency; and εi,t is the random error term. If β < 0 and is significant, the growth rate of ecological efficiency in each region is inversely proportional to the initial level of ecological efficiency. That is, there is conditional β convergence, which means that ecological efficiency in different regions will reach different steady-state levels over time due to differences in geographical environment, economic development level, or other factors. This situation can confirm the existence of a development gap between the eco-efficiency level of advanced and under-developed economic regions during the study period. Conversely, if β > 0 and is significant, there is no conditional β convergence.
2.2.3 Spatial Autocorrelation Analysis Method
With the development of regional economics, people realized that urban development in different regions was not independent, and there were key linkages among cities. Spatial effect theory addresses these patterns and the Moran index can be used to measure spatial correlation. The formula is as follows:
where
To systematically investigate the spatial autocorrelation of ecological efficiency in the Yellow River Basin, the following four spatial weight matrices are constructed. The first is the common geographical distance weight matrix (W1), whose element wij represents the reciprocal of the nearest highway mileage of city i and city j. To reflect the correlation between regional economies, the geographic adjacent term is expanded to economic terms, and the economic distance weight matrix (W2), geographic-economic weight matrix (W3), and geographic-economic-nested weight matrix (W4) is constructed. The element wij of W2 is expressed by the reciprocal of the absolute difference between the annual mean of per capita GDP of region i and region j. The element of W3 is the product of the reciprocal of the nearest highway mileage of the provincial capitals in region i and region j and the reciprocal of the absolute difference between the annual mean of per capita GDP of region i and that of region j. W4 = φW1 + (1-φ) W2, and φ is between 0 and 1, indicating the proportion of the geographical distance weight matrix. To simplify the analysis, the value of φ in this paper is 0.5.
The global Moran index examines the spatial agglomeration of the whole region. To observe the spatial agglomeration around a particular region, local Moran’s I can be used, and the specific form is shown in Formula (7) (Tepanosyan et al., 2019):
2.2.4 Spatial Econometric Model
The spatial econometric model is used to analyze the spatial substantial correlation and spatial disturbance correlation of research objects in a given space (Anselin, 1988; LeSage and Pace, 2009). Spatial substantive correlation refers to the value of a specific attribute of a research object in space that is affected by its neighboring objects; that is, two attribute values appear to be more similar than random. Spatial disturbance correlation means that the value of an attribute is affected by random disturbance terms in space but has little influence from explanatory variables. Spatial econometric models include the following three forms.
2.2.4.1 Spatial Lag Model
The spatial lag model (SLM) describes the influence of the whole system in space by its adjacent regional variables and tests whether an independent variable has a diffusion or spillover effect. The spatial lag model is also called the spatial autoregression model, and is expressed as:
where Y is the explained variable, i.e., the ecological efficiency value of each prefecture-level city, X is the explanatory variable, W is the spatial weight matrix, WY is the spatial lag term of the explained variable, ρ is the spatial autoregression coefficient, β is the regression coefficient of the explanatory variable, and ε is the random error term that follows a normal distribution.
2.2.4.2 Spatial Error Model
The spatial error model (SEM) differs from the spatial lag model in that it assumes that the dependence in the spatial region is affected by the random perturbation error term. The expression of its model is:
In Eq. 9, λ is the spatial error coefficient and represents the degree to which the dependent variable of a prefecture-level city, namely the level of ecological efficiency, is affected by the disturbance term of the dependent variable of its surrounding city, μ is the spatial correlation vector which has disturbance influence on the explained variable but not on the explanatory variable, and ε is a random error term that follows a normal distribution.
2.2.4.3 Spatial Dubin Model
The spatial Dubin model (SDM) integrates the characteristics of the spatial lag model and spatial error model and can explain the influence of independent variables and dependent variables of neighboring cities on the level of urban ecological efficiency. Its expression is:
where WXδ is the influence of the explanatory variable in the adjacent area on the explained variable in the local area, and δ is the coefficient vector of the cross multiplier between the explanatory variable of adjacent regions and the geographical distance space weight matrix. When δ = 0, the spatial Dubin model will approach the spatial lag model. When ρ = 0, the spatial Dubin model will approach the spatial error model.
2.3 Index Selection and Data Description
2.3.1 Evaluation Index of Ecological Efficiency
The construction of the eco-efficiency evaluation index system should be analyzed according to the concept and theoretical connotation of eco-efficiency. The core idea of ecological efficiency is to exchange the maximum economic benefits with the minimum resource input and environmental pollution, which meets the basic requirements of the DEA model on input and output. We draw on previous research to adopt the model of multiple inputs and yield per unit area and construct the ecological efficiency evaluation index system of Yellow River Basin from three aspects: resources, economy, and environment (see Table 2 for details).
2.3.1.1 Input Index
We selected the input index from three aspects: labor, economy, and resources. Labor input was measured by the number of employees in urban units at the end of the period. The fixed capital stock was estimated using the perpetual inventory method. Resource input included water resource input, land resource input, and energy input. Water resources input was measured by the total amount of water used in prefecture-level cities. Land resource input was measured by the urban construction land area of each prefecture-level city. Energy input was measured by the total energy consumption of each prefecture-level city. Because the total energy consumption of most prefecture-level cities cannot be obtained, we estimated all primary energy consumption of prefecture-level cities with a bottom-up approach, using carbon emissions, by collating relevant statistical yearbooks and county-level data published in China Emission Accounts and Datasets (CEADs). We then convert the energy use into standard coal use.
2.3.1.2 Expected Output Indicator
Expected output refers to the output that people expect to obtain in actual economic activities. Here, we only consider the economic output and use the GDP of each city as its measure. To eliminate the impact caused by price changes, the GDP of all prefecture-level cities was converted into real GDP based on the 2005 GDP index.
2.3.1.3 Undesired Output Index
Production activities include not only expected output represented by economic growth but also unexpected output represented by environmental externalities. Common undesired output includes three industrial “waste” emissions: sulfur dioxide, chemical oxygen demand, and carbon dioxide emissions. Due to data availability limitations, we chose industrial wastewater discharge to represent the impact of wastewater on the environment, and industrial smoke, dust discharge, and industrial sulfur dioxide discharge to infer the impact of waste gas pollution on the environment.
2.3.2 Selection of Influencing Factors
Based on existing literature and our research, ecological efficiency in the Yellow River Basin was explored from five perspectives: economic, demographic, technical, resource, and environmental factors. The selection of influencing factors and measurement methods of ecological efficiency in the Yellow River Basin was as follows. 1) Explained variable: ecological efficiency (EE), expressed by the ecological efficiency value calculated by the super efficiency SBM model considering unexpected output. 2) Explanatory variables: economic development level (lnPGDP) expressed as the logarithm of per capita regional GDP at constant prices; opening to the outside world (lnO) measured by the amount of foreign capital used in the current year; industrial structure (IS) measured by the proportion of secondary industries in regional GDP; financial development (lnF) measured by the balance of deposits and loans of financial institutions at the end of the year; urbanization rate (UR) measured by the proportion of the urban resident population in the total population at the end of the year; technological innovation (lnTP), expressed in science and technology expenditures; the energy consumption structure (ES) is expressed by the proportion of coal consumption of the total energy consumption; and environmental regulation (ER) is expressed by constructing a comprehensive index. The descriptive statistics of each influencing factor are shown in Table 3.
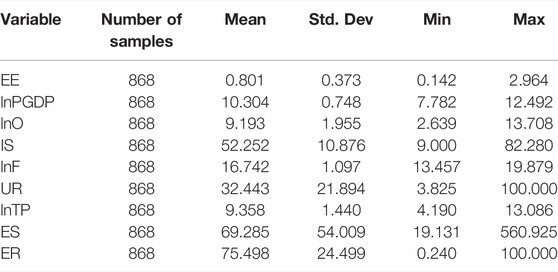
TABLE 3. Descriptive statistics of factors influencing ecological efficiency in the Yellow River Basin.
2.3.3 Data Sources
The data used in this study are from the China Urban Statistical Yearbook, China Statistical Yearbook, and CEADs (2017) database from 2006 to 2019. Some missing data are adjusted and supplemented according to the Municipal Statistical Bulletin and the National Bureau of Statistics of China (2019). Interpolation and trend extrapolation methods were adopted to process individual data that could not be found. We used MaxDEA software to calculate the overall ecological efficiency of the Yellow River Basin and the upper, middle, and lower reaches from 2005 to 2018.
3 Results
3.1 Spatial Characteristics of Ecological Efficiency
3.1.1 Analysis of the Calculation Results of Ecological Efficiency
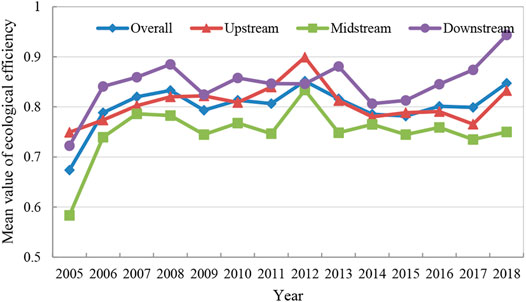
The ecological efficiency of 62 cities was 0.65–0.9 and shows a fluctuating upward trend from 2006 to 2019 (see Figure 1). Looking at different watersheds, the ecological efficiency is highest for cities in the lower reaches, medium in the upper reaches, and lowest in the middle reaches. The downstream area has the highest ecological efficiency because this area has a solid economic foundation, strong scientific and technological innovation ability, a more robust industrial structure, and relatively minor damage to the environment from economic development. The ecological efficiency of the upstream region is in the mid-range because the economic foundation of the upstream region is relatively weak, the technical level is relatively undeveloped, and the proportion of the secondary industry is relatively high. The middle reaches have the lowest ecological efficiency because they are rich in coal, iron, and other natural resources. They not only form a resource-intensive industrial structure but also become the primary choice for the transfer of high energy consumption and high pollution industries in other regions.
The hierarchical spatial distribution map of urban ecological efficiency in the Yellow River Basin at four times (2005, 2009, 2014, and 2018) shows a large difference in the hierarchical spatial distribution of ecological efficiency among cities (see Figure 2). However, after 2009, the hierarchical difference of urban ecological efficiency gradually narrowed, and the trend showed significant characteristics of watershed spatial dependence. Specifically, in 2005, the level of ecological efficiency in the upper, middle, and lower reaches of the Basin was generally low; 39 cities were at a low or lower level, and no significant watershed spatial characteristics were identified. In 2009 and 2014, the overall ecological efficiency level significantly improved. There were 35 and 32 cities at low or lower levels, respectively, and a large range of high-value areas had formed in upstream and downstream areas. By 2018, 11 cities were at a low level and five cities were at a high level. But the ecological efficiency level of some cities decreased compared with 2014, including Dongying, Weinan, Tongchuan, Taiyuan, and Baotou.
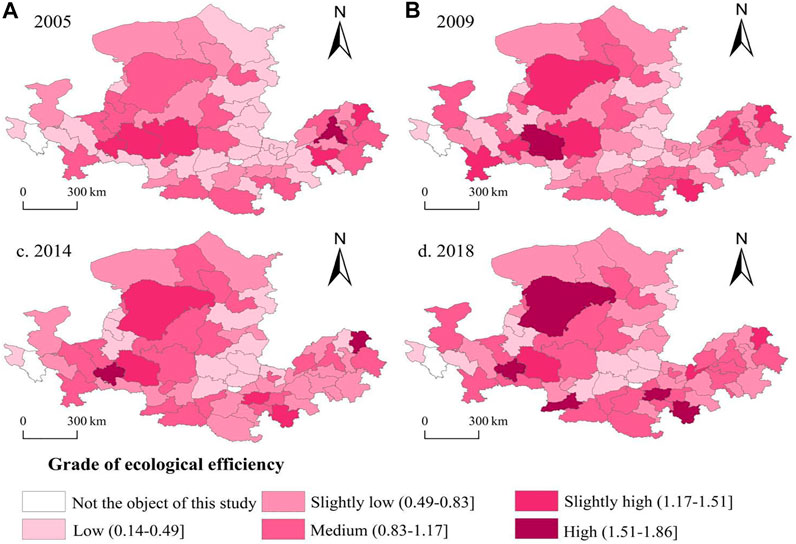
FIGURE 2. Spatial distribution trends of ecological efficiency in the Yellow River Basin from 2005 to 2018. (A) 2005, (B) 2009, (C) 2014, and (D) 2018.
3.1.2 Convergence Analysis of Ecological Efficiency
3.1.2.1 σ Convergence Analysis
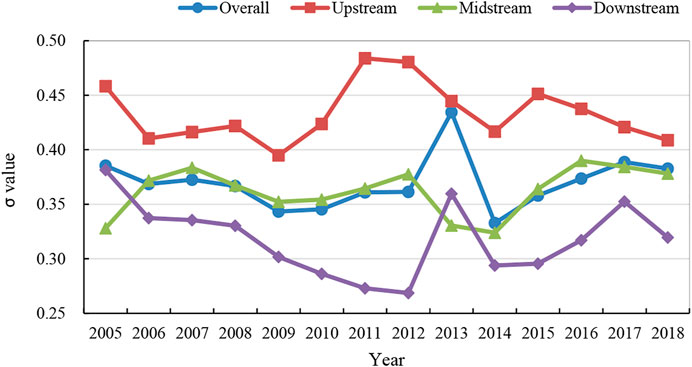
According to Eq. 2, the σ values of ecological efficiency convergence in the Yellow River Basin for the whole system and the upper, middle, and lower reaches 2005–2018 were calculated separately, and the trend of σ convergence was quantified (see Figure 3).
The σ value of the ecological efficiency of the Yellow River Basin fluctuates with time (see Figure 3). The overall ecological efficiency of the Yellow River Basin shows a trend of overall divergence and local convergence, so there is no σ convergence, which also indicates that the ecological efficiency difference between cities in the Yellow River Basin still exists. In the upstream region, the σ convergence index increases first and then decreases, and in the downstream region, it is the opposite.
These findings show that there are still deviations in the levels of sustainable economic development among cities in the Yellow River Basin. The green transformation is not extensive enough, and the relationship between economic development and environmental protection is not advanced. The gap in ecological efficiency did not disappear during the sample period, and the differences among cities still exist.
3.1.2.2 Absolute β Convergence Analysis
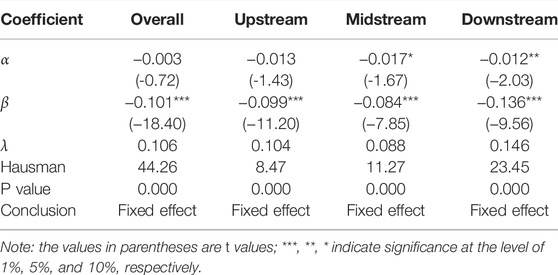
According to Eqs 3, 4, the convergence rate λ was calculated, and the absolute β convergence test was carried out for the ecological efficiency of the system as a whole and its upper, middle, and lower reaches. In the absolute β convergence test, the Hausman test is first used to determine the choice between the fixed effects model and the random-effects model. The absolute β convergence of the overall ecological efficiency passes the 1% Hausman test. Therefore, we selected the fixed-effect model, for which the results are shown in Table 4.
There is absolute β convergence in the overall ecological efficiency of the whole Yellow River Basin and the upstream, midstream, and downstream reaches, which shows that the growth level of ecological efficiency is negatively correlated with its initial level. Prefecture-level cities with low ecological efficiency have a “catching-up” trend on prefecture-level cities with initially high ecological efficiency, thus showing a statistical convergence pattern. The convergence rate of ecological efficiency changes from slow to fast as we move from the middle reaches to both upstream and downstream, which means that cities in each region approach the same steady-state efficiency value with different convergence rates. Among them, the downstream area has a faster growth rate, so there is an evident absolute β convergence, and the gap between prefecture-level cities is narrowing.
In the upper reaches of the Yellow River Basin, the industrial structure is relatively single and the economic development is relatively slow, which limits the improvements in ecological efficiency. In addition, most of the cities with low ecological efficiency in the middle reach of the Yellow River Basin focuses on the development of heavy industries that have severe environmental pollution and complex industrial transformations, so the speed of absolute convergence is relatively low. Although there are regional differences between the upper and lower reaches of the Yellow River Basin, their general patterns seem to change together. This is mainly because after China put forward the regional coordinated development strategy in 2005, the connection between provinces and cities has been strengthened, and the complementarity has been dramatically improved. The increasingly close ties between provinces and cities have played an important role in promoting the joint development of the Yellow River Basin. Although the differences between cities still exist, with the further promotion of ecological protection and high-quality development strategies, the gap between cities should further diminish. This is the reason for absolute β convergence in the upper and lower reaches of the Yellow River Basin.
3.1.2.3 Conditional β Convergence Analysis
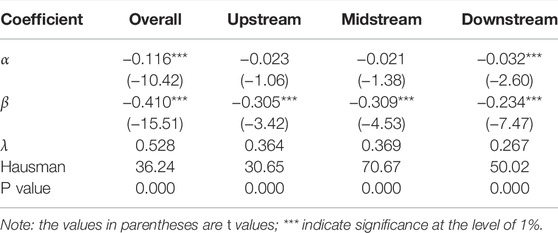
The conditional β convergence test results show that the regression coefficient (β) of overall ecological efficiency of the Yellow River Basin and the upper, middle, and lower reaches throughout 2005–2018 is less than 0 and significant at 1% (see Table 5). This means that there is conditional β convergence for the overall ecological efficiency of the entire Yellow River Basin, as well as the upper, middle, and lower reaches. This suggests that the ecological efficiency of each prefecture-level city has a steady-state level and will converge to this steady-state level over time. The middle reach area has the highest convergence rate (0.369), followed by the upper reaches (0.364), and the lower reaches (0.267).
The convergence rate in the middle reaches of the Yellow River Basin is the fastest, which may indicate that these cities have improved pollution levels, promoted economic development, or made progress in the coordination between economic development and environmental protection. Due to their strong economies, many cities in the lower reaches of the Yellow River Basin are relatively wealthy and have a strong economic foundation to support environmental measures. However, they lack technical support to fully transform and develop traditional industries for a green economy and have entered a stage of stable development. Therefore, the convergence speed is the slowest in this area.
3.2 Analysis of Factors Influencing Ecological Efficiency
3.2.1 Spatial Autocorrelation Test
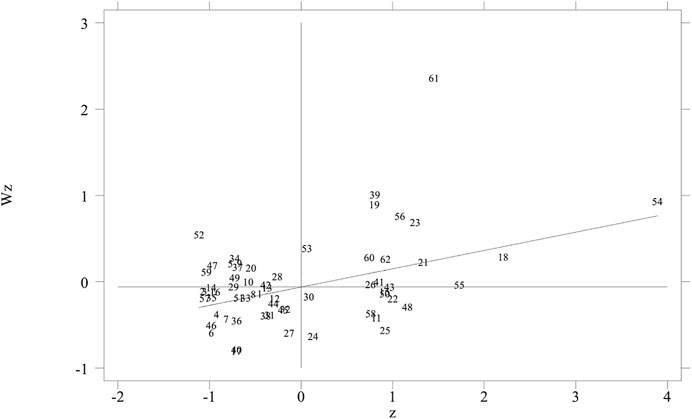
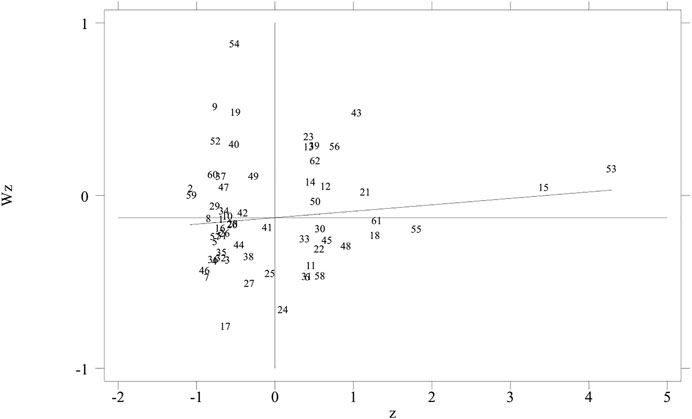
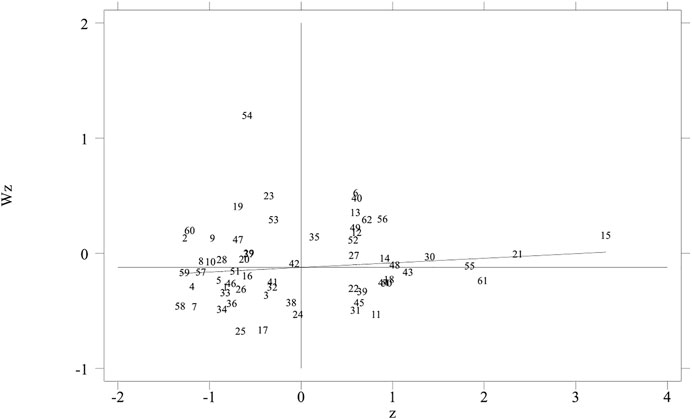
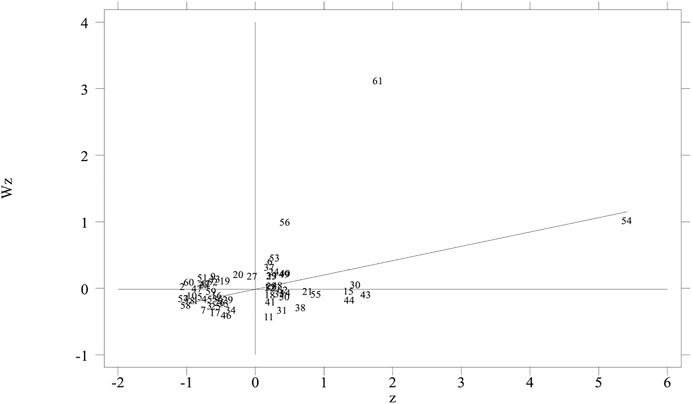
According to the global autocorrelation test results, for the four weight matrices, Moran’s I index is greater than 0 and significant at the 1% level, indicating that the distribution of ecological efficiency in the Yellow River Basin has positive spatial correlation characteristics. Taking W3 as an example, the local autocorrelation scatter plots of ecological efficiency in four representative years are given in Figures 4–7. The horizontal axis represents the standardized eco-efficiency value, and the vertical axis represents the spatial lag value of eco-efficiency value. It can be seen that most cities are located in the first and third quadrants of positive spatial correlation, which further indicates that the ecological efficiency of the Yellow River Basin has a significant positive spatial spillover effect.
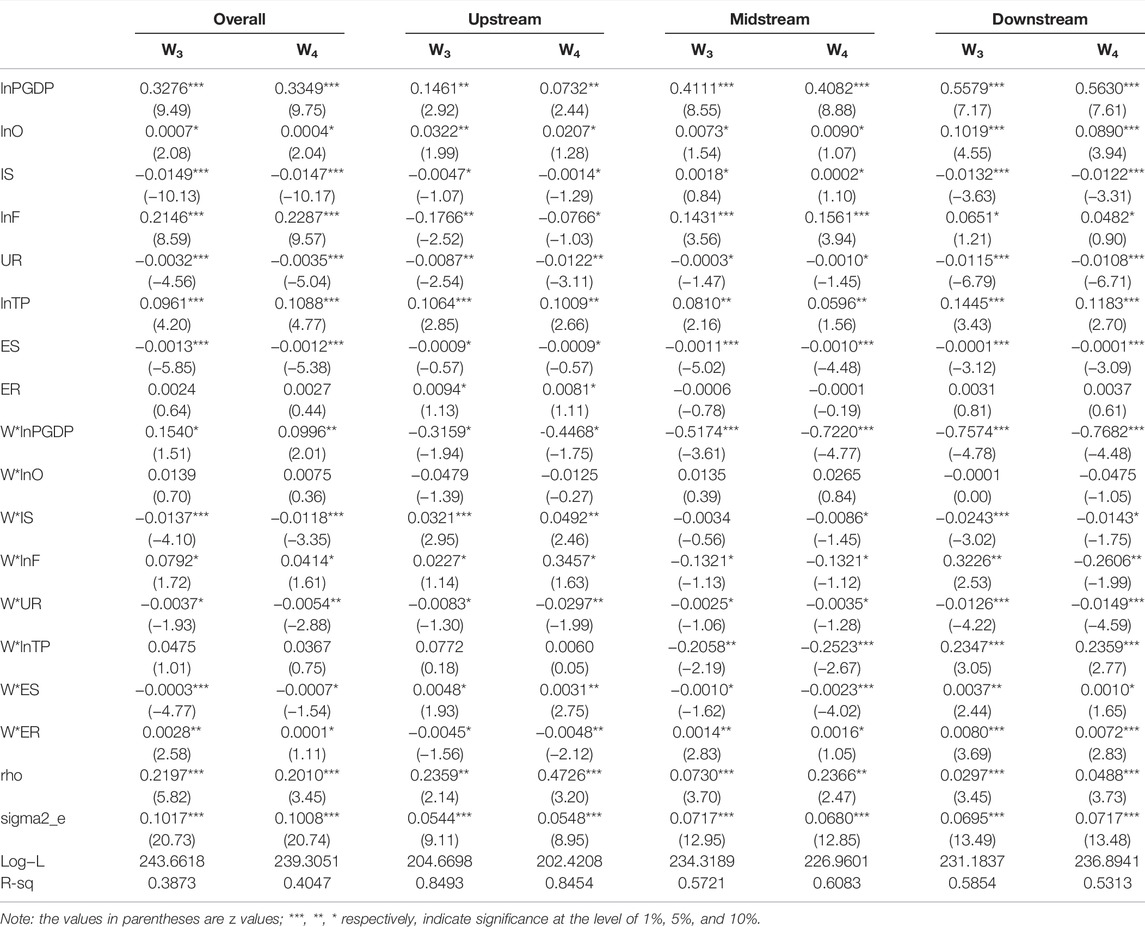
3.2.2 Analysis of Regression Results
We selected the geo-economic weight matrix W3 and the geo-economic nested weight matrix W4 for the Lagrange multiplier (LM) test on the data. Under W3, the statistical values of LM-lag, LM-error, and robust LM-error were all significant at the 1% level, but the robust LM-lag did not pass the significance test. Under W4, LM-lag, robust LM-lag, LM-error, and robust LM-error all had significant values at the 1% level. Further, whether the SDM model can be simplified to the SAR or SEM models can be seen in the LR test. The results support the rejection of the null hypothesis. Therefore, the SDM model results were selected for further analysis in this study. The results of the Hausman test show that under both matrices, p values are less than the critical significance level of 1%, so the null hypothesis is rejected, and the fixed effects model is chosen. The results of the time-fixed effect test also supported the rejection of the null hypothesis, so the time-fixed effect model was selected.
Some key results were found from the regressions, as shown in Table 6, and summarized in the following points.
(1) The coefficients of lnPGDP are all positive and have a significant positive correlation with the ecological efficiency of the Yellow River Basin. This indicates that the economic development of the Yellow River Basin is conducive to the improvement of ecological efficiency. Developed provinces and cities can attract funds, talents, and technology, and form centers for economic development and subsequent ecological protection.
(2) The coefficients on lnO are all positive and significant, indicating that linkages to the outside world are conducive to the improvement of ecological efficiency. While vigorously attracting foreign investment, the region has made rational use of it, introducing advanced technologies, equipment, and management concepts. This has reduced resource consumption and pollution, thus improving the ecological efficiency of the Yellow River Basin.
(3) The coefficients of IS are negative and significant in the overall watershed and upper and lower reaches, indicating that the existing industrial structure in the Yellow River Basin is not conducive to dramatically improved ecological efficiency. Optimizing industrial structures is often considered to have a significant role in promoting eco-efficiency (Yue et al., 2018). The coefficients in the middle reaches are significantly positive, which is inconsistent with previous studies. The reason may be that most of the cities in the middle reaches are industrialized, and the contribution of industrial output to economic growth is valued greater than the cost of harming resources and the environment.
(4) The coefficients of lnF in the overall system and middle and lower reaches are positive, indicating that the improvement of financial development level is conducive to the improvement of ecological efficiency in these areas. For example, high-tech industries have more advanced technologies in resource utilization and pollution control and promote enterprises to develop green modes of production. However, the essence of capitalism is profit-seeking. More financial resources may be allocated to other technologies than to resource and environmental protection. Production-augmenting technologies can aggravate environmental pollution and reduce ecological efficiency, which may be the reason for the negative coefficient of upstream reaches.
(5) The UR coefficients are all negative and significant, indicating a negative correlation between urbanization and ecological efficiency. Urbanization requires substantial resource investment and can damage the environment, which inhibits the improvement of regional ecological efficiency.
(6) The lnTP coefficients are all positive and significant, indicating that technological innovation in the Yellow River Basin is conducive to improving ecological efficiency. The increase of science and technology expenditures promotes the research and development of new technologies. With the improvement of production technology, the utilization efficiency of resources also improves, and pollution is reduced, thus promoting the improvement in ecological efficiency.
(7) The ES coefficients are all significant and negative, indicating that the increase of the coal consumption ratio in the Yellow River Basin reduces ecological efficiency. Taking coal as the primary energy source for economic development, air pollution, and other negative externalities will remain.
(8) The coefficient of ER only passes the significance test in the upper reaches of the Basin, indicating strengthening environmental governance alone cannot effectively improve ecological efficiency.
3.2.3 Analysis of Spatial Spillover of Ecological Efficiency
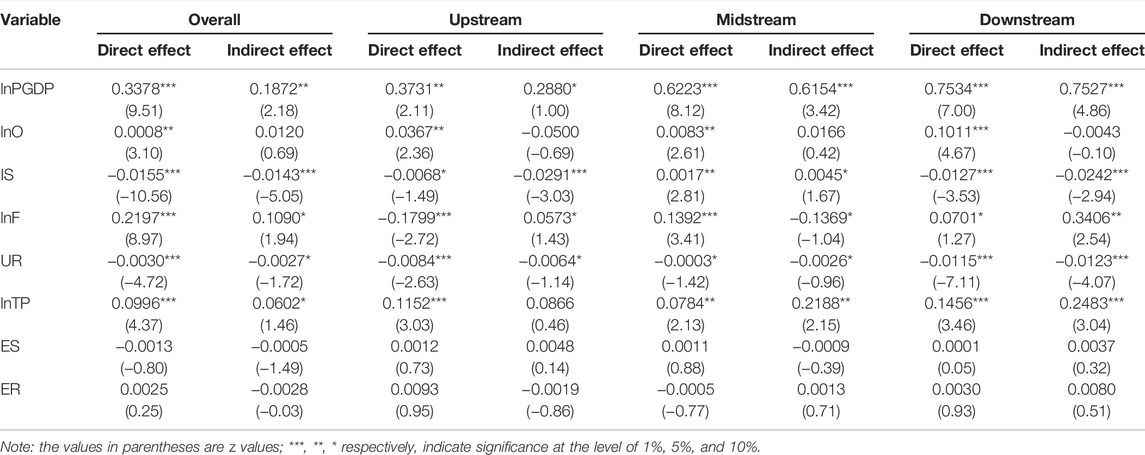
Based on the partial differential method proposed by LeSage and Pace (2009), the spatial effect decomposition results of various factors on ecological efficiency were obtained. The spatial effect can be decomposed into direct and indirect effects. The direct effects arise from the change of regional economic variables on local ecological efficiency when other conditions remain unchanged. Indirect effects, namely the spatial spillover effect, are the influence of the changes of economic variables in neighboring regions on the change of regional ecological efficiency when other conditions remain unchanged. The sum of the direct and indirect effects is the total effect. Table 7 shows the specific results of spatial effect decomposition of explanatory variables using the W3 matrix.
According to the effect decomposition results shown in Table 7, a series of findings are apparent.
(1) The direct effect and indirect effect coefficients of lnPGDP on ecological efficiency are significant and positive. The indirect effect coefficient is greater than the direct effect coefficient, which shows that the impact of the economic development level of cities on the ecological efficiency of that city is less than that of the surrounding cities. The economic development level has an obvious spatial spillover effect.
(2) The direct effect of lnO on ecological efficiency is significant and positive. However, the indirect effect coefficient is not significant, which shows that the impact of the opening of cities on the ecological efficiency of those cities is significantly greater than that of the surrounding cities, and there is no spatial spillover effect of opening to other areas.
(3) The indirect effects of IS on ecological efficiency are significant and negative for the overall system, and upstream and downstream reaches, indicating that the spatial spillover effect of industrial structure harms ecological efficiency. However, the coefficient in the middle reaches is significantly positive, and there is a spillover effect.
(4) The lnF indirect effect coefficients of the overall system and upstream and downstream reaches are significant and positive, indicating that the level of financial development can drive the ecological efficiency of adjacent regions. However, the indirect effect coefficient of the midstream is significant and negative, indicating that local financial development will reduce the ecological efficiency of adjacent cities.
(5) The direct and indirect effect coefficients of UR are significant and negative, indicating that the improvement of urbanization rate at this stage not only has some inhibitory effect on the improvement of ecological efficiency in the region, but it will also affect the ecological efficiency of surrounding areas, which may lead to the intensification of resource competition among regions. This is not conducive to the improvement of ecological efficiency in adjacent areas.
(6) The indirect effect coefficients of lnTP are significant and positive in the overall system and midstream and downstream sections, indicating that scientific and technological strength not only improves the level of ecological efficiency in the region but also has a significant positive spillover effect. The coefficient in the upstream is not significant, indicating that the spillover effect is not strong.
(7) The coefficients of ES on the ecological efficiency of the Yellow River Basin are not significant, and spillover effects are not obvious.
(8) The indirect effect coefficients of ER in the overall system and upstream, middle, and downstream areas are not significant, indicating that the spillover effect is not strong.
4 Discussion
Based on the literature on ecological efficiency evaluation, convergence, and influencing factors, we use the super efficiency SBM model to calculate the ecological efficiency of 62 prefecture-level cities in the Yellow River Basin of China from 2005 to 2018. We analyze the spatial distribution evolution trends and convergence of the ecological efficiency of the overall Yellow River Basin and separately for the upper, middle, and lower reaches. Then, the spatial Dubin model was used to study the influencing factors of ecological efficiency and its spatial spillover effects. The conclusions of this study are as follows.
(1) The ecological efficiency of 62 cities in the Yellow River Basin has fluctuated but has improved in the past 14 years. The ecological efficiency of downstream cities is the highest and the midstream is the lowest.
(2) The overall ecological efficiency of the Yellow River Basin shows a trend of overall divergence and local convergence, so σ convergence does not exist. There is no obvious σ convergence in the upper, middle, and lower reaches, but there are stages of σ convergence. The absolute β convergence and conditional β convergence are found for the ecological efficiency in the overall Basin, upper, middle, and lower reaches.
(3) Economic development level, opening to the outside world, financial development, and technological innovation have significant promoting effects on ecological efficiency. The industrial structure, urbanization rate, and energy consumption structure harm ecological efficiency. The effect of environmental regulation on the ecological efficiency of the Yellow River Basin is not obvious.
(4) The level of economic development, financial development, and technological innovation have noticeable spatial spillover effects. The indirect effect coefficient of lnO is small and not significant, indicating that there is no obvious spatial spillover effect. Industrial structure and urbanization rate have significant negative spillover effects. The spillover effect of energy consumption structure and environmental regulation on ecological efficiency is negative and not strong.
Based on the findings, we put forward the following suggestions. First, allow a core city to promote the overall coordinated development of a region and thus minimize great regional differences in ecological efficiency. Second, vigorously promote technological innovation and improvements in pollution management. This will involve reducing the consumption of energy resources at the source. In the production process, the government can encourage enterprises to develop anti-pollution technologies by giving them tax incentives and subsidies. Green consumption and production models need to be developed, which will help enhance technological innovation, optimize resource allocation, and achieve energy conservation and emission reduction. The government should increase the environmental threshold for industrial transfer and avoid “race-to-bottom competition” between regions (Dong et al., 2020). Third, stakeholders need to upgrade the industrial structure and develop strategic emerging industries. Cities should make more pronounced efforts to promote industrial informatization and high-tech development, and reduce the most damaging activities in high pollution sectors. Finally, spatial spillovers need to be more fully utilized to strengthen inter-regional relationships. Governments at all levels in the Yellow River Basin should deepen cooperation, transcend restrictions of administrative divisions, establish a system of provincial consultation, strengthen the coordination of relevant policies and planning projects, and work together to promote the implementation of major projects. Further, the government should continue to promote the construction of transportation and information infrastructure to achieve interconnections among regions (Xing et al., 2018).
There are many research approaches to study ecological efficiency, so it is necessary to further explore the various methodological options. Because it is difficult to obtain energy consumption data of research samples, the research results of ecological efficiency and influencing factors are somewhat limited—these constraints need to be explored and alternatives provided. The Yellow River basin flows through a large area, and the economic development levels and ecological situations of each province are different. Therefore, it is necessary to further refine policy mechanisms and to construct specific ecological efficiency improvement policies in the Yellow River Basin and other regions.
Data Availability Statement
The original contributions presented in the study are included in the article/Supplementary Material, further inquiries can be directed to the corresponding author.
Author Contributions
ZG: Funding acquisition, Supervision, Writing-review and editing. ST: Conceptualization, Methodology, Formal analysis, Investigation, Data curation, Writing-original draft. DW: Writing-review and editing, Format modification. JZ: Format modification, Data collecting.
Funding
This work was supported by the Ministry of education of Humanities and Social Science project in China (Grant number 20YJA790018); and National Social Science Fund of China (Grant number 15ZDB165).
Conflict of Interest
The authors declare that the research was conducted in the absence of any commercial or financial relationships that could be construed as a potential conflict of interest.
Publisher’s Note
All claims expressed in this article are solely those of the authors and do not necessarily represent those of their affiliated organizations, or those of the publisher, the editors and the reviewers. Any product that may be evaluated in this article, or claim that may be made by its manufacturer, is not guaranteed or endorsed by the publisher.
Acknowledgments
We are very grateful to Tariq Ali for his help with editing the English manuscript. The authors thank the reviewers for their constructive comments and suggestions that helped improve the article.
References
Avadí, Á., Vázquez-Rowe, I., and Fréon, P. (2014). Eco-Efficiency Assessment of the Peruvian Anchoveta Steel and Wooden Fleets Using the LCA+DEA Framework. J. Clean. Prod. 70, 118–131. doi:10.1016/j.jclepro.2014.01.047
Barro, R. J., and Sala-I-Martin, X. (1997). Technological Diffusion, Convergence, and Growth. J. Econ. Growth 2 (1), 1–26. doi:10.1023/A:1009746629269
Barro, R., and Sala-I-Martin, X. (1992). Convergence. J. Polit. Econ. 100 (2), 223–251. doi:10.1086/261816
Beltrán-Estevea, M., Reig-Martínez, E., and Estruch-Guitart, V. (2017). Assessing Eco-Efficiency: A Metafrontier Directional Distance Function Approach Using Life Cycle Analysis. Environ. Impact Assess. Rev. 63, 116–127. doi:10.1016/j.eiar.2017.01.001
Camarero, M., Castillo, J., Picazo-Tadeo, A. J., and Tamarit, C. (2013). Eco-efficiency and Convergence in OECD Countries. Environ. Resource Econ. 55, 87–106. doi:10.1007/s10640-012-9616-9
CEADs (2017). China Emission Accounts and Datasets. Available at: https://www.ceads.net/data/county/.
Chen, M., Wang, S., and Liu, W. (2020). Eco-Efficiency and its Promotion in the Yellow River Basin: Empirical Evidence from 100 Cities. Chin. J. Popul. Sci. 4, 46–58+127. (in China).
Chen, M., Yue, H., Hao, Y., and Liu, W. (2021). The Spatial Disparity, Dynamic Evolution and Factors of Ecological Efficiency in the Yellow River Basin. J. Quantitative Tech. Econ. 38 (9), 25–44. (in China). doi:10.13653/j.cnki.jqte.2021.09.002
Chen, P., Xie, R., Lu, M., and Huang, Z. (2020). The Impact of the Spatio-Temporal Neighborhood Effect on Urban Eco-Efficiency in China. J. Clean. Prod. 285, 124860. doi:10.1016/j.jclepro.2020.124860
Chen, W., Si, W., and Chen, Z.-M. (2020). How Technological Innovations Affect Urban Eco-Efficiency in China: A Prefecture-Level Panel Data Analysis. J. Clean. Prod. 270, 122479. doi:10.1016/j.jclepro.2020.122479
Dan, X., Yue, L., Ahmad, F., Draz, M. U., and Chandio, A. A. (2021). Urban Eco-Efficiency and its Influencing Factors in Western China: Fresh Evidence from Chinese Cities Based on the US-SBM. Ecol. Indicators 127, 107784. doi:10.1016/j.ecolind.2021.107784
Dong, Z., He, Y., Wang, H., and Wang, L. (2020). Is There a Ripple Effect in Environmental Regulation in China? - Evidence from the Local-Neighborhood green Technology Innovation Perspective. Ecol. Indicators 118, 106773. doi:10.1016/j.ecolind.2020.106773
Huang, J., Yang, X., Cheng, G., and Wang, S. (2014). A Comprehensive Eco-Efficiency Model and Dynamics of Regional Eco-Efficiency in China. J. Clean. Prod. 67, 228–238. doi:10.1016/j.jclepro.2013.12.003
Huang, Y., Li, L., and Yu, Y. (2018). Do urban Agglomerations Outperform Non-Agglomerations? A New Perspective on Exploring the Eco-Efficiency of Yangtze River Economic Belt in China. J. Clean. Prod. 202, 1056–1067. doi:10.1016/j.jclepro.2018.08.202
Kounetas, K. E., Polemis, M. L., and Tzeremes, N. G. (2021). Measurement of Eco-Efficiency and Convergence: Evidence from a Non-Parametric Frontier Analysis. Eur. J. Oper. Res. 291, 365–378. doi:10.1016/j.ejor.2020.09.024
LeSage, J., and Pace, R. (2009). Introduction to Spatial Econometrics. Florida: CRC Press, Taylor & Francis Group.
Li, B., Hu, Z., Miao, C., Zhang, B., and Kang, W. (2021). Spatio-Temporal Evolution Characteristics and Influencing Factors of the Industrial Eco-Efficiency in the Yellow River Basin. Geogr. Res. 40 (8), 2156–2169. (in China). doi:10.11821/dlyj020200516
Lorenzo-Toja, Y., Vázquez-Rowe, I., Chenel, S., Marín-Navarro, D., Moreira, M. T., and Feijoo, G. (2015). Eco-Efficiency Analysis of Spanish WWTPs Using the LCA + DEA Method. Water Res. 68, 651–666. doi:10.1016/j.watres.2014.10.040
National Bureau of Statistics of China (2019). Available at: https://data.stats.gov.cn/index.htm.
Orea, L., and Wall, A. (2017). A Parametric Approach to Estimating Eco-Efficiency. J. Agric. Econ. 68 (3), 901–907. doi:10.1111/1477-9552.12209
Peng, B., Wang, Y., and Wei, G. (2020). Energy Eco-Efficiency: Is There Any Spatial Correlation between Different Regions? Energy Policy 140, 111404. doi:10.1016/j.enpol.2020.111404
Rezitis, A. N. (2010). Agricultural Productivity and Convergence: Europe and the United States. Appl. Econ. 42 (8), 1029–1044. doi:10.1080/00036840701721026
Shao, L., Yu, X., and Feng, C. (2019). Evaluating the Eco-Efficiency of China's Industrial Sectors: A Two-Stage Network Data Envelopment Analysis. J. Environ. Manage. 247, 551–560. doi:10.1016/j.jenvman.2019.06.099
State Council of China (2013). Available at: http://www.gov.cn/zwgk/2013-12/03/content_2540070.htm.
Sun, W. (2020). Analysis on the Spatial and Temporal Differences of Urban Energy Eco-Efficiency in the Yellow River Basin and its Influencing Factors. J. Anhui Normal University(Hum. Soc. Sci.) 48 (2), 149–157. (in China). doi:10.14182/j.cnki.j.anu.2020.02.019
Tepanosyan, G., Sahakyan, L., Zhang, C., and Saghatelyan, A. (2019). The Application of Local Moran's I to Identify Spatial Clusters and Hot Spots of Pb, Mo and Ti in Urban Soils of Yerevan. Appl. Geochem. 104, 116–123. doi:10.1016/j.apgeochem.2019.03.022
Tone, K. (2002). A Slacks-Based Measure of Super-Efficiency in Data Envelopment Analysis. Eur. J. Oper. Res. 143, 32–41. doi:10.1016/s0377-2217(01)00324-1
Tong, Y., Zhou, H., and Jiang, L. (2021). Exploring the Transition Effects of Foreign Direct Investment on the Eco-Efficiency of Chinese Cities: Based on Multi-Source Data and Panel Smooth Transition Regression Models. Ecol. Indicators 121, 107073. doi:10.1016/j.ecolind.2020.107073
Vogtländer, J. G., Bijma, A., and Han, C. B. (2002). Communicating the Eco-Efficiency of Products and Services by Means of the Eco-Costs/Value Model. J. Clean. Prod. 10 (1), 57–67. doi:10.1016/S0959-6526(01)00013-0
Wang, Y., Liu, J., Hansson, L., Zhang, K., and Wang, R. (2011). Implementing Stricter Environmental Regulation to Enhance Eco-Efficiency and Sustainability: A Case Study of Shandong Province's Pulp and Paper Industry, China. J. Clean. Prod. 19 (4), 303–310. doi:10.1016/j.jclepro.2010.11.006
Xing, L., Xue, M., and Wang, X. (2018). Spatial Correction of Ecosystem Service Value and the Evaluation of Eco-Efficiency: A Case for China's Provincial Level. Ecol. Indicators 95, 841–850. doi:10.1016/j.ecolind.2018.08.033
Xiong, Y., Bingham, D., Braun, W. J., and Hu, X. J. (2019). Moran's I Statistic-Based Nonparametric Test with Spatio-Temporal Observations. J. Nonparametric Stat. 31 (1), 244–267. doi:10.1080/10485252.2018.1550197
Xu, X., Pan, L.-C., Ni, Q.-H., and Yuan, Q.-Q. (2021). Eco-Efficiency Evaluation Model: A Case Study of the Yangtze River Economic Belt. Environ. Monit. Assess. 193, 457–479. doi:10.1007/s10661-021-09228-2
Yan, X., and Tu, J.-j. (2021). The Spatio-Temporal Evolution and Driving Factors of Eco-Efficiency of Resource-Based Cities in the Yellow River Basin. J. Nat. Resour. 36 (1), 223–239. (in China). doi:10.31497/zrzyxb.20210115
Yang, L., and Yang, Y. (2019). Evaluation of Eco-Efficiency in China from 1978 to 2016: Based on a Modified Ecological Footprint Model. Sci. Total Environ. 662, 581–590. doi:10.1016/j.scitotenv.2019.01.225
Yao, J., Xu, P., and Huang, Z. (2021). Impact of Urbanization on Ecological Efficiency in China: An Empirical Analysis Based on Provincial Panel Data. Ecol. Indicators 129, 107827. doi:10.1016/j.ecolind.2021.107827
Yue, S., Yang, Y., and Pu, Z. (2017). Total-Factor Ecology Efficiency of Regions in China. Ecol. Indicators 73, 284–292. doi:10.1016/j.ecolind.2016.09.047
Yue, W., Cai, Y., Yang, Z., Rong, Q., and Dang, Z. (2018). Structural Optimization for Industrial Sectors to Achieve the Targets of Energy Intensity Mitigation in the Urban Cluster of the Pearl River Delta. Ecol. Indicators 95, 673–686. doi:10.1016/j.ecolind.2018.08.009
Zhang, J., Liu, Y., Chang, Y., and Zhang, L. (2017). Industrial Eco-Efficiency in China: a Provincial Quantification Using Three-Stage Data Envelopment Analysis. J.Clean. Prod. 143, 238–249. doi:10.1016/j.jclepro.2016.12.123
Zhou, C., Shi, C., Wang, S., and Zhang, G. (2018). Estimation of Eco-Efficiency and its Influencing Factors in Guangdong Province Based on Super-SBM and Panel Regression Models. Ecol. Indicators 86, 67–80. doi:10.1016/j.ecolind.2017.12.011
Keywords: ecological efficiency, spatial distribution, convergence, spatial econometric, Yellow River basin, economic development
Citation: Guo Z, Tang S, Wang D and Zhang J (2022) Spatial Distribution and Factors Influencing Ecological Efficiency of the Yellow River Basin in China. Front. Environ. Sci. 10:815898. doi: 10.3389/fenvs.2022.815898
Received: 16 November 2021; Accepted: 24 February 2022;
Published: 31 March 2022.
Edited by:
Chengyu Li, Zhengzhou University of Light Industry, ChinaCopyright © 2022 Guo, Tang, Wang and Zhang. This is an open-access article distributed under the terms of the Creative Commons Attribution License (CC BY). The use, distribution or reproduction in other forums is permitted, provided the original author(s) and the copyright owner(s) are credited and that the original publication in this journal is cited, in accordance with accepted academic practice. No use, distribution or reproduction is permitted which does not comply with these terms.
*Correspondence: Zhengquan Guo, emhlbmdxdWFuZ3VvQDE2My5jb20=
 Zhengquan Guo
 Shuning Tang
 Daojuan Wang2
 Jiaqi Zhang

