 Ming Zhong
 Shanxia Liu
 Kun Li1
- 1School of Geography and Planning, Sun Yat-sen University, Guangzhou, China
- 2Bureau of Hydrology and Water Resources, Pearl River Water Resources Commission of Ministry of Water, Guangzhou, China
- 3Guangxi Water and Power Design Institute Co. Ltd, Nanning, China
Dissolved oxygen (DO) concentration is an essential indicator for assessment of river ecosystems. A hydrodynamic and water quality mathematical model coupling one-dimensional and two-dimensional models is developed in this study. The characteristics of study area, flow velocity, temperature, and organic contamination are taken as consideration in the scenario setting. The changing processes of DO concentration are simulated in different scenarios, and the effects on DO concentration are discussed. Results indicate that: 1) A negative relation was present between DO concentration in Yongjiang River and releasing discharge of the Laokou hydro-project, since reoxygenation is greater than oxygen consumption along the river, DO concentration increases from upstream to downstream. 2) DO concentration increases with the releasing of DO in the water, which also varies along with the releasing of biochemical oxygen demand (BOD) concentration. Laokou exhibits the greatest increase of BOD, which ranges from 0.1 mg/L to 0.75 mg/L 3) The increasing of water temperature results in increased reoxygenation and a decrease in oxygen consumption. Our study shows that the water temperature increased from 19°C to 29 °C, and correspondingly saturated DO decreased from 9.25 mg/L to 7.54 mg/L. The study provides scientific support for ecology operation in the cascade river, and is expected to improve the water environment by reservoir regulation.
Introduction
The dissolved oxygen (DO) concentration in a river is an essential indicator of the ecosystem assessment. DO decreases in rivers impacts the biological activities and results in reductions in benthic animal populations (Bu et al., 2021). A low DO concentration may slow the degradation of pollutions, weaken the capacity of water’s self-purification, and even decrease the quality of the aquatic ecosystem. In recent decades, hypoxia (DO < 2 mg L−1) has been frequently reported, which is an urgent warning for river ecosystem health (Ji et al., 2017).
According to the resources and consuming paths, DO balance is affected by atmosphere oxygen production, photosynthesis, and biochemical consumption (e.g., degradation of organic matter, degradation of sediment pollutants, respiration of animals and plants). Thus, the formation of hypoxia depends on the interaction between physical and biochemical processes in the water column. In addition, the DO budget in a river is related to the spatial-temporal change of temperature, salinity, nutrients, underwater topography, and wind (Hutchins et al., 2021). River morphology also influences the DO concentration in the river environment. In the one-way river, DO concentration is mainly affected by upstream runoff, while in the tidal river, the mechanism of DO concentration can be more complex due to the tidal effect (Li et al., 2020).
Numerous studies focus on the prediction of DO concentration in a river system and the development of advanced modeling techniques are generally classified into two types: 1) the watershed model, such as SWAT (Arnold et al., 1998), HBC-N (Arheimer and Brandt, 1998), and HEQM (Zhang et al., 2016), which describes the rainfall-runoff processes at the basin scale; and 2) the hydrodynamic model, such as MIKE (Warren and Bach, 1992), EFDC (Hamrick, 1992), and HEC-RAS [HEC (Hydrologic Engineering Center), 1997], which are used to derive the detailed changing processes of water quality and quantity. With the development of artificial intelligence (AI) models and machine learning technology, water quality indicators can be modeled by artificial neural networks (Kisi et al., 2012; Chen and Liu, 2014; He et al., 2014; Zhang et al., 2019), fuzzy logic (Altunkaynak et al., 2005; Giusti and Marsili-Libelli, 2009; Heddam, 2014), and support vector machine (Tarmizi et al., 2014; Yu et al., 2016; Ji et al., 2017). These studies demonstrate the advantages of applying data-driving technology in DO prediction, including the requirement of less input data and the solution of non-linear problems.
However, challenges still remain for accurately predicting DO levels in river systems. This is because of changes in flow regime and accompanying disturbance in water quality processes due to dam construction and reservoir regulation. These anthropogenic activities in river systems usually couple with dynamic and complex biochemical processes. Although many efforts have been devoted to minimize the impact of changing DO in response to anthropogenic disturbance, water quality has a tendency to deteriorate in water systems due to water balance alterations resulting from climate change in recent years. Extreme hydrological events in lakes and reservoirs, such as flooding, probably increase water column turbidity, which in turn hinder plant photosynthetic activity, and eventually disturb aquatic ecosystems (Jeppesen et al., 2015). Furthermore, considering water infrastructure regulations, simulation integrating water quality and water quantity models have been conducted in some studies, and demonstrate that the water quality in downstream flow is related to upstream flow and the pollution transportation in dammed water systems (Lopes et al., 2004; Zuo et al., 2015; Jiang et al., 2016).
The Yongjiang River, the tributary of Xijiang River in the Pearl River system, is located in Nanning City of China. As the most important drinking water source to Nanning City, the river provides 90% of the total water supply of Nanning City (Zhang et al., 2020). The total length of the mainstream is 133.8 km, with a watershed area of 73728 m2. The average annual runoff of Yongjiang River is 1,292 m3/s. The Yongjiang cascade reach is the river reach between the Laokou Hydro-project and Yongning Hydro-project, with the length of 74 km. There are 17 inland rivers in Nanning City which afflux into the Yongjiang cascade river. The Laokou hydro-project is located in the upper Yongjiang River, and started to operate in 2014, undertaking the tasks of comprehensive utilization, such as flood control, navigation, and power generation. The Yongning hydro-project is a non-regulated reservoir, located in the lower Yongjiang River. In order to reduce the inundated area, the reservoir operates at a lower water level once the flow is more than 1,500 m3/s. Since the Yongning Hydro-project was built and put into operation in October of 2018, the cross-section width became 300 ∼ 570 m, and the water depth became 7 ∼ 20 m in the Yongjiang cascade reach.
When the Yongning hydro-project was built, the pollution in the Yongjiang cascade river reach was affected by the release of discharge from the Laokou hydro-project if the sewage flowing into the river was constant. With the development of cascade rivers, the local economy and industry greatly improved. Meanwhile, the river ecosystem changed. The Laokou section is the state-controlled section, which is located in the upstream of the Laokou hydro-project. According to the measured data, DO concentration in the year of 2016 was high in general, and had a higher concentration in autumn and winter. In contrast, the DO concentration was lower in spring and summer. In the year of 2017, the DO concentration changed a little, and the seasonality of DO concentration was not obvious. In May of 2018, the DO concentration of the Laokou section reached the lowest value. Temporally, water quality was good in the Yongjiang cascade river reach under the most condition, however, the low concentration of DO still existed occasionally. Spatially, the DO concentration tended to descend from upstream to downstream, and then reverse. The probable reason is related to the population concentration in Nanning City. Because inland and sewage outlets drain into the Yongjiang cascade reach, the organic pollutants increase, and the oxygen consumption for degradation increases correspondingly.
With the disturbance of hydro-projects regulation in the Yongjiang cascade river, water quality displays dynamic and complex processes. In order to address the mechanisms of ecology operation in the cascade river, it is essential to study the spatial patterns of dissolved oxygen and its impacts on the Yongjiang cascade river. The objectives of this study are to: 1) Assess the impacts of discharge, water quality (BOD concentration), and temperature of Laokou River on DO concentration of the study area; and 2) discuss the spatial trend of DO concentration and identify the underlying mechanism.
Model Development
Generalization of the Study Sites
The Laokou hydro-project and Yongning hydro-project play the main role in regulating the water quantity in the Yongjiang cascade reach. Specifically, the water environment in the study region is greatly affected by water quality of released discharge from the Laokou hydro-project, and thus the simulation of water quality is affected by regulation of the Yongning hydro-project. Therefore, the upper boundary is defined as the Laokou hydro-project, and 2 km downstream of the Yongning hydro-project is defined as the lower boundary in the study region. The river system of the study area is shown in Figure 1, and the inland rivers are listed in Table 1.
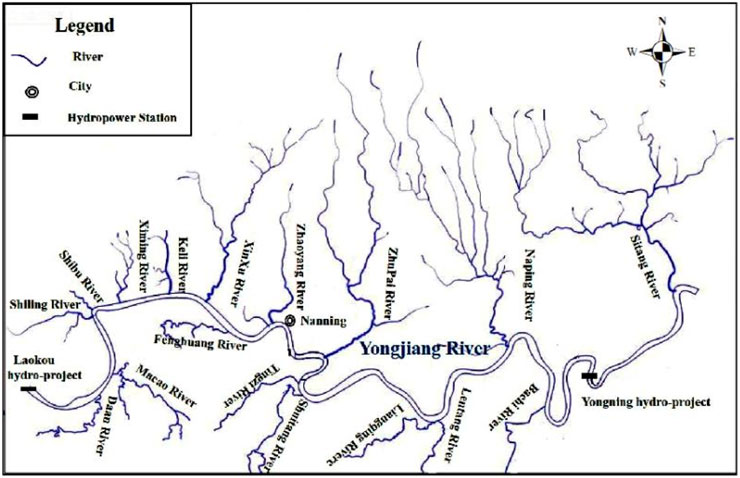
FIGURE 1. River system in Nanning City.
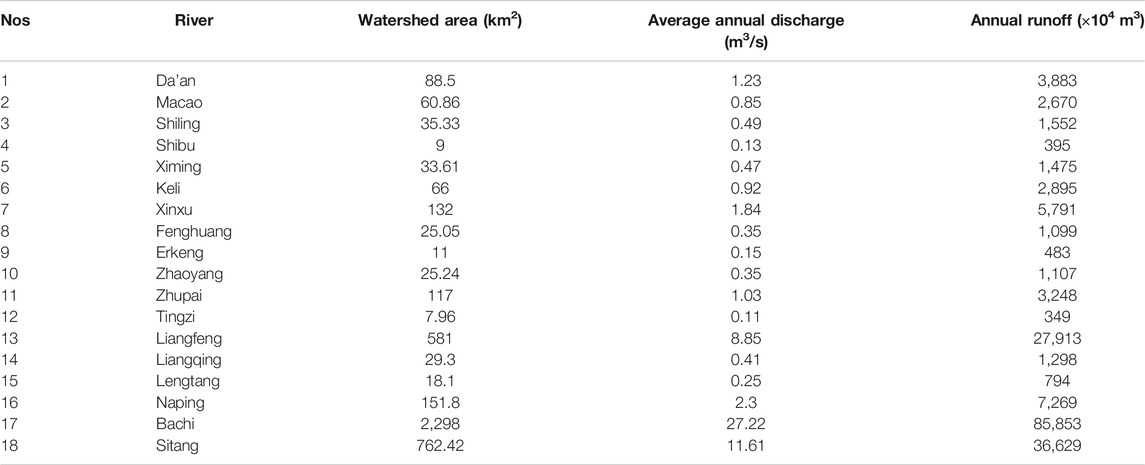
TABLE 1. Inventory of inland rivers in Nanning City.
The Yongjiang cascade river has a board water surface, which is the typical two-dimensional flow, and thus MIKE 21 was adopted to simulate the two-dimensional hydrodynamic water quality. Meanwhile, because the Yongning hydro-project is located in the Yongjiang cascade river, the sluice of the Yongning hydro-project should be generalized by the one-dimensional model. Therefore, the river reach starting from 2 km upstream of the Yongning hydro-project to 2 km downstream of Yongning hydro-project was generalized as a one-dimensional river, in which eight cross-sections are located. A real-time dynamic coupling of hydrodynamics between one-dimensional and two-dimensional models was realized by using the MIKE FLOOD, as shown in Figure 2.
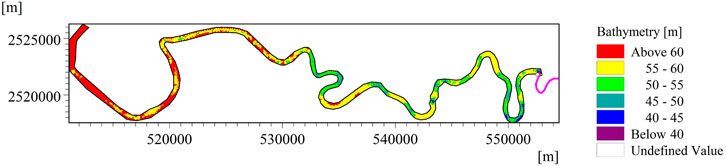
FIGURE 2. Topography coupled by MIKE FLOOD.
Meshing of the study area was implemented with an unorganized irregular triangle network (Danish Hydraulics Institute, 2012a; Danish Hydraulics Institute, 2012b). After terrain meshing, a total of 1,549 nodes and 2,849 grids were divided. The cross-section data in the year of 2009 and measured underwater topography in the year of 2010 were adopted in this study. There are 17 inland rivers and seven sewage outlets in the Yongjiang cascade catchment, which were generalized as point-sources. The normal water level of the Yongning hydro-project is 67 m, the sluices open when the released discharge is more than 1,500 m3/s. Therefore, the Yongning hydro-project was generalized as four sluices which are 75 m wide and 67 m high, when the water level before sluicing is higher than 67 m, the sluices open. Otherwise, the sluices are closed.
Boundary Conditions
The outer boundaries of the hydrodynamic model include the upstream flow boundary of rivers and the lower boundary of the water level. In this study, the measured released discharge of the Laokou hydro-project was set as the upper boundary, while the water level data at the cross-section of 2 km downstream of the Yongning hydro-project were set as the lower boundary. Due to the lack of measured water level data of the Yongning hydro-project, the water level was calculated by the relation curve between water level and discharge. The sewage inflow was set as the inner boundary of the hydrodynamic model, in which 17 inland river and seven sewage outlets are included.
The outer boundaries of the water quality model include the upstream water quality boundary and the downstream water quality boundary. The water quality monitoring data on the released discharge of the Laokou hydro-project were set as the upstream water quality, while the downstream water quality boundary was set according to water quality monitoring data of Yongning hydro-project. The inner boundary of the water quality model was mainly the pollutant imports from 17 inland river and seven sewage outlets.
Calibration and Validation
As the measured data were available, the Nanning hydraulic station was taken as the site point for calibration and validation. Synchronous measured hydrologic data from 07:00 to 21:00 on June 13, and from 08:00 to 20:00 on July 7, 2018, were applied for model calibration and validation, respectively. Roughness is a dimensionless number, which indicates the flow resistances. Roughness of the two-dimensional river reach in the study area was determined in the interval of 0.027∼0.03 after calibration and validation, while roughness of the one-dimension river reach was in the interval of 0.028∼0.031.
The degradation coefficient of pollutants is mainly used to describe the self-purification effect of pollutants in the catchment area. The diffusion coefficient influences temporal and spatial distribution laws of pollutant concentrations. Taking four cross-sections with water monitoring data as the site point for calibration and validation, synchronous measured water quality data on June 13 and July 7 of 2018 were applied for calibration and validation, respectively. Degradation coefficient was determined as 0.1 d−1 and the diffusion coefficient was 15 m2/s after calibration and validation.
DO Simulation and Spatial Distribution
1) Scenario setting
The Yongjiang cascade river reach is an inland river. It has low salinity and is rarely subject to wind effects. Therefore, flow velocity, temperature, and organic contamination were considered in the scenario setting.
For discharge flow scenarios of the Laokou hydro-project, the minimum release flow satisfying the ecology requirement was 243 m3/s. Monthly average discharge flow in low, normal, and high flow years was 902 m3/s, 1,081 m3/s, and 1,600 m3/s, respectively (Zhao, 2017). Furthermore, the discharge flow in the flooding period of 2,500 m3/s was considered. The corresponding lower boundaries of water level were determined by interpolation. We took the minimum DO concentration of discharge flow in the Laokou hydro-project in June of 2018 as the upper boundary of water quality, which was 4.0 mg/L, while the corresponding BOD concentration was 0.8 mg/L and water temperature (T) was 29°C. The water quality on the cross-section of 2 km downstream of the Yongning Hydro-project was set as the lower boundary, which was 5.5 mg/L for DO concentration, 1.0 mg/L for BOD concentration, and 29°C for water temperature.
In order to determine whether the DO concentration in the study region was affected by releasing the DO concentration of the Laokou hydro-project, five scenarios of the upper boundary for DO concentration were set as follows: 4.0 mg/L, 4.5 mg/L, 5.0 mg/L, 5.5 mg/L, and 6.0 mg/L. Similarly, six scenarios of upper boundary for BOD concentration were set as follows: 0.8 mg/L, 2.0 mg/L, 3.0 mg/L, 4.0 mg/L, 5.0 mg/L, and 6.0 mg/L. Furthermore, the average water temperature in the seasons were set as boundaries, which were 21°C in spring, 27°C in summer, 29°C in autumn, and 19°C in winter.
2) Simulation analysis
According to the measured data of discharge and water quality in the year of 2018, DO simulation was conducted based on the coupled model of hydrodynamic and water quality. Different scenarios of discharge flow, water quality, and water temperature were analyzed.
The change process of DO in different scenarios of discharge flow was analyzed, as shown in Figure 3 and Figure 4A. Results indicate that DO concentration was negatively correlated with the discharge flow of the Laokou hydro-project, and the spatial trend of DO concentration increased from upstream to downstream.
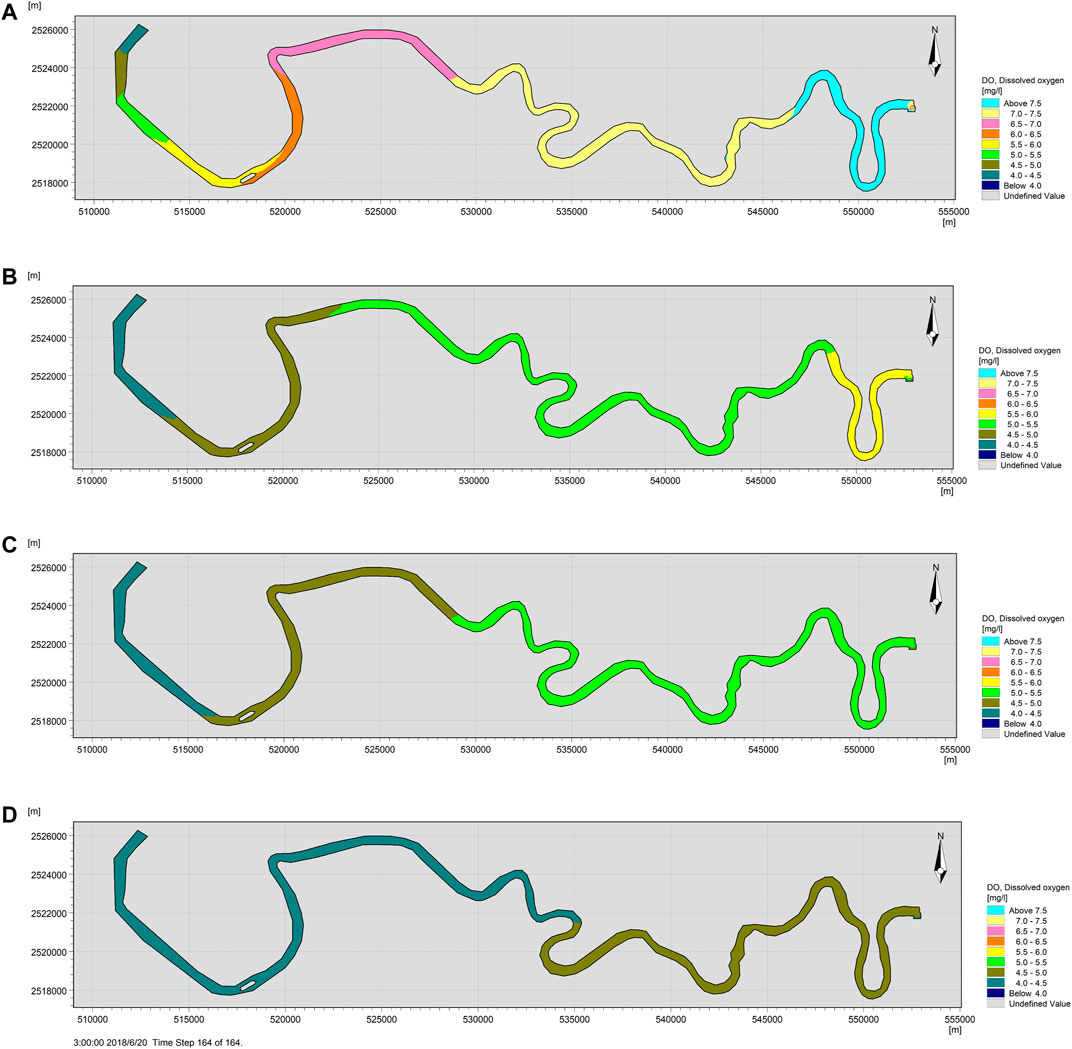
FIGURE 3. Change process of DO concentration for different discharge flow scenarios of the Laokou hydro-project, (A) 243 m3/s; (B) 902 m3/s; (C) 1,081 m3/s; and (D) 2,500 m3/s.
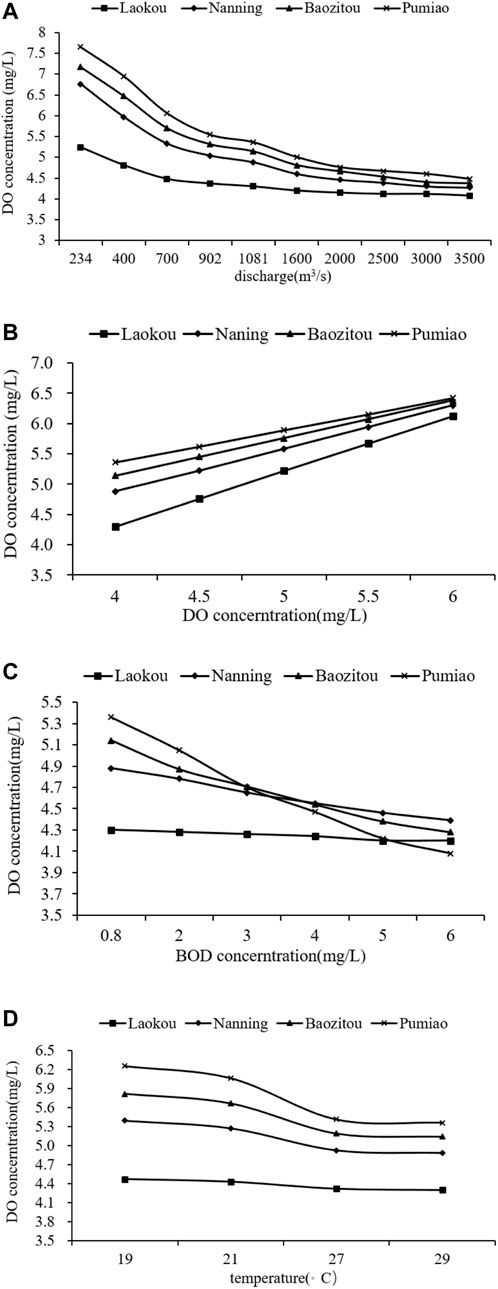
FIGURE 4. Spatial trend of DO concentration in different control points, (A) discharge flow scenarios; (B) releasing DO scenarios; (C) releasing BOD scenarios; and (D) water temperature scenarios.
The changing process of DO under different scenarios of water quality was analyzed, as shown in Figures 4B,C. Results indicate that DO concentration was positively correlated with released DO from the Laokou hydro-project, and spatial trend of DO concentration increased from upstream to downstream, where the linear relationships were displayed. However, DO concentration was negatively correlated with releasing BOD from the Laokou hydro-project. Spatial trend of DO concentration decreased on the control points. The falling speed of DO concentration was faster on the cross-sections of Pumiao and Baozitou. Furthermore, if the releasing BOD concentration was less than 3 mg/L, DO concentration increased from upstream to downstream. In contrast, if the releasing BOD concentration was beyond 3 mg/L, DO concentration on Pumiao became gradually lower than in other cross-sections; if the releasing BOD concentration was 6 mg/L, DO concentration on Pumiao reached the minimum in the four control points.
The change process of DO under different scenarios of water temperatures was analyzed, as shown in Figure 4D. The results indicate that DO concentration was negatively correlated with water temperatures. Spatial trend of DO concentration decreased on the control points. The DO concentration decreased at its slowest on the cross-sections of Laokou.
Discussion
Effects of Discharge Flow on River DO
The Yongjiang cascade river is a single-direction catchment, and DO concentration is affected by released discharge from the Laokou hydro-project. With the increase of released discharge, DO concentration increased accordingly from upstream to downstream. In sewage inlets into the river reach, since the BOD concentration is low in the upstream water and in polluted water, reoxygenation is greater than oxygen consumption in the study region, which causes DO concentration to increase and water quality to improve. Keeping other conditions constant, the releasing discharge of the Laokou hydro-project influences the DO concentration in Yongjiang cascade river by changing the hydrodynamic conditions. Since the Yongning hydro-project has the function of impounding flood water, with the increase of releasing discharge from Laokou, flow velocity increases and water level increases obviously, which changes the hydrodynamic conditions in the river reach. The reoxygenation rate changes accordingly, thus effecting DO concentration in the study region. Taking 1,081 m3/s and 2,500 m3/s as examples, the flow velocity distribution is shown in Figure 5. Results indicate that the flow velocity is faster when the releasing discharge increases, and it is faster in the river bank than in the river center. The reason is that flow velocity is related to the elevation of a cross-section. If releasing discharge upstream increases, the Yongning hydro-project impounds flood water, and water level increases obviously. Because elevation is lower in the river bank than in the river center, water depth is greater in the river bank than in the river center. The corresponding water depth distribution is shown in Figure 5. It is clear that flow velocity is slow if water depth is greater. Moreover, if the releasing discharge increases, flow velocity in the river center becomes slower, and an increase is smaller than in the river bank. With the influence of variation in hydrodynamic conditions, reaeration rate distribution is shown in Figure 6A. Results indicate that reaeration rate decreases with the increase of releasing discharge, and reaeration rate is greater in the river bank than in the river center. Furthermore, water depth has a greater influence on reaeration rate than flow velocity. Therefore, when released discharge increases, reaeration rate decreases in the study region. Especially in the river center, reaeration rate reduces quickly. Reaeration rate of DO concentration decreases, which slows the reaeration process and keeps the water quality of releasing discharge and sewage outlets constant. Because oxygen consumption is invariable, the DO concentration thus decreases in the river reach.
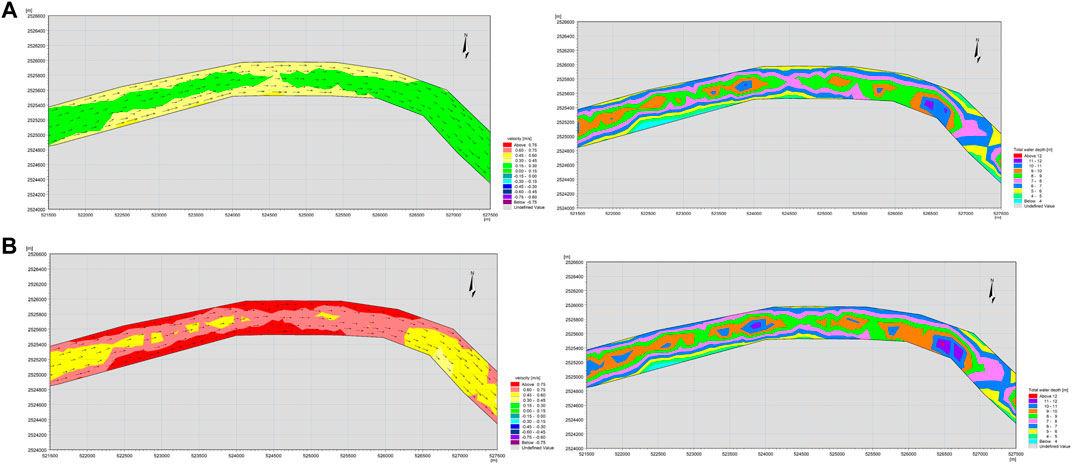
FIGURE 5. Flow velocity distribution and water depth distribution in different scenarios of releasing discharge, (A) 1,081 m3/s; (B) 2,500 m3/s.
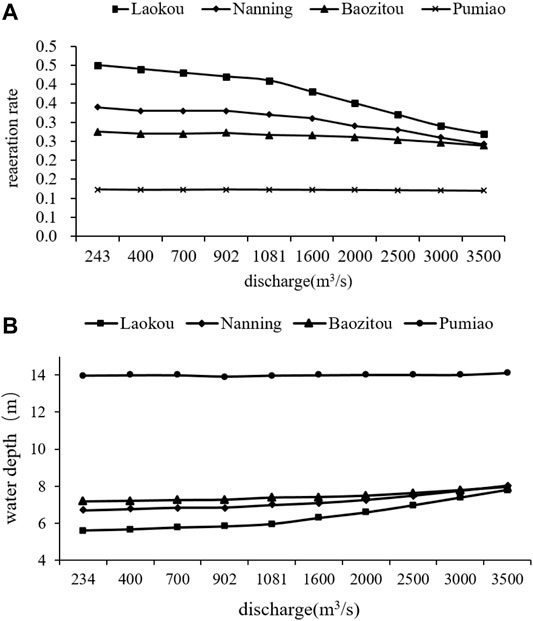
FIGURE 6. Change process in different releasing discharge scenarios, (A) reaeration rate, (B) water depth.
When the Yongning hydro-project impounds flood water, the water level rises in the river. The water level upstream also rises due to the effect of return water, but water depth is different between upstream and downstream, which results in differences in the reaeration rate. The changing process of reaeration rate under different scenarios is shown in Figure 6A. It can be observed that the reduction of the reaeration rate at the Laokou section is greatest with the increase of releasing discharge, followed by the Nanning section. However, for Baozitou and Pumiao located downstream of the river reach, their water depths change a little because of the impound function of the Yongning hydro-project, as shown in Figure 6B. Therefore, the reaeration rates at the Baozitou section and Pumiao section rarely change. Due to the obvious influences of water depth, with the increase of releasing discharge, the greater the water depth changes, the greater the reaeration rates changes. The results also highlight that if the releasing DO concentration is low and kept constant, increasing the releasing discharge of the Laokou hydro-project will not improve the DO concentration in the Yongjiang cascade river.
Effects of Releasing DO Concentration
The oxygen consumption process is influenced by releasing discharge, BOD concentration, sewage outlet, and water temperature, and DO concentration in the Yongjiang saccade river reach increases with the increasing DO concentration of releasing discharge from the Laokou hydro-project. Meanwhile, the releasing DO concentration is affected by restoration rate, saturated DO concentration, and DO concentration in the local water environment. Oxygen restoration varies since DO concentration is different. The higher the DO concentration of releasing discharge from the Laokou hydro-project, the closer the approach to saturation, the slower the oxygen restoration rate in the river, leading to less restoration. When the DO concentration of releasing discharge from the Laokou hydro-project is 4.5 mg/L, the oxygen restoration distribution in the study region decreases as shown in Figure 7. It is clear that DO concentration increases from upstream to downstream, while reoxygenation in the river decreases from upstream to downstream. More reoxygenation results in the greater increase of DO concentration. Thus, DO concentration of the upper river has a greater increase when the releasing DO concentration increases. In this study region, a greater increase of DO concentration occurs in the control points of Laokou and Nanning, which are located on the upper river of Yongjiang.
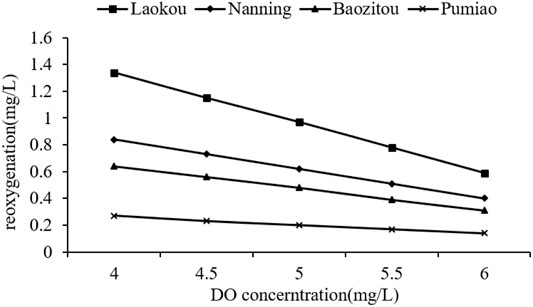
FIGURE 7. Change process of reoxygenation in different releasing DO scenarios.
Effects of Releasing BOD Concentration
With the increase of releasing BOD from the Laokou hydro-project, BOD degradation requires more oxygen consumption, which results in the decrease of DO concentration. Meanwhile, the growth of DO concentration exhibits a decrease trend from upstream to downstream. When BOD concentration reaches a critical value, the oxygen consumption is greater than reoxygenation in the water environment, which causes DO concentration to exhibit a decreasing trend. As a result, the DO concentration is lower in the lower river.
In this study, the main sewage outlets are located in the upper and mid river, with the increase of releasing BOD, BOD concentration increases in the mid and lower river. However, the oxygen consumption is greater. When the reoxygenation remains constant, DO concentration decreases in the middle and lower river. As shown in Figure 8A, oxygen consumptions of BOD degradation are similar among the control points when BOD concentration is 0.8 mg/L; oxygen consumptions increase with the increase of BOD concentration, and Laokou exhibits the greatest amount of increase, increasing from 0.1 mg/L to 0.75 mg/L. The changing processes of BOD are shown in Figure 8B. It can be seen that the increases of reoxygenation are small, reoxygenation of the Laokou control point is 1.3 mg/L, which is the greatest value of reoxygenation. On the contrary, reoxygenation of Pumiao, located in the lower river, is the lowest for the flood impounding effect of the Yongning hydro-project.
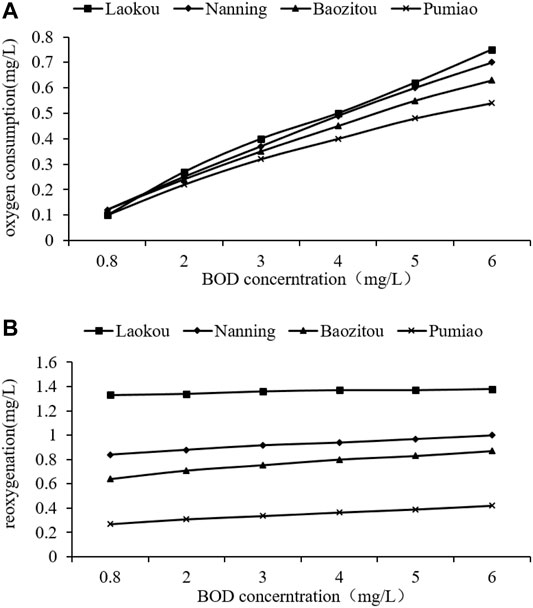
FIGURE 8. Change process of BOD concentration, (A) oxygen consumption; (B) reoxygenation.
When releasing BOD concentration is less than 4 mg/L, reoxygenation is greater than oxygen consumption. DO concentration in the study region increases from upper to lower river, correspondingly. When releasing BOD concentration is more than 4 mg/L, reoxygenation is greater than oxygen consumption in the upper and middle river, DO concentration thus increases from upper stream to lower stream. This changing trend is reversed in the lower river, in which oxygen consumption is greater than reoxygenation. As a result, DO concentration decreases. Therefore, DO concentration in the downstream is lower than in the upper and middle river of Yongjiang.
Effects of Water Temperature
Reoxygenation and oxygen consumption are both influenced by water temperature. With the increasing of water temperature, the saturated dissolved oxygen decreases, and the reoxygenation effect in the river decreases accordingly. As shown in Figure 9A, the saturated DO concentrations at control points are almost equal, and display an obvious decreasing trend. In detail, the water temperature increases from 19°C to 29°C, and the correspondingly saturated DO decreases from 9.25 mg/L to 7.54 mg/L. However, reoxygenations at control points present a decreasing trend with the increase of water temperature. Reoxygenations in Laokou and Nanning are therefore greater, and the reoxygenation decreases in Laokou and Nanning are also greater than that at Baozitou and Pumiao, as shown in Figure 9B. Furthermore, the increase of water temperature enhances BOD degradation, as shown in Figure 9C. Thus, with the increase of water temperature, reoxygenation decreases at the control points, oxygen consumption increases, and DO concentration in study region decreases. Moreover, the decrease of BOD is greater in Nanning, Baozitou, and Pumiao, since water temperature enhances BOD degradation, the BOD can be quickly degraded when released into the river. With the increase of water temperature, oxygen consumption increases, reoxygenation is weaker in Nanning, Baozitou, and Pumiao, and thus the decrease of DO concentration is greater than that of Laokou. A negative relation occurs between water temperature and DO concentration. Especially in the downstream, the effect on DO concentration is more obvious.
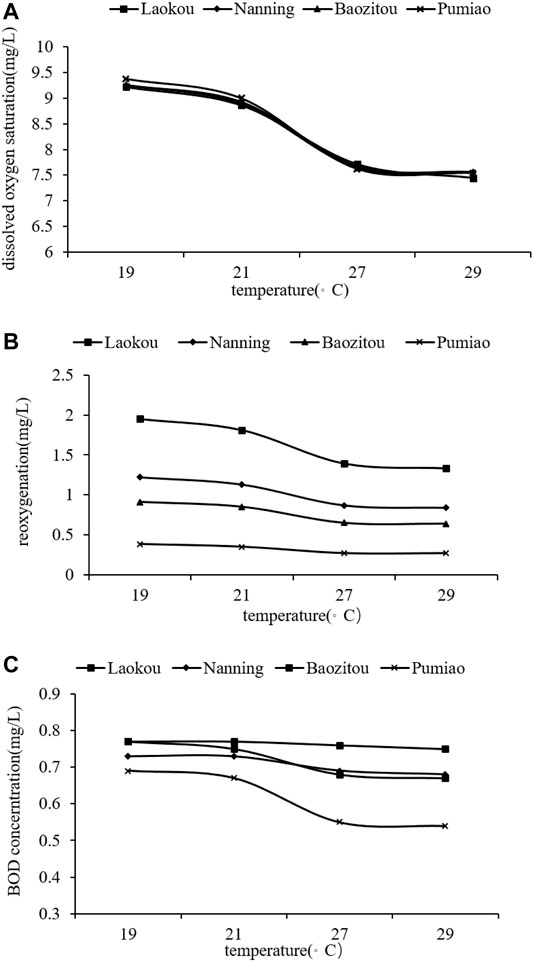
FIGURE 9. Change process of temperature, (A) DO concentration; (B) reoxygenation; (C) BOD concentration.
Conclusion
With the influences of the Laokou hydro-project and Huning hydro-project, the hydrodynamic conditions in the study area has changed, which aggravates the decrease of DO concentration. A hydrodynamic and water quality mathematical model coupling one-dimensional and two-dimensional models is developed to simulate DO concentration in the river reach. Under different scenarios of releasing discharge of the Laokou hydro-project, DO concentration, BOD concentration, and water temperature are assessed. Then, the spatial trend of DO concentration in Yongjiang river are simulated, and the influence mechanisms of reoxygenation and oxygen consumption are discussed. The study provides a scientific support for ecology operation in the cascade river, and is expected to improve the water environment by reservoir regulation. The main findings are concluded as follows:
1) A negative relation exists between DO concentration in Yongjiang River and releasing discharge of the Laokou hydro-project. The increase of discharge enhances flow velocity, but the impounding effect of the Yongning hydro-project downstream increases the water level, and changes in water depth are more obvious than that of flow velocity. Thus, with the increase of releasing discharge, reoxygenation rate decreases, and DO concentration decreases correspondingly. Since reoxygenation is greater than oxygen consumption along the river, DO concentration increases from upstream to downstream.
2) DO concentration increases with the increase of releasing DO concentration, and the growth of DO concentration in the upper river is greater than in the lower river. DO concentration is influenced by releasing BOD concentration. When releasing BOD concentration is less than 4 mg/L, reoxygenation is greater than oxygen consumption in the upper and mid river, the growth of DO concentration in the upper river is greater than the lower river. Whereas, this changing trend is reversed in the lower river, DO concentration in the downstream is lower than in the upper and middle river of Yongjiang.
3) Reoxygenation and oxygen consumption are both influenced by water temperature. The increasing water temperature causes reoxygenation to increase and the oxygen consumption to decrease, DO concentration will decrease. Since the water temperature effects are more obvious in the mid and lower river of Yongjiang, the corresponding decline of DO concentration is greater than in the upper river.
Data Availability Statement
The original contributions presented in the study are included in the article/Supplementary Material, further inquiries can be directed to the corresponding author.
Author Contributions
All authors were involved in the production and writing of the manuscript. Concep-tualization, MZ and TJ; Methodology, TJ; Formal Analysis, MZ and SL; Data Curation, KL and HJ; Review and Editing, GT; All authors have read and agreed to the published version of the manuscript.
Funding
The research was financially supported by the National Natural Science Foundation of China (grant no. 51709286).
Conflict of Interest
Author HJ is employed by Guangxi Water and Power Design Institute Co. Ltd.
The remaining authors declare that the research was conducted in the absence of any commercial or financial relationships that could be construed as a potential conflict of interest.
Publisher’s Note
All claims expressed in this article are solely those of the authors and do not necessarily represent those of their affiliated organizations, or those of the publisher, the editors and the reviewers. Any product that may be evaluated in this article, or claim that may be made by its manufacturer, is not guaranteed or endorsed by the publisher.
References
Altunkaynak, A., Özger, M., and Çakmakcı, M. (2005). Fuzzy Logic Modeling of the Dissolved Oxygen Fluctuations in Golden Horn. Ecol. Model. 189, 436–446. doi:10.1016/j.ecolmodel.2005.03.007
Arheimer, B., and Brandt, M. (1998). Modelling Nitrogen Transport and Retention in the Catchments of Southern Sweden. Ambio 27, 471–480.
Arnold, J. G., Srinivasan, R., Muttiah, R. S., and Williams, J. R. (1998). Large-area Hydrologic Modeling and Assessment: Part I. Model Development. J. Am. Water Resour. Assoc. 34, 73–89. doi:10.1111/j.1752-1688.1998.tb05961.x
Bu, X., Dai, H., Yuan, S., Zhu, Q., Li, X., Zhu, Y., et al. (2021). Model-Based Analysis of Dissolved Oxygen Supply to Aquifers within Riparian Zones during River Level Fluctuations: Dynamics and Influencing Factors. J. Hydrol. 598, 126460. doi:10.1016/j.jhydrol.2021.126460
Chen, W.-B., and Liu, W.-C. (2014). Artificial Neural Network Modeling of Dissolved Oxygen in Reservoir. Environ. Monit. Assess. 186 (2), 1203–1217. doi:10.1007/s10661-013-3450-6
Danish Hydraulics Institute (DHI) (2012a). MIKE 11: A Modelling System for Rivers and Channels Reference Manual [M]. Denmark: DHI, Horsholm.
Danish Hydraulics Institute (DHI) (2012b). MIKE 21 & MIKE 3 Flow Model FM: Hydrodynamic and Transport Module Scientific Documentation [M]. Denmark: DHI, Horsholm.
Giusti, E., and Marsili-Libelli, S. (2009). Spatio-Temporal Dissolved Oxygen Dynamics in the Orbetello Lagoon by Fuzzy Pattern Recognition. Ecol. Model. 220, 2415–2426. doi:10.1016/j.ecolmodel.2009.06.007
Hamrick, J. M. (1992). A Three-Dimensional Environmental Fluid Dynamics Computer Code: Theoretical and Computational Aspects, Special Report 317. Williamsburg, US: The College of William and Mary.
He, Z., Wen, X., Liu, H., and Du, J. (2014). A Comparative Study of Artificial Neural Network, Adaptive Neuro Fuzzy Inference System and Support Vector Machine for Forecasting River Flow in the Semiarid Mountain Region. J. Hydrol. 509, 379–386. doi:10.1016/j.jhydrol.2013.11.054
HEC (Hydrologic Engineering Center) (1997). HEC-RAS River Analysis System: Hydraulic Reference Manual. Davis, CA: Hydrologic Engineering Center.
Heddam, S. (2014). Modeling Hourly Dissolved Oxygen Concentration (Do) Using Two Different Adaptive Neuro-Fuzzy Inference Systems (ANFIS): A Comparative Study. Environ. Monit. Assess. 186, 597–619. doi:10.1007/s10661-013-3402-1
Hutchins, M. G., Qu, Y., and Charlton, M. B. (2021). Successful Modelling of River Dissolved Oxygen Dynamics Requires Knowledge of Stream Channel Environments. J. Hydrol. 603 (B), 126991. doi:10.1016/j.jhydrol.2021.126991
Jeppesen, E., Brucet, S., Naselli-Flores, L., Papastergiadou, E., Stefanidis, K., Nõges, T., et al. (2015). Ecological Impacts of Global Warming and Water Abstraction on Lakes and Reservoirs Due to Changes in Water Level and Related Changes in Salinity. Hydrobiologia 750, 201–227. doi:10.1007/s10750-014-2169-x
Ji, X., Shang, X., Dahlgren, R. A., and Zhang, M. (2017). Prediction of Dissolved Oxygen Concentration in Hypoxic River Systems Using Support Vector Machine: A Case Study of Wen-Rui Tang River, china. Environ. Sci. Pollut. Res. 24, 16062–16076. doi:10.1007/s11356-017-9243-7
Jiang, T., Zhong, M., Cao, Y.-J., Zou, L.-J., Lin, B., and Zhu, A.-P. (2016). Simulation of Water Quality under Different Reservoir Regulation Scenarios in the Tidal River. Water Resour. Manage. 30, 3593–3607. doi:10.1007/s11269-016-1375-x
Kisi, O., Ozkan, C., and Akay, B. (2012). Modeling Discharge-Sediment Relationship Using Neural Networks with Artificial Bee colony Algorithm. J. Hydrol. 428-429, 94–103. doi:10.1016/j.jhydrol.2012.01.026
Li, W., Fang, H., Qin, G., Tan, X., Huang, Z., Zeng, F., et al. (2020). Concentration Estimation of Dissolved Oxygen in Pearl river basin Using Input Variable Selection and Machine Learning Techniques. Sci. Total Environ. 731, 139099. doi:10.1016/j.scitotenv.2020.139099
Lopes, L. F. G., Carmo, J. S. A. D., Cortes, R. M. V., and Oliveira, D. (2004). Hydrodynamics and Water Quality Modelling in a Regulated River Segment: Application on the Instream Flow Definition. Ecol. Model. 173 (2), 197–218. doi:10.1016/j.ecolmodel.2003.07.009
Tarmizi, A., Ahmed, A. N., and El-Shafie, A. (2014). Dissolved Oxygen Prediction Using Support Vector Machine in Terengganu River Middle-East. J. Sci. Res. 21 (11), 2182–2188. doi:10.5829/idosi.mejsr.2014.21.11.21844
Warren, I. R., and Bach, H. K. (1992). MIKE 21: A Modelling System for Estuaries, Coastal Waters and Seas. Environ. Softw. 7 (4), 229–240. doi:10.1016/0266-9838(92)90006-p
Yu, H., Chen, Y., Hassan, S., and Li, D. (2016). Dissolved Oxygen Content Prediction in Crab Culture Using a Hybrid Intelligent Method. Sci. Rep. 6, 27292. doi:10.1038/srep27292
Zhang, X., Leng, Y., Liu, X., Huang, K., and Wang, J. (2020). Microplastics' Pollution and Risk Assessment in an Urban River: A Case Study in the Yongjiang River, Nanning City, South China. Expo. Health 12, 141–151. doi:10.1007/s12403-018-00296-3
Zhang, Y., Fitch, P., Vilas, M. P., and Thorburn, P. J. (2019). Applying Multi-Layer Artificial Neural Network and Mutual Information to the Prediction of Trends in Dissolved Oxygen. Front. Environ. Sci. 7, 46. doi:10.3389/fenvs.2019.00046
Zhang, Y. Y., Shao, Q. X., Ye, A. Z., Xing, H. T., and Xia, J. (2016). Integrated Water System Simulation by Considering Hydrological and Biogeochemical Processes: Model Development, with Parameter Sensitivity and Autocalibration. Hydrol. Earth Syst. Sci. 20, 529–553. doi:10.5194/hess-20-529-2016
Zhao, L. Y. (2017). Study on Regional Water Pollution Control Based on MIKE11. Phd diss Nanning: University of Guangxi.
Keywords: cascade river, dissolve oxygen, ecology operation, reservior, water environment
Citation: Zhong M, Liu S, Li K, Jiang H, Jiang T and Tang G (2021) Modeling Spatial Patterns of Dissolved Oxygen and the Impact Mechanisms in a Cascade River. Front. Environ. Sci. 9:781646. doi: 10.3389/fenvs.2021.781646
Received: 23 September 2021; Accepted: 10 November 2021;
Published: 15 November 2021.
Edited by:
Huiyu Dong, Research Center for Eco-environmental Sciences (CAS), ChinaReviewed by:
Joshua O. Ighalo, Nnamdi Azikiwe University, NigeriaMashura Shammi, Jahangirnagar University, Bangladesh
Copyright © 2021 Zhong, Liu, Li, Jiang, Jiang and Tang. This is an open-access article distributed under the terms of the Creative Commons Attribution License (CC BY). The use, distribution or reproduction in other forums is permitted, provided the original author(s) and the copyright owner(s) are credited and that the original publication in this journal is cited, in accordance with accepted academic practice. No use, distribution or reproduction is permitted which does not comply with these terms.
*Correspondence: Tao Jiang, ZWVzanRAbWFpbC5zeXN1LmVkdS5jbg==