- Hunan University of Technology and Business, Changsha, China
With the increasingly obvious restriction of the ecological environment on economic development, environmental regulations are widely used to achieve “green production,” that is, to improve green total factor productivity (GTFP). First, through the econometric model, it can be concluded that command-based environmental regulations could improve GTFP, while market-based environmental regulations have no significant impact on GTFP. Unlike traditional econometric models, machine learning has no specific data requirements and research assumptions. We use Lasso regression to verify the above results by obtaining the optimal tuning parameter. Furthermore, considering that the leap of China’s economy is inseparable from foreign direct investment (FDI), we use FDI as a threshold variable. The threshold model results showe that when the intensity of FDI in China ranges between 1.2492 and 1.588, both types of environmental regulations can significantly promote GTFP. These conclusions passed the robustness test. Given the differences in economy and resource endowment among different regions in China, a regional heterogeneity test is conducted. The results show that the current environmental regulations in eastern and central China have no significant impact on GTFP. However, when the intensity of FDI in central China is greater than 3.6868, environmental regulations have a significant promoting effect on GTFP. In western China, when FDI intensity ranges between 1.3950 and 1.5880, market-based environmental regulations can significantly promote GTFP. Further, the path test of the mediation effect model reveals that command-based environmental regulations reduce GTFP by reducing FDI. The above conclusions provide empirical data for the intensity of FDI in different regions of China to improve GTFP.
Introduction
Since the reform and opening up in 1978, China has adopted a sloppy production strategy in the industrial sector. While this approach and inappropriate economic growth strategies (Nathaniel et al., 2021a) have greatly contributed to the economic growth of China, China’s environmental problems have become increasingly serious, for example, the haze in the Beijing-Tianjin-Hebei region in 2015 and dust storms in Inner Mongolia in 2017. Thus, achieving green development is urgently required in China. The essence of green development is to reduce resource consumption, reduce environmental pollution, and achieve comprehensive, coordinated, and sustainable development of the economic, social, and ecological environment (Wu et al., 2021a). This proposes increased requirements for national sustainability practices (Nathaniel et al., 2021b).
The Chinese government has made substantial efforts to achieve sustainable development by adopting various measures, such as establishing carbon markets and implementing environmental taxes/charges (Liao and Shi, 2018) and green energy infrastructure (Cheng et al., 2021). Li et al. (2021), and has focused on the application of hydrogen energy and fuel cell electric vehicles in ASEAN countries. Its economic competitiveness and environmental implications may inspire future developments (Li and Kimura, 2021).
Our study focuses on the effects of environmental regulations on green development. Given that the proportion of public participation in environmental protection in China is still low, the main forms of environmental regulation are command-based environmental regulations and market-based environmental regulations. The effectiveness of different environmental regulations also depends on the degree of marketization and government decision-making behavior in each region, as well as FDI (Jiang et al., 2020). Whether environmental regulations can improve the GTFP and whether this effect varies regionally in China are two issues that need to be addressed.
To quantify “green production,” we used the Malmquist-Luenberger index (ML index) under the Slacks-Based Measure (SBM) model and max-Data Envelopment Analysis (DEA) to measure green total factor productivity (GTFP) in each Chinese province (except Tibet). Simultaneously, we also used China’s provincial macro data to measure environmental regulation. We not only studied the impact of environmental regulations on GTFP, but also considered the impacts of FDI intensity. Considering the regional differences in China (Wu et al., 2021b), the impact of environmental regulations in various regions of China on GTFP will be studied separately. Finally, through the intermediary effect model, we explored the mechanism path of the effects of environmental regulations on GTFP.
In view of the research on environmental regulations and GTFP, few studies have introduced machine learning into this field. Moreover, traditional econometric models often have certain data requirements and research assumptions, but in reality, we cannot make assumptions about real data. Machine learning has no such limitations. Therefore, we used machine learning to introduce Lasso regression in this research field to verify the results of the traditional econometric model to achieve breakthrough research on the effect of the traditional single econometric model on environmental regulations. We hope to provide some advice for different regions of China to improve GTFP. To the best of our knowledge, few papers have focused on the effects of environmental regulations by combining econometrics and machine learning.
This paper is structured as follows: Literature Review section reviews the literature, Data and Methodology section presents the data and methods used, Results and Discussion section presents the results, and Conclusion section presents the conclusions.
Literature Review
Review of Theoretical Research
Measurement of GTFP
Since the last century, some scholars have attempted to obtain adjusted GDP values by deducting the market value of environmental externalities from normal GDP values (Nordhaus and Tobin, 1972), namely green GDP. However, green GDP cannot easily quantify environmental and natural resource damage. This has prompted academics to develop GTFP by considering environmental performance in conjunction with environmental variables based on traditional total factor productivity (TFP) indicators.
In the past decades, the GTFP has become an important indicator for examining the quality of China’s economic development. Consequently, a large body of relevant literature has emerged (Long et al., 2016; Wang et al., 2018; Ai et al., 2020). Various studies on GTFP were conducted considering environmental performance. The main productivity measures are the traditional Malmquist index (Yue et al., 2019) and Fischer index. However, these indexes do not consider the non-desired output in the production process during measurement, consequently, leading to errors.
Therefore, researchers have introduced the ML index (Wang et al., 2020), which considers a non-desired output. ML indices have also been used in combination with directional distance functions (Chung et al., 1997), which relaxed the assumption of equal proportionality between the expected output increase, energy saving, and emission reduction (Zhou et al., 2012). Zhang and Choi (2013) considered relaxation errors and infeasible solution problems to construct a total factor CO2 emission indicator based on the non-radial directional distance function. The combination of ML and distance function considers the non-desired output while calculating GTFP, and comprehensively measures the quality of economic growth.
To summarize, because traditional methods, such as Malmquist index and Fischer index, do not account for undesirable output, we preferred to use the ML index method under the SBM model and Max DEA to calculate GTFP for all Chinese provinces (except Tibet) from 2000 to 2017.
Environmental Regulations and GTFP
Several scholars have studied the relationship between environmental regulations and TFP (Ambec et al., 2013; Zhao et al., 2015; Dong et al., 2015). Most of the earlier studies concluded that environmental regulations increased the production costs of firms, leading to varying degrees of productivity loss (Barbera and Mcconnell, 1990; Wayne and Ronald, 1998; Gray and Shadbegian, 2003; Greenstone, et al., 2012; Rexhäuser and Rammer, 2014). Moreover, manufacturing firms prefer to use cheap and polluting fossil fuels to address the rising economic policy uncertainty (Yu et al., 2021), which is not conducive to GTFP. However, some studies have come to a more optimistic conclusion that environmental regulations may improve productivity by forcing firms to carry out technological innovation and reduce compliance costs (Porter and Van, 1995). The above two completely opposite opinions are because researches are based on two different theories, the “compliance cost theory” and the “innovation compensation theory.”
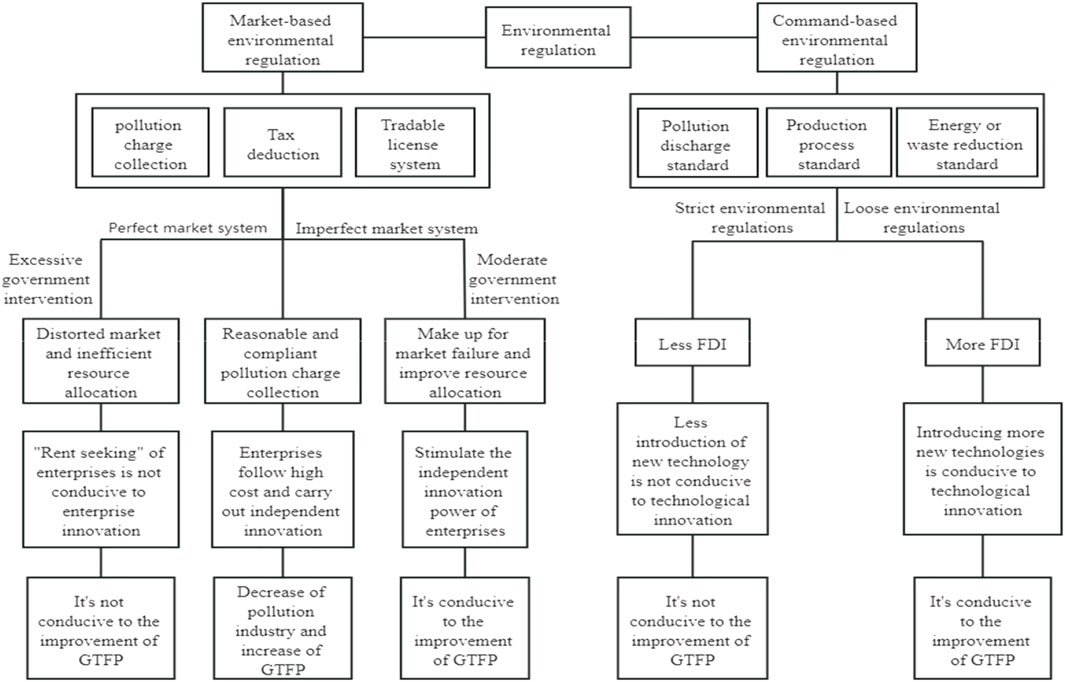
Based on the classification of environmental regulations, we analyzed the effects of command-based environmental regulations and market-based environmental regulations on GTFP separately, as shown in Figure 1. The use of legislation by the government to enact a series of legal policies that can directly regulate emitters is known as command-based environmental regulations. Emission standards, manufacturing process standards, and energy or waste reduction standards are examples of specific initiatives. It is generally believed that command-based environmental regulations do not play a strong role in promoting GTFP because of its administrative nature.
The use of market mechanisms to incentivize polluters to reduce pollution is referred to as market-based environmental regulations. Emissions levies, tradable permit systems, and emission reduction subsidies are some of the specific approaches. By taking German enterprises as the research sample, Bitat (2018) found that only long-term objectives and market incentives are positively associated with eco-innovation. Greater the government’s intervention in markets, greater is the incentive for firms to “rent-seek.” The “rent-seeking” behavior populates most corporate innovations (Li et al., 2020) and weakens the incentive for corporates’ green technology innovation. This is not conducive to GTFP.
Thus, the impact of environmental regulations on GTFP is still uncertain. Environmental regulations may increase costs, thus, crowding out the amount of firms’ innovation expenditure, consequently, resulting in low GTFP. However, environmental regulations may also force firms to conduct green technology innovation to promote GTFP. In addition, the impact of environmental regulations on GTFP may change with the intensity of environmental regulations or other variables. On this basis, we further considered the nonlinear relationships between environmental regulations and GTFP.
Environmental Regulations, FDI, and GTFP
In the past years, China has actively promoted FDI in the hope that it will bring advanced thinking technology, management experience, and green technology. However, national environmental regulation policies determine whether or not FDI has a spillover effect in China. Qiu et al. (2021) suggested that the impact of environmental regulations on FDI inflows was negative. Under the constraint of environmental regulations, enterprises must increase investment in pollution control, which directly increases the cost of enterprises and reduces FDI.
Murshed et al. (2021) confirmed the validity of “pollution heaven hypothesis” in South Asia. FDI inflows are detrimental to the prospects of achieving environmental sustainability within the concerned South Asian countries. Further, FDI brings forward advanced technology while causing environmental pollution in developing countries and regions (Dou and Han, 2019). Qiu et al. (2021) conducted an empirical analysis and confirmed that the “pollution heaven hypothesis” existed in the eastern and central regions of China. In addition, some scholars have pointed out that the FDI spillover effect hinders the progress of industrial technology in China. The solution is to strengthen environmental regulations (Yu and Li, 2020). However, some scholars disagreed and argued that the “pollution heaven hypothesis” was not valid in China. Some scholars have suggested that the positive interaction between FDI and environmental regulations has indirectly led China to strengthen its environmental regulations. In turn, strict environmental regulations could effectively raise the environmental threshold for foreign investment entry and played a “screening” role for FDI (Qiu et al., 2021).
In fact, there is still no unified conclusion on whether the “pollution heaven hypothesis” has been established in China. However, we observed the impact of FDI on the environmental regulations’ effect on GTFP. The existing studies have focused more on the relationship between FDI and environmental regulations or GTFP, but few studies have considered FDI as a threshold variable to study the impact of its intensity change on the effects of environmental regulations. Therefore, in this study, we focused on the effect of changes in FDI intensity on the effect of environmental regulations on GTFP. We used FDI as a threshold variable to consider the effect of FDI intensity change on the effect of environmental regulations on GTFP.
Review of Research Methods
The effect of environmental regulations on GTFP is studied using the linear probability and the proportional hazards models (Ai et al., 2020), systematic generalized estimation method (GMM), dynamic count data model (Bitat, 2018), difference-in-difference (DID) model (Zhang et al., 2021), bootstrap panel Granger causality test (Liu et al., 2021), spatial model (Peng, 2020) and evolutionary game theory (Ulph, 2000). It is concluded that environmental regulations have an “innovation compensation effect,” thus, increasing productivity. The above econometric models are not only the mainstream research approaches in the study of environmental regulations and GTFP, but also one of the main methods used in this study.
In addition, in the field of environment, several researchers have used machine learning to study air pollution, CO2 emissions, and energy consumption. Some researchers have used machine learning to identify causal relationships (Payne, 2012). Mele and Magazzino (2020) used a causal direction from depth (D2C) algorithm to derive higher pollution caused by economic growth concentrations, which may contribute to neocrown pneumonia by making the respiratory system more susceptible to infection. Similarly, Cosimo et al. (2021) used the D2C algorithm to identify and predict the causality of coal consumption, solar wind production, economic growth, and CO2 emissions in China, India, and the United States.
Among the existing studies, most of the research on environmental regulations and GTFP has been based on econometric models. In their linear regression studies, none of the scholars have introduced machine learning into the field. Therefore, we combined econometric models with machine learning and used the least absolute shrinkage and selection operator (Lasso) regression to test the results of the econometric empirical. Subsequently, the regional heterogeneity of the impact of environmental regulations on GTFP was analyzed.
Data and Methodology
Data
Core Variables
The explained variable included green total factor productivity (GTFP), which is the inclusion of environmental pollution caused by production as a non-desired output in the calculation of TFP. We used the ML index method under the SBM model to measure the GTFP of Chinese provinces from 2000 to 2017. According to the Malmquist- Luenberger index (ML index)-based approach proposed by Chung et al. (1997):
The ML index can be decomposed into two components, the efficiency improvement index (EFFCH) and the technological progress index (TECH). An ML > 1 indicates that TFP grows. An EFFCH > 1 indicates an improvement in efficiency. A TECH > 1 indicates technological progress. ML is the growth rate of the GTFP, and t represents time. D is the production unit, and x, y, and b are the input factors, desired output, and non-desired output, respectively. The input elements include 1) the capital stock of each province: Kit = Iit+(1-δit)Kit−1, where Iit is the total fixed capital formation. δ is the depreciation rate of fixed assets, 2) the number of employed persons in each province at the end of each year, and 3) resources (standard coal) consumed by each province annually. The expected output is the total GDP of each province. The non-desired output is the industrial solid waste emissions of each province. By applying Max DEA software, the GTFP of 30 Chinese provinces from 2000 to 2017 was measured.
Core explanatory variables are market-based environmental regulations (MER) and command-based environmental regulations (IER). We used the amount of sewage charges collected by each Chinese province as a percentage of the province’s GDP during 2007–2017 as market-based environmental regulations. We chose the percentage of actual pollution control investment in the GDP of each Chinese province from 2007 to 2017 as the indicator of command-based environmental regulations. The actual pollution input refers to industrial pollution control investment, construction projects’ “three simultaneous” investment in environmental protection, waste gas, and wastewater pollution control facilities operating costs. Specific control variables can be seen in Table 1.
Sources of Data and Descriptive Analysis
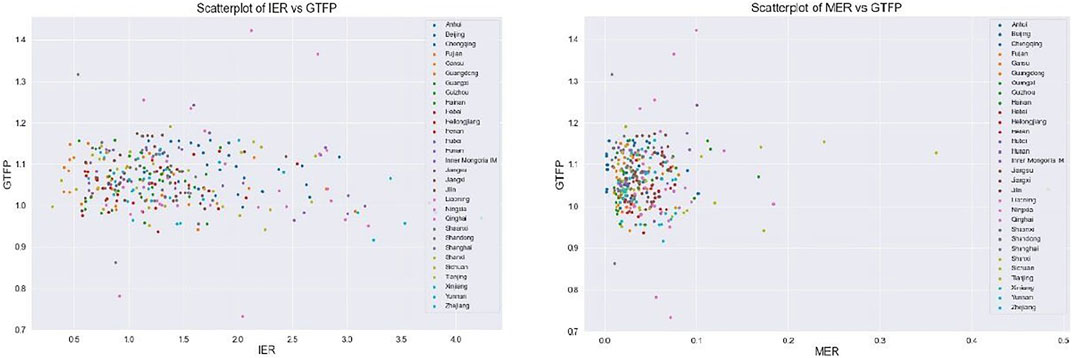
We selected the panel data of 30 provinces, autonomous regions, and municipalities directly under the central government in China from 2007 to 2017 as sample data. All data were obtained from the China Statistical Yearbook, China Statistical Yearbook of Industrial Economy, China Statistical Yearbook of Energy, China Environmental Yearbook, and the statistical yearbooks of each province in previous years. Descriptive statistics of the variables are shown in Supplementary Table S1. The correlations between the core explanatory variables and the explained variables are visualized and analyzed in Figure 2.
From Figure 2, GTFP is concentrated between 1.0 and 1.2. The values of IER are concentrated between 0.5 and 1.5. The values of MER are all concentrated between 0 and 0.1. IER was negatively correlated with GTFP, but MER was not correlated with GTFP. This was further validated using econometric models and machine learning.
Methodology
Orthogonal Least Square Regression
To explore the relationship between the two variables, we used the regression method of econometrics. The regression model equation can be expressed as follows:
where yi is the dependent variable, xi is the explanatory variable, α is the intercept term, and εi is the residual term.
For the above regression models, OLS is the most commonly used method for estimating model coefficients (Helwig, 2017). The OLS method estimates the parameters in the regression model by minimizing the error between the predicted and observed values of the outcome variable, which can provide the most accurate linear unbiased estimates for the current sample (Chartterjee and Hadi, 2006).
In the standard OLS regression, the parameter estimates of the regression model can be obtained by the following optimization problem:
However, the OLS approach focuses on unbiased estimation of the current dataset, which can easily lead to overfitting of the model (Yarkoni and Westfall, 2017).
Lasso Regression
With the rise and development of machine learning, more statistical tools have emerged. These tools continue to compensate for the limitations of the traditional methods. Among them, the regularization method represented by the least absolute shrinkage and selection operator (Lasso) method (Tibshirani, 1996) can effectively optimize OLS estimation and deal with the overfitting problem (Candes and Tao, 2007). By adding a penalty term to the model estimation, the regularization method can compress regression coefficients that are too small or zero at the cost of some estimation bias to obtain higher model prediction accuracy and model generalization capability.
Compared to the OLS estimation mentioned above, the Lasso method adds
where
In addition, there is another use of Lasso, called postselection. In other words, Lasso regression was used to screen independent variables, and then the model without penalty was used for regression. The results of this method can be used as a reference for comparing the results of various models and can also be used for variable screening. However, because too many variables were eliminated when Lasso screened variables, Zou and Hastie (2005) proposed elastic net regression, which can be represented as the following Eq. 5:
where α is the penalty coefficient of the elastic net. α = 0 is ridge regression, and α = 1 is Lasso regression.
Threshold Model
The threshold effect refers to the phenomenon in which when one parameter reaches a certain value or range, its effect on another parameter is reversed. This threshold value is the threshold value referred to in the threshold model. Compared with the linear model, the threshold model can explore the relationship between explanatory variables and explained variables more accurately. Threshold regression eliminates the interference of subjective factors of data, and it can also complete a significance test of the threshold value when calculating the threshold value of the sample data. Its model form is as follows:
where yit is the dependent variable, xit is an independent variable, qit is a threshold variable, γ is the threshold value, and εit is the interference term. The individual intercept term ui represents the fixed-effect mode. Using the indicative function
where
Double threshold panel regression model:
Mediation Model
The mediating effect is an important statistical method. The influence of independent variable X on dependent variable Y indirectly acts on the dependent variable Y through intermediary variable M. This type of effect is an intermediary effect. According to Baron and Kenny (1986), the following model can be constructed to describe the relationship between the variables:
where M is an intermediate variable, Y is the dependent variable, and X is an independent variable. Baron and Kenny (1986) recommend testing using Eqs 9–11. Further, the Sobel Z-test used to test the indirect path of a × b can be represented as:
where
However, Zhao et al. (2010) criticized the above test method and suggested that Baron and Kenny’s “three tests and Sobel” could be replaced with one test: a Bootstrap test of indirect effect a × b. Thus, we adopted the Bootstrap test to test the mediating effect of environmental regulations on GTFP.
Results and Discussion
Empirical Results
To verify the effects of different types of environmental regulations on GTFP, we examined the effects of command-based environmental regulations and market-based environmental regulations on GTFP using data from 30 provinces in China as a sample. The following panel linear regression model was constructed.
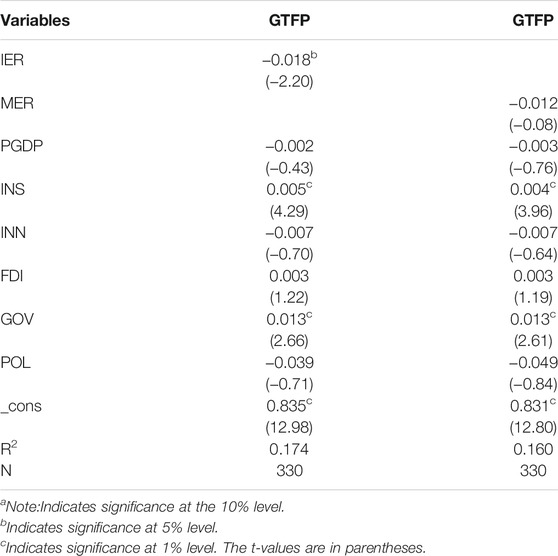
where GTFPit denotes the GTFP of province i in year t. Further, ERit denotes the environmental regulations of province i in year t, including IERit and MERit, which denote the command-based environmental regulations and market-based environmental regulations of province i in year t, respectively. Control variables include economic development level (PGDP), industrial structure (INS), intensity of research and development (INN), foreign direct investment (FDI), government intervention (GOV), and pollution control investment (POL). ξit is the error term. We used a panel model to regress Eq. 13, and the results are listed in Table 2.
After the Hausman test, we chose a fixed-effects panel model. The empirical evidence shows that command-based environmental regulations have a negative effect on GTFP, which is significant at the 5% significance level. We believe that command-based environmental regulations increase firm costs, which is counterproductive to improving GTFP. Market-based environmental regulations have no significant impact on GTFP. Most studies show that market-based environmental regulation provides enterprises with increased autonomy and is more conducive to stimulate the green technology innovation of enterprises (Peng et al., 2021). However, there is a time lag in the response of enterprises to market-based environmental regulation (Liu et al., 2021). In addition, the basis for the market-based environmental regulation is a sound market economy system (Zhang, 2021). China’s incomplete and inadequate market economy system results in no significant effect of market-based environmental regulations on GTFP. Among the control variables, industrial structure and government intervention can significantly contribute to the development of GTFP, while other control variables have no significant effect on GTFP.
Machine Learning
Econometric models have concluded that command-based environmental regulations are negatively associated with GTFP, while market-based environmental regulations have no significant effect on GTFP. Furthermore, the above empirical results were validated by Lasso regression in machine learning.
Selection of the Optimal λ
Lasso regression is usually used to determine the value of the tuning parameter λ, that is, to find the λ that minimizes the out-of-sample MSE. We selected the optimal λ based on the above four methods of CV, adaptive, plugin, and elastic network regression. It is worth noting that the default of elastic network regression is still a CV test. Initially, we compared the MSEs of the above four methods to select the optimal model.
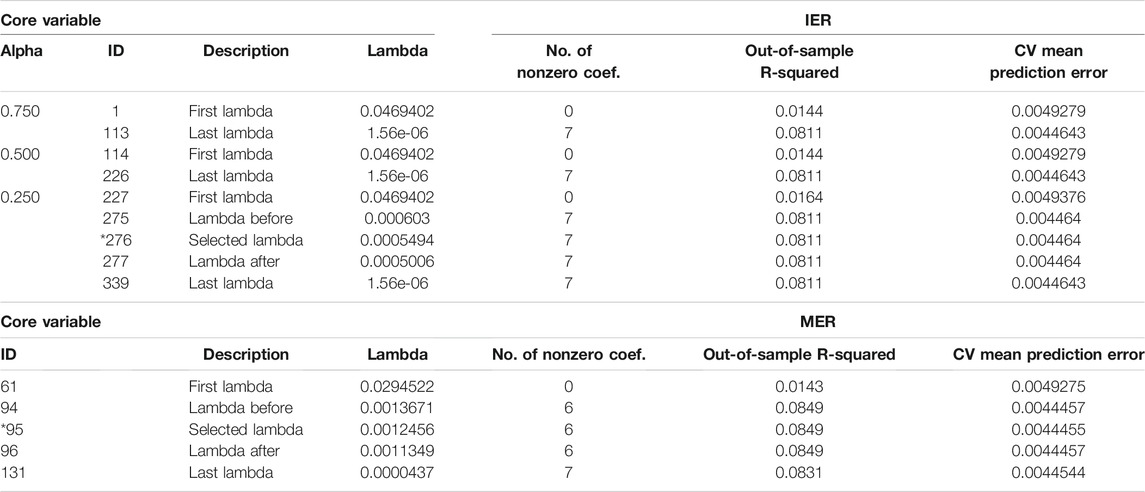
As seen in Table 3, when the core variable was IER, the elastic network regression had the smallest MSE; therefore, the optimal model should be the elastic network model. When the core variable was MER, the adaptive method of Lasso regression had the smallest MSE. Therefore, the optimal model should be the adaptive method of Lasso regression. Based on the elastic network model and adaptive method of Lasso regression, we selected the optimal λ. The penalty coefficients α of the elastic net were 0.25, 0.5, and 0.75.
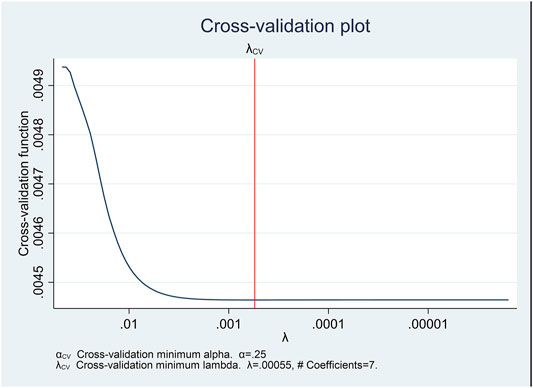
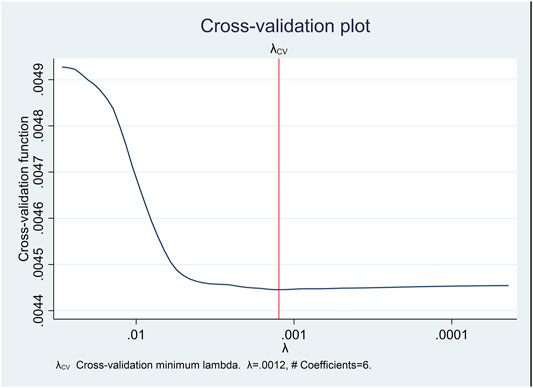
According to Table 4, the core variable was IER, and when the penalty coefficients of elastic net were α = 0.75 and α = 0.5, seven variables were included. There were two final values of λ, but neither was optimal. When α = 0.25, the optimal λ value was λ = 0.0005494. The CV mean prediction error was 0.004464, which was the minimum value. When the core variable was MER, Lasso regression selected the optimal λ = 0.0012456. At this time, the number of variables was 7, implying that some variables were removed. Moreover, the CV mean prediction error was 0.0044455.
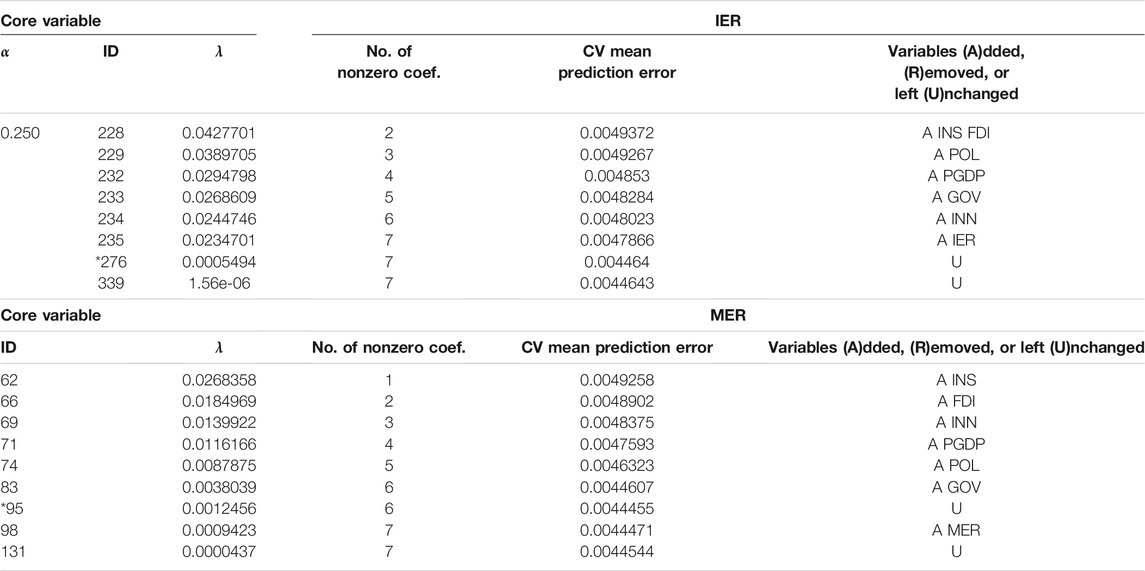
Figures 3, 4 indicate that λcv is the minimum λ value under the elastic network regression cross test and Lasso regression. The optimal λ values were 0.0005494 and 0.0012456. The process of λ selection in the elastic network model and Lasso regression is shown in Table 5. As the optimal λ occurred when α = 0.25, we only showed the results of α = 0.25 in the elastic network regression.
As the optimal λ value had been obtained previously, the selection process for different λ values is further examined comprehensively in Table 5. When the core variable was IER, α = 0.25, ID = 276, and λ = 0.0005494, all seven variables were entered. At this time, the minimum CV mean prediction error was 0.004464, and λ = 0.0005494 was also the optimal λ. When the core variable was MER, ID = 95, λ = 0.0012456 and the number of variables was 6. At this time, CV mean prediction error reached the minimum of 0.0044455, and λ is also the optimal λ. However, when ID = 98, the last variable MER entered, but λ was not the optimal value, and CV mean prediction error was bigger than that of ID = 95. This indicates that when λ reaches the optimal value, variable MER is not included. We further performed sensitivity analysis.
Finally, a sensitivity analysis was conducted according to the results in Table 5. The tuning parameter λ′ (ID = 277/ID = 94) near the optimal λ value was manually selected, and the result was denoted as “Hand.” The results are shown in Supplementary Table S2 that indicated that the MSEs of the Hand was larger. Hence, λ = 0.0005494 and λ = 0.0012456 were the optimal λ.
Causal Inference
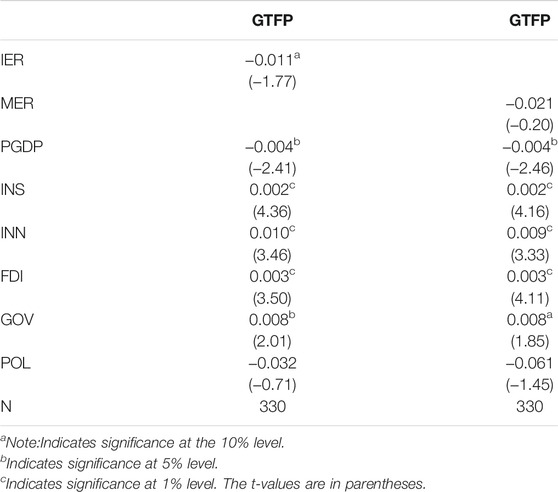
It has been concluded that the optimal λ = 0.0005494 when the core explanatory variable includes command-based environmental regulations, and the optimal λ = 0.0012456 when the core explanatory variable includes market-based environmental regulations. In this section, we explore the causal relationship between the core explanatory variables and GTFP. In this study, cross-fit partialing out Lasso linear regression was used to conduct a Lasso regression for causal inference.
Lasso regression results are shown in Table 6 and indicate that the regression coefficient of command-based environmental regulations on GTFP is negative and significant; that is, command-based environmental regulations cannot promote GTFP. The regression coefficient of market-based environmental regulations on GTFP is negative but not significant, that is, market-based environmental regulations have no impact on GTFP. These results are consistent with those of the econometric model.
Threshold Effect Model
Most of the previous studies have used linear models to study the effects of environmental regulations on GTFP. However, if the relationship between environmental regulations and GTFP is nonlinear, the former results are biased. We further analyzed the nonlinear relationships between environmental regulations and GTFP using a threshold panel model with FDI as the threshold variable.
The threshold panel model was set as given below. It is assumed that for a specific threshold ξ, the effect of environmental regulations on GTFP differs significantly when FDI ≤ ξ and FDI > ξ.
where
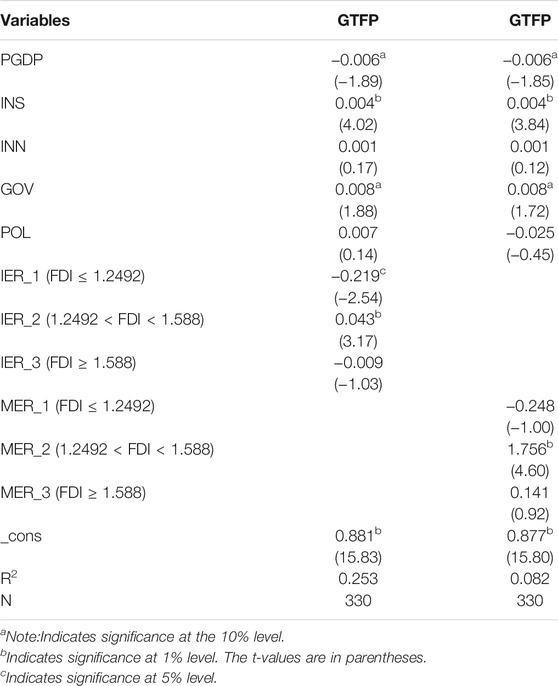
First, we conducted a self-sampling test on the threshold effect of environmental regulations on the GTFP. The corresponding results are shown in Supplementary Table S3 that revealed that two types of environmental regulations had a double threshold effect on GTFP, with FDI as the threshold variable. The first and second threshold values were 1.2492 and 1.5880, respectively.
The regression results of the panel threshold model are presented in Table 7. When FDI is less than 1.2492, command-based environmental regulations are significantly unfavorable to the increase in GTFP. When FDI is between 1.2492 and 1.588, it promotes GTFP. When FDI is greater than 1.588, there is no significant influence on GTFP. Similarly, when FDI intensity is between 1.2492 and 1.588, market-based environmental regulations significantly promote GTFP. Further, at other FDI intensities, market-based environmental regulations have no significant impact on GTFP. Therefore, to enhance the promoting effect of environmental regulations on GTFP, FDI intensity must be controlled between 1.2492 and 1.588.
Robustness Test
First, we added the control variable human capital level (the natural logarithm of the average number of institutions of higher learning per 100,000 population in each province). Second, to overcome the influence of the outliers and non-randomness of GTFP on the model estimation results, we eliminated the 1% maximum and minimum values of GTFP. The results are shown in Supplementary Table S4.
The robustness results showed that command-based environmental regulations were still significantly unfavorable to the improvement of GTFP after the addition of control variable education, while market-based environmental regulations had no significant impact on GTFP. In addition, the impact of environmental regulations on GTFP had a double threshold effect, and the optimal FDI intensity should be between 1.2492 and 1.5880, so that the two types of environmental regulations could promote GTFP. After screening the outliers of GTFP, we can obtain the same results. The robustness of the results is demonstrated in Supplementary Table S4.
Regional Heterogeneity Analysis
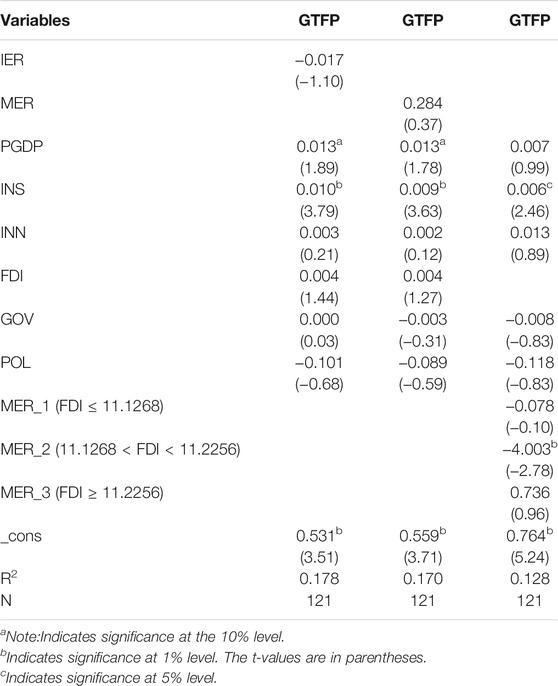
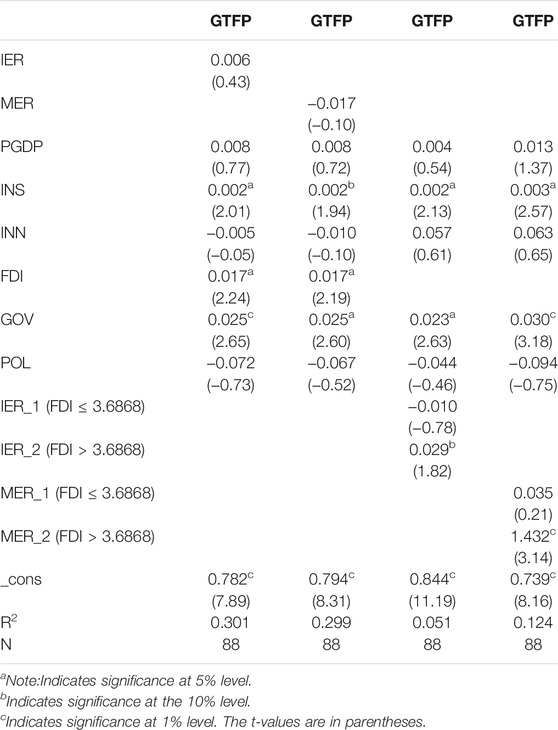
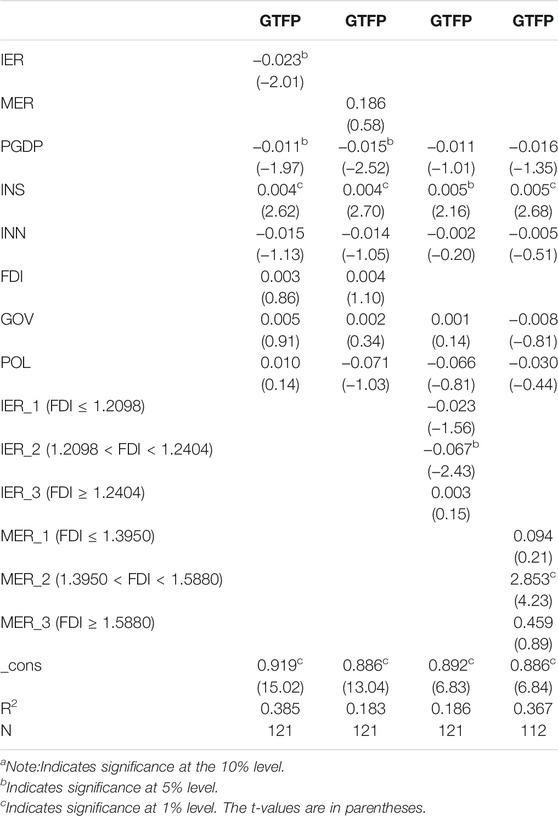
Environmental regulations as a policy will have a time lag. In addition, traditional panel models may suffer from problems, such as endogeneity of variables, different initial conditions, and the development of each province. Therefore, China’s provinces were divided into eastern, central, and western regions for analysis. The linear and nonlinear effects of environmental regulations in different regions on GTFP were tested using the econometric model, as shown in Tables 8–11.
Table 8 shows that environmental regulations in eastern China had no significant impact on GTFP. Moreover, there was no threshold effect of command-based environmental regulations on GTFP in eastern China, but there was a threshold effect of market-based environmental regulations on GTFP with FDI as the threshold variable. When FDI intensity was between 11.1268 and 11.2256, market-based environmental regulations had a significant negative effect on GTFP.
As shown in Table 9, the environmental regulations in central China had no significant impact on GTFP. However, there is a threshold effect of FDI as the threshold variable. When the FDI intensity was greater than 3.6868, both types of environmental regulation had a significant promoting effect on GTFP. Therefore, it is necessary to increase the intensity of FDI in the central region.
Table 10 showed that command-based environmental regulations in western China were significantly detrimental to the growth of GTFP, while market-based environmental regulations had no significant impact on GTFP. In addition, through the threshold test, it was found that when FDI intensity was between 1.2098 and 1.2404, command-based environmental regulations had a significant hindrance effect on GTFP. When FDI intensity was between 1.3950 and 1.5880, market-based environmental regulations could significantly improve GTFP. Therefore, the optimal FDI intensity in western China should be between 1.3950 and 1.5880.
Intermediation Effect Test
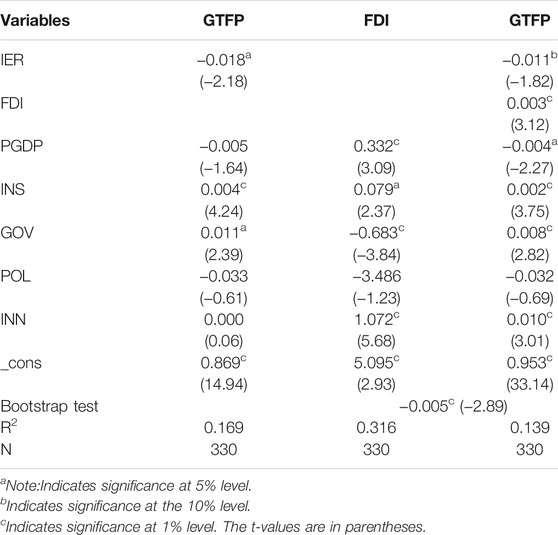
In the previous econometric model and machine learning validation, command-based environmental regulations had a significant effect on GTFP. Furthermore, we analyzed the mechanism of command-based environmental regulations on GTFP. The following mediation model was developed:
where t represents time, i represents the province, and μit is a random disturbance term. The intermediate effect model estimation results are presented in Table 11.
Since the Sobel test is prone to Type I errors in the hypothesis test (Zhao et al., 2010), the Bootstrap method was used for the mediation test. The test results are presented in Table 11. The result of the bootstrap test was negative and significant at the 1% significance level, implying that a negative mediating effect existed. The results indicated that command-based environmental regulations were significantly detrimental to the increase in FDI, which in turn, increased GTFP. Therefore, command-based environmental regulations are detrimental to the increase in GTFP by reducing FDI.
Discussion
First, we studied the effects of environmental regulations on GTFP using econometric analysis and machine learning methods, such as panel models, machine learning Lasso regression. The results confirmed that the current command-based environmental regulations are significantly detrimental to GTFP, and market-based environmental regulations have no significant effect on GTFP. However, these results were not consistent with those by Zhang (2021), who argued that both types of environmental regulations promote green productivity. However, command-based environmental regulations can be effective but are often less efficient (Peng et al., 2021). Further, there is a time lag in the response of enterprises to market-based environmental regulation (Liu et al., 2021) and China’s market system does not function well, which will affect the impact of market-based environmental regulations. We then used machine learning Lasso regression to confirm the previous findings and derived the optimal λ = 0.0005494 and λ = 0.0012456, which indicate the breakthrough of machine learning applications in estimating the effect of environmental regulation policy.
Second, we observed that when the intensity of FDI ranged between 1.2492 and 1.5880, both types of environmental regulations significantly affected GTFP. According to an analysis of regional heterogeneity, environmental regulations in eastern China have no significant impact on GTFP. Central China’s environmental regulations have a significant promoting effect on GTFP when the FDI intensity is greater than 3.6868. In western China, when the FDI intensity is between 1.2098 and 1.2404, command-based environmental regulations significantly hinder GTFP. Further, when the FDI intensity ranges between 1.3950 and 1.5880, market-based environmental regulations can significantly improve GTFP. Therefore, the optimal FDI intensity in western China should range between 1.3950 and 1.5880. Moreover, command-based environmental regulations are detrimental to the increase in GTFP by reducing FDI. This is consistent with the study of Qiu et al. (2021), who reported that FDI reduces GTFP. This provides a theoretical basis for formulating environmental regulation policies according to local conditions in China.
However, our research can be improved further. First, while selecting samples, we can consider the data of other Chinese cities. However, corresponding macro data are lacking in China. Second, we only considered the impacts of FDI on the effects of environmental regulations on GTFP. Other influencing factors can be further considered in future studies.
Conclusion
As environmental regulations have become the main factors of environmental governance in China, whether environmental regulation can achieve a “win-win” between environmental conservation and economic development has become the focus of attention. Further, whether environmental regulations can promote GTFP is a main indicator to judge the effectiveness of environmental regulations. This is also a significant factor for China’s sustainable economic development and high-quality development.
In addition to the traditional econometric models, our study also used Lasso model of machine learning, which is a breakthrough in the research of environmental regulations. Machine learning does not work on the data and model assumptions of traditional econometric models, and can better explore the causal relationship of the acquired data. We observed that command-based environmental regulations are significantly detrimental to GTFP, and market-based environmental regulations have no significant effect on GTFP. Additionally, we found that when the FDI intensity increases between 1.2492 and 1.5880, both types of environmental regulations significantly impact GTFP. There are also regional differences in the effects of FDI on environmental regulations on GTFP. Further, command-based environmental regulations are detrimental to the increase in GTFP by reducing FDI.
The following policy recommendations are proposed: First, the intensity of FDI should be rationally controlled. When the FDI-to-fixed-assets ratio is between 1.2492 and 1.5880, command-based environmental regulations can significantly boost China’s GDP. Second, reasonable environmental regulations should be selected according to regional differences because the impact of environmental regulations on GTFP varies regionally. Moreover, the introduction of FDI should also be accompanied by the establishment of a corresponding system for foreign investment, which should encourage foreign investment with advanced technologies to enter China and prevent polluting enterprises from moving to China and consider China as their “pollution heaven.” Finally, the share of environmental protection expenditure in the general government budget should be further increased. Government action is a powerful signal. Increased government spending on environmental protection can release market and policy signals for green production and green consumption patterns, which influence business behavior and consumer behavior, thus, further affecting GTFP.
Data Availability Statement
The raw data supporting the conclusions of this article will be made available by the authors, without undue reservation.
Author Contributions
JF proposed the research idea, developed the model and wrote the first manuscript draft. JY analyzed and visualized the data. XT wrote, reviewed, and edited the manuscript.
Funding
We are grateful to the National Natural Science Foundation of China (72091511), the Natural Science Foundation of Hunan Province (2020JJ4259), the Scientific research project of Hunan Education Department (20A121) and Hunan Provincial Innovation Foundation For Postgraduate (CX20211117) for providing financial assistance for this study.
Conflict of Interest
The authors declare that the research was conducted in the absence of any commercial or financial relationships that could be construed as a potential conflict of interest.
Publisher’s Note
All claims expressed in this article are solely those of the authors and do not necessarily represent those of their affiliated organizations, or those of the publisher, the editors and the reviewers. Any product that may be evaluated in this article, or claim that may be made by its manufacturer, is not guaranteed or endorsed by the publisher.
Supplementary Material
The Supplementary Material for this article can be found online at: https://www.frontiersin.org/articles/10.3389/fenvs.2021.779358/full#supplementary-material
References
Ai, H., Hu, S., Li, K., and Shao, S. (2020). Environmental Regulation, Total Factor Productivity, and enterprise Duration: Evidence from China. Bus Strat Env 29, 2284–2296. doi:10.1002/bse.2502
Barbera, A. J., and Mcconnell, V. D. (1990). The Impact of Environmental Regulations on Industry Productivity: Direct and Indirect Effects. J. Environ. Econ. Manag. 18, 50–65. doi:10.1016/0095-0696(90)90051-Y
Baron, R. M., and Kenny, D. A. (1986). The Moderator-Mediator Variable Distinction in Social Psychological Research: Conceptual, Strategic, and Statistical Considerations. J. Personal. Soc. Psychol. 51, 1173–1182. doi:10.1037/0022-3514.51.6.1173
Bitat, A. (2018). Environmental Regulation and Eco-Innovation: the Porter Hypothesis Refined. Eurasian Bus. Rev. 8, 299–321. doi:10.1007/s40821-017-0084-6
Candes, E., and Tao, T. (2007). The Dantzig Selector: Statistical Estimation when P Is Much Larger Than N. Ann. Statist. 35, 2313–2351. doi:10.1214/009053606000001523
Chatterjee, S., and Hadi, A. S. (2006). Regression by Example. 4th Edition. Hoboken: John Wiley & Sons. doi:10.1002/0470055464
Cheng, D., Shi, X., and Yu, J. (2021). The Impact of green Energy Infrastructure on Firm Productivity: Evidence from the Three Gorges Project in China. Int. Rev. Econ. Finance 71, 385–406. doi:10.1016/j.iref.2020.09.022
Chung, Y. H., Färe, R., and Grosskopf, S. (1997). Productivity and Undesirable Outputs: A Directional Distance Function Approach. J. Environ. Manage. 51, 229–240. doi:10.1006/jema.1997.0146
Dong, J., Xue, G., Dong, M., and Xu, X. (2015). Energy-saving Power Generation Dispatching in China: Regulations, Pilot Projects and Policy Recommendations-A Review. Renew. Sust. Energ. Rev. 43, 1285–1300. doi:10.1016/j.rser.2014.11.037
Dou, J., and Han, X. (2019). How Does the Industry Mobility Affect Pollution Industry Transfer in China: Empirical Test on Pollution Haven Hypothesis and Porter Hypothesis. J. Clean. Prod. 217, 105–115. doi:10.1016/j.jclepro.2019.01.147
Gray, W. B., and Shadbegian, R. J. (2003). Plant Vintage, Technology, and Environmental Regulation. J. Environ. Econ. Manag. 46, 384–402. doi:10.1016/S0095-0696(03)00031-7
Greenstone, M., List, J., and Syverson, C. (2012). The Effects of Environmental Regulation on the Competitiveness of US Manufacturing. Cambridge, United States: NBER working paper No.18392. doi:10.3386/w18392
Helwig, N. E. (2017). Adding Bias to Reduce Variance in Psychological Results: A Tutorial on Penalized Regression. Tqmp 13, 1–19. doi:10.20982/tqmp.13.1.p001
Jiang, X., Fu, W., and Li, G. (2020). Can the Improvement of Living Environment Stimulate Urban Innovation?--Analysis of High-Quality Innovative Talents and Foreign Direct Investment Spillover Effect Mechanism. J. Clean. Prod. 255, 120212. doi:10.1016/j.jclepro.2020.120212
Lanoie, P., Ambec, S., Cohen, M. A., and Elgie, S. (2013). The porter Hypothesis at 20: Can Environmental Regulation Enhance Innovation and Competitiveness? SSRN J. 7, 2–22. doi:10.2139/ssrn.1682001
Li, J., Shan, Y., Tian, G., and Hao, X. (2020). Labor Cost, Government Intervention, and Corporate Innovation: Evidence from China. J. Corporate Finance 64, 101668. doi:10.1016/j.jcorpfin.2020.101668
Li, Y. F., Jiang, H., Farhad, T. H., and Wei, W. (2021). Review on the Economics of Hydrogen Production Technology from Renewable Energy and its Application Evaluation in ASEAN. J. Glob. Energ. Interconnection 4, 292–300. doi:10.19705/j.cnki.issn2096-5125.2021.03.009
Li, Y., and Kimura, S. (2021). Economic Competitiveness and Environmental Implications of Hydrogen Energy and Fuel Cell Electric Vehicles in ASEAN Countries: The Current and Future Scenarios. Energy Policy 148, 111980. doi:10.1016/j.enpol.2020.111980
Liao, X., and Shi, X. (2018). Public Appeal, Environmental Regulation and green Investment: Evidence from China. Energy Policy 119, 554–562. doi:10.1016/j.enpol.2018.05.020
Liu, L., Jiang, J., Bian, J., Liu, Y., Lin, G., and Yin, Y. (2021). Are Environmental Regulations Holding Back Industrial Growth? Evidence from China. J. Clean. Prod. 306, 127007. doi:10.1016/j.jclepro.2021.127007
Long, R., Shao, T., and Chen, H. (2016). Spatial Econometric Analysis of China's Province-Level Industrial Carbon Productivity and its Influencing Factors. Appl. Energ. 166, 210–219. doi:10.1016/j.apenergy.2015.09.100
Magazzino, C., Mele, M., and Schneider, N. (2021). A Machine Learning Approach on the Relationship Among Solar and Wind Energy Production, Coal Consumption, GDP, and CO2 Emissions. Renew. Energ. 167, 99–115. doi:10.1016/j.renene.2020.11.050
Mele, M., and Magazzino, C. (2020). Pollution, Economic Growth, and COVID-19 Deaths in India: a Machine Learning Evidence. Environ. Sci. Pollut. Res. 28, 2669–2677. doi:10.1007/s11356-020-10689-0
Murshed, M., Rahman, M. A., Alam, M. S., Ahmad, P., and Dagar, V. (2021). The Nexus between Environmental Regulations, Economic Growth, and Environmental Sustainability: Linking Environmental Patents to Ecological Footprint Reduction in South Asia. Environ. Sci. Pollut. Res. 28, 49967–49988. doi:10.1007/s11356-021-13381-z
Nathaniel, S. P., Murshed, M., and Bassim, M. (2021a). The Nexus between Economic Growth, Energy Use, International Trade and Ecological Footprints: the Role of Environmental Regulations in N11 Countries. Energ. Ecol. Environ. 6, 496–512. doi:10.1007/s40974-020-00205-y
Nathaniel, S. P., Yalçiner, K., and Bekun, F. V. (2021b). Assessing the Environmental Sustainability Corridor: Linking Natural Resources, Renewable Energy, Human Capital, and Ecological Footprint in BRICS. Resour. Pol. 70, 101924. doi:10.1016/j.resourpol.2020.101924
Nordhaus, W. D., and Tobin, J. (1972). “Is Growth Obsolete?,” in Economic Research: Retrospect and Prospect. Editors W. D. Nordhaus, and J. Tobin (Cambridge: National Bureau of Economic Research), 1–80.
Payne, J. E. (2012). The Causal Dynamics between US Renewable Energy Consumption, Output, Emissions, and Oil Prices. Energ. Sourc. B: Econ. Plann. Pol. 7, 323–330. doi:10.1080/15567249.2011.595248
Peng, J., Xie, R., Ma, C., and Fu, Y. (2021). Market-based Environmental Regulation and Total Factor Productivity: Evidence from Chinese Enterprises. Econ. Model. 95, 394–407. doi:10.1016/j.econmod.2020.03.006
Peng, X. (2020). Strategic Interaction of Environmental Regulation and green Productivity Growth in China: Green Innovation or Pollution Refuge? Sci. Total Environ. 732, 139200. doi:10.1016/j.scitotenv.2020.139200
Porter, M. E., and Van, D. L. C. (1995). Green and Competitive: Ending the Stalemate. Harv. Bus. Rev. 28, 128–129.
Qiu, S., Wang, Z., and Geng, S. (2021). How Do Environmental Regulation and Foreign Investment Behavior Affect green Productivity Growth in the Industrial Sector? an Empirical Test Based on Chinese Provincial Panel Data. J. Environ. Manage. 287, 112282. doi:10.1016/j.jenvman.2021.112282
Rexhäuser, S., and Rammer, C. (2014). Environmental Innovations and Firm Profitability: Unmasking the Porter Hypothesis. Environ. Resource Econ. 57, 145–167. doi:10.1007/s10640-013-9671-x
Tibshirani, R. (1996). Regression Shrinkage and Selection via the Lasso. J. R. Stat. Soc. Ser. B (Methodological) 58, 267–288. doi:10.1111/j.2517-6161.1996.tb02080.x
Ulph, A. (2000). Harmonization and Optimal Environmental Policy in a Federal System with Asymmetric Information. J. Environ. Econ. Manag. 39, 224–241. doi:10.1006/jeem.1999.1098
Wang, K.-L., Pang, S.-Q., Ding, L.-L., and Miao, Z. (2020). Combining the Biennial Malmquist-Luenberger index and Panel Quantile Regression to Analyze the green Total Factor Productivity of the Industrial Sector in China. Sci. Total Environ. 739 (15), 140280. doi:10.1016/j.scitotenv.2020.140280
Wang, K., Wei, Y.-M., and Huang, Z. (2018). Environmental Efficiency and Abatement Efficiency Measurements of China's thermal Power Industry: A Data Envelopment Analysis Based Materials Balance Approach. Eur. J. Oper. Res. 269, 35–50. doi:10.1016/j.ejor.2017.04.053
Wayne, B. G., and Ronald, J. S. (1998). Environmental Regulation, Investment Timing, and Technology Choice. J. Ind. Econ. 46, 235–256. doi:10.1111/1467-6451.00070
Wu, W.-p., Zeng, W.-k., Gong, S.-w., and Chen, Z.-g. (2021b). Does Energy Poverty Reduce Rural Labor Wages? Evidence from China's Rural Household Survey. Front. Energ. Res. 9, 1–8. doi:10.3389/fenrg.2021.670026
Wu, W.-p., Zhu, Y.-f., Zeng, W.-k., Wang, M., Yang, D.-x., and Chen, W.-f. (2021a). Green Efficiency of Water Resources in Northwest China: Spatial-Temporal Heterogeneity and Convergence Trends. J. Clean. Prod. 320, 128651. doi:10.1016/j.jclepro.2021.128651
Yarkoni, T., and Westfall, J. (2017). Choosing Prediction over Explanation in Psychology: Lessons from Machine Learning. Perspect. Psychol. Sci. 12, 1100–1122. doi:10.1177/1745691617693393
Yu, J., Shi, X., Guo, D., and Yang, L. (2021). Economic Policy Uncertainty (EPU) and Firm Carbon Emissions: Evidence Using a China Provincial EPU index. Energ. Econ. 94, 105071. doi:10.1016/j.eneco.2020.105071
Yu, X., and Li, Y. (2020). Effect of Environmental Regulation Policy Tools on the Quality of Foreign Direct Investment: an Empirical Study of China. J. Clean. Prod. 270, 122346. doi:10.1016/j.jclepro.2020.122346
Yue, S., Shen, Y., and Yuan, J. (2019). Sustainable Total Factor Productivity Growth for 55 States: An Application of the New Malmquist index Considering Ecological Footprint and Human Development index. Resour. Conservation Recycling 146, 475–483. doi:10.1016/j.resconrec.2019.03.035
Zhang, D. (2021). Marketization, Environmental Regulation, and Eco-Friendly Productivity: A Malmquist-Luenberger index for Pollution Emissions of Large Chinese Firms. J. Asian Econ. 76, 101342. doi:10.1016/j.asieco.2021.101342
Zhang, N., and Choi, Y. (2013). Total-factor Carbon Emission Performance of Fossil Fuel Power Plants in China: A Metafrontier Non-radial Malmquist index Analysis. Energ. Econ. 40, 549–559. doi:10.1016/j.eneco.2013.08.012
Zhang, Q., Xu, L., Wang, K., and Shi, X. (2021). What Effect Did the Green Credit Policy Have on China's Energy or Emission Intensive Firms? Ijoem ahead-of-print, 1. doi:10.1108/IJOEM-04-2021-0555
Zhao, X., Lynch, J. G., and Chen, Q. (2010). Reconsidering Baron and Kenny: Myths and Truths about Mediation Analysis. J. Consum. Res. 37, 197–206. doi:10.1086/651257
Zhao, X., Zhao, Y., Zeng, S., and Zhang, S. (2015). Corporate Behavior and Competitiveness: Impact of Environmental Regulation on Chinese Firms. J. Clean. Prod. 86, 311–322. doi:10.1016/j.jclepro.2014.08.074
Zhou, P., Ang, B. W., and Wang, H. (2012). Energy and CO2 Emission Performance in Electricity Generation: A Non-radial Directional Distance Function Approach. Eur. J. Oper. Res. 221, 625–635. doi:10.1016/j.ejor.2012.04.022
Keywords: environmental regulations, green total factor productivity, LASSO model, threshold model, mediation effect model
Citation: Feng J, Yan J and Tao X (2021) Exposing the Effects of Environmental Regulations on China’s Green Total Factor Productivity: Results From Econometrics Analysis and Machine Learning Methods. Front. Environ. Sci. 9:779358. doi: 10.3389/fenvs.2021.779358
Received: 18 September 2021; Accepted: 28 October 2021;
Published: 18 November 2021.
Edited by:
Xunpeng Shi, University of Technology Sydney, AustraliaReviewed by:
Hao-Kuang Li, Shanghai Academy of Social Sciences, ChinaSolomon Prince Nathaniel, University of Lagos, Nigeria
Yongran Lin, Henan Administration Institute, China
Copyright © 2021 Feng, Yan and Tao. This is an open-access article distributed under the terms of the Creative Commons Attribution License (CC BY). The use, distribution or reproduction in other forums is permitted, provided the original author(s) and the copyright owner(s) are credited and that the original publication in this journal is cited, in accordance with accepted academic practice. No use, distribution or reproduction is permitted which does not comply with these terms.
*Correspondence: Jianjun Yan, eWFuNzUxMjI1QDE2My5jb20=
 Junyi Feng
 Jianjun Yan*