- 1Collaborative Innovation Centre on Forecast and Evaluation of Meteorological Disasters, School of Atmospheric Physics, Nanjing University of Information Science and Technology, Nanjing, China
- 2State Key Laboratory of Atmospheric Boundary Layer Physics and Atmospheric Chemistry (LAPC), Institute of Atmospheric Physics, Chinese Academy of Sciences, Beijing, China
Previous studies on the impact of urbanization on the diurnal temperature range (DTR) have mainly concentrated on the intra-seasonal and interannual–decadal scales, while relatively fewer studies have considered synoptic scales. In particular, the modulation of DTR by different synoptic weather patterns (SWPs) is not yet fully understood. Taking the urban agglomeration of the Yangtze River Delta region (YRDUA) in eastern China as an example, and by using random forest machine learning and objective weather classification methods, this paper analyzes the characteristics of DTR and its urban–rural differences (DTRU–R) in summer from 2013 to 2016, based on surface meteorological observations, satellite remote sensing, and reanalysis data. Ultimately, the influences of urbanization-related factors and different large-scale SWPs on DTR and DTRU–R are explored. Results show that YRDUA is controlled by four SWPs in the 850-hPa geopotential height field in summer, and the DTRs in three sub-regions are significantly different under the four SWPs, indicating that they play a role in regulating the DTR in YRDUA. In terms of the average DTR for each SWP, the southern sub-region of the YRDUA is the highest, followed by the northern sub-region, and the middle sub-region is the lowest, which is most significantly affected by high-level urbanization and high anthropogenic heat emission. The DTRU–R is negative and differs under the four different SWPs with variation in sunshine and rainfall. The difference in anthropogenic heat flux between urban and rural areas is one of the potentially important urbanization-related drivers for DTRU–R. Our findings help towards furthering our understanding of the response of DTR in urban agglomerations to different SWPs via the modulation of local meteorological conditions.
Introduction
Diurnal temperature range (DTR) is the difference between the maximum surface air temperature and the minimum surface air temperature in a whole day, which can reflect the global and regional characteristics of temperature change (Easterling, 1997; Braganza et al., 2004; Vose et al., 2005), and has an important impact on human health (Kan et al., 2007; Lim et al., 2012; Yang et al., 2013; Zhang et al., 2018) and crop yield (Lobell, 2007; Tao et al., 2008). Indeed, DTR has become an important indicator of climate change and the human living environment (Easterling et al., 2000).
In the past century, the global average temperature has been rising, with an asymmetrical trend of change in the maximum and minimum temperature. The rising trend of minimum temperature is higher than that of maximum temperature, which leads to a decline in the global DTR (Sun et al., 2019). The intensification of urbanization across the globe has also contributed to the decline in DTR since the 1950s (Gallo et al., 1996; Kalnay and Cai, 2003; Feddema 2005; Mohan and Kandya, 2015). This is mainly because the underlying impervious surfaces of cities increases the nighttime temperature by absorbing a large amount of energy in the daytime and releasing it at night (Forster and Solomon, 2003; Zhou et al., 2007; Yang et al., 2020a; Zong et al., 2021). At the same time, due to the radiative cooling effect of aerosol pollution over cities, the daytime temperature decreases (Zheng et al., 2018; Yang et al., 2020b), and ultimately the DTR decreases in cities owing to the asymmetry in the changes of maximum and minimum temperature.
With its developed economy and dense human population, the level of urbanization in the Yangtze River Delta region is the heighest in China. Under such rapid urbanization, the distance between urban areas is shrinking, which greatly changes the original natural state and the regional-scale ecological environment, intensifies the risk of high-temperature heat waves in summer (Luo and Lau, 2018, 2019), and seriously endangers the public health and production of the region (Chen et al., 2018; Yang Y. et al., 2013; Yang X. et al., 2017, 2019). The rapid urbanization of the Yangtze River Delta region also has an important impact on its DTR (Hua et al., 2006; Chen and Chen, 2007; Liu et al., 1995-2000; Wang et al., 2012; Shen et al., 2014). Through the effect of urbanization on the maximum temperature, the DTR also shows a significant decreasing trend (Shen et al., 2014). In the past 40 years, the extreme values of maximum temperature and minimum temperature in big cities were greater than those in small towns, and the number of days with a low DTR was more than those in small towns (Hua et al., 2006; Qi et al., 2019). Taking Shanghai as an example, in the past 130 years, its DTR has shown a significant decreasing trend, with the DTR decreasing by 0.15°C per decade, and urbanization has had a significant impact on this trend (Zhou et al., 2012). In general, the change in DTR is directly affected by the asymmetry of the change in the maximum and minimum temperature, and the influencing factors can be mainly divided into natural factors (radiation, sunshine duration, precipitation, atmospheric circulation, etc.) and human factors (urbanization-related land-use change, anthropogenic heat release, aerosol pollution, etc.) (Dai et al., 1999; Liu et al., 2016; Sun et al., 2019; Xue et al., 2019; Yang et al., 2020b). Existing research on the variation in the DTR in the Yangtze River Delta region mainly focuses on the intra-seasonal scale (Dong and Huang, 2015; Yang et al., 2020a) and the interannual–decadal scale (Hua et al., 2006; Chen and Chen, 2007; Liu et al., 1995-2000; Wang et al., 2012; Shen et al., 2014), with the synoptic scale relatively less well studied. In particular, the regulatory effects of different synoptic weather patterns (SWPs) on DTR variation and the urban–rural differences in DTR (DTRU–R) in the Yangtze River Delta region remain unclear.
Therefore, taking the urban agglomeration of the Yangtze River Delta (YRDUA) in eastern China as an example, this paper studies the influence of circulation patterns at different synoptic scales on the DTR in the region, and explores the factors driving the variation in DTR on the synoptic scale. Section Data and Methods describes the data and methods used in this study. Section Results and Discussion examines the difference in DTR between urban and rural areas and the influence of synoptic circulation on DTRU–R. In this section, we also discuss the factors influencing the DTR of YRDUA and how weather patterns affect local meteorological elements to change the DTRU–R. Conclusions are provided in Section Conclusion.
Data and Methods
Data
This paper employs surface meteorological observation data in the form of daily maximum surface air temperature (Tmax), daily minimum surface air temperature (Tmin), sunshine duration (SSD), and precipitation on the daily and 8-days-average scales. Covering 148 stations in the Yangtze River Delta region during June, July and August from 2013 to 2016, the data were provided by the China Meteorological Data Service Center (http://Data.cma.cn/en). The DTR is the difference between Tmax and Tmin.
Additionally, daily and 8-days-average daytime land surface temperature, nighttime land surface temperature, and Normalized Difference Vegetation Index (NDVI) were obtained from MODIS remote sensing land surface temperature data with a spatial resolution of 1 km (https://lpdaac.usgs.gov); anthropogenic heat flux (AHF) data in the Yangtze River Delta region were retrieved from NOAA satellite nighttime light information (http://ngdc.NOAA.gov/eog/dmsp/downloadV4composites.html) noting that the error in the AHF results is generally within 12% (Chen and Shi, 2012; Chen et al., 2012, 2014, 2015, 2016); and specific humidity, air pressure, and horizontal and vertical wind speed data were obtained from the fifth generation European Centre for Medium-Range Weather Forecasts reanalysis (ERA5), which has a high spatiotemporal resolution (0.25° × 0.25, hourly; https://cds.climate.copernicus.eu/cdsapp#!/home). The built up area data are from the 30m resolution dataset of China’s urban impervious surfaces (derived from https://zenodo.org/record/4034161#.YFXn29y-uUk) (Kuang et al., 2000-2018).
Methods
Division and Matching of Urban and Rural Stations
Since the measurement of surface air temperature is taken at the height of 2m, according to previous studies (Cai, 2008; Yang et al., 2013; Shi et al., 2015; Shi et al., 2021; Yang et al., 2020), the maximum impact of anthropogenic heat on meteorological observations around the station usually does not exceed 5 km under advection and turbulence transport conditions. Thus, we chose 5 km as the radius of the buffer zone to capture the effects of urbanization on air temperature. Firstly, we took the built-up area (i.e., impervious surface area) as background in Figure 1, showing that the spatial distribution of anthropogenic heat flux corresponds well with actual distribution of the land covers (Figure 1). Anthropogenic heat flux is closely related to the change in built-up area around the stations (Figure 1B). Therefore, anthropogenic heat flux can be considered to reliably reflect the effects of both anthropogenic emissions and land-use change related to latent heat flux and sensible heat flux (Jiang et al., 2019; Chen et al., 2020). Therefore, classified the stations by the mean anthropogenic heat fluxes around all the stations. Figure 2A shows the spatial distribution of anthropogenic heat in the Yangtze River Delta region in 2016. It can be seen that high anthropogenic heat is mainly distributed in the YRDUA region. Therefore, we further calculated the average AHF within 5 km around each station in the YRDUA region (Figure 2B), and then, based on the correlation between anthropogenic heat and the built-up area, the average anthropogenic heat within 5 km of the 148 stations was sorted from high to low to distinguish urban and rural reference stations; that is, the first third of stations with a high anthropogenic heat value are regarded as urban stations, and the last third as rural reference stations (Figure 2B,C). Finally, based on the local pattern of precipitation, the difference in sunshine with latitude, and the level of urbanization of different regions, this paper divides the YRDUA region into three sub-regions—the northern plain and hilly region (NR), the central urban agglomeration region (MR), and the southern mountainous region (SR) (Figures 2B,C). Then we further calculated the diurnal temperature range difference (DTRu–r) between the city stationand one or more nearby rural reference stations in each sub-region in order to discuss the influence of urbanization on the DTR (Figure 2C).
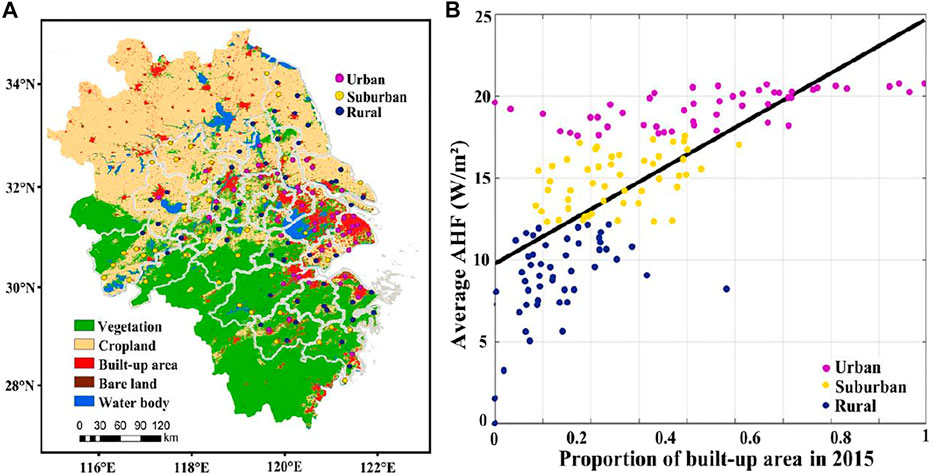
FIGURE 1. (A) Spatial distribution of built-up area in summer 2015 in the Yangtze River Delta region and classification of urban and rural stations. (B) Correlation between anthropogenic heat flux and built-up area in 2015.
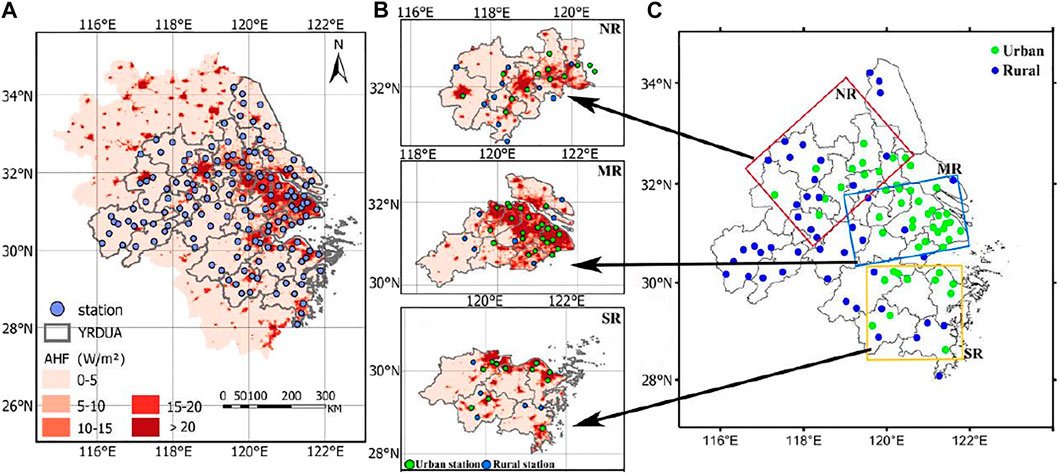
FIGURE 2. (A) Spatial distribution of anthropogenic heat in summer 2016 in the Yangtze River Delta region. (B) Average anthropogenic heat flux (W/m2) distribution within 5 km around stations in three sub-regions of YRDUA. (C) Three sub-regions of YRDUA and the classification of urban and rural stations.
Random Forest Model
The random forest (RF) model is currently a popular and highly flexible machine learning algorithm. The basic unit of the RF model is a decision tree. Compared with traditional statistical methods, RF has a better fitting effect on nonlinear data, and can analyze the importance of variables. The specific steps of the RF model construction process are as follows (Zeng et al., 2020): 1) In the N total samples, n times of replacement are randomly selected, n new training sets are obtained, and the unextracted part constitutes “out-of-bag” (OOB) data; 2) Each training set generates a decision tree, each node of the decision tree selects mtry from the independent variables, and branches grow according to the principle of minimum node impurity; 3) Repeat step (2) n times to obtain n decision trees to form a random forest; 4) The result of the random forest is the result obtained by the simple averaging method for each decision tree, and the prediction accuracy is determined by the average OOB of each decision tree.
Based on the RF model, we obtain the DTR difference between urban and rural areas and explore and analyze the importance of each factor influencing the DTRU–R. We validated the RF model using a 10-fold cross validation (CV) method to repeatedly estimate the expected model performance based on each subset of training data in general during prediction (Wang H. et al., 2019; Yang X. et al., 2019; Zeng et al., 2020). The method of 10-fold CV involved cutting the sample into 10 subsets, reserving one subset for testing the accuracy of the model, and using the other nine subsets for training the model. This CV was repeated 10 times until every subset was guaranteed to have been used once for testing. The average value of the 10-fold CV results was taken to obtain a final prediction result. The coefficient of determination (R2) and root-mean-square error (RMSE) were used to jointly assess the predictive performance of the 10-fold CV approach.
Finally, variance importance analysis was conducted to determine the contribution of each variable; that is, the “Mean Decrease Accuracy” (%IncMSE) and “Mean Decrease Gini” (IncNodePurity) (sorted in descending order from top to bottom) of attributes were used. A higher value of %IncMSE or IncNodePurity indicates a more important input variable.
Classification of Synoptic Weather Patterns
In this paper, T-mode principal component analysis (T-PCA) is used for the classification of SWPs, which is a computer-based objective mathematical method (Huth et al., 2008; Miao et al., 2017, 2019). It can reproduce the preset dominant SWPs without relying on the preset parameters (Ning et al., 2018; Ning et al., 2019; Yang et al., 2021). The T-PCA analysis module of the COST733 software (http://cost733.met.no/) developed by the European Scientific and Technical Research Cooperation, was used to classify the daily synoptic circulation patterns based on the 850 hPa geopotential height field. The cost733class program is a FORTRAN software package consisting of several modules for classification, evaluation and comparison of weather and circulation patterns. First, the weather data are spatially standardized and split into 10 subsets by T-PCA. Then the principal components (PCs) of weather information are estimated by applying singular value decomposition, and the PC score for each subset can be calculated after oblique rotation. Finally, the resultant subset with the highest sum will be selected by comparing 10 subsets according to contingency tables, and its types can be output as well (Philipp et al., 2014; Miao et al., 2017). To assess the performance of synoptic classification and determine the number of classes, the explained cluster variance (ECV) was selected in this study (Hoffmann and Heinke SchlüNzen, 2013; Philipp et al., 2014; Ning et al., 2019). The purpose of using this method is to analyze the differences in the characteristics of the DTR and its main driving factors between urban and rural areas under different SWPs.
Four SWPs were obtained through objective classification of the 850-hPa geopotential height field and wind field in June, July and August from 2013 to 2016. Figure 3 shows the different patterns of the 850-hPa geopotential height field and wind field. Type 1 is southeastern subtropical high pressure (frequency 51.90%), in which the Yangtze River Delta region is located in the northwest of the subtropical high pressure, the weather system frequency is the highest, and the dominant wind is southwesterly. Type 2 is western low pressure (frequency 17.66%), in which there is a weak low pressure in the west of the Yangtze River Delta region and the dominant wind is easterly. Type 3 is controlled by wind shear in the west (frequency: 20.11%), and the dominant wind is southwesterly and northwesterly. Type 4 is southern low pressure (frequency: 10.35%), in which the Yangtze River Delta region is located at the top of the low pressure, the dominant wind is easterly, and the occurrence frequency of the weather system is the lowest.
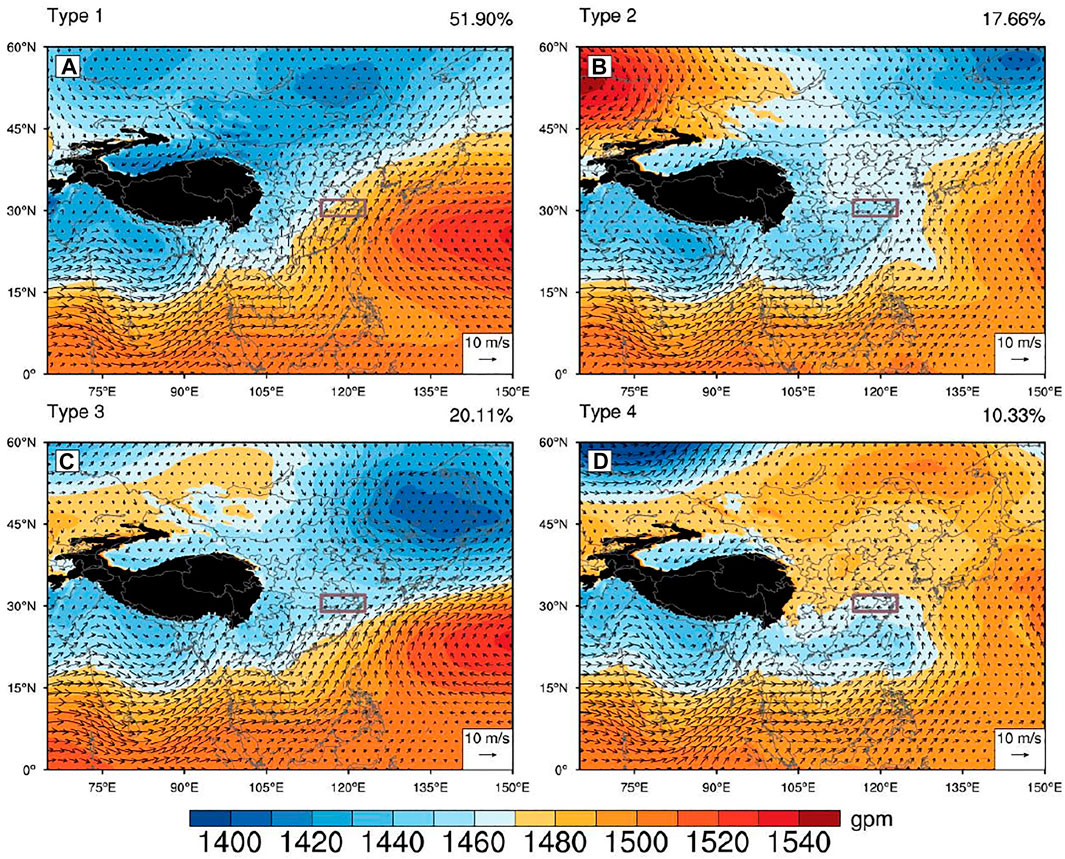
FIGURE 3. The 850-hPa geopotential height field and wind field for four Synoptic Weather Patterns (SWPs): (A) Type 1, (B) Type 2, (C) Type 3, and (D) Type 4. The purple box indicates the YRDUA region.
Results and Discussion
Urban–Rural Differences in Diurnal Temperature Range at the Monthly Scale
Figure 4 shows the spatial distribution of DTR in YRDUA in summer, showing obvious intra-seasonal variation and significant sub-regional differences. Accordingly, Table 1 shows the mode, median, mean, skewness, and kurtosis of DTR in June, July, and August. On the whole, the DTR in the MR sub-region (with its high density of urban areas) is relatively low (most concentrated at 3–9°C), which is related to the rapid development of urbanization in this sub-region. The monthly mean DTR is significantly higher in July (7.4°C) than in June (6.4°C) and August (6.8°C). The DTR in the mountainous SR sub-region is relatively high (about 6–10°C), which also shows intra-seasonal variation, and the average DTR value is 7.5, 8.7 and 7.8°C in June, July, and August, respectively. While the DTR distribution in the NR sub-region is similar (about 6–9°C) from June to August, i.e., the average DTR value is 7.3°C in June, 7.4°C in July, and 7.5°C in August.
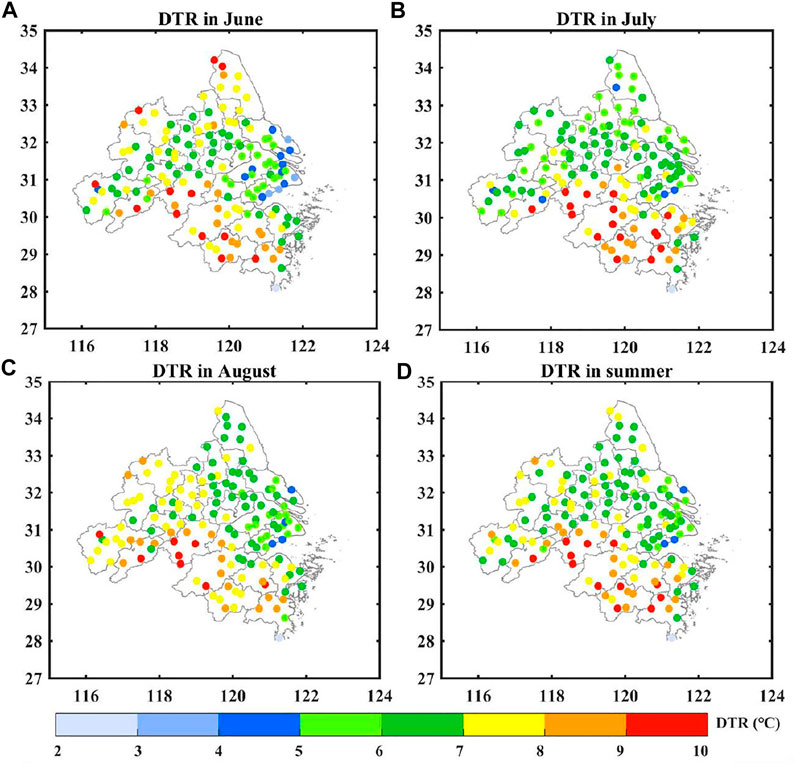
FIGURE 4. Spatial distribution of the mean Diurnal Temperature Range (DTR) in the urban agglomeration of the Yangtze River Delta region in summer: (A) June, (B) July, (C) August, and (D) June–August.
Figure 5 further shows the monthly variation of the summer monthly mean DTR of urban and rural stations in the YRDUA. The DTR of urban stations is the highest in July, ranging from 7 to 10°C, while the DTR in June and August is similar, ranging from 5 to 8°C. The monthly average DTRs of rural reference stations are similar, and there is no obvious seasonal variation. The DTR of rural stations range from 5 to 10°C during June–August.
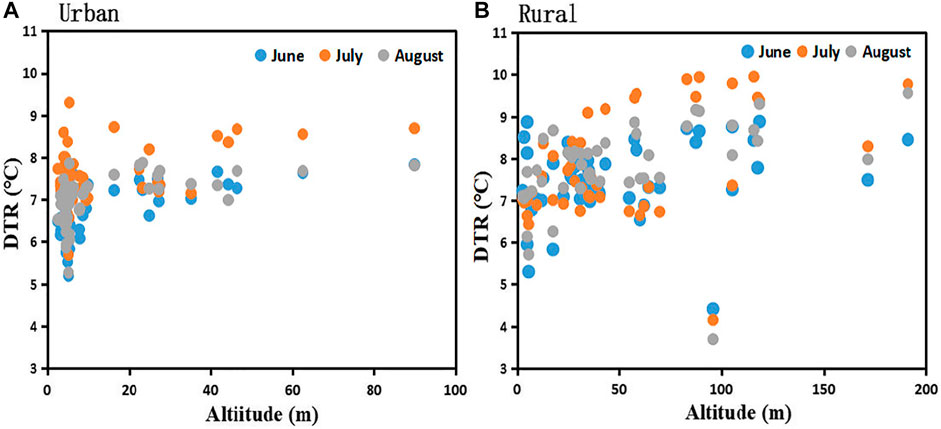
FIGURE 5. Seasonal variation of the DTR at (A) urban and (B) rural stations in the urban agglomeration of the Yangtze River Delta region.
Figure 6 shows boxplots of the DTR difference between urban and rural stations in the YRDUA region from June to August, showing that the DTR of urban stations in June, July and August is more concentrated than that of rural stations. As can be seen from Figure 6, the DTR of urban stations in July is concentrated within 7–8°C, which is basically a normal distribution, and the mean value of DTR is higher than that of June and August. The DTR of urban stations in June and August is concentrated within 6.5–7°C, in which there are small anomalies and large abnormal anomalies in July, and small anomalies in August. Overall, the peak DTR for urban stations occurs in July. The DTR of rural stations in June and August is relatively concentrated, and the DTR in August is basically a normal distribution, among which the DTR in July is relatively high and the value is concentrated within 7.5–9°C. Small anomalies appear in June and August at rural stations.
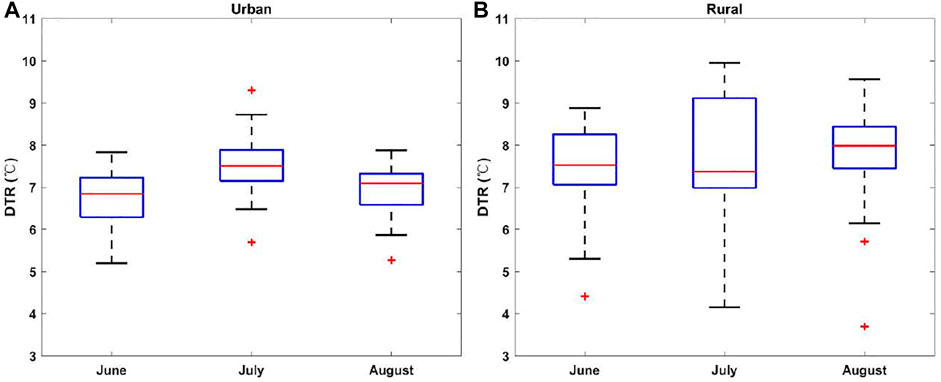
FIGURE 6. Boxplots of the DTR of (A) urban and (B) rural stations in the urban agglomeration of the Yangtze River Delta region from June to August.
The probability density distributions of DTR for urban and rural stations in June, July and August are shown in Figure 7 In June, the peak value of DTR for urban stations is about 6.5°C, and that of rural stations is about 7.5°C. In July, the peak values of DTR for urban and rural stations are around 7.5–8°C. In August, the distribution of urban DTR is concentrated at 7°C, and the peak distribution of DTR for rural stations is concentrated at 8°C. In general, the DTR of urban stations is lower than that of rural stations, which indicates that urbanization influences the decrease in DTR. Due to the development of urbanization, the concentrations of aerosols produced by human activities have increased greatly. Aerosols scatter and absorb solar radiation in the daytime, making the maximum temperature drop, while they weaken the upward longwave radiation on the surface and increase the minimum temperature at night, which leads to the decrease in DTR at urban stations (Dai et al., 1999; Zhang et al., 2011; Zheng et al., 2018; Yang et al., 2020b).

FIGURE 7. Probability density distributions of DTR at urban and rural stations in the urban agglomeration of the Yangtze River Delta region in (A) June, (B) July, and (C) August.
Urbanization Drivers
In order to explore what is the first dominant factor for DTRU–R, △Tmax or △Tmin, we calculated nine factor differences between urban and rural stations (Figures 8A–C), including the average DTR and Tmax, Tmin, the average surface temperature in the day (LSTD), the surface temperature at night (LSTN), anthropogenic heat emission, the NDVI within a 5-km range of meteorological observation stations, altitude, rainfall, and SSD at the 8-days scale. These nine factors of difference between urban and rural areas were the independent variables, and DTRU–R the dependent variable, when building the RF machine learning model, and the output was the importance of factors affecting DTRU–R. The results show that the change of DTRU–R is Tmax–driven type in the urban agglomeration of the Yangtze River Delta region (Figure 8C). So, we further employed the RF model to check the drivers of △Tmax (Figures 8D–F), that is, Tmax was selected as the dependent variable, and △LSTD, △LSTN, △AHF, △NDVI, △Altitude, △rainfall, and △SSD as independent variables. In addition to the direct retrieval of solar radiation, SSD also includes the influence of aerosols, cloud cover, and precipitation on the daily global solar radiation (Wang K. et al., 2012, Wang Y. et al., 2012, 2013; Zeng et al., 2020).
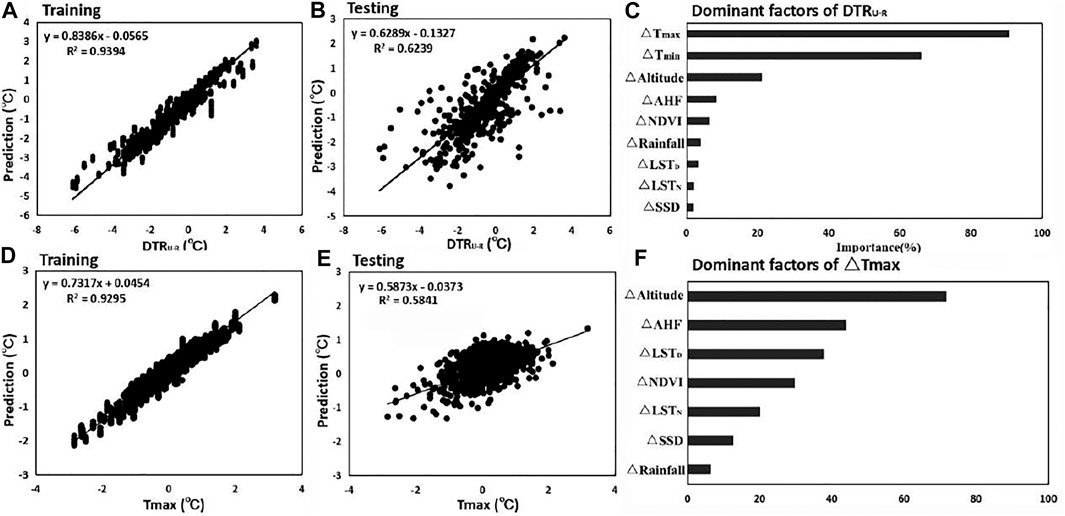
FIGURE 8. The DTRU–R(A) training value and (B) testing value and the importance of (C) DTRU–R impact factors, and the △Tmax(D) training value and (E) testing value and the importance of (F) △Tmax impact factors, of the RF model.
The RF model was not only used to reveal the possible factors related to the difference in DTR between urban and rural stations, but also to evaluate the relative importance and contribution of these factors. Firstly, 10-fold CV was used to test the reliability of the RF model. Figures 8A,B,D,E show the model training and validation of DTRU–R and △Tmax. It can be seen that the results of RF training and testing are good, i.e., the R2 value of the traning and testing of DTRU–R is 0.94 and 0.62, respectively, and the R2 value of training and the testing of △Tmax is 0.93 and 0.58, respectively, indicating that the RF model is reasonable and reliable for analyzing the impact factors of DTRU–R.
Further analysis of the RF model results provides the order of importance of the factors affecting DTRU–R. As shown in Figure 8C, △Tmax is more important to DTRU–R than △Tmin, implying that the comprehensive effect of urbanization (changed land use and soil water content) and aerosol pollution (changed solar radiation and cloud fraction) has a more obvious impact on daytime air temperature in urban areas, relative to rural areas (Dai et al., 1999; Sun et al., 2019; Yang et al., 2020b). The development of urbanization results in elevated concentrations of the aerosols produced by human activities, which leads to increased cloud cover (Wang K. et al., 2012, Wang Y. et al., 2012, 2013; Yang et al., 2020b; Zeng et al., 2020). The existence of aerosols and clouds can have an impact on solar radiation. Aerosols and cloud can reduce daytime incoming shortwave radiation at the surface and trap more upward longwave radiation from the surface and emit more downward longwave radiation to warm the near-surface atmosphere during nighttime. Relative to clean days, this radiation effect will easily lead to a smaller (larger) Tmax (Tmin) during pollution days, leading to a smaller DTR over urban areas. These are consistent with previous studies (Dai et al., 1999; Zhang et al., 2011; Zheng et al., 2018; Yang et al., 2020b), and so the variation trend of DTRU–R also increases. However, due to different regional environments, the thermal environment around meteorological stations will also be different, such as the difference in land-use types, vegetation coverage, etc. The most important environmental factors in this regard are Altitude, AHF, and NDVI, followed by rainfall, SSD, LSTN and LSTD,. Urban–rural differences of AHF play an important role in the magnitude of DTRU–R (Wang K. et al., 2012, Wang Y., et al., 2012, 2013; Zeng et al., 2020). The development of urbanization will also change the DTR by changing the nature of the urban underlying surface. Gallo et al. (1996) pointed out that different vegetation coverage around meteorological stations will cause different DTRs, and the DTRs of farms and towns are larger than those of cities. In conclusion, the difference in AHF is one of the potentially important driving factor of urbanization for DTRU–R. In general, the △Tmax, △Altitude, △AHF, △NDVI, △LSTD, △LSTN between urban and rural areas are almost unchanged, which are more important relative to the various △SSD and △rainfall between urban and rural areas. This is because △SSD and △rainfall are also modulated by various synoptic patterns in urban and rural areas.
Urban–Rural Differences in DTR Under Different Synoptic Weather Patterns
To better compare the DTR at urban stations with rural stations, we have excluded the suburban stations from the below analysis. Figure 9 shows the spatial distributions of mean DTR under the four synoptic circulation patterns. In general, under these four weather patterns, the DTR in the southern region is the highest, followed by the northern region, and the DTR in the central region is the lowest (ranging from 2 to 6°C), mainly because the central-region DTR is most significantly affected by urbanization. Specifically, the DTR in the three sub-regions of YRDUA is greatly affected by the synoptic circulation, and the DTRs under the four SWPs are significantly different. For example, the DTR in the northern region is high under type 4 but low under type 1, in the central urban agglomeration it is high under type 1 and low under type 3, while in the southern region it is high under type 1 and low under type 2.
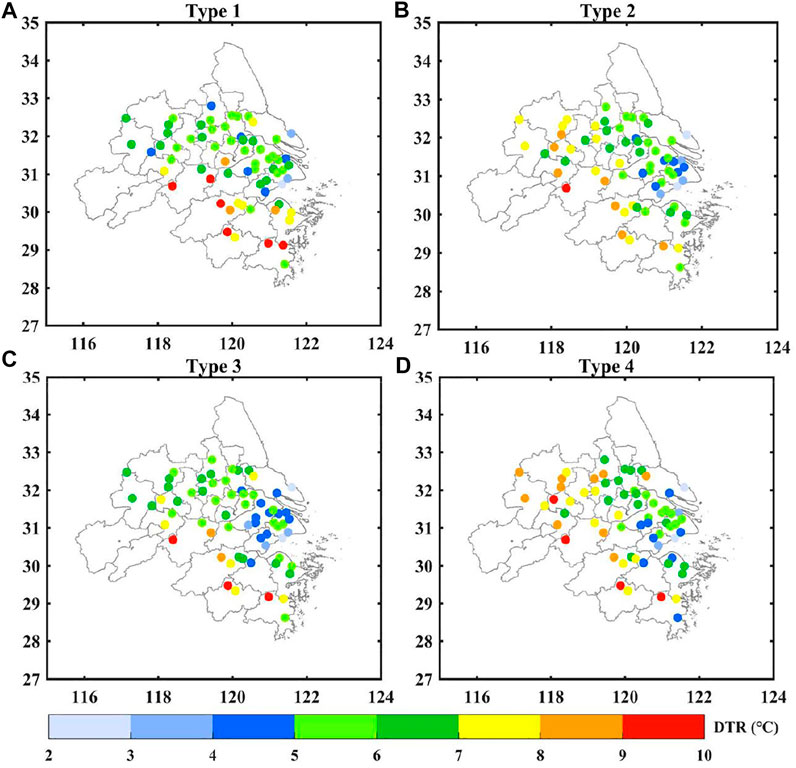
FIGURE 9. Spatial distribution of mean DTR in the YRDUA region: (A) Type 1; (B) Type 2; (C) Type 3; and (D) Type 4.
The probability density distributions of DTR for urban and rural stations in the three sub-regions under the four SWPs are shown in Figures 10A,B,D,E,G,H. In NR, the DTR peak distributions of urban stations are concentrated at about 7–8°C under the four weather patterns. Meanwhile, the peak distributions of rural stations are also concentrated at about 7–8°C under type 1, 3 and 4, whereas under type 2 it is about 8–9°C. In MR, the DTR peak distributions of urban and rural stations are concentrated at about 6–8°C under the four weather patterns. In SR, the peak values of DTR for urban stations are concentrated at about 6–8°C, and that of rural stations are concentrated at about 7–8°C under type 2, 3 and 4, while that of urban stations at about 8–9°C and rural stations at about 9–10°C under type 1. In order to further compare the influence of weather systems on the difference in DTR between urban and rural areas, the probability density distributions of DTRU-R under different weather patterns were statistically analyzed (Figures 10C,F,I). The results show that the probability density distribution of DTRU–R under the four weather types tends to be negative on the whole, and the peak values are concentrated within −1–0°C. The absolute value of the peak value of DTRU–R in NR and MR under the four weather patterns follow the order Type 2 > Type 1 > Type 3 > Type 4. It can be concluded that the difference in DTR between urban and rural areas in NR and MR under Type 4 is relatively small, while that under Type 2 is the largest. But the absolute values of the peak value of DTRU–R in SR under the four weather patterns are similar and higher than that of in NR and MR. However, the DTR also is regulated by meteorological conditions (precipitation and SSD) under different SWPs, which is further analyzed below.
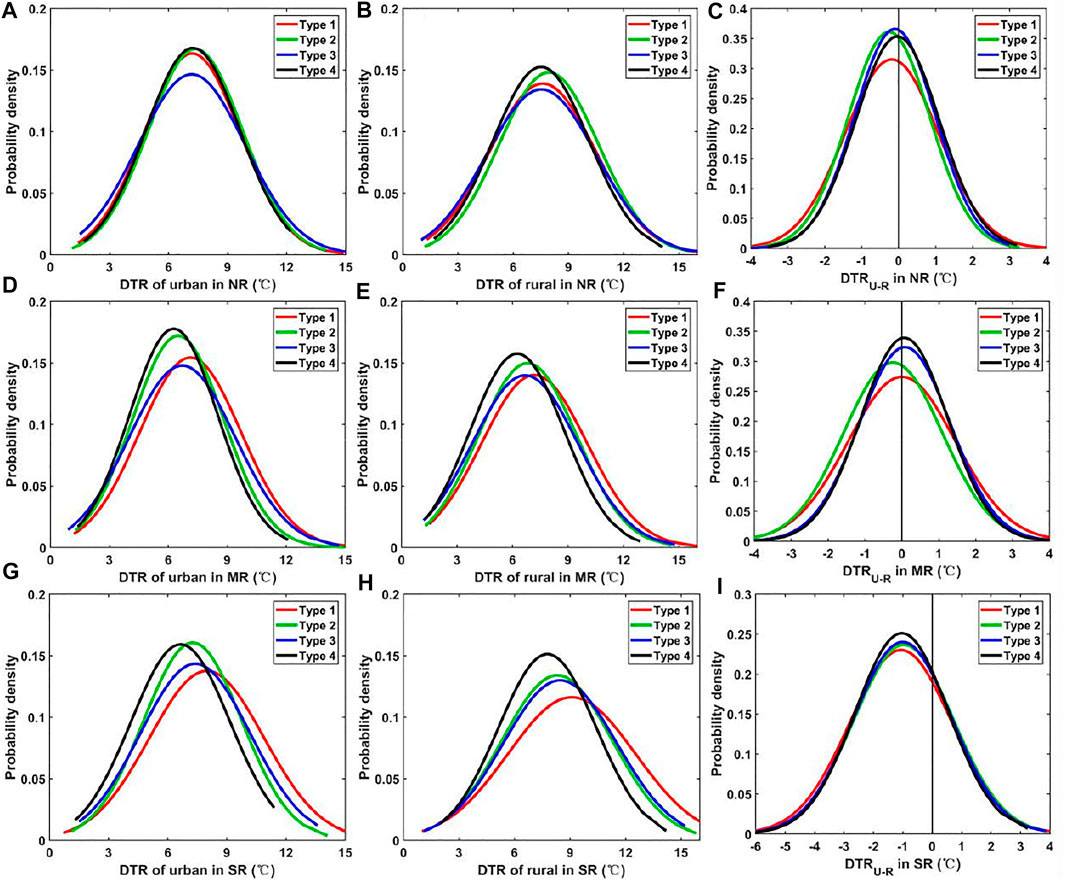
FIGURE 10. Probability density distributions of the DTR in (A,D,G) urban and (B,E,H) rural areas, and (C,F,I) their difference (DTRU–R), under four SWPs in NR, MR and SR, respectively.
Roles of Synoptic Weather Patterns
Local meteorological factors are closely related to SWPs. The increase in global precipitation is one of the reasons for the downward trend in global DTR, but the relationship between precipitation and DTR is more based on the good correlation between precipitation, cloud cover, and soil water content (Dai et al., 1997, 1998, 1999; Sun et al., 2019). Cloud cover and soil water content mainly lead to a decrease in DTR by decreasing the Tmax. Therefore, increased cloud cover and precipitation will slow down the rising trend of Tmax and have relatively little effect on Tmin (Dai et al., 1999), which is consistent with our RF model results showing that the urban–rural difference in Tmax is most important to DTRU–R.
Cloud cover and soil water content are closely related to water vapor flux in summer, so Figure 11 shows the 850-hPa water vapor flux in the urban agglomeration of the YRDUA region. Combined with the classification results (Figure 3), we found that, under the type 1 synoptic circulation, the YRDUA is affected by the southeastern subtropical high pressure, and the southwest has strong water vapor transport, large water vapor flux, and more precipitation. The water vapor under type 2 synoptic circulation comes from the south, and the water vapor flux is small. Type 3 water vapor mainly comes from the southwest, and the water vapor flux is large in the south of YRDUA, but small in the north. The water vapor of type 4 comes from the southeast ocean area, and the water vapor flux is small.
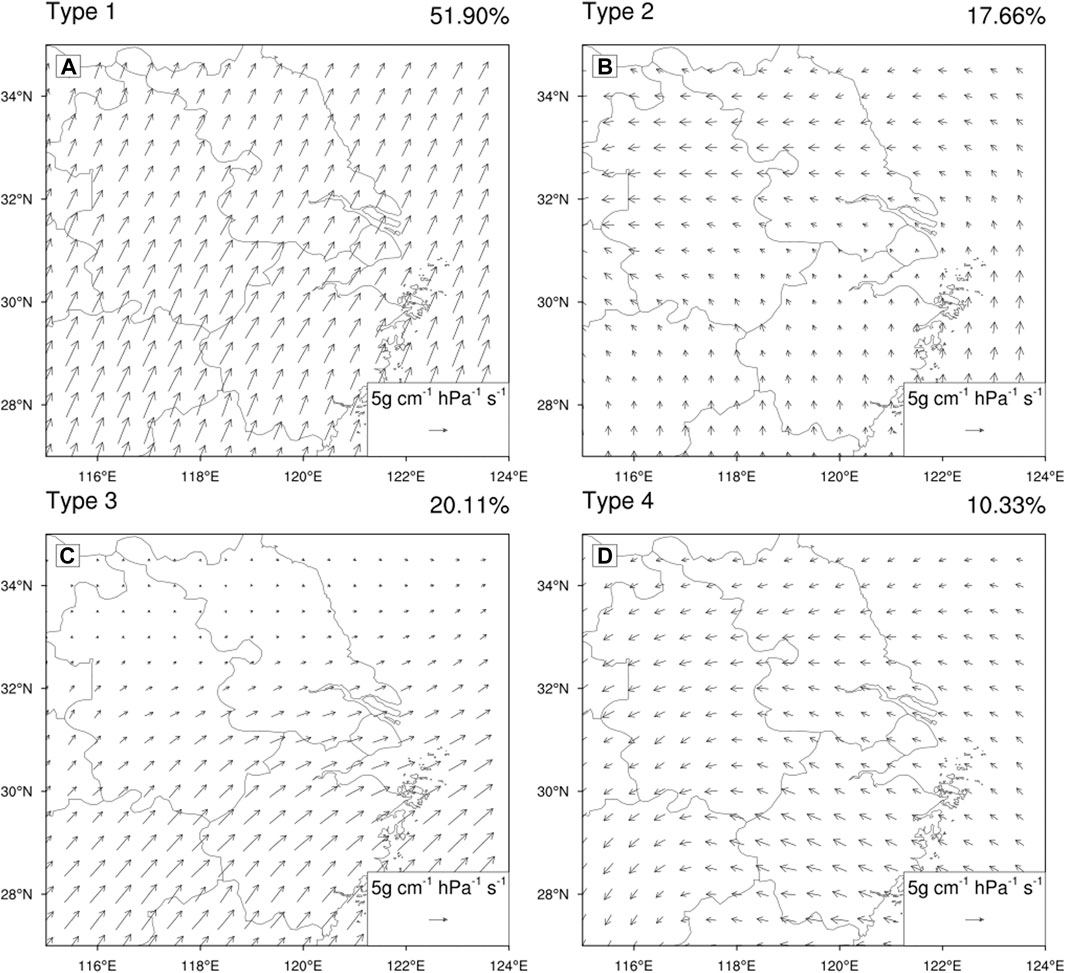
FIGURE 11. The 850-hPa water vapor flux (WVF = V×q/g, where q is specific humidity, g is gravitational acceleration, and V is horizonal wind; vectors; see scale arrow in the bottom right in units of 5 gcm−1hPa−1s−1) under four SWPs: (A) Type 1; (B) Type 2; (C) Type 3; and (D) Type 4.
The SSD reflects the influence of cloud cover and precipitation on the daily total solar radiation, so the variation of DTR can be discussed through the influence of SSD and precipitation on temperature. Figures 12, 13 show the average distribution of sunshine duration and local precipitation under the four SWPs. Due to the difference in the synoptic circulation situation and water vapor flux, there are obvious differences in local precipitation and sunshine duration under the four SWPs. Specifically, compared with Figure 9 and Figure 11, less precipitation and longer SSD favor a larger DTR in most sub-regions, e.g., the NR sub-region under type 2, the MR sub-region under type 4, and the SR sub-region under types 1, 3 and 4,. Meanwhile, more precipitation and shorter SSD induce a smaller DTR, e.g., in the NR sub-region under type 1, the MR sub-region under type 1, and the SR sub-region under type 2.
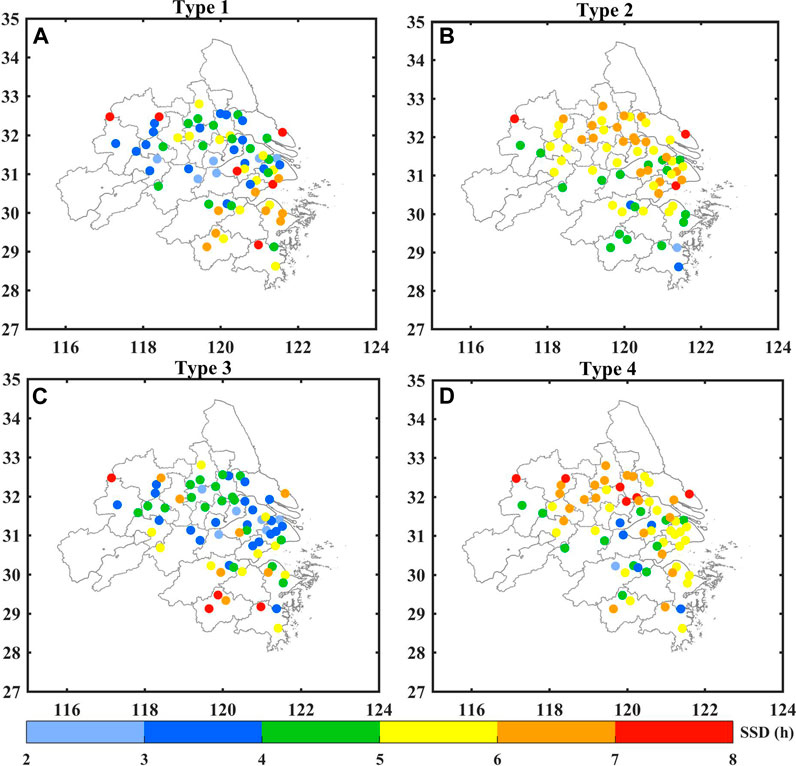
FIGURE 12. As in Figure 9 but for mean Sunshine Duration (SSD).
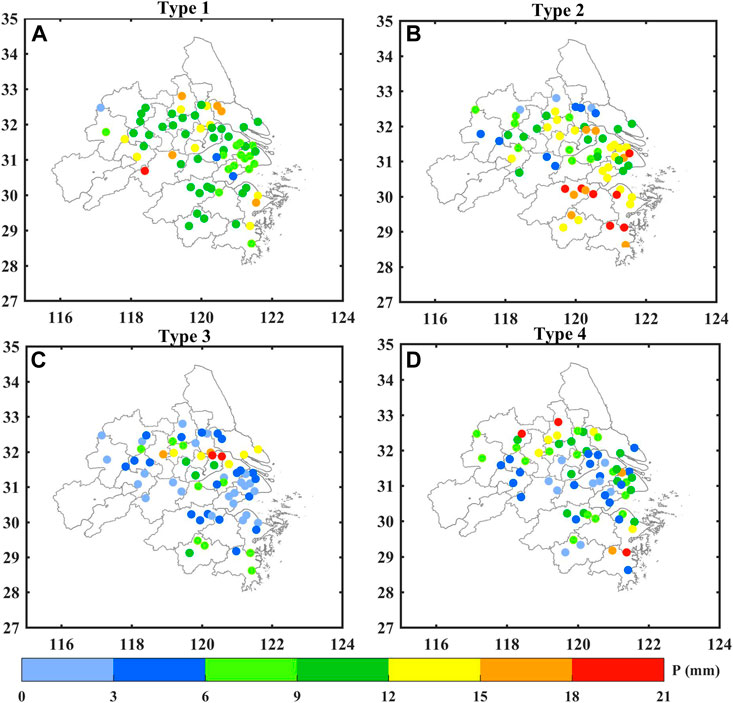
FIGURE 13. As in Figure 9 but for mean precipitation.
Because urbanization has increased extreme precipitation, we further quantified the precipitation frequency (PF) (Figure 14). Compared with Figure 13, precipitation under type 1 and 2 is large, but the PF is small, which indicates that urban extreme precipitation is more significant under type 1 and 2, especially in the central urban agglomeration under type 2. Combined with Figure 10, the difference in DTR between urban and rural areas is the most significant under type 2. Due to the impervious nature of the urban underlying surface, the soil moisture increases when precipitation occurs, while soil moisture increases the releases of surface latent heat and slows down the rise in temperature during the day (Dai et al., 1999), which also reduce the urban DTR and increase the urban–rural DTR differences. This also indicates that precipitation plays an important role in the impact of urbanization on DTR.
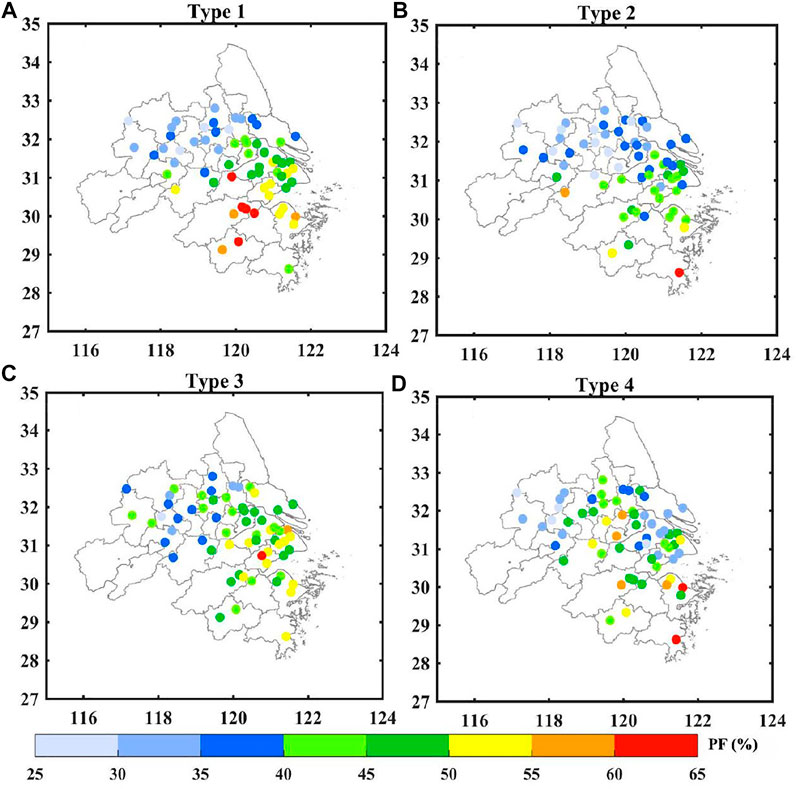
FIGURE 14. As in Figure 9 but for mean precipitation frequency (PF = DP/DT×100%, where DP is the number of days of precipitation, and DT is total number of days).
Conclusion
Through objective weather classification and machine learning modeling, this paper analyzes the difference characteristics and influencing factors of DTR and DTRU–R in YRDUA under different SWPs (according to the differences in the climate background and underlying surface properties). The main conclusions are as follows:
The YRDUA region is mainly controlled by four SWPs in the 850-hPa geopotential height field. The average values of DTR under each SWP exhibit obvious sub-regional differences in space: the southern subregion is the highest, followed by the northern subregion, and the middle subregion is the lowest. The lower DTR in the middle sub-region is mainly affected by its high levels of urbanization and anthropogenic heat emissions. The average DTR in the three sub-regions of YRDUA present significant differences in DTR under the four SWPs, indicating that SWPs play a greater role in regulating the DTR in YRDUA. In general, the DTR of urban stations is smaller than that of rural stations under all four SWPs, and the urban–rural difference in AHF is one of the potentially important urbanization-related driver affecting DTRU–R. The order of the absolute value of the DTRU–R peak in NR and MR under the four SWPs is as follows: type 2 > type 1 > type 3 > type 4. In particular, affected by urban extreme precipitation, the DTR under Type 2 is the largest, while the absolute values of the peak DTRU–R in SR under the four weather patterns are similar and higher than that of in NR and MR. The present work provides evidence that the complex features of levels of urbanization and atmospheric circulation patterns on synoptic scales can modulate the daily variations of DTR. This study’s findings help towards furthering our understanding of the response of DTR in an urban agglomeration to different SWPs via the modulation of local meteorological conditions (e.g., precipitation, SSD, etc.).
Overall, whilst the present paper discusses the dual impact of urbanization factors and SWPs on DTRU–R on the synoptic scale, the influence of changes in the occurrence frequencies of different SWPs at the interannual scale on the long-term trend of DTR requires further exploration.
Data Availability Statement
The data analyzed in this study is subject to the following licenses/restrictions: The data were provided by the China Meteorological Data Service Center. Requests to access these datasets should be directed to All MODIS data can be downloaded from https://lpdaac.usgs.gov. Surface meteorological data can be collected from the China Meteorological Data Service Center (http://data.cma.cn/en).
Author Contributions
MG: Conceptualization, Data curation, Formal analysis, Writing—original draft preparation, Writing—Reviewing and Editing; MZ: Data curation; HW: Methodology, Formal analysis, Writing—original draft preparation; LW: Conceptualization, Formal analysis, Writing—original draft preparation; SL: Methodology; LZ: Methodology, Writing—Reviewing and Editing; YZ: Data curation; YL: Methodology.
Funding
This study is supported by National Key Research and Development Program of China (2016YFC0203300), the National Natural Science Foundation of China (42061134009 and 42075072) and Innovation and Entrepreneurship Training Program for College Students of Nanjing University of Information Science and Technology.
Conflict of Interest
The authors declare that the research was conducted in the absence of any commercial or financial relationships that could be construed as a potential conflict of interest.
References
Braganza, K., Karoly, D. J., and Arblaster, J. M. (2004). Diurnal Temperature Range as an index of Global Climate Change during the Twentieth century. Geophys. Res. Lett. 31, a–n. doi:10.1029/2004GL019998
Cai, X. H. (2008). Footprint Analysis in Micrometeorology and its Extended Applications. Chin. J. Atmos. Sci. 32, 123–132. doi:10.3878/j.issn.1006-9895
Chen, B., and Shi, G. Y. (2012). Estimation of the Distribution of Global Anthropogenic Heat Flux. Atmos. Oceanic Sci. Lett. 5, 108–112. doi:10.1080/16742834.2012.11446974
Chen, B., Dong, L., Liu, X., Shi, G. Y., Chen, L., Nakajima, T., et al. (2016). Exploring the Possible Effect of Anthropogenic Heat Release Due to Global Energy Consumption upon Global Climate: a Climate Model Study. Int. J. Climatol. 36, 4790–4796. doi:10.1002/joc.4669
Chen, B., Dong, L., Shi, G., Li, L.-J., and Chen, L.-F. (2014). Anthropogenic Heat Release: Estimation of Global Distribution and Possible Climate Effect. J. Meteorol. Soc. Jpn. 92A, 157–165. doi:10.2151/jmsj.2014-a10
Chen, B., Shi, G., Wang, B., Zhao, J., and Tan, S. (2012). Estimation of the Anthropogenic Heat Release Distribution in China from 1992 to 2009. Acta Meteorol. Sin 26 (4), 507–515. doi:10.1007/s-13351-012-0409-y10.1007/s13351-012-0409-y
Chen, B., Zhao, J.-Q., Chen, L.-F., and Shi, G.-Y. (2015). Reply to the Comments of F. Fujibe on “Anthropogenic Heat Release: Estimation of Global Distribution and Possible Climate Effect” by Chen, B. et al. J. Meteorol. Soc. Jpn. 93 (4), 505–508. doi:10.2151/jmsj.2015-028
Chen, G., Wang, D., Wang, Q., Li, Y., Wang, X., Hang, J., et al. (2020). Scaled Outdoor Experimental Studies of Urban thermal Environment in Street canyon Models with Various Aspect Ratios and thermal Storage. Sci. Total Environ. 726, 138147. doi:10.1016/j.scitotenv.2020.138147
Chen, Q., Ding, M., Yang, X., Hu, K., and Qi, J. (2018). Spatially Explicit Assessment of Heat Health Risk by Using Multi-Sensor Remote Sensing Images and Socioeconomic Data in Yangtze River Delta, China. Int. J. Health Geogr. 17, 15. doi:10.1186/s12942-018-0135-y
Chen, Tiexi., and Chen, Xing. (2007). Variation of Diurnal Temperature Range in China in the Past 50 Years. Plateau Meteorology 26 (1), 150–157. [in Chinese, with English summary].
Dai, A., Fung, I. Y ., and Del Genio, A. D. (1997). Surface Observedglobal Land Precipitation Variations during 1900ns. during 10, 2943943cip. doi:10.1175/1520-0442(1997)010<2943:soglpv>2.0.co;2
Dai, A., Trenberth, K. E., and Karl, T. R. (1999). Effects of Clouds, Soil Moisture, Precipitation, and Water Vapor on Diurnal Temperature Range. J. Clim. 12 (8), 2451–2473. doi:10.1175/1520-0442(1999)012<2451:eocsmp>2.0.co;2
Dai, A., Trenberth, K. E., and Karl, T. R. (1998). Global Variations in Droughts and Wet Spells: 1900-1995. Geophys. Res. Lett. 25, 3367–3370. doi:10.1029/98gl52511
Dong, D., and Huang, G. (2015). Relationship Between Altitude and Variation Characteristics of the Maximum Temperature, Minimum Temperature, and Diurnal Temperature Range in China. Chinese J. Atmos. Sci. 39 (5), 1011–1024. [in Chinese, with English summary]. doi:10.3878/j.issn.1006-9895.1501.14291
Easterling, D. R., Evans, J. L., Groisman, P. Y., Karl, T. R., Kunkel, K. E., and Ambenje, P. (2000). Observed Variability and Trends in Extreme Climate Events: A Brief Review*. Bull. Amer. Meteorol. Soc. 81 (3), 417–425. doi:10.1175/1520-0477(2000)081<0417:ovatie>2.3.co;2
Easterling, D. R. (1997). Maximum and Minimum Temperature Trends for the globe. Science 277 (5324), 364–367. doi:10.1126/science.277.5324.364
Feddema, J. J. (2005). The Importance of Land-Cover Change in Simulating Future Climates. Science 310 (5754), 1674–1678. doi:10.1126/science.1118160
Forster, P. M. d. F., and Solomon, S. (2003). Observations of a “Weekend Effect” in Diurnal Temperature Range. Proc. Natl. Acad. Sci. 100 (20), 11225–11230. doi:10.1073/pnas.2034034100
Gallo, K. P., Easterling, D. R., and Peterson, T. C. (1996). The Influence of Land Use/land Cover on Climatological Values of the Diurnal Temperature Range. J. Clim. 9 (11), 2941–2944. doi:10.1175/1520-0442(1996)009<2941:tioluc>2.0.co;2
Hoffmann, P., and Schlünzen, K. H. (2013). Weather Pattern Classification to Represent the Urban Heat Island in Present and Future Climate. J. Appl. Meteorol. Climatol. 52 (12), 2699–2714. doi:10.1175/JAMC-D-12-065.1
Hua, L.-J., Ma, Z.-G., and Zeng, Z.-M. (2006). The Comparative Analysis of the Changes of Extreme Temperature and Extreme Diurnal Temperature Range of Large Cities and Small Towns in Eastern China. Chin. J. Atmos. Sci. (in Chinese) 30 (1), 80–92. doi:10.3878/j.issn.1006-9895.2006.01.07
Huth, R., Beck, C., Philipp, A., Demuzere, M., Ustrnul, Z., Cahynová, M., et al. (2008). Classifications of Atmospheric Circulation Patterns. Ann. N. Y. Acad. Sci. 1146, 105–152. doi:10.1196/annals.1446.019
Jiang, S., Lee, X., Wang, J., and Wang, K. (2019). Amplified Urban Heat Islands during Heat Wave Periods. J. Geophys. Res. Atmos. 124, 7797–7812. doi:10.1029/2018JD030230
Kalnay, E., and Cai, M. (2003). Impact of Urbanization and Land-Use Change on Climate. Nature 423 (6939), 528–531. doi:10.1038/nature01675
Kan, H., London, S. J., Chen, H., Song, G., Chen, G., Jiang, L., et al. (2007). Diurnal Temperature Range and Daily Mortality in Shanghai, China. Environ. Res. 103, 424–431. doi:10.1016/j.envres.2006.11.009
Kuang, W., Zhang, S., Li, X., and Lu, D. (2000–2018). A 30 M Resolution Dataset of China's Urban Impervious Surface Area and green Space, 2000-2018. Earth Syst. Sci. Data 13, 63–82. doi:10.5194/essd-13-63-2021
Lim, Y.-H., Hong, Y.-C., and Kim, H. (2012). Effects of Diurnal Temperature Range on Cardiovascular and Respiratory Hospital Admissions in Korea. Sci. Total Environ. 417-418, 55–60. doi:10.1016/j.scitotenv.2011.12.048
Liu, B., Xu, M., Henderson, M., Qi, Y., and Li, Y. (1955–2000). Taking China’s Temperature: Daily Range, Warming Trends, and Regional Variations. J. Clim. 17 (22), 4453–4462. doi:10.1175/3230.1
Liu, L., Li, Z., Yang, X., Gong, H., Li, C., and Xiong, A. (2016). The Long-Term Trend in the Diurnal Temperature Range over Asia and its Natural and Anthropogenic Causes. J. Geophys. Res. Atmos. 121, 3519–3533. doi:10.1002/2015JD024549
Lobell, D. B. (2007). Changes in Diurnal Temperature Range and National Cereal Yields. Agric. For. meteorology 145 (3-4), 229–238. doi:10.1016/j.agrformet.2007.05.002
Luo, M., and Lau, N.-C. (2018). Increasing Heat Stress in Urban Areas of Eastern China: Acceleration by Urbanization. Geophys. Res. Lett. 45 (23), 13060–13069. doi:10.1029/2018gl080306
Luo, M., and Lau, N.-C. (2019). Urban Expansion and Drying Climate in an Urban Agglomeration of east China. Geophys. Res. Lett. 46 (2), 6868–6877. doi:10.1029/2019gl082736
Miao, Y., Guo, J., Liu, S., Liu, H., Li, Z., Zhang, W., et al. (2017). Classification of Summertime Synoptic Patterns in Beijing and Their Associations with Boundary Layer Structure Affecting Aerosol Pollution. Atmos. Chem. Phys. 17 (4), 3097–3110. doi:10.5194/acp-17-3097-2017
Miao, Y., Liu, S., and Huang, S. (2019). Synoptic Pattern and Planetary Boundary Layer Structure Associated with Aerosol Pollution during winter in Beijing, China. Sci. Total Environ. 682, 464–474. doi:10.1016/j.scitotenv.2019.05.199
Mohan, M., and Kandya, A. (2015). Impact of Urbanization and Land-Use/land-Cover Change on Diurnal Temperature Range: A Case Study of Tropical Urban Airshed of India Using Remote Sensing Data. Sci. Total Environ. 506-507, 453–465. doi:10.1016/j.scitotenv.2014.11.006
Ning, G., Wang, S., Yim, S. H. L., Li, J., Hu, Y., Shang, Z., et al. (2018). Impact of Low-Pressure Systems on winter Heavy Air Pollution in the Northwest Sichuan Basin, China. Atmos. Chem. Phys. 18 (18), 13601–13615. doi:10.5194/acp-18-13601-2018
Ning, G., Yim, S. H. L., Wang, S., Duan, B., Nie, C., Yang, X., et al. (2019). Synergistic Effects of Synoptic Weather Patterns and Topography on Air Quality: a Case of the Sichuan Basin of China. Clim. Dyn. 53 (11), 6729–6744. doi:10.1007/s00382-019-04954-3
Philipp, A., Beck, C., Esteban, P., Krennert, T., Lochbihler, K., Spyros, P., et al. (2014). COST733CLASS v1.2 User guide. Available at: www.researchgate.net/publication/269335894_COST733CLASS_v12_User_guide.
Qi, Qinghua., Cai, Rongshuo., and Guo, Haixia. (2019). The Climatological Features and Peculiarities of Temperature over Eastern China. Scientia Geographica Sinica (in Chinese) 39 (08), 1340–1350. doi:10.13249/j.cnki.sgs.2019.08.016
Shen, X., Liu, B., Li, G., Wu, Z., Jin, Y., Yu, P., et al. (2014). Spatiotemporal Change of Diurnal Temperature Range and its Relationship with sunshine Duration and Precipitation in china. J. Geophys. Res. Atmos. 119 (23), 163–213. doi:10.1002/2014jd022326
Shi, T., Huang, Y., Sun, D., Lu, G., and Yang, Y. (2021). A New Method for Correcting Urbanization-Induced Bias in Surface Air Temperature Observations: Insights from Comparative Site-Relocation Data. Front. Environ. Sci. 9, 625418. doi:10.3389/fenvs.2021.625418
Shi, T., Huang, Y., Wang, H., Shi, C.-E., and Yang, Y.-J. (2015). Influence of Urbanization on the thermal Environment of Meteorological Station: Satellite-Observed Evidence. Adv. Clim. Change Res. 6, 7–15. doi:10.1016/j.accre.2015.07.001
Sun, X., Ren, G., You, Q., Ren, Y., Xu, W., Xue, X., et al. (2019). Global Diurnal Temperature Range (DTR) Changes since 1901. Clim. Dyn. 52, 3343–3356. doi:10.1007/s00382-018-4329-6
Tao, F., Yokozawa, M., Liu, J., and Zhang, Z. (2008). Climate-crop Yield Relationships at Provincial Scales in China and the Impacts of Recent Climate Trends. Clim. Res. 38 (1), 83–94. doi:10.3354/cr00771
Vose, R. S., Easterling, D. R., and Gleason, B. (2005). Maximum and Minimum Temperature Trends for the globe: an Update through 2004. Geophys. Res. Lett. 32, L23822. doi:10.1029/2005GL024379
Wang, H., Li, J., Gao, Z., Yim, S. H., Shen, H., Ho, H. C., et al. (2019). High-Spatial-Resolution Population Exposure to PM2.5 Pollution Based on Multi-Satellite Retrievals: A Case Study of Seasonal Variation in the Yangtze River Delta, China in 2013. Remote Sensing 11, 2724. doi:10.3390/rs11232724
Wang, K., Ye, H., Chen, F., Xiong, Y., and Wang, C. (2012). Urbanization Effect on the Diurnal Temperature Range: Different Roles under Solar Dimming and Brightening*. J. Clim. 25 (3), 1022–1027. doi:10.1175/jcli-d-10-05030.1
Wang, Y., Yang, Y., Han, S., Wang, Q., and Zhang, J. (2013). Sunshine Dimming and Brightening in Chinese Cities (1955-2011) Was Driven by Air Pollution rather Than Clouds. Clim. Res. 56 (1), 11–20. doi:10.3354/cr01139
Wang, Y., Yang, Y., Zhao, N., Liu, C., and Wang, Q. (2012). The Magnitude of the Effect of Air Pollution on sunshine Hours in China. J. Geophys. Res. 117, a–n. doi:10.1029/2011jd016753
Xue, W., Guo, J., Zhang, Y., Zhou, S., Wang, Y., Miao, Y., et al. (2019). Declining Diurnal Temperature Range in the North China Plain Related to Environmental Changes. Clim. Dyn. 52 (9–10), 6109–6119. doi:10.1007/s00382-018-4505-8
Yang, J., Liu, H.-Z., Ou, C.-Q., Lin, G.-Z., Zhou, Q., Shen, G.-C., et al. (2013). Global Climate Change: Impact of Diurnal Temperature Range on Mortality in Guangzhou, China. Environ. Pollut. 175, 131–136. doi:10.1016/j.envpol.2012.12.021
Yang, X., Ruby Leung, L., Zhao, N., Zhao, C., Qian, Y., Hu, K., et al. (2017). Contribution of Urbanization to the Increase of Extreme Heat Events in an Urban Agglomeration in east China. Geophys. Res. Lett. 44, 6940–6950. doi:10.1002/2017GL074084
Yang, X., Ye, T., Zhao, N., Chen, Q., Yue, W., Qi, J., et al. (2019). Population Mapping with Multisensor Remote Sensing Images and Point-Of-Interest Data. Remote Sensing 11, 574. doi:10.3390/rs11050574
Yang, Y.-J., Wu, B.-W., Shi, C.-e., Zhang, J.-H., Li, Y.-B., Tang, W.-A., et al. (2013). Impacts of Urbanization and Station-Relocation on Surface Air Temperature Series in Anhui Province, China. Pure Appl. Geophys. 170 (11), 1969–1983. doi:10.1007/s00024-012-0619-9
Yang, Y., Wang, Rui., Chen, Fengjiao., Liu, Chao., Bi, Xueyan., and Huang, Meng. (2021). Synoptic Weather Patterns Modulate the Frequency, Type and Vertical Structure of Summer Precipitation over Eastern China: A Perspective from GPM Observations. Atmos. Res. 249, 05342. doi:10.1016/j.atmosres.2020.105342,
Yang, Y., Zhang, M., Li, Q., Chen, B., Gao, Z., Ning, G., et al. (2020a). Modulations of Surface thermal Environment and Agricultural Activity on Intraseasonal Variations of Summer Diurnal Temperature Range in the Yangtze River Delta of China. Sci. Total Environ., 736. 139445. doi:10.1016/j.scitotenv.2020.139445
Yang, Y., Zheng, Z., Yim, S. Y. L., Roth, M., Ren, G., Gao, Z., et al. (2020b). PM 2.5 Pollution Modulates Wintertime Urban Heat Island Intensity in the Beijing‐Tianjin‐Hebei Megalopolis, China. Geophys. Res. Lett. 47 (1). doi:10.1029/2019gl084288
Zeng, Z., Wang, Z., Gui, K., Yan, X., Gao, M., Luo, M., et al. (2020). Daily Global Solar Radiation in China Estimated from High‐Density Meteorological Observations: A Random Forest Model Framework. Earth Space ScienceEarth Space Sci. 7. doi:10.1029/2019EA001058
Zhang, L., Ren, G. Y., Liu, J., Zhou, Y. Q., Ren, Y. Y., Zhang, A. Y., et al. (2011). Urban Effect on Trends of Extreme Temperature Indices at Beijing Meteorological Station. Chin. J Geophys (in Chinese) 54 (5), 1150–1159. doi:10.3969/j.issn.0001-5733.2011.05.002
Zhang, Y., Peng, M., Wang, L., and Yu, C. (2018). Association of Diurnal Temperature Range with Daily Mortality in England and Wales: A Nationwide Time-Series Study. Sci. Total Environ. 619-620, 291–300. doi:10.1016/j.scitotenv.2017.11.056
Zheng, Z., Ren, G., Wang, H., Dou, J., Gao, Z., Duan, C., et al. (2018). Relationship between Fine-Particle Pollution and the Urban Heat Island in Beijing, China: Observational Evidence. Boundary-layer Meteorol. 169, 93–113. doi:10.1007/s10546-018-0362-6
Zhou, L., Dickinson, R. E., Tian, Y., Vose, R. S., and Dai, Y. (2007). Impact of Vegetation Removal and Soil Aridation on Diurnal Temperature Range in a Semiarid Region: Application to the Sahel. Proc. Natl. Acad. Sci. 104 (46), 17937–17942. doi:10.1073/pnas.0700290104
Zhou, Y., Shi, J., and Sun, G. (2012). Changes of Diurnal Temperature Range and its Influencing Factors from 1873 to 2009 in Shanghai. J. Meteorology Environ. (in Chinese) 28 (01), 24–30.
Keywords: diurnal temperature range, urbanization, synoptic weather pattern, random forests, Yangtze River Delta region
Citation: Guo M, Zhang M, Wang H, Wang L, Liu S, Zong L, Zhang Y and Li Y (2021) Dual Effects of Synoptic Weather Patterns and Urbanization on Summer Diurnal Temperature Range in an Urban Agglomeration of East China. Front. Environ. Sci. 9:672295. doi: 10.3389/fenvs.2021.672295
Received: 25 February 2021; Accepted: 25 May 2021;
Published: 14 June 2021.
Edited by:
Qingxiang Li, Sun Yat-Sen University, ChinaReviewed by:
Jiachuan Yang, Hong Kong University of Science and Technology, ChinaJinming Feng, Institute of Atmospheric Physics, Chinese Academy of Sciences (CAS), China
Copyright © 2021 Guo, Zhang, Wang, Wang, Liu, Zong, Zhang and Li. This is an open-access article distributed under the terms of the Creative Commons Attribution License (CC BY). The use, distribution or reproduction in other forums is permitted, provided the original author(s) and the copyright owner(s) are credited and that the original publication in this journal is cited, in accordance with accepted academic practice. No use, distribution or reproduction is permitted which does not comply with these terms.
*Correspondence: Linlin Wang, bGlubGlud2FuZ0BtYWlsLmlhcC5hYy5jbg==
 Min Guo1
 Linlin Wang
 Yubin Li