 Peng Gao1
 Chao Qu2*
- 1School of Education, Shandong Vocational University of Foreign Affairs, Weihai, China
- 2School of Statistics, Dongbei University of Finance and Economics, Dalian, China
Introduction: China's environmental policies and the green transformation of its industries have attained paramount significance in the wake of intensifying climate change and soaring carbon emissions, critically shaping sustainable development at both national and international scales. As the exploration of the drivers and outcomes of this green revolution on carbon emissions gains traction as a focal point of research, this study endeavors to assess the effects and their underlying causes.
Methods: Utilizing a systems thinking methodology, a dynamic spatial Durbin model was constructed, analyzing statistical data spanning from 2004 to 2021, encompassing 30 Chinese provinces.
Results: China's green transformation significantly influences the spatial distribution patterns of carbon emissions across various regions.
Discussion: Environmental Protection investment has been effective in curbing carbon emissions from local businesses, yet it may also prompt a relocation of these businesses to neighboring provinces, inadvertently elevating their carbon emissions. Green innovation and the adoption of green energy technologies have proven instrumental in reducing carbon emissions in a region, with positive spillover effects extending to nearby areas. The dynamic spatial Durbin model analysis further underscores the inertia of carbon emissions, indicating that achieving carbon reduction is a process requiring consistent and sustained efforts over the long term. The findings of this study offer valuable insights and recommendations for the government in devising and implementing green transformation policies that align with the dual-carbon target, aiming to achieve a greener and more sustainable future.
1 Introduction
We confront a diverse array of intricate global challenges, including a staggering 25% loss in biodiversity, a 30% retreat in glacier coverage, and a surge in extreme weather events by 50% over the past decade. These phenomena form an intricate web of interconnectedness, extending beyond purely environmental concerns to encompass critical domains such as the economy, society, and population dynamics. As we progress into the future, we must navigate a dynamic and unpredictable environment, eschewing reliance on conventional linear models for forecasting trends (Shi and Yang, 2022).
Global anxiety over the relentless rise in carbon emissions is widespread, particularly within the energy and industrial sectors. Our dependence on fossil fuels and unsustainable, imbalanced energy consumption has led to a significant increase in the average global temperature by ~1.1° Cover the past century (IPCC, 2023). According to the Sixth Comprehensive Assessment Report issued by the International Panel on Climate Change (IPCC), global sea levels have risen by ~20 cm, and this upward trend is accelerating at an alarming rate. The list of major socioeconomic issues triggered by climate change is lengthy, encompassing fluctuations in agricultural output, skewed resource allocation, and the burgeoning concern of environmental refugees, affecting millions of lives worldwide.
The surge in global carbon emissions is primarily fueled by the relentless march of industrialization and the relentless urban sprawl, despite a few developed nations witnessing a modest retreat in their carbon footprints. The complex and carbon-intensive nature of the current global energy consumption pattern has positioned carbon emissions as a formidable obstacle to the path of sustainable development. According to the Carbon Emissions Report 2023 by the International Energy Agency (IEA, 2024), China's carbon emissions have seen a significant rise, increasing by a staggering 565 million tons, with energy combustion emissions alone surging by 5.2%. This highlights the urgency of the situation and the need for immediate action. China, recognized as the world's largest developing nation (UN, 2020), has set ambitious goals to combat climate change. It aims to achieve carbon neutrality by 2060 and has set a milestone to peak carbon emissions by 2030. To reach this target, China has formulated a comprehensive action plan for 2030 carbon peaking. This plan envisions a substantial reduction in carbon emissions per unit of GDP by more than 65% from 2005 levels, and an increase in the share of non-fossil energy use by 5% from the 2025 levels. By 2060, China is determined to not only achieve carbon neutrality but also to ensure that the share of non-fossil energy use exceeds the significant threshold of 80% (SCPRC, 2021). This comprehensive program encompasses the energy, industry, transport, and other sectors, showcasing China's commitment and responsibility as a major global player.
The objective of this scholarly work is to delve into the intricate nexus between China's green transformation and its carbon emissions, meticulously examining the policy, innovation, and energy mechanisms that underpin this critical relationship. The paper meticulously assesses the efficacy of these three pivotal components in propelling the reduction of carbon emissions, providing empirical evidence that underscores the potential of green transformation to catalyze regional decarbonization efforts. Drawing upon a wealth of data, the paper presents a robust spatial econometric model that incorporates first-order lagged variables, thereby accounting for the temporal dynamics inherent in the data. This sophisticated model is designed to capture the complex interplay between carbon emissions and green transformation across various provinces, shedding light on the spatial dependencies and spillover effects that characterize this relationship. By analyzing the dynamic spatial effects of carbon emissions and the spatial correlation with green transformation, the model reveals the extent to which regional initiatives can influence broader carbon reduction strategies. The paper not only offers a nuanced understanding of the mechanisms at play but also provides actionable insights for policymakers and stakeholders aiming to harness green transformation as a lever for sustainable development.
The paper is structured as follows: a comprehensive assessment of the pertinent literature is given in Section 2. The study's primary variables and the sources of the data are outlined in Section 3. The results of the empirical analyses are summarized in Section 4. Extensive analyses and discussions of the aforementioned empirical data are presented in Section 5. Section 6 concludes by summarizing the key findings and offering policy recommendations.
2 Literature review
2.1 Drivers of green transformation
A key factor in lowering carbon emissions and advancing sustainable economic growth is industrial green transformation. Incorporating environmentally friendly and sustainable practices into the industrial production process, green transformation exemplifies a paradigm of resource-efficient and eco-friendly development (Lü et al., 2015). This concept emerges from an in-depth analysis of conventional industrialization, striving to reconcile the inherent tensions between environmental conservation and the imperatives of industrial growth. A multitude of scholars have conducted extensive research on the impacts of environmental regulation, technological innovation, and energy structure on green transformation. Zhao et al. (2021) employed SYS-GMM and DIF-GMM to explore the driving factors of green transformation, and they found that first-order lag has a favorable impact, environmental regulation has an adverse effect, technological innovation will enhance the efficiency of green transformation, and economic development will only exert a positive influence once it attains a specific level. Hou et al. (2018) probed into the dynamic effect of different levels of environmental regulation on carbon intensity and determined a threshold. The influence of industrial green transformation on carbon intensity is constrained by environmental regulatory thresholds. Weak regulations promote carbon reduction, while strong regulation might lead to failure. Based on this, Zhai and An (2020) verified that technological innovation has a remarkable positive effect on the performance of manufacturing green transformation, and environmental regulation can positively influence green transformation through technological innovation.
The effect of policy change on carbon emissions is a negative externality, meaning that emitters bear the costs of their detrimental effects without receiving compensation (Grau, 2011). Emissions can be made to pay for production costs by emitters through carbon trading, environmental taxes, and other means. The foundation of green transformation is green innovation, as it produces novel and inventive outcomes that can be applied and shared across various areas (Yan et al., 2021). Fossil fuels and other non-renewable resources are crucial to the economic prosperity of developing nations, but their availability in the natural world is restricted. The green growth hypothesis states that to break free from the resource curse, technological advancements in green technology should be paired with regulatory measures and modifications to the energy structure to steer the economy toward low-carbon, clean energy, and environmentally sustainable development (Qiu et al., 2021).
Research on the drivers of green transformation was comparatively late to begin, with early studies neglecting potential non-linear correlations and interactions between components in favor of concentrating on the effects of a single element. Xie et al. (2022) emphasized that while technological advancements in the green field can lower emissions of pollutants, this benefit could be negated if the proportion of heavily polluting businesses in the industrial structure increases. Moreover, a few studies have suggested that excessively strict environmental regulations may have unfavorable effects (Leeuwen and Mohnen, 2013). Businesses might, for example, move to less regulated areas, which would hinder the flow of new practices from adjacent regions (Zheng and Shi, 2017). Porter's innovation compensation hypothesis suggests that businesses may be encouraged to innovate with mild environmental legislation (Porter and van der Linde, 1995). These creative actions not only maximize resource allocation but also greatly increase production efficiency, which lowers an organization's operational expenses. The energy substitution theory (Wang and Jiang, 2019) suggests that replacing conventional high-carbon energy sources with newly developed green technologies can change the pattern of energy use and lower carbon emissions. To sum up, green transformation is believed to be primarily driven by environmental regulation, green innovation, and green energy (Busch et al., 2018; Li et al., 2019).
2.2. Spatial econometric analysis of carbon emissions
Years have been spent by researchers examining the causes of carbon emissions. Researchers have carefully examined how one variable affects carbon emissions, and the methods used to lower emissions (Mi et al., 2016; Zhang et al., 2017; Spaiser et al., 2018; Li Z. et al., 2021). The effects of technical innovation (Liu et al., 2023), collaborative agglomeration (Chen et al., 2023), and regional economic competition (Pan and Guo, 2024) on carbon emissions have also received a great deal of attention from academics. Researchers' interest in the spatial distribution effect of carbon emissions has increased recently due to the growth of spatial econometrics. The intricate relationship between economic growth, industrial upgrading, and carbon dioxide emissions has been shown through a thorough study of China's energy resources and industrial structure, underscoring the difficulty of managing carbon dioxide emissions (Wu et al., 2021; Cao et al., 2023). Moreover, notable regional variations were seen when the carbon emissions patterns of Chinese provinces were compared (Du et al., 2017). Zhang et al. (2022) used dynamic spatial models, the relationship between low-carbon innovation, economic growth, and carbon dioxide emissions is examined. This demonstrates how important it is to use a dynamic methodology in order to understand how carbon emissions are evolving. Although conventional static spatial models have been the mainstay of research on carbon emissions, it has been demonstrated that they are unable to adequately represent the complexity of modern carbon emissions and are difficult to modify to account for changes over time, between sectors, and across regions. It is imperative that static models give way to dynamic models to more correctly address the challenge of carbon emissions (Liu and Dong, 2023).
2.3. Interdisciplinarity and systems thinking
Beginning in the early 1900s, the field of systems thinking emerged from the general systems theory put forth by biologist Bertalanffy. This formalized logical-mathematical theory offered common concepts and models for a variety of fields (Bertalanffy, 1950). The study of carbon emissions involves several interacting topics in a continually changing context, just like most sustainability concerns. Since multiple system components can learn from one another over time to develop new patterns, these changes do not fit into linear or simple patterns (Rosely and Voulvoulis, 2024). One of the main advantages of systems thinking's interdisciplinary approach is its capacity to challenge conventional wisdom in fields like sustainable development, information systems, and socioeconomics. A unifying framework is necessary to incorporate many organizational, human, and cultural variables in problem resolution and decision-making (Mingers and White, 2010).
With a particular emphasis on an integrated interdisciplinary, cross-sectoral, and multi-factor viewpoint, scholars are seeking to study the mechanisms impacting CO2 emissions within the same framework (Zhang W. et al., 2024). Yin et al. (2022) constructed a multi-level system structure model and adopted the partial least squares approach to formulate a structural equation for analyzing the heterogeneity of green transformation efficiency in diverse resource-based cities. Zhou et al. (2022) advocated integrating carbon peak factors into the technical framework of industrial green transformation, and they devised the CEP-IGT model to demonstrate the influence of seven selected indicators on industrial carbon emissions. Their research indicates that reducing carbon emissions and attaining green transformation necessitate a reform of the energy structure. Mao et al. (2019) formulated a three-stage case learning theoretical framework for learning, verification, and promotion, examined historical cases of industrial green transformation in several regions of China, and identified the driving mechanism at the regional level. The results reveal that there are differences and distinct regional effects in the primary driving elements of structural and efficiency transformation. According to Wu et al. (2021), energy endowment, industrial structure upgrading, and carbon emissions must all be included in a single framework for thorough analysis when using spatial modeling to look at the elements impacting carbon emissions. In a composite system that was developed by various stakeholders, including governments, enterprises, and individuals, there is a relationship between green transformation and carbon emissions. Every stakeholder has a unique role and way of acting (Wei et al., 2022). Systems thinking considers carbon emissions as a complex system made up of many subsystems to understand the numerous components contributing to the problem and how they change over time (Cheng et al., 2023). Therefore, it is crucial to use the systems thinking approach while studying green transformation and carbon emissions.
Although most existing literature has focused on the impact of green transformation on carbon emissions, scant attention has been paid to the underlying mechanisms of this process. This paper posits that there is a pressing need for further research in three critical areas. Firstly, the current research landscape, which predominantly examines a single element of green transformation, contradicts the principles of social functioning. Reducing carbon emissions is a complex, systematic endeavor that necessitates the engagement of the entire community. An overemphasis on one aspect could lead to a myopic view, obscuring the broader dynamics of play. Secondly, the influence of green transformation on carbon emissions is intricate and multidimensional. The drivers of green transformation have not been thoroughly examined in literature, with academics often focusing on isolated factors. There is a significant gap in research concerning the spatial impacts and interactions among the various components within a systems thinking framework. Lastly, given that carbon emissions are the result of long-term processes, literature has yet to construct a dynamic spatial model to study these emissions.
3 Materials and methodology
3.1. Research framework
This paper introduces a systems thinking framework that encompasses three main drivers: policy regulation, green innovation, and green energy. By employing systems thinking methodologies, this study quantitatively evaluates the dynamic spatial interactions between carbon emissions and green transformation. Figure 1 vividly captures the dual impact of policy, innovation, and energy drivers on green transformation across both spatial and temporal dimensions. It demonstrates how these drivers can synergistically influence the trajectory of carbon emissions.
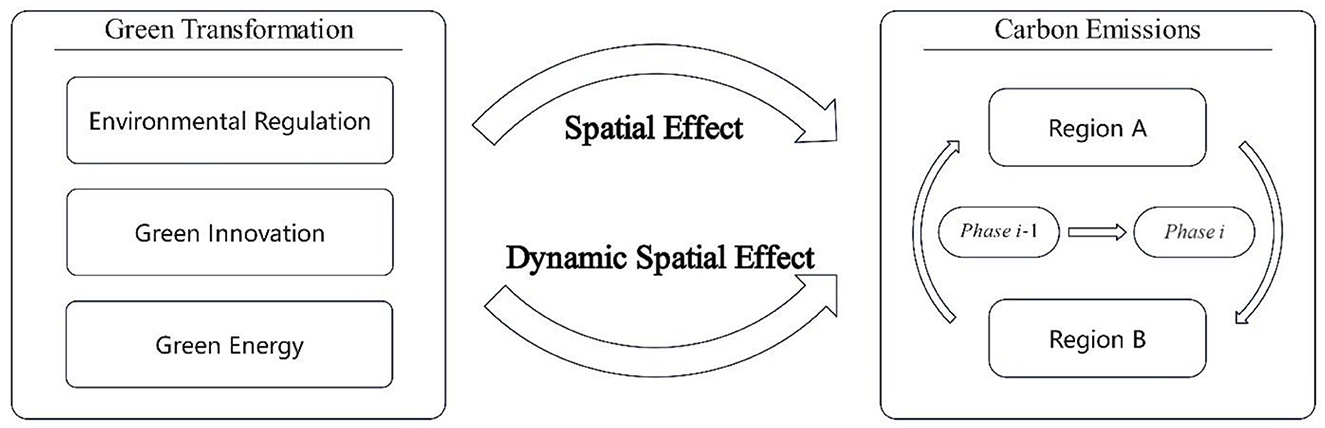
Figure 1. Systems thinking framework.
Green transformation is a system involving the synergy of multiple factors, covering the interactions of multiple elements such as economy, society, resources, and environment. Environmental regulations provide a policy framework and restraint mechanism for green transformation. By making and following strict rules for protecting the environment, the government can push businesses to cut down on pollution, make better use of resources, and encourage the improvement and optimization of the industrial structure. Environmental regulations in China have transitioned from a competitive approach to a more strategic approach. This optimized form of environmental regulations has significantly facilitated the green transformation of the economy (Sarkis, 2003). Green innovation is the core driving force of green transformation. It includes technological innovation, management innovation, and model innovation, aiming to reduce the negative impact on the environment through new technologies, new products, and new services. In the construction field, the installation of solar energy and the use of biodegradable materials not only help reduce the environmental costs of enterprises but also enhance their market competitiveness and economic benefits (Aravindh et al., 2022). Green energy is the fundamental support for green transformation. The development of renewable energy and energy storage technologies effectively reduces reliance on fossil fuels and lowers carbon emissions. For example, the creative use of “renewable energy + energy storage” helps the green and low-carbon transition by making the best use of space for energy storage and raising the output of renewable energy power plants (Wang et al., 2019).
Carbon abatement requires a thorough green transformation revolution (Wilberforce et al., 2021). We should construct a composite and systematic strategy, starting from policies, innovation, and energy, to achieve the coordinated development of the economy and the environment. Formulate strict emission standards and environmental protection regulations, force enterprises to reduce pollutant emissions, and prompt enterprises to improve production processes and technologies and reduce energy consumption, thereby reducing carbon emissions (Liu et al., 2015). Innovate production processes and management models, reduce energy waste and waste emissions in the production process, and reduce carbon emissions per unit of product. Develop more efficient clean energy technologies, such as new solar panels and energy storage technologies, improve energy utilization efficiency, and reduce reliance on traditional high-carbon energy (Kirichenko and Kustov, 2024). Increasing the proportion of green energy, such as solar energy, wind energy, and hydropower, in the energy supply, directly reduces the demand for high-carbon energy, such as coal and oil, thereby reducing the total amount of carbon emissions. The large-scale application of green energy can make the energy structure more diversified and stable and reduce the risk of excessive reliance on high-carbon energy due to fluctuations in energy supply (Liang and Pan, 2023).
From the perspective of spatial influence, there is a spatial spillover effect of environmental regulations (Zhang and Xu, 2023). When region A implements strict access restrictions and emission standards for highly polluting enterprises, it may cause these enterprises to migrate to the neighboring region B where environmental regulations are relatively lenient, or prompt surrounding areas to strengthen environmental regulations in advance to avoid the transfer of polluting industries. The spatial diffusion and knowledge sharing of green innovation accelerate (Tan et al., 2024). If city A achieves a breakthrough in green building technology, its experience and technology may be learned and applied by surrounding cities, thereby promoting emission reduction on a larger scale. The spatial distribution and synergy of green energy are prominent (Zhang X. et al., 2024). Region A, which is rich in wind energy, and region B, which is rich in solar energy, can be interconnected through the power grid to achieve complementary and collaborative supply of green energy, improving energy utilization efficiency and emission reduction effects.
From a dynamic perspective, in the early stage of economic development, industries with high energy consumption and high emissions usually dominate, and carbon emissions often increase along with economic growth. However, over time, as the economic structure gradually transforms toward the service industry and high-tech industries, energy demand and carbon emission intensity will decrease, showing a trend of rising first and then falling, as depicted by the Environmental Kuznets Curve (Grecu and Rotthoff, 2015). In the early stage of development, environmental policies may be relatively lenient. However, with the deepening understanding of climate change and increasing international pressure, policies have become increasingly strict (Duan et al., 2024). For example, gradually higher carbon emission taxes, stricter emission standards, etc., will all prompt enterprises and society to reduce carbon emissions. In the long term, the proportion of traditional fossil fuels in energy consumption may gradually decrease, while the proportion of renewable energy, such as solar energy, wind energy, and hydropower, will continue to rise (Zhou et al., 2009). This transformation of the energy structure takes time to achieve, but it will eventually have a significant inhibitory effect on carbon emissions (Guo et al., 2019). With the passage of time, the improvement of energy production and utilization technologies has increased energy efficiency, and carbon emissions per unit of output have gradually decreased. The research and development and application of new low-carbon technologies and clean energy technologies, such as more efficient solar panels and advanced energy storage technologies, can directly reduce reliance on high-carbon energy and thereby reduce carbon emissions (Hodgkinson and Smith, 2021). To reach the dual-carbon goals, the government, businesses, and the market must all work together, and there needs to be multi-regional systematic guidance to help the green transformation go smoothly.
3.2 Spatial econometric model
3.2.1 Moran's I and scatter plot
This paper's goal is to show the spatial correlation between carbon emissions and green transformation, as well as to clarify the relationship between the two. The global Moran's I is commonly used in spatial econometrics to evaluate the spatial correlation between variables (Anselin, 1988). Equation 1 defines the global Moran's I:
Let n be the total number of spatial units and let Xi be the observed value of the i spatial unit. Moran's I has a value range of [−1, 1]. Positive spatial correlation between the variables is indicated when its value is >0, while negative spatial correlation is indicated when its value is <0. Conversely, the higher the spatial correlation, the smaller the absolute value of Moran's I. The spatial distance weighting matrix Wij was used to evaluate the spatial correlation of variables throughout the region. The first law of geography states that spatially close items are always more related than those that are further away (Tobler, 1970).
A statistical instrument that shows the worldwide regional economic activity's spatial correlation is Moran's I. On the other hand, to show local spatial relationships and determine whether high or low observations of carbon emissions are geographically grouped, the Moran's I scatterplot is utilized. A two-dimensional visualization of an array of spatial lag factors (z, Wz), where Wz indicates the spatial weighting derived from spatially unitary observations, is produced via a scatterplot with (z, Wz) as the coordinate point (where represents the spatial lag factor). Equation 2 illustrates how we can obtain the local spatial autocorrelation for each province in China by decomposing the global Moran's I for each province:
3.2.2 Description of the spatial model
Both static and dynamic types of spatial econometric models are distinguished. Over a variety of time periods, the geographic effects of the explanatory variables on the explained variables are examined by the static spatial model. To fully evaluate the effects of factors other than the explanatory variables, the dynamic spatial model incorporates first-order lagged terms of the explained variables (Anselin and Kelejian, 1997). As a result, one-period lags of the explanatory variables are incorporated into the dynamic spatial Durbin model developed in this paper. Equations 3, 4 indicate the econometric model:
Where ψi and λi are time effect and spatial effect, β is corresponding parameter, εit denotes random error term, ρ and θ are spatial regressive coefficients, τ1 and τ2 is the spatial lag coefficients. If θ = 0, SDM will degrade to SAR. If θ = −ρα, SDM will degrade to SEM. Wij is the spatial weight matrix based on geographical distance, which distance data sources are collected manually.
3.3 Description of variables
The explained variable in this paper is carbon emissions, while the main explanatory variables are green energy, green innovation, and environmental regulation. The following are the variables involved in this study and are presented with a statistical description in Table 1.
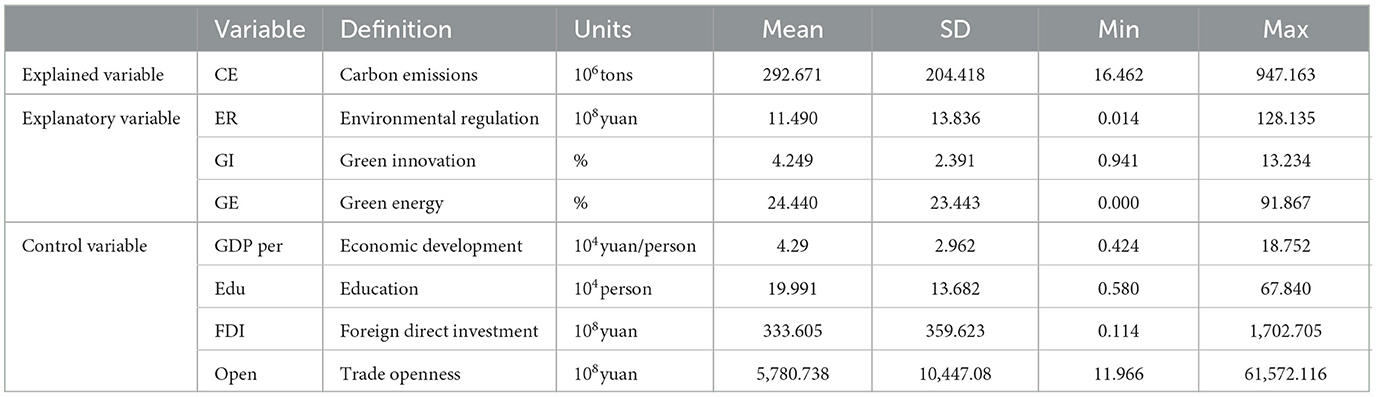
Table 1. Statistical description of all variables.
Carbon emissions: the Intergovernmental Panel on Climate Change (IPCC) suggested technique is followed in the estimate of carbon emissions in this paper. The combustion of 17 fossil fuels, including raw coal, crude oil, and natural gas, as well as the manufacturing of cement and lime, are included in the scope of carbon dioxide emissions. Given that the production of cement and lime has recently resulted in increased carbon emissions, it is essential that this scenario be taken into account in this paper (Shan et al., 2018, 2020).
Environmental regulation: environmental regulation stands as a pivotal factor influencing carbon emissions. Despite the current consensus on its importance, there is a notable divergence among scholars regarding the optimal methodologies for quantifying the impact of environmental regulation. Common indicators include pollutant emission intensity, the stringency of environmental regulation laws, the operating costs of pollution treatment facilities and sewage charges. However, these indicators, while widely used, show a certain homogeneity and universality, and fail to reflect the government's regulation of corporate carbon emissions, which complicates the precise measurement of both the drivers and the outcomes of environmental regulation on market dynamics (Zhao, 2024). Environmental protection investment illustrates how much a country or company invests in environmental conservation. A higher investment indicates increasing spending on environmental infrastructure development and the research, development, and distribution of pollution control technology. This investment often grows in sectors which face stricter environmental regulations. According to environmental regulations, companies that invest in waste gas treatment incur expenditures for equipment purchase, operation, and maintenance. However, these investments have other benefits, such as avoiding environmental penalties, improving corporate reputation, and addressing consumer desires for environmental preservation. Companies will make decisions based on the balance of costs and benefits. Therefore, the paper uses the waste gas treatment investment as an environmental regulation indicator (Zeng et al., 2021).
Green innovation: research and development (R&D) inputs (Yang and Yang, 2015), green patents as defined by the IPC green inventory (Popp and Newell, 2012), and green total factor productivity (TFP) (Costantini et al., 2017) are the three main components of the current methodology used to measure green innovation. R&D inputs and innovation outputs are not precisely equivalent, though, because of capital utilization constraints (Tumelero et al., 2019). This is due to the challenge of precisely measuring the degree of green innovation in R&D inputs. Meanwhile, because of regional and industry variations, it may be challenging to gather reliable environmental and economic data needed to calculate green TFP. Therefore, this paper adopts the ratio of the number of green inventions and green utility models submitted in the current year to the total number of submissions as a proxy for the nation's technological innovation in environmental protection, in line with the diffusion effect theory (Chen et al., 2023).
Green energy: the process of burning leads to notable variations in carbon emissions among various forms of energy. Coal has been the primary energy source in China for a long time—more than 70%—in this regard. Oil and natural gas have 1.2 and 1.6 times, respectively, more carbon emissions than coal combustion (IEA, 2024). Carbon dioxide is not released by clean energy sources like solar, wind, tidal, or nuclear power. When researching energy structure, most of the literature to date concentrates on the structure of fossil energy consumption. The green energy consumption structure—which is the proportion of solar, wind and nuclear power generation in total electricity generation—is used in this paper (Wang et al., 2005). Green energy is becoming a transitional energy source for energy consumption from fossil fuels to non-fossil fuels since it helps reduce climate change and improve environmental quality.
Economic development: according to the Environmental Kuznets Curve (EKC) hypothesis, economic growth and carbon emissions do not directly correlate. Different components are needed for economic growth at different phases of development. Economic growth may initially encourage careless development but frequently comes at the expense of the environment. But as economic growth reaches a certain point, the government starts to see the negative effects of development and starts to focus on environmental quality. As a result, the two have an inverse U-shaped relationship (Grossman and Krueger, 1995). Based on earlier studies, this paper employs per capita GDP as a gauge of economic expansion. This paper uses 2003 as the base period and converts each year's nominal GDP to real GDP to maintain data comparability.
Education: most of the previous studies on the influencing factors of carbon emissions have mainly concentrated on aspects like industrial production, energy structure, and transportation. As the concept of sustainable development has been deeply ingrained in people's minds, education has gained attention as a new crucial factor. On the one hand, global investment in environmental protection education is gradually escalating to enhance the public's capacity to protect the environment and respond to climate change. On the other hand, disparities in educational levels across various regions might be associated with the performance of carbon emission control, and educational development is also indirectly influencing carbon emissions. The human capital theory indicates that education can enhance an individual's capability, which can be transformed into the ability to develop low-carbon technologies and formulate policies in the context of carbon emissions (Horan et al., 2019). Therefore, this paper uses the number of graduates from institutions of higher learning as a proxy variable to measure the level of education (Tian et al., 2017).
Foreign direct investment: the relationship between FDI and carbon emissions is a complicated one. Based on the “Pollution Haven Hypothesis,” China's relatively lax environmental rules may attract enterprises that pollute, leading to an increase in CO2 emissions within the country (Copeland and Taylor, 2004). The “pollution halo hypothesis” suggests that FDI could also result in a learning and demonstration effect, which could encourage technological and managerial innovation in the receiving nation through technology spillovers. Consequently, this will raise the bar for environmental governance (Pao and Tsai, 2011). As a result, there are two ways that FDI affects carbon emissions, and both require careful thought.
Trade openness: industrial production activities are typically more common in nations with strong trade openness, with the goal of supporting the manufacture of goods shipped to other nations. Energy consumption is high in this process; additionally, the use of vehicles for transportation, such as ships, aircraft, and trucks, during the transport phase is associated with high energy consumption and emissions of greenhouse gases, such as carbon dioxide (Lin and Benjamin, 2017), which raises total carbon emissions. As a result, the relationship between trade openness and carbon emissions is positive. This paper uses the ratio of GDP to total imports and exports as a stand-in variable to gauge trade openness.
3.4 Specification of spatial measurement models
In order to construct a dynamic spatial model that explains the impact of green transformation on carbon emissions, this paper follows the methodology suggested by Zhang M. et al. (2024). The time lag and spatial spillover effects are taken into consideration in the model design, which is essential for assessing the dynamic changes in carbon emissions. A static spatial model is represented by Equation 5. It can be used to generate the dynamic spatial model by including the lag terms of the explanatory variables, which yields Equation 6:
Where CEit represents the carbon emissions of province i in year t. ER denotes environmental regulation, GI denotes green innovation, GE denotes green energy, and W denotes the spatial weight matrix. In addition, Z denotes a series of control variables including GDP per capita, education, FDI and trade openness. All variables are presented in logarithmic forms to eliminate possible heteroscedasticity.
3.5. Data collection and spatial matrix
The panel data set used in this study includes 540 sample points that correspond to 30 administrative regions1 in China at the provincial level between 2004 and 2021. The study uses data from respected organizations and international government bodies to guarantee the validity of the research findings. The provincial CO2 emissions inventory provided by China Carbon Emission Accounts & Datasets (http://www.ceads.net.cn) served as the source of the carbon emissions data from 2004 to 2021. The inventory, which covered 17 different categories of fossil fuel emissions from 47 industries, was put together using a combination of complete accounting and apparent energy use. It incorporates carbon emissions from the cement and lime sectors in accordance with the IPCC's emissions accounting methodology (Shan et al., 2020). The China National Intellectual Property Administration (CNIPA) was searched for green patents from 30 provinces for this paper. The green patent codes obtained from the global IPC Green Inventory were then compared. Information on the quantity of green inventions and green utility model patents filed in the current year was taken from the State Intellectual Property Office's 2004–2021 annual reports (http://www.cnipa.gov.cn). The China Energy Statistical Yearbook provided data on the power generation of new energy and the total power generation. The waste gas treatment investment, GDP, the number of graduates, FDI, and total import and export figures were taken from the China Statistical Yearbook. Since the geographic adjacency matrix and geographic straight-line distance matrix are unable to account for distance differences, topographic factors, and the structure of road and railway transport networks, they are unable to accurately reflect the actual transport costs associated with China's vast landmass and complex topography, which includes a variety of terrains such as oceans, mountains, and rivers. Therefore, using data from CHINA RAILWAY (http://www.12306.cn), this paper suggests a treatment based on the spatial matrix of geographical distance of railway transportation, which is created by calculating the shortest railway mileage between provinces.
4 Empirical results
4.1 Characterization of dynamical evolution
This research utilizes the Gaussian kernel density estimation approach, the study aims to uncover the dynamic evolution characteristics of these variables, providing a nuanced understanding of their interplay and impact over time. A comprehensive visualization of the kernel density distribution is presented in Figure 2, offering a graphical representation of the data's statistical properties. The study's findings reveal highly significant insights into the dynamic evolution of the four variables. Notably, the CE and GE kernel density curve has shifted to the right over the study period, indicating a substantial increase in carbon emissions and green innovation activities. Conversely, the positions of the distribution forms of the kernel density curves of ER and GI along the x-axis do not display any conspicuous overall deviation, indicating that their averages are comparatively stable and revealing that the principal factors influencing these two variables have not experienced considerable alterations. Furthermore, the horizontal widening of the breadth of the CE kernel density distribution suggests that the carbon emissions gap among provinces persists in growing and the distribution is more dispersed, that is, the inequalities among individuals become more prominent. This could be attributed to the factors influencing carbon emissions are becoming more diverse. The slopes of the ER and GI curves have become steeper. This might imply that the intensity of ER is more centralized and homogeneous, and the enforcement of related policies is becoming more standardized and stricter, resulting in a more concentrated distribution of the environmental regulation level. For GI, the steeper slope intimates that the distribution of green innovation is more condensed, suggesting that within some predominant green innovation fields, a considerable number of participants have merged their resources and efforts, thereby generating intensified competition. The slope of the kernel density curve of GE reveals no discernible modification but presents two peaks. This indicates that there are two disparate forms or stages throughout the evolution of green energy. Each peak could denote a relatively restricted development pattern, and there are notable variations in the utilization of green energy among various regions or at separate times. For example, some regions may prioritize large-scale wind energy development, while others may have a stronger inclination for the centralized utilization of solar energy.
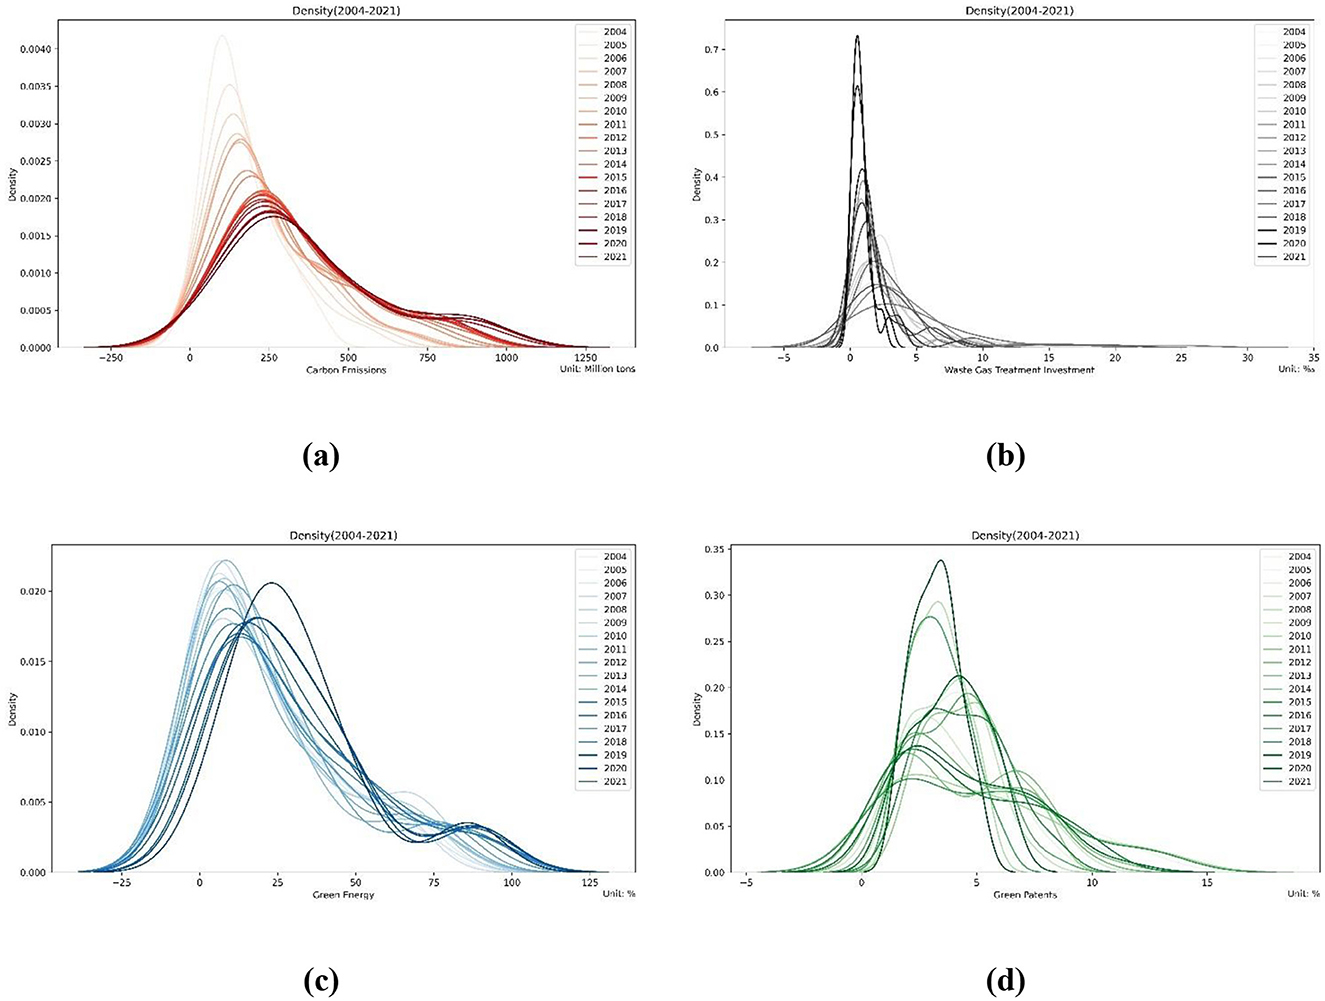
Figure 2. Kernel density curve of variables: (A) Carbon emissions; (B) Environmental regulation; (C) Green energy; (D) Green innovation.
4.2 Spatial pattern of carbon emissions in China
To illustrate the spatial variety and aggregation of carbon emissions across Chinese provinces, Figure 3 provides a summary of carbon emissions statistics at significant intervals from 2004 to 2021. 2004, 2010, 2014, and 2021 are a few of these. Only these four representative years have been chosen for the representation of the spatial distribution due to the visualization's space constraints. Each province's carbon emissions intensity is represented by the red color in the figure, with the color's depth corresponding to the amount of carbon emissions. Therefore, the higher the carbon emissions, the darker the color. Carbon emissions in multiple provinces across the country have exhibited a gradually increasing trend, with the magnitudes of increase varying among different regions. By 2021, carbon emissions in Shandong, Shanxi, Inner Mongolia and Hebei had witnessed a significant surge. Shandong Province, which serves as a crucial industrial base, is characterized by a relatively high density of heavy industries. Owing to the high energy consumption and emission levels of its industrial sectors, it makes a relatively prominent contribution to carbon emissions. Shanxi Province has formed a “path dependence” on coal on account of its abundant coal reserves and low-cost advantage, thereby leading to a relatively high aggregate level of carbon emissions and a distinct development trajectory. Inner Mongolia has experienced a steady growth in carbon emissions, given that its rapid economic expansion has been consistently reliant on substantial energy input and resource exploitation. Apart from elements like industrial structure, energy consumption, and transportation, the relocation of high-energy-consuming and high-emission industries from Beijing is likewise the principal cause of the rise in carbon emissions in Hebei Province. From a spatial perspective, the characteristics of carbon emissions in different provinces have undergone significant alterations, manifesting evident regional disparities. The carbon emission levels of northern provinces surpass those of southern provinces, signifying an apparent propensity for geographical agglomeration. Carbon emissions in the economically developed eastern coastal regions, exemplified by Jiangsu, Zhejiang, and Guangdong, are relatively higher compared to those in the inland provinces of the central and western regions. Meanwhile, Hainan and Qinghai have sustained relatively stable and low emission levels. Consequently, carbon emissions in China's provinces not only exhibit a pronounced increasing trend over time but also manifest distinct geographical spatial agglomeration and heterogeneity.
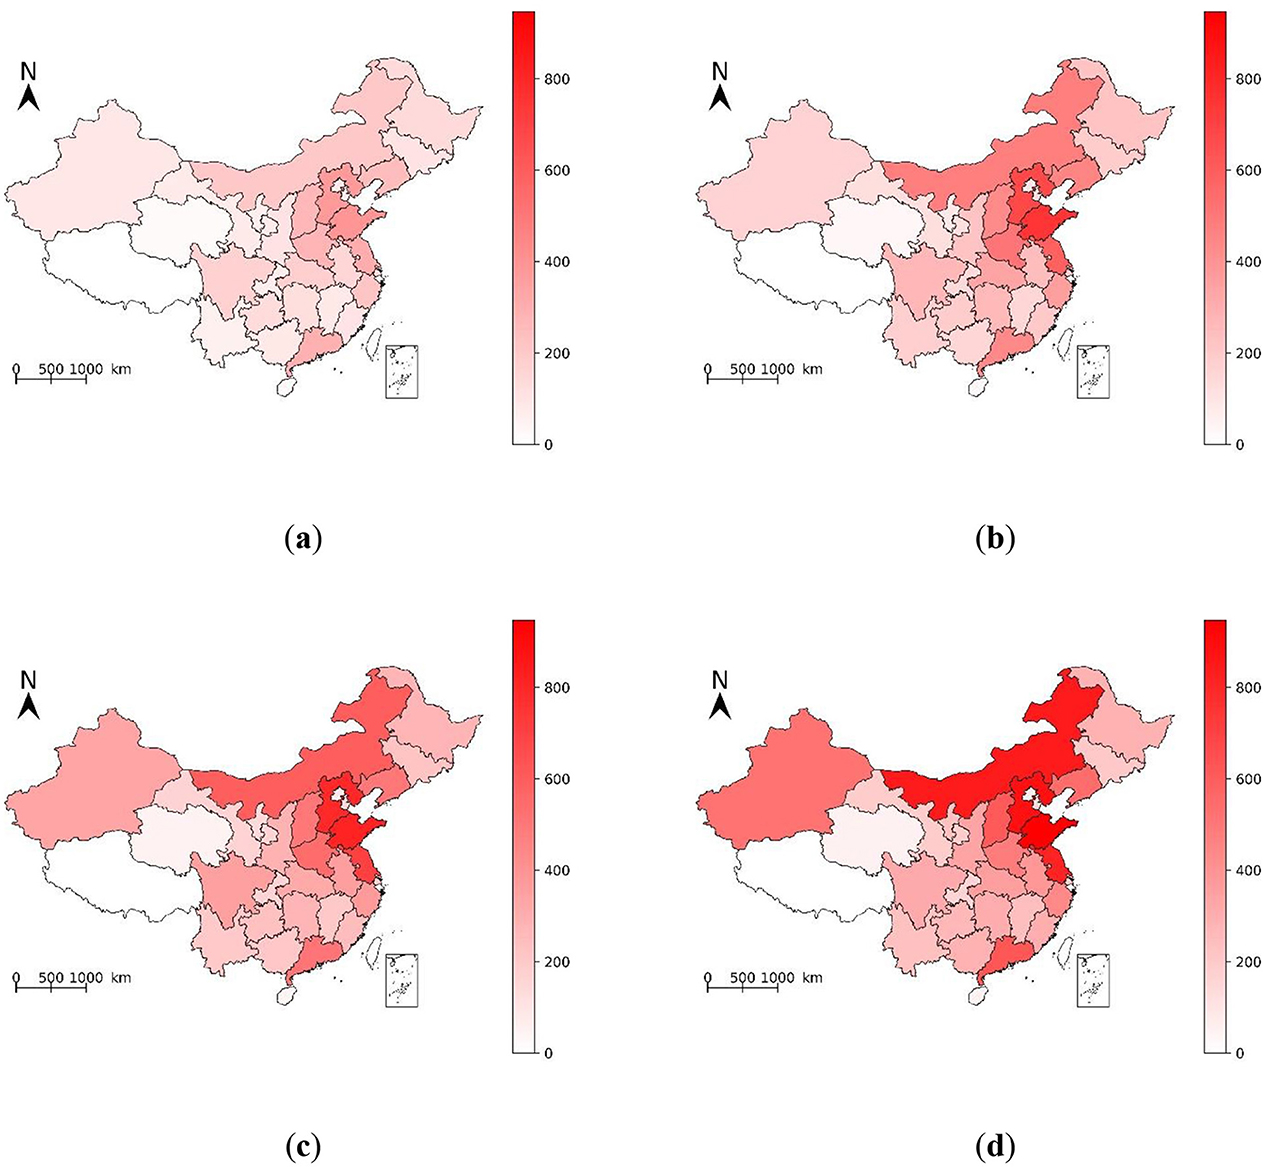
Figure 3. Spatial distribution of carbon emissions: (A) 2004; (B) 2010; (C) 2014; (D) 2021.
4.3 Spatial correlation test
The fundamental premise that guides the creation of spatial econometric models is the existence of spatial correlation in the sample data (Cox et al., 1984; Anselin, 1995). This paper uses the global Moran's I for assessment to measure the spatial autocorrelation of CE, ER, GI, and GE, strengthening the validity of the spatial model (Moran, 1948). The global Moran's I of CE, ER, GI, and GE are all significantly positive in Table 2, which shows the results of the spatial autocorrelation test. This implies that these variables have a strong positive spatial association. This paper additionally computes the local Moran's I for every location to provide additional insight into the spatial agglomeration phenomenon. Only the scatter plots of Moran's I for CE, ER, GI, and GE in 2021 are displayed in Figure 4 due to space restrictions. The findings show that the provinces in China are not uniformly and randomly distributed. The majority of them are located in the first and third quadrants, corresponding to the spatial distribution traits of high-value and high-value aggregation, and low-value and low-value aggregation. The outcomes demonstrate that the spatial measurement model is highly compatible with this article.
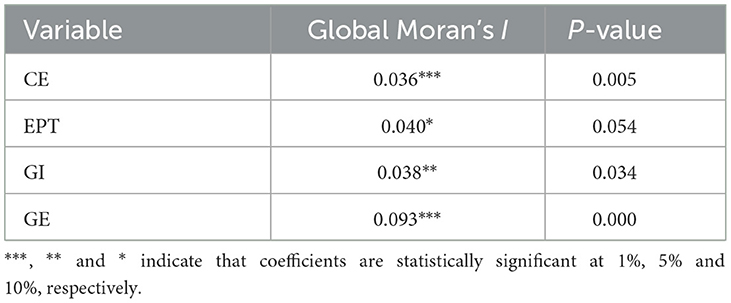
Table 2. Global Moran's I of China's carbon emissions and its statistical test.
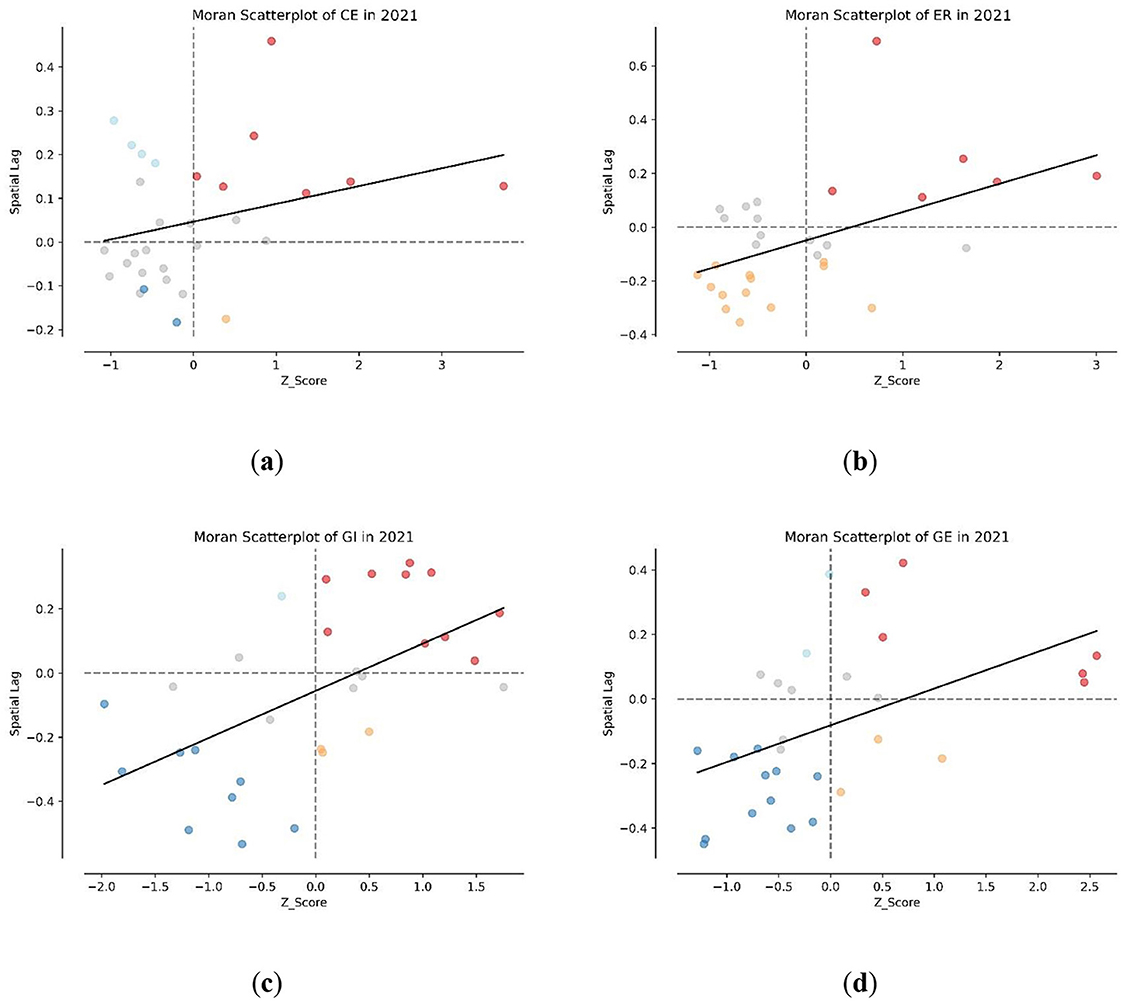
Figure 4. Moran's I scatterplots of CE (A), ER (B), GI (C) and GE (D) in 2021.
4.4. Results of empirical analysis
4.4.1 Estimation of the static spatial Durbin model
According to Table 3's spatial Durbin model estimate results, the spatial correlation coefficient ρ is positive at the 1% confidence level. This suggests that there is a contagion effect, with the province's carbon emissions being positively impacted by those of the adjacent provinces. This demonstrates that spatial connection between variables cannot be disregarded, which is consistent with the earlier Moran's I findings (Ding et al., 2022). At the 5% confidence level, both the estimated coefficient of W×ER and the estimated coefficient of ER under the spatial weight matrix of railway distance are significant at 0.106 and −0.043, respectively. This suggests that the spatial spillover impact of ER is significantly positive. This finding implies that tougher environmental regulations in one province may successfully reduce carbon emissions there, but more stringent environmental regulations in neighboring provinces will raise carbon emissions in their respective provinces. The effect of GI on carbon emissions is not significant from the standpoint of green innovation, nor is the effect of W×GI on carbon emissions. This shows that carbon emissions are not significantly affected by green innovation in the province or in the adjacent provinces, indicating that green innovation is not significantly effective in the short run. Being an important part of the green transformation, green energy also contributes significantly to carbon emissions. The GE and W×GE regression coefficients are significantly negative at the 10% and 5% levels indicating a negative impact of green energy on carbon emissions. This demonstrates the demonstration effect of reduced emissions in the surrounding regions as well as the mitigating effect of green energy (Durbin and Koopman, 2012). FDI has a significant positive relationship with carbon emissions at the province level, according to the regression results for the control variables. This suggests that a province's carbon emissions increase with its level of foreign direct investment. Moreover, at the 5% level, the FDI in neighboring provinces has a significant negative influence. Particularly, FDI in neighboring provinces can reduce carbon emissions. The influence of Edu and W×Edu on carbon emissions is not significant. This indicates that the education level of the province and neighboring provinces has no significant impact, indicating that the education level has no significant effect in the short term. On the other hand, there is no significant correlation between carbon emissions and foreign trade openness, as measured by Open. Additionally, GDP per capita and its squared term are included as control variables in this paper. However, no significant findings are found for this province or for adjacent provinces, indicating that the EKC hypothesis cannot be verified (Ord, 1975). This paper suggests, after a thorough analysis, that the static Durbin model might have neglected additional long-term effects (Ding et al., 2022).
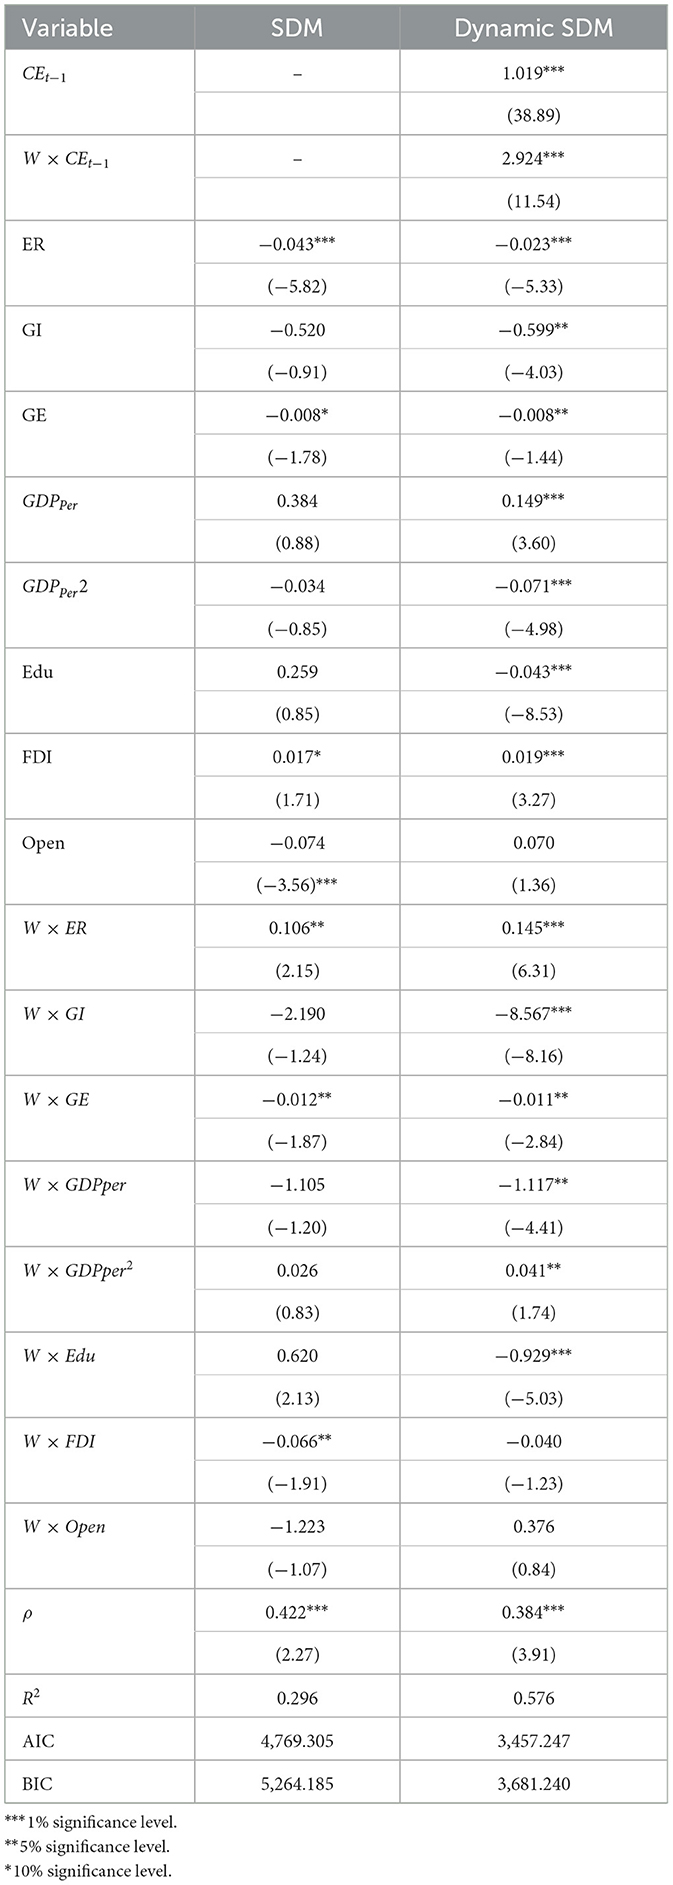
Table 3. Estimation results of Spatial Durbin Model.
4.4.2 Estimation of the dynamic spatial Durbin model
The carbon emissions recorded at a previous time may have a significant impact on the carbon emissions observed in the current period, as carbon emissions are a continuously evolving systematic phenomenon. As such, there is a chance that the outcomes obtained from the static spatial Durbin model contain bias. This study uses the first-order lag term of carbon emissions as its representation and looks at the effects of persistent factors to determine the dynamic effect of carbon emissions. The dynamic spatial Durbin model, which can take into account both time and space dimensions, is then established. The results are shown in Table 3's column 3. The dynamic spatial Durbin model has a higher R2 value and lower Akaike Information Criterion (AIC) and Bayesian Information Criterion (BIC) values when the regression results of the two models are compared. This shows that the dynamic spatial Durbin model fits the data substantially better than the static Durbin model.
The spatial correlation coefficient ρ in the dynamic spatial Durbin model with a first-order lag term for carbon emissions is found to be significantly positive at the 1% level. Nonetheless, it has been discovered that the spatial correlation coefficient (0.384) is less than the static model's (0.422). This is because the static spatial model classifies the long-term effects of elements like the social environment, institutional variables, and climate as spatial correlations while simply taking into account elements like green transformation (Zhou et al., 2020b). On the other hand, these possibly long-term factors are represented by the first-order lag component of carbon emissions in the dynamic model. A more accurate depiction of the static spatial Durbin model is thus provided by this separation, which makes it possible to separate the influence of these factors on carbon emissions from the impact of spatial factors. The static spatial model overestimates the spatial impact of green transformation on carbon emissions (Zou and Zhang, 2020). The time lag coefficient, or CEt−1 coefficient, has a 1.019 value and is significant at the 1% level. It is also known as the time lag coefficient. This suggests that carbon emissions have significant temporal inertia properties, meaning that emissions from the prior period have a positive influence on emissions at the current time. The model predicts that if carbon emissions rise by 1% in the current year, they will rise by an average of 1.019% in the following year. This suggests that as the base of carbon emissions rises, it will become harder to reduce emissions if they are not actively managed. Additionally, the spatial lag coefficient, or coefficient of W×CEt−1, has a value of 2.924. This suggests that carbon emissions have a spatial contagion effect, meaning that adjacent provinces' carbon emissions will benefit those provinces. Moreover, there is a greater spatial lag impact than a temporal lag effect, indicating that the contagion effect of carbon emissions in space is stronger than the temporal inertia characteristics. This suggests that when putting environmental policies into practice, interprovincial synergistic prevention and control should receive more consideration.
To be precise, both GI and GE of their own provinces and adjacent provinces have a significant positive spatial spillover effect on the reduction of CO2 emissions, greatly increasing the reduction. The dynamic spatial Durbin model yields result that are consistent with the information presented in Zhang et al. (2020) when compared to the static spatial Durbin model. In contrast, the calculated coefficient of W×ER is 0.145 and significant at the 1% level, while the projected coefficient of ER is −0.023. This finding suggests that while ER helps reduce carbon emissions within the province, it also causes carbon emissions in adjacent provinces to increase. This implies that businesses might move to low-ER areas from high-ER areas to get around the law. The estimated coefficient of GDP per capita is notably positive at the 1% level from the standpoint of economic development, while its squared term coefficient is significantly negative at the same level. This confirms the “inverted U” effect suggested by the EKC theory and shows that economic progress has a beneficial impact on rising CO2 emissions. To put it another way, when economic development is low, it has a significant positive impact on carbon emissions, and when it is strong, it has a progressive negative impact (Grossman and Krueger, 1995).
4.4.3 Robustness test
This paper divides the sample into four regions: the eastern, central, western, and northeastern regions,2 taking into account the spatial inequalities in carbon emissions and green transformation throughout China's 30 provinces. The objective of this division is to confirm the validity of the results obtained from the spatial Durbin model with respect to carbon emissions and green transformation. Table 4 displays the test results, and the spatial correlation coefficient ρ's sign and significance are mostly in line with Table 3's findings. Furthermore, the four regions' R2 values agree quite a bit with the spatial Durbin model's values for the whole sample. Particularly, in the eastern and central regions, a larger R2 is observed. The strong robustness of the model estimate results in this paper is reflected in the generally consistent estimation results for the other control variables.
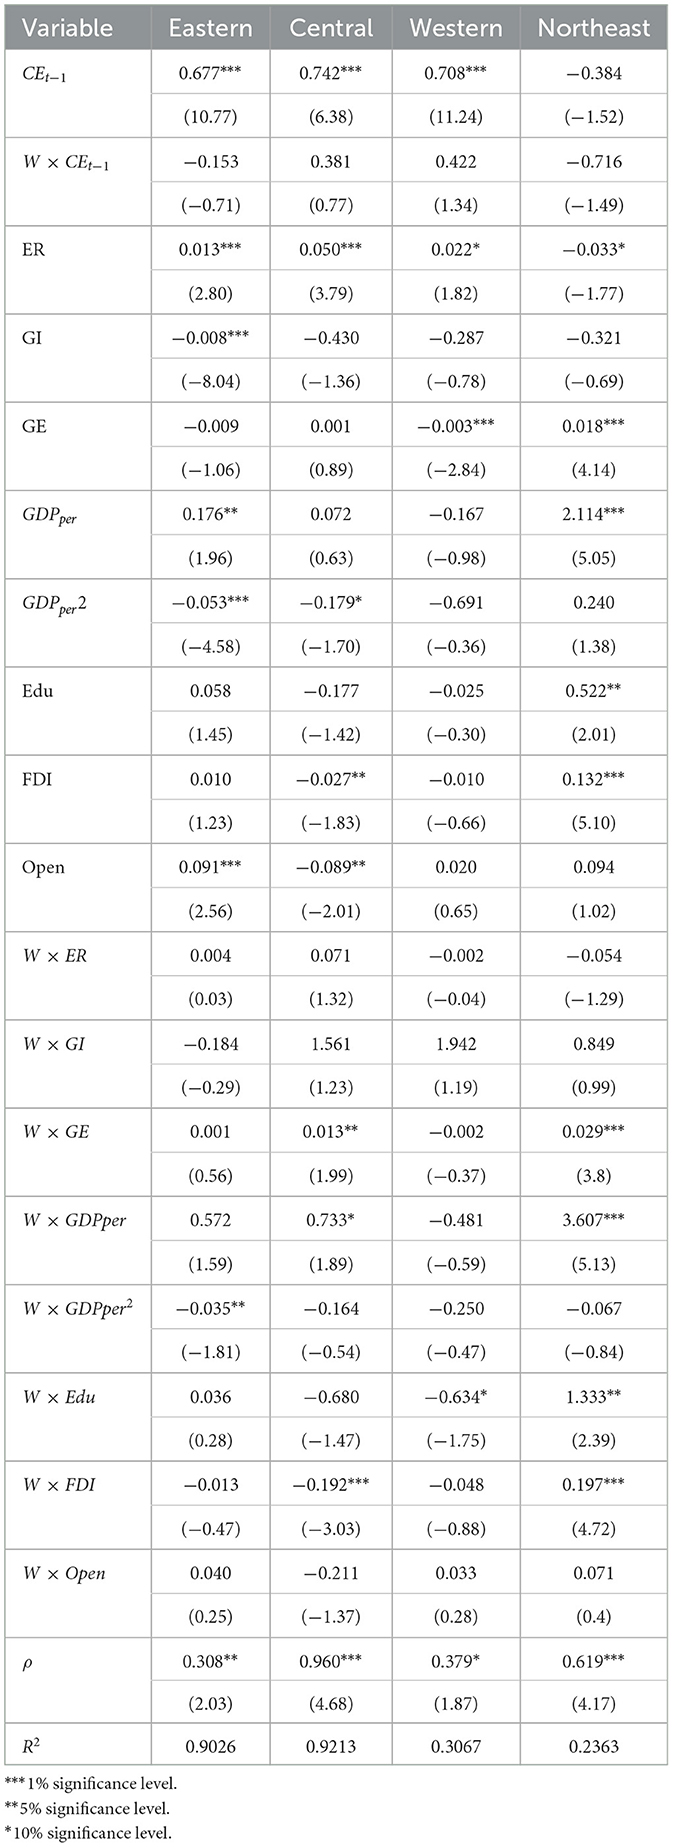
Table 4. Robustness test.
5 Discussion
5.1 Analysis of the time and space lag coefficients of the dynamic SDM regression
As is indicated in Table 3, the coefficient of the time lag term CEt−1 amounts to 1.019 and is significant at 1% level, demonstrating that the previous carbon emission levels exert a considerable positive influence on the current carbon emissions. From a realistic perspective, China's swift economic growth over the past several decades has been partly driven by the industrial model characterized by high energy consumption and high emissions. The time inertia of this model makes the existing emission reduction endeavors more complicated. Nevertheless, from the perspective of systems thinking, we should not view this event as isolation. The previous carbon emission model takes into account the interaction among subsystems like the economy, energy, and environmental legislation (Kiling et al., 2021; Chen et al., 2024). In the past, the stringency of environmental legislation was inadequate, green innovation was not encouraged, and green energy was not utilized to its fullest extent, leading to the accumulation of carbon emissions. The spatial lag term W×CEt−1 has a significant coefficient of 2.924, suggesting that regional carbon emissions are affected not merely by their own variables but also by adjacent regions. In China, the characteristics of imbalanced regional growth are evident. When specific regions undertake industrial transfer, high-carbon-emission industries might be shifted from developed to less developed areas, causing the transfer of carbon emissions (Zhao et al., 2022; Wang, 2023). The geographical contagion effect of carbon emissions surpasses the temporal inertia effect (Li et al., 2023). This spatial connection reveals the significance of considering systems when coordinating the green transformation and formulating emission-reduction methods that take both time and geography into account.
5.2 Spatial effect analysis of green transformation system on carbon emissions
Table 3 demonstrates that ER has a highly negative direct effect (−0.023), implying that environmental regulation can assist reduce carbon emissions to some extent. However, the coefficient of W×ER is 0.145, indicating that environmental regulation not only helps to reduce emissions locally, but also have an impact on nearby areas due to the spatial spillover effect. This conclusion is compatible with several research findings (Li M. et al., 2021). Environmental regulation can indirectly reduce carbon emissions by encouraging the optimization of industrial structure and technical innovation. However, some studies have shown that environmental laws may induce businesses to relocate to locations with more lax environmental standards, resulting in carbon transfer (Zhao and Percival, 2017).
In this study, the estimated coefficient of GI is significantly negative at the 1% level (−0.599), implying that green innovation is an important factor in lowering carbon emissions. Green innovation has a spatial influence coefficient of −8.567, indicating that it has a significant impact not just on lowering carbon emissions in its local area, but also on lowering carbon emissions in adjacent areas due to the spatial spillover effect (Su et al., 2024). Successfully adopting green innovation in one region can not only reduce carbon emissions in that area, but it can also serve as an example and inspiration for neighboring places, encouraging the sharing of technology, information, and experience. This can improve the green innovation vitality of adjacent places, hence cutting carbon emissions on a bigger scale.
The direct influence coefficient of GE is −0.008, indicating that its reduction effect on carbon emissions is relatively limited. Although the development of green energy has achieved certain results, judging from the results of this study, its effect of being used alone to reduce carbon emissions is not very significant. There may be a reason for this: the amount of green energy in the current energy structure is still low, or there are problems with promoting and using the technology, which makes it less effective at directly lowering carbon emissions (Li et al., 2025). But green energy has a spatial influence coefficient of −0.011. This means that promoting and using green energy not only helps lower carbon emissions in the area where it is used, but it can also have an effect on other areas by letting people share energy and technology. For example, some regions have accumulated rich experience in the development and utilization of green energy such as wind energy and solar energy, and their technologies and management models can be borrowed and adopted by other regions to jointly promote the development of green energy and achieve broader carbon emission reduction goals.
From the perspective of systems thinking, there is a complex interaction between environmental regulation, green innovation and green energy and carbon emissions (Cezarino et al., 2019). According to the above analysis, the reduction of carbon emissions within the province and the use of green innovations and energy sources can have a positive demonstration effect on adjacent provinces, as evidenced by the significant spatial spillover effect that green innovation and green energy have on decreasing CO2 emissions (Zhang et al., 2020). As a result, one of the main tactics for lowering regional carbon emissions should be the promotion of these green technologies and energy policies (Liao et al., 2022). It is noteworthy that stringent environmental regulations may result in the regional dispersion of carbon emissions. Although a green tax lowers carbon emissions within the province, emissions in adjacent provinces may rise as a result. This implies that, while implementing environmental policies, interregional coordination and collaboration should be taken into consideration. Furthermore, the inverted U-shaped theory of the environmental Kuznets curve is compatible with the relationship between economic progress and carbon emissions. Carbon emissions first rise and then fall as the economy improves (Grossman and Krueger, 1991). This trend indicates that we need to increase the quality and efficiency of economic development while also accelerating the transformation and upgrading of the industrial structure to achieve the decoupling of economic development and carbon emissions.
5.3. Regional difference analysis of influencing factors of carbon emission
Considering the differences in environmental policies, green technological innovation, and green energy among different regions, this has had a certain impact on the carbon emissions of the provinces and neighboring provinces. Therefore, this paper considers and analyzes the regression results of the eastern, central, western, and northeastern regions in Table 4. It can be seen from the regression results that in the eastern, central, and western regions, the time lag term of carbon emissions is significantly positive, indicating that carbon emissions have obvious inertial characteristics; that is, the high carbon emission level in history will continue for a certain period in the future. However, in the northeastern region, this coefficient is not significant. The economic development in the eastern, central, and western regions is relatively fast, and the continuity and stability of economic activities are relatively strong. Consequently, the historical accumulation of carbon emissions has a more noticeable impact on the current situation (Fest et al., 2022). The economic development speed in the northeastern region is relatively slow, and the changes in the economic structure may weaken the time continuity of carbon emissions (Wang et al., 2025).
Environmental regulations significantly affect carbon emissions in all four regions, but the direction of their effects varies. In the eastern, central, and western regions, the direct impact of environmental regulations on carbon emissions is significantly positive, while it is significantly negative in the northeastern region. The industrial structure in the eastern, central, and western regions is more complex. The implementation of environmental regulations may prompt enterprises to increase costs in the short term, causing some enterprises to temporarily increase energy consumption to maintain the production scale, thereby increasing carbon emissions (Zhou et al., 2020a). Stringent pollution control may cause enterprises to move to neighboring provinces, thereby increasing carbon emissions in neighboring areas.
In the eastern region, green innovation significantly inhibits carbon emissions, which is closely related to the region's developed economy and strong technological innovation ability (Yang and Zhu, 2022). In the central region, due to the lack of sufficient green innovation support, environmental regulations have become the main means of emission reduction (Li and Sun, 2020). The western region relies on the development of green energy to reduce carbon emissions, which is in line with the region's abundant clean energy resources. The northeastern region also relies on green energy, but its emission reduction effect is relatively weak. The climate in the northeastern region is relatively cold; the demand for heating in the winter is high, and the total energy consumption is high (Zhu et al., 2020). This, to a certain extent, amplifies the challenge of reducing emissions and diminishes the impact of green energy on emission reduction.
6 Conclusions and recommendations
This research provides a systems thinking strategy to investigate the dynamic evolutionary features and spatial patterns of carbon emissions and green transformation in China's provinces. It makes use of statistics on carbon emissions from 30 Chinese provinces between 2004 and 2021. The three drivers of the green transformation in carbon emissions are examined empirically for their spatiotemporal heterogeneity and non-linear properties. The paper builds static and dynamic spatial Durbin models. Findings imply that: (1) The dynamic evolution characteristics of carbon emissions show significant spatial variation across Chinese provinces, impacted by green innovation, green energy, and environmental protection taxes. In addition, the distribution's width has expanded between the peaks of carbon emissions and green energy, and the spatial difference is progressively growing. (2) The dynamic spatial Durbin model fits better than the static model, which is better able to extract the ignored persistent factors. It also highlights the spatial contagion effect and inertia features of carbon emissions. (3) A systematic, comprehensive, and scientific approach to erasing carbon emissions is the green transformation. Curbing carbon dioxide emissions in this province is positively impacted by green energy innovation, which also has a favorable spatial spillover effect on adjacent provinces. Although the introduction of an environmental protection tax will help reduce carbon emissions in this province, it will also encourage carbon emissions in other provinces.
This study makes the following policy recommendations in light of the aforementioned research findings: (1) The establishment of a carbon emissions trading mechanism is crucial for optimizing the spatial distribution of carbon emissions and fostering collaborative governance among provinces. In order to effectively meet emissions reduction targets, the mechanism is intended to employ market incentives to encourage high-carbon provinces to decrease emissions and to compensate low-carbon provinces for their reductions. (2) In order to reduce the spatial spread of carbon emissions, it is necessary to raise the environmental protection tax. To guarantee the impact of emissions reduction, it is imperative to enhance the quality and extent of tax collection, establish fair tax rates, and levy items in accordance with each province's economic development and carbon emissions to avoid overtaxing or undertaking. Encouraging the development of green innovation and supporting the production, application, and study of green technology are necessary to improve the spatial spillover effect. (3) The promotion of trans-regional green technology flow and dissemination, as well as the achievement of spatial synergies, can be achieved through increasing R&D expenditure, enhancing R&D efficiency, and developing green technology transfer and sharing mechanisms. (4) We must rely on the development and use of green energy to optimize the energy structure, increase the efficiency of energy usage, and lower the intensity of energy consumption. To maximize the impact of green energy as a demonstration, increase the availability of renewable energy sources, create a transregional energy Internet, and implement efficient energy allocation. (5) Accelerate green transformation and industrial upgrading, create high-tech products and services with significant added value, as well as increasing resource utilization efficiency.
Data availability statement
Publicly available datasets were analyzed in this study. This data can be found at: https://www.ceads.net.cn/.
Author contributions
PG: Conceptualization, Data curation, Formal analysis, Investigation, Methodology, Software, Visualization, Writing – original draft. CQ: Conceptualization, Funding acquisition, Methodology, Project administration, Resources, Supervision, Validation, Writing – review & editing.
Funding
The author(s) declare financial support was received for the research, authorship, and/or publication of this article. This research was funded by National Social Science Fund General Project, grant number: 20BTJ003.
Acknowledgments
We appreciate the support and assistance of Dongbei University of Finance and Economics and Shandong Vocational University of Foreign Affairs. The writer is open to sage advice and deeply appreciative of his mentors for the unwavering support and guidance they have extended. The inspiration and backing from his loved ones and companions have proven to be an indispensable asset.
Conflict of interest
The authors declare that the research was conducted in the absence of any commercial or financial relationships that could be construed as a potential conflict of interest.
Publisher's note
All claims expressed in this article are solely those of the authors and do not necessarily represent those of their affiliated organizations, or those of the publisher, the editors and the reviewers. Any product that may be evaluated in this article, or claim that may be made by its manufacturer, is not guaranteed or endorsed by the publisher.
Footnotes
1. ^Tibet is not included in the statistical analysis due to a lack of data.
2. ^Eastern: Beijing, Tianjin, Hebei, Shanghai, Jiangsu, Zhejiang, Fujian, Shandong, Guangdong, Hainan; Northeast: Liaoning, Jilin, Heilongjiang; Central: Shanxi, Inner Mongolia, Anhui, Jiangxi, Henan, Hubei, Hunan; Western: Guangxi, Chongqing, Sichuan, Guizhou, Yunnan, Shaanxi, Gansu, Qinghai, Ningxia, Xinjiang.
References
Anselin, L. (1988). Spatial Econometrics: Methods and Models. Studies in Operational Regional Science. Dordrecht: Kluwer Academic. doi: 10.1007/978-94-015-7799-1
Anselin, L. (1995). Local indicators of spatial association—LISA. Geogr. Anal. 27, 93–115. doi: 10.1111/j.1538-4632.1995.tb00338.x
Anselin, L., and Kelejian, H. H. (1997). Testing for spatial error autocorrelation in the presence of endogenous regressors. Int. Reg. Sci. Rev. 20, 153–182. doi: 10.1177/016001769702000109
Aravindh, M., Sathish, S., Prabhu, L., Raj, R. R., Bharani, M., Patil, P. P., et al. (2022). Effect of various factors on plant fibre-reinforced composites with nanofillers and its industrial applications: a critical review. J. Nanomater. 2022:4455106. doi: 10.1155/2022/4455106
Bertalanffy, L. V. (1950). An outline of general system theory. Br. J. Philos. Sci. 1, 134–165. doi: 10.1093/bjps/i.2.134
Busch, J., Foxon, T. J., and Taylor, P. G. (2018). Designing industrial strategy for a low carbon transformation. Environ. Innov. Soc. Transit. 29, 114–125. doi: 10.1016/j.eist.2018.07.005
Cao, J., Ho, M., and Liu, Q. (2023). Analyzing multi-greenhouse gas mitigation of China using a general equilibrium model. Environ. Res. Lett. 18:025001. doi: 10.1088/1748-9326/acb0e7
Cezarino, L. O., Rodrigues Alves, M. F., Ferreira Caldana, A. C., and Liboni, L. B. (2019). Dynamic capabilities for sustainability: revealing the systemic key factors. Syst. Pract. Action Res. 32, 93–112. doi: 10.1007/s11213-018-9453-z
Chen, H., Yi, J., Chen, A., Peng, D., and Yang, J. (2023). Green technology innovation and CO2 emission in China: evidence from a spatial-temporal analysis and a nonlinear spatial durbin model. Energy Policy 172:113338. doi: 10.1016/j.enpol.2022.113338
Chen, L., Darko, A., Adegoriola, M. I., Chan, A. P. C., Yang, Y., and Tetteh, M. O. (2024). Challenges to energy retrofitting of existing office buildings in high-rise high-density cities: the case of hong kong. Energy Build. 312:114220. doi: 10.1016/j.enbuild.2024.114220
Cheng, L., Tian, J., Xu, H., and Chen, L. (2023). Unveiling the nexus profile of embodied water–energy–carbon–value flows of the Yellow River Basin in China. Environ. Sci. Technol. 57, 8568–8577. doi: 10.1021/acs.est.3c00418
Copeland, B. R., and Taylor, M. S. (2004). Trade, growth, and the environment. J. Econ. Lite. 42, 7–71. doi: 10.1257/.42.1.7
Costantini, V., Crespi, F., and Palma, A. (2017). Characterizing the policy mix and its impact on eco-innovation: a patent analysis of energy-efficient technologies. Res. Policy 46, 799–819. doi: 10.1016/j.respol.2017.02.004
Cox, T. F., Cliff, A. D., and Ord, J. K. (1984). Spatial processes: models and applications. J. R. Stat. Soc. A 147:515. doi: 10.2307/2981590
Ding, X., Gao, L., Wang, G., and Nie, Y. (2022). Can the development of digital financial inclusion curb carbon emissions? Empirical test from spatial perspective. Front. Environ. Sci. 10:1045878. doi: 10.3389/fenvs.2022.1045878
Du, K., Xie, C., and Ouyang, X. (2017). A comparison of carbon dioxide (CO2) emission trends among provinces in China. Renew. Sust. Energ Rev. 73, 19–25. doi: 10.1016/j.rser.2017.01.102
Duan, Y., Zhang, Z., Li, Y., Wang, S., Yang, C., and Lu, Y. (2024). Global corporate tax competition leads to unintended yet non-negligible climate impacts. Nat. Clim. Change 14, 314–315. doi: 10.1038/s41558-024-01962-y
Durbin, J., and Koopman, S. J. (2012). Time Series Analysis by State Space Methods, 2nd Edn. Oxford Statistical Science Series. doi: 10.1093/acprof:oso/9780199641178.001.0001
Fest, B. J., Swearer, S. E., and Arndt, S. K. (2022). A review of sediment carbon sampling methods in mangroves and their broader impacts on stock estimates for blue carbon ecosystems. Sci. Total Environ. 816:151618. doi: 10.1016/j.scitotenv.2021.151618
Grau, M. V. (2011). Las principales aportaciones a la teoría de la regulación medioambiental. Los últimos cuarenta años. Econ. Agrar. Recur. Nat. 4:41. doi: 10.7201/earn.2004.08.03
Grecu, A. M., and Rotthoff, K. W. (2015). Economic growth and obesity: findings of an obesity kuznets curve. Appl. Econ. Lett. 22, 539–543. doi: 10.1080/13504851.2014.955251
Grossman, G., and Krueger, A. (1991). Environmental Impacts of a North American Free Trade Agreement. Cambridge: NBER. doi: 10.3386/w3914
Grossman, G. M., and Krueger, A. B. (1995). Economic growth and the environment. Q. Econ. 110, 353–377. doi: 10.2307/2118443
Guo, X., Xiao, B., and Song, L. (2019). What cause the decline of energy intensity in China's cities? A comprehensive panel-data analysis. J. Clean Prod. 233, 1298–1313. doi: 10.1016/j.jclepro.2019.06.075
Hodgkinson, J. H., and Smith, M. H. (2021). Climate change and sustainability as drivers for the next mining and metals boom: the need for climate-smart mining and recycling. Resour. Policy 74:101205. doi: 10.1016/j.resourpol.2018.05.016
Horan, W., Shawe, R., and O'Regan, B. (2019). Ireland's transition towards a low carbon society: the leadership role of higher education institutions in solar photovoltaic niche development. Sustainability 11:558. doi: 10.3390/su11030558
Hou, J., Teo, T. S. H., Zhou, F., Lim, M. K., and Chen, H. (2018). Does industrial green transformation successfully facilitate a decrease in carbon intensity in China? An environmental regulation perspective. J. Clean. Prod. 184, 1060–1071. doi: 10.1016/j.jclepro.2018.02.311
IEA (2024). CO2 Emissions in 2023. Paris: International Energy Agency. Available at: https://www.iea.org/reports/co2-emissions-in-2023 (accessed February 26, 2024).
IPCC (2023). Climate change 2023: synthesis report. Environ. Policy Collect. 35115. doi: 10.59327/IPCC/AR6-9789291691647
Kiling, F. S., Shin, S.-J., Lee, M.-K., and Meilanitasari, P. (2021). An energy-related products compliant eco-design method with durability-embedded economic and environmental assessments. Int. J. Precis. Eng. Manuf. Green Technol. 8, 561–581. doi: 10.1007/s40684-020-00213-7
Kirichenko, O. A., and Kustov, L. M. (2024). Recent progress in development of supported palladium catalysts for dehydrogenation of heterocyclic liquid organic hydrogen carriers (LOHC). Int. J. Hydrog. Energy 88, 97–119. doi: 10.1016/j.ijhydene.2024.09.147
Leeuwen, G. V., and Mohnen, P. (2013). Revisiting the porter hypothesis: an empirical analysis of green innovation for the Netherlands. SSRN Electron. J. 67, 295–319. doi: 10.2139/ssrn.2202920
Li, M., Du, W., and Tang, S. (2021). Assessing the impact of environmental regulation and environmental co-governance on pollution transfer: micro-evidence from China. Environ. Impact Assess. Rev. 86:106467. doi: 10.1016/j.eiar.2020.106467
Li, R., and Sun, T. (2020). Research on impact of different environmental regulation tools on energy efficiency in China. Pol. J. Environ. Stud. 29, 4151–4160. doi: 10.15244/pjoes/120520
Li, W., Wang, J., Chen, R., Xi, Y., Liu, S. Q., Wu, F., et al. (2019). Innovation-driven industrial green development: the moderating role of regional factors. J. Clean. Prod. 222, 344–354. doi: 10.1016/j.jclepro.2019.03.027
Li, X., Deng, J., and Liu, J. (2025). Energy-carbon-green certificates management strategy for integrated energy system using carbon-green certificates double-direction interaction. Renew. Energy 238:121937. doi: 10.1016/j.renene.2024.121937
Li, Z., Chen, H., Wang, J., and Zhao, T. (2021). Optimal allocation of CO2 emission quotas at the city level in Bohai Rim Economic Circle based on multi-objective decision approach. doi: 10.21203/rs.3.rs-203519/v1
Li, Z.-Z., Li, Y., Huang, C.-Y., and Peculea, A. D. (2023). Volatility spillover across Chinese carbon markets: evidence from quantile connectedness method. Energy Econ. 119:106542. doi: 10.1016/j.eneco.2023.106542
Liang, J., and Pan, L. (2023). Effect of scale and structure changes of China's high-carbon industries on regional carbon emissions. Energies 16:6676. doi: 10.3390/en16186676
Liao, S., Wang, D., Ren, T., and Liu, X. (2022). Heterogeneity and decomposition analysis of manufacturing carbon dioxide emissions in China's post-industrial innovative Megacity Shenzhen. Int. J. Environ. Res. Public Health 19:15529. doi: 10.3390/ijerph192315529
Lin, B., and Benjamin, N. I. (2017). Influencing factors on carbon emissions in China transport industry. A new evidence from quantile regression analysis. J. Of Clean. Production Prod. 150, 175–187. doi: 10.1016/j.jclepro.2017.02.171
Liu, H., and Dong, X. (2023). Inter-provincial carbon emission transfer paths, spatial and temporal characteristics and influencing factors in china from a value perspective. Res. Sq. 5, 1–18. doi: 10.21203/rs.3.rs-2901341/v1
Liu, Y., Li, L., and Yang, X. (2023). The impact of collaborative agglomeration of manufacturing and producer services on carbon emission intensity: influence mechanism and spatial effect. PLoS ONE 18:e0295948. doi: 10.1371/journal.pone.0295948
Liu, Y., Liu, Y., and Chen, J. (2015). The impact of the Chinese automotive industry: scenarios based on the national environmental goals. J. Clean. Prod. 96, 102–109. doi: 10.1016/j.jclepro.2014.05.015
Lü, Y., Geng, J., and He, G. (2015). Industrial transformation and green production to reduce environmental emissions: taking cement industry as a case. Adv. Clim. Change Res. 6, 202–209. doi: 10.1016/j.accre.2015.10.002
Mao, W., Wang, W., and Sun, H. (2019). Driving patterns of industrial green transformation: a multiple regions case learning from China. Sci. Total Environ. 697:134134. doi: 10.1016/j.scitotenv.2019.134134
Mi, Z., Zhang, Y., Guan, D., Shan, Y., Liu, Z., Cong, R., et al. (2016). Consumption-based emission accounting for Chinese cities. Appl. Energy 184, 1073–1081. doi: 10.1016/j.apenergy.2016.06.094
Mingers, J., and White, L. (2010). A review of the recent contribution of systems thinking to operational research and management science. Eur. J. Oper. Res. 207, 1147–1161. doi: 10.1016/j.ejor.2009.12.019
Moran, P. A. P. (1948). The interpretation of statistical maps. J. R. Stat. Soc. B 10, 243–251. doi: 10.1111/j.2517-6161.1948.tb00012.x
Ord, K. (1975). Estimation methods for models of spatial interaction. J. Am. Stat. Assoc. 70, 120–126. doi: 10.1080/01621459.1975.10480272
Pan, X., and Guo, S. (2024). Decomposition analysis of regional differences in China's carbon emissions based on socio-economic factors. Energy 303:131932. doi: 10.1016/j.energy.2024.131932
Pao, H.-T., and Tsai, C.-M. (2011). Multivariate Granger causality between CO2 emissions, energy consumption, FDI (foreign direct investment) and GDP (gross domestic product): evidence from a panel of BRIC (Brazil, Russian Federation, India, and China) countries. Energy 36, 685–693. doi: 10.1016/j.energy.2010.09.041
Popp, D., and Newell, R. (2012). Where does energy R&D come from? Examining crowding out from energy R&D. Energy Econ. 34, 980–991. doi: 10.1016/j.eneco.2011.07.001
Porter, M. E., and van der Linde, C. (1995). Toward a new conception of the environment-competitiveness relationship. J. Econ. Perspect. 9, 97–118. doi: 10.1257/jep.9.4.97
Qiu, S., Wang, Z., and Liu, S. (2021). The policy outcomes of low-carbon city construction on urban green development: evidence from a quasi-natural experiment conducted in China. Sustain. Cities Soc. 66:102699. doi: 10.1016/j.scs.2020.102699
Rosely, W. I. H. W., and Voulvoulis, N. (2024). System thinking for sustainable water management: the use of system tools in sustainability transitions. Water Resour. Manag. 38, 1315–1337. doi: 10.1007/s11269-023-03723-6
Sarkis, J. (2003). A strategic decision framework for green supply chain management. J. Clean. Prod. 11, 397–409. doi: 10.1016/S0959-6526(02)00062-8
SCPRC (2021). Action Plan for Carbon Dioxide Peaking Before 2030. State Council of the People's Republic of China. Available at: https://english.www.gov.cn/policies/latestreleases/202110/27/content_WS6178a47ec6d0df57f98e3dfb.html (accessed October 26, 2021).
Shan, Y., Guan, D., Zheng, H., Ou, J., Li, Y., Meng, J., et al. (2018). China CO2 emission accounts 1997–2015. Sci. Data 5:201. doi: 10.1038/sdata.2017.201
Shan, Y., Huang, Q., Guan, D., and Hubacek, K. (2020). China CO2 emission accounts 2016-2017. Sci. Data 7:54. doi: 10.1038/s41597-020-0393-y
Shi, Y., and Yang, C. (2022). How does multidimensional R&D investment affect green innovation? Evidence from China. Front. Psychol. 13:947108. doi: 10.3389/fpsyg.2022.947108
Spaiser, V., Scott, K., Owen, A., and Holland, R. (2018). Consumption-based accounting of CO2 emissions in the sustainable development Goals Agenda. Int. J. Sustain. Dev. World Ecol. 26, 282–289. doi: 10.1080/13504509.2018.1559252
Su, X., Qiao, R., and Xu, S. (2024). Impact of green finance on carbon emissions and spatial spillover effects: empirical evidence from China. J. Clean. Prod. 457:142362. doi: 10.1016/j.jclepro.2024.142362
Tan, X., Cheng, S., and Liu, Y. (2024). Green digital finance and technology diffusion. Hum. Soc. Sci. Commun. 11:389. doi: 10.1057/s41599-024-02902-z
Tian, M.-W., Yan, S.-R., and Peng, H. (2017). Research on the differences of ecological efficiency of low-carbon M&A among enterprises under the education of ecological civilization. Eurasia J. Math Sci. T 13, 5233–5245. doi: 10.12973/eurasia.2017.00997a
Tobler, W. R. (1970). A computer movie simulating urban growth in the detroit region. Econ. Geogr. 46:234. doi: 10.2307/143141
Tumelero, C., Sbragia, R., and Evans, S. (2019). Cooperation in R&D and eco-innovations: the role in companies' socioeconomic performance. J. Clean. Prod. 207, 1138–1149. doi: 10.1016/j.jclepro.2018.09.146
UN (2020). The General Debate of the 75th Session of the United Nations General Assembly. The United Nations. Available at: http://english.scio.gov.cn/topnews/2020-09/23/content_76731466.htm (accessed September 23, 2020).
Wang, C., Chen, J., and Zou, J. (2005). Decomposition of energy-related CO2 emission in China: 1957–2000. Energy 30, 73–83. doi: 10.1016/j.energy.2004.04.002
Wang, Q., and Jiang, R. (2019). Is China's economic growth decoupled from carbon emissions? J. Clean. Prod. 225, 1194–1208. doi: 10.1016/j.jclepro.2019.03.301
Wang, R., Deng, X., Gao, Y., and Chen, J. (2025). Does regional economic development drive sustainable grain production growth in China? Evidence from spatiotemporal perspective on low-carbon total factor productivity. Socio-Econ. Plan. Sci. 98:102129. doi: 10.1016/j.seps.2024.102129
Wang, Y. (2023). Influence of industrial transfer on CarbonEmissions in China: a spatial spillover perspective. Pol. J. Environ. Stud. 32, 1849–1865. doi: 10.15244/pjoes/159077
Wang, Z., Carriveau, R., Ting, D. S.-K., Xiong, W., and Wang, Z. (2019). A review of marine renewable energy storage. Int. J. Energy Res. 43, 6108–6150. doi: 10.1002/er.4444
Wei, Z., Li, J., Wang, Z., Zhou, A., and Li, M. (2022). County carbon emissions in the Yangtze River Delta region: spatial layout, dynamic evolution and spatial spillover effects. Front. Environ. Sci. 10:977198. doi: 10.3389/fenvs.2022.977198
Wilberforce, T., Olabi, A. G., Sayed, E. T., Elsaid, K., and Abdelkareem, M. A. (2021). Progress in carbon capture technologies. Sci. Total Environ. 761:143203. doi: 10.1016/j.scitotenv.2020.143203
Wu, L., Sun, L., Qi, P., Ren, X., and Sun, X. (2021). Energy endowment, industrial structure upgrading, and CO2 emissions in China: revisiting resource curse in the context of carbon emissions. Resour Policy 74:102329. doi: 10.1016/j.resourpol.2021.102329
Xie, Y., Zeng, W., and Qiu, J. (2022). Integrated water risk early warning framework of the semi-arid transitional zone based on the water environmental carrying capacity (WECC). J. Arid Land 15, 145–163. doi: 10.1007/s40333-022-0083-z
Yan, Y., Li, J., and Xu, Y. (2021). Research on industry difference and convergence of green innovation efficiency of manufacturing industry in China based on super-SBM and convergence models. Math. Probl. Eng. 2021, 1–12. doi: 10.1155/2021/4013468
Yang, F., and Yang, M. (2015). Analysis on China's eco-innovations: regulation context, intertemporal change and regional differences. Eur. J. Oper. Res. 247, 1003–1012. doi: 10.1016/j.ejor.2015.07.029
Yang, H., and Zhu, X. (2022). Research on green innovation performance of manufacturing industry and its improvement path in China. Sustainability 14:8000. doi: 10.3390/su14138000
Yin, Q., Wang, Y., Xu, Z., Wan, K., and Wang, D. (2022). Factors influencing green transformation efficiency in China's mineral resource-based cities: method analysis based on IPAT-E and PLS-SEM. J. Clean. Prod. 330:129783. doi: 10.1016/j.jclepro.2021.129783
Zeng, J., Costa, R., and Ribeiro-Navarrete, S. (2021). Paradoxical effects of local regulation practices on common resources: evidence from spatial econometrics. Knowl. Manag. Res. Pract. 19, 327–340. doi: 10.1080/14778238.2019.1664272
Zhai, X., and An, Y. (2020). Analyzing influencing factors of green transformation in China's manufacturing industry under environmental regulation: a structural equation model. J. Clean. Prod. 251:119760. doi: 10.1016/j.jclepro.2019.119760
Zhang, C., Zhou, Y., and Li, Z. (2022). Low-carbon innovation, economic growth, and CO2 emissions: evidence from a dynamic spatial panel approach in China. Environ. Sci. Pollut. Res. 30, 25792–25816. doi: 10.1007/s11356-022-23890-0
Zhang, J., Zeng, W., Wang, J., Yang, F., and Jiang, H. (2017). Regional low-carbon economy efficiency in China: analysis based on the super-SBM model with CO2 emissions. J. Clean. Prod. 163, 202–211. doi: 10.1016/j.jclepro.2015.06.111
Zhang, M., Li, B., and Yin, S. (2020). Is technological innovation effective for energy saving and carbon emissions reduction? Evidence from China. IEEE Access 8, 83524–83537. doi: 10.1109/access.2020.2990678
Zhang, M., Yang, S., Wu, M., and Chen, F. (2024). “Research on the drivers of carbon emissions from highway trucks based on pathway analysis,” in International Conference on Smart Transportation and City Engineering (STCE 2023), ed. M. Mikusova (Chongqing: SPIE), 100. doi: 10.1117/12.3024072
Zhang, W., Liu, X., Zhao, S., and Tang, T. (2024). Does green finance agglomeration improve carbon emission performance in China? A perspective of spatial spillover. Appl. Energy 358:122561. doi: 10.1016/j.apenergy.2023.122561
Zhang, X., Xia, P., Peng, F., Xiao, M., Zhao, T., Fu, A., et al. (2024). Multiple spatial-temporal scales assessment of solar and wind resources potential integrating geospatial-technology-correlation indicators: a case study of hunan province. Energy 304:132036. doi: 10.1016/j.energy.2024.132036
Zhang, X., and Xu, F. (2023). Environmental regulation and spatial spillover effect of green technology innovation: an empirical study on the spatial durbin model. Sustainability 15:14133. doi: 10.3390/su151914133
Zhao, B., Sun, L., and Qin, L. (2022). Optimization of China's provincial carbon emission transfer structure under the dual constraints of economic development and emission reduction goals. Environ. Sci. Pollut. Res. 29, 50335–50351. doi: 10.1007/s11356-022-19288-7
Zhao, H., and Percival, R. (2017). Comparative environmental federalism: subsidiarity and central regulation in the united states and China. TEL 6, 531–549. doi: 10.1017/S2047102517000206
Zhao, X., Ding, X., and Li, L. (2021). Research on environmental regulation, technological innovation and green transformation of manufacturing industry in the yangtze river economic belt. Sustainability 13:10005. doi: 10.3390/su131810005
Zhao, Y. (2024). Carbon emission reduction effects of heterogeneous environmental regulation: evidence from the firm level. Ecol. Chem. Eng. S 31, 243–252. doi: 10.2478/eces-2024-0017
Zheng, D., and Shi, M. (2017). Multiple environmental policies and pollution haven hypothesis: evidence from China's polluting industries. J. Clean. Prod. 141, 295–304. doi: 10.1016/j.jclepro.2016.09.091
Zhou, H., Qu, S., Wu, Z., and Ji, Y. (2020a). A study of environmental regulation, technological innovation, and energy consumption in China based on spatial econometric models and panel threshold models. Environ. Sci. Pollut. Res. 27, 37894–37910. doi: 10.1007/s11356-020-09793-y
Zhou, H., Qu, S., Yang, X., and Yuan, Q. (2020b). Regional credit, technological innovation, and economic growth in China: a spatial panel analysis. Discrete Dyn. Nat. Soc. 2020, 1–14. doi: 10.1155/2020/1738279
Zhou, S., Li, W., Lu, Z., and Lu, Z. (2022). A technical framework for integrating carbon emission peaking factors into the industrial green transformation planning of a city cluster in China. J. Clean. Prod. 344:131091. doi: 10.1016/j.jclepro.2022.131091
Zhou, Z., Wu, W., Wang, X., Chen, Q., and Wang, O. (2009). Analysis of changes in the structure of rural household energy consumption in northern China: a case study. Renew. Sust. Energ. Rev. 13, 187–193. doi: 10.1016/j.rser.2007.05.006
Zhu, Y., Liang, D., and Liu, T. (2020). Can China's underdeveloped regions catch up with green economy? A convergence analysis from the perspective of environmental total factor productivity. J. Clean Prod. 255:120216. doi: 10.1016/j.jclepro.2020.120216
Keywords: carbon emissions, green transformation, systems thinking, dynamic spatial, Durbin model
Citation: Gao P and Qu C (2025) Assessing the impact of green transformation on carbon emissions: a dynamic spatial Durbin model. Front. Environ. Econ. 4:1478861. doi: 10.3389/frevc.2025.1478861
Received: 13 August 2024; Accepted: 10 January 2025;
Published: 05 February 2025.
Edited by:
Florian Nuţǎ, Danubius International University, RomaniaReviewed by:
Yanfang Zhang, Nanjing University of Aeronautics and Astronautics, ChinaQinfeng Zhao, The University of Kitakyushu, Japan
Copyright © 2025 Gao and Qu. This is an open-access article distributed under the terms of the Creative Commons Attribution License (CC BY). The use, distribution or reproduction in other forums is permitted, provided the original author(s) and the copyright owner(s) are credited and that the original publication in this journal is cited, in accordance with accepted academic practice. No use, distribution or reproduction is permitted which does not comply with these terms.
*Correspondence: Chao Qu, TXVZdW5GYW4yMDIwQG91dGxvb2suY29t