 Qiang Wu1
 Jiong Yan
95% of researchers rate our articles as excellent or good
Learn more about the work of our research integrity team to safeguard the quality of each article we publish.
Find out more
BRIEF RESEARCH REPORT article
Front. Energy Res. , 17 March 2025
Sec. Sustainable Energy Systems
Volume 13 - 2025 | https://doi.org/10.3389/fenrg.2025.1561763
This article is part of the Research Topic Advanced Data-Driven Uncertainty Optimization for Planning, Operation, and Analysis of Renewable Power Systems View all 16 articles
This paper proposes an investment efficiency-oriented strategy for power grid infrastructure planning with high penetration of renewable energy sources. First, a multi-objective investment portfolio optimization model based on data envelopment analysis is proposed to improve the cost efficiency of power grid infrastructure planning. Then, an evolutionary algorithm based on super-efficiency hyperplane projection transformation is developed to obtain the optimal Pareto frontier of the multi-objective investment portfolio. Furthermore, a super-efficiency envelope model with non-radial relaxation variables is formulated to identify an optimal investment efficiency-oriented solution from the Pareto frontier set. Comparative case studies have been implemented to demonstrate the superior performance of the proposed strategy for investment efficiency enhancement of power grid infrastructure planning.
Modern power grids are gradually being dominated by various renewable energy sources due to global low-carbon and environmental concerns (Yi et al., 2023). The integration of renewable energy into the grid will bring about an increase in the cost of various infrastructure investment categories because of its intermittent, volatile, and regional characteristics (Guo et al., 2023; Saxena and Shankar, 2024; Fu et al., 2022; Sha et al., 2023). Faced with mounting operational expenses and constrained investment capacities, power grids must devise portfolio optimization strategies to minimize costs while maximizing investment returns (Lu et al., 2022). The investment portfolio in power grid infrastructure is a dynamic, sequentially coupled, multi-objective discrete combinatorial optimization problem (Liu et al., 2023). Traditional infrastructure investment portfolio decisions that focus on maximizing a single benefit objective are inadequate for meeting the demands of high-quality development in power grids (Yan et al., 2022; Garifi et al., 2022; Ma et al., 2020; Guelpa et al., 2019). Therefore, this study provides practical models and algorithms for grid infrastructure investment planning oriented to maximize investment efficiency.
The main contributions of this work can be twofold, as follows: (1) a multi-objective cost efficiency-oriented investment portfolio optimization model based on data envelopment analysis is proposed for power grid infrastructure planning, and a transformation matrix based on the LASSO regression model is established with the goal of reducing the complexity of the portfolio optimization, representing the relationship between the amount of investment and benefits. (2) An evolutionary algorithm based on super-efficiency hyperplane projection transformation is developed to obtain the optimal Pareto frontier of the multi-objective investment portfolio, and a super-efficiency envelope model with non-radial relaxation variables is formulated to identify the optimal investment efficiency-oriented solution from the Pareto frontier set.
With the increase in investment demand and the concurrent decrease in investment capacity, it has become crucial for grid operators to prioritize investment efficiency when developing annual investment plans (Wu et al., 2022). Thus, it is necessary to establish a multi-objective cost efficiency-oriented investment portfolio optimization model that considers constraints such as investment capacity, power supply reliability (Cao et al., 2024a), energy conservation, and emission reduction. An investment efficiency-oriented model is formulated based on data envelopment analysis (DEA) by mapping power grid investment portfolios to efficiency indicators (Lee and Chen, 2024; Xu et al., 2024). Then, three investment efficiency objective functions are formulated through this approach: safety investment efficiency, economic investment efficiency, and green investment efficiency of power grid infrastructure investment, as outlined in Equation 1:
where
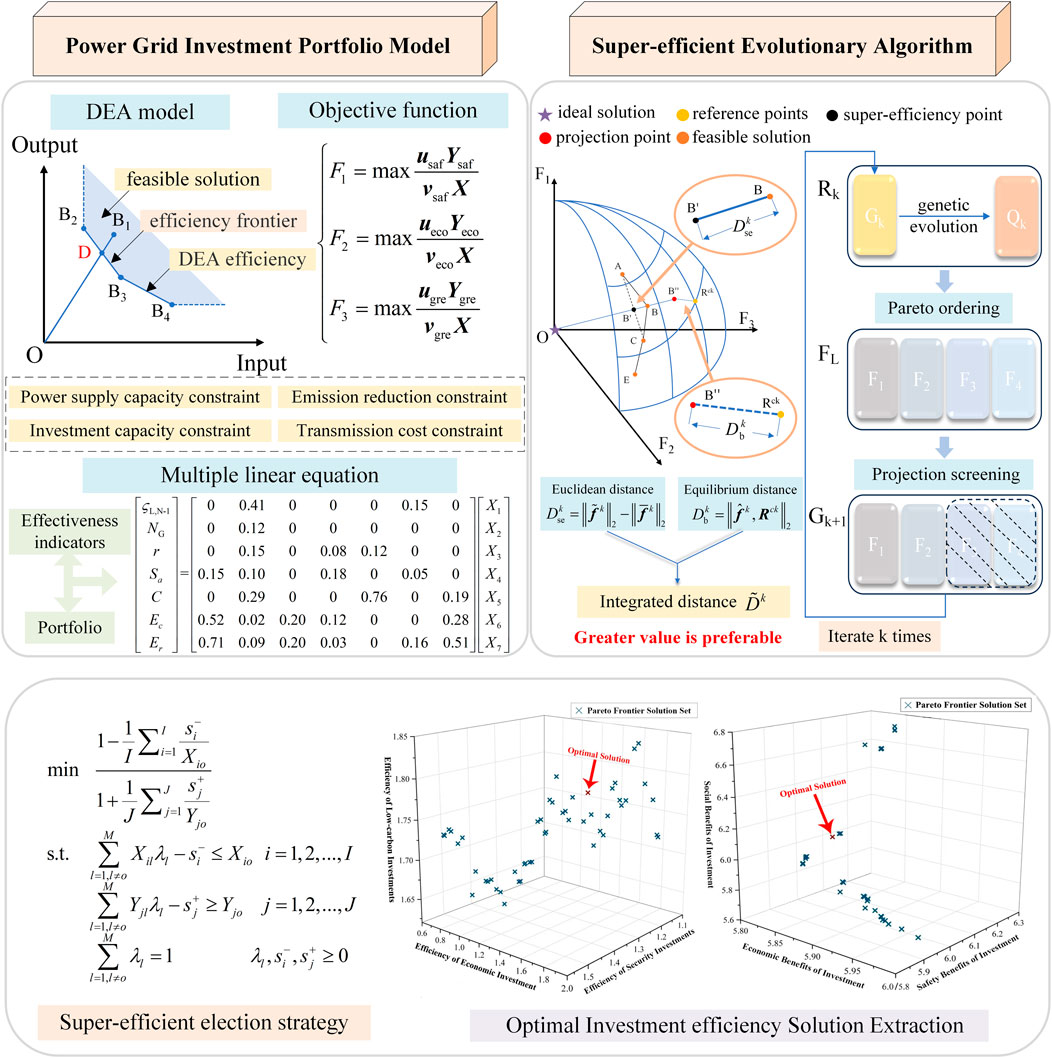
Figure 1. Multi-objective cost efficiency-oriented investment portfolio optimization model.
Several constraints have been introduced into the model to ensure that investments in grid infrastructure are rationalized (Yang et al., 2024). Constraint (2) stipulates that the total investment across all infrastructure drivers should not exceed the maximum investment capacity of the grid. The N-1 line passing rate
where
An evolutionary algorithm based on super-efficient hyperplane projection transformation (EASEHPT) is proposed to optimize multiple objectives within the model. The proposed algorithm is based on the principle of the NSGA-III algorithm (Deb and Jain, 2014), which selects sub-generation grid portfolio populations by calculating the integrated distance of non-dominated portfolio populations. Then, the grid portfolio populations are sorted according to the integrated distance, and populations that perform better in the same class will be retained. The optimal solution is selected from the Pareto efficiency frontier set of the multi-objective infrastructure portfolio through the super-efficiency selection strategy. The multi-objective evolutionary algorithm is shown in Figure 1.
This study compares all portfolio individuals in a new population with a size of 2M after the genetic evolution operation, according to three optimization objectives,
where
where
In this paper, the integrated distance is introduced to evaluate the super-efficiency and equilibrium performance of solutions. Assuming that the coordinates
where
In this paper, a super-efficient envelope model with non-radial relaxation variables is introduced to select the optimal solution from the Pareto efficient frontier set of the multi-objective infrastructure investment portfolio. In this model, the relaxation variable is used to measure the deviation between the solution and the hyper-efficiency plane. Specifically,
where I denotes the total number of infrastructure portfolio categories in the population individuals; J denotes the total number of investment effectiveness indicators in the population individuals;
Let
Through the above processing, the fractional planning problem is transformed into a general linear planning problem so as to obtain the optimal solution of the Pareto frontier solution.
To validate the proposed model, taking a provincial power grid in central China as an example, three comparison schemes are established: scheme 1 uses the method proposed in this paper to select the optimal investment portfolio. Based on scheme 1, scheme 2 changes the super-efficiency selection strategy into a fuzzy multi-attribute decision-making method to obtain the optimal investment portfolio. Scheme 3 uses the NSGA-III algorithm for multi-objective optimization and combines the fuzzy multi-attribute decision-making method to select the optimal investment portfolio (Yu et al., 2019; Wang et al., 2024; Hussain et al., 2024). The parameter settings of the multi-objective cost efficiency-oriented investment portfolio optimization model are shown in Table 1. Power grid investment portfolios under different schemes are shown in Figure 2. The comparative results under different schemes are shown in Table 2.
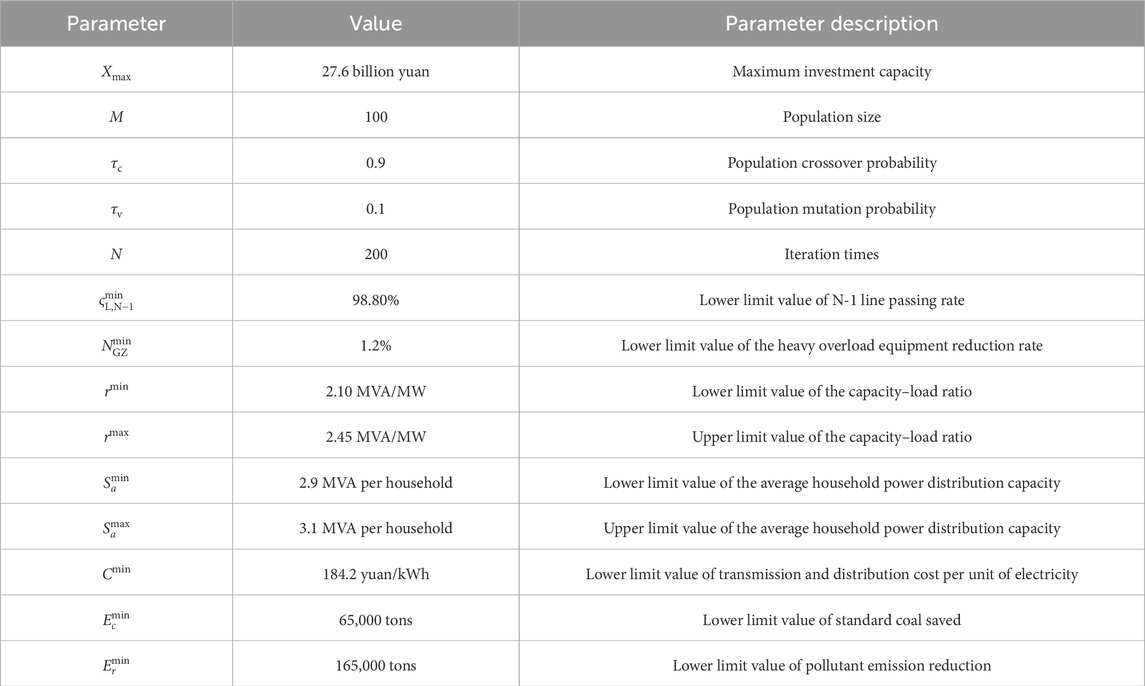
Table 1. Parameter settings of the investment portfolio optimization model.
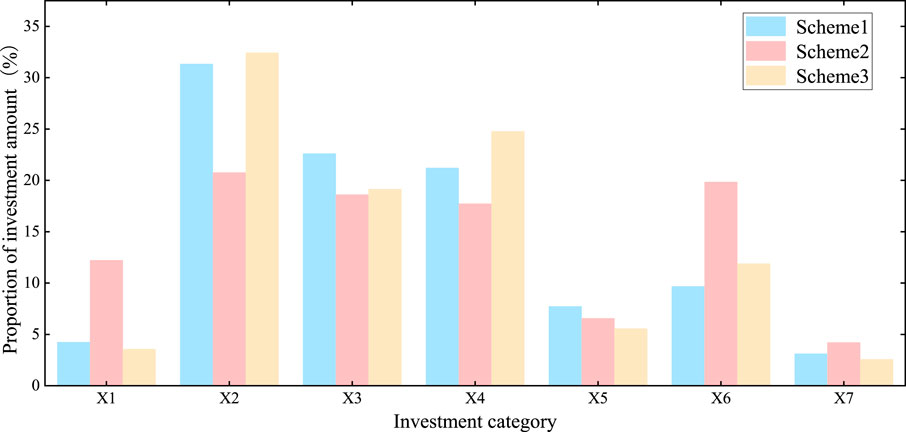
Figure 2. Power grid investment portfolios under different schemes.
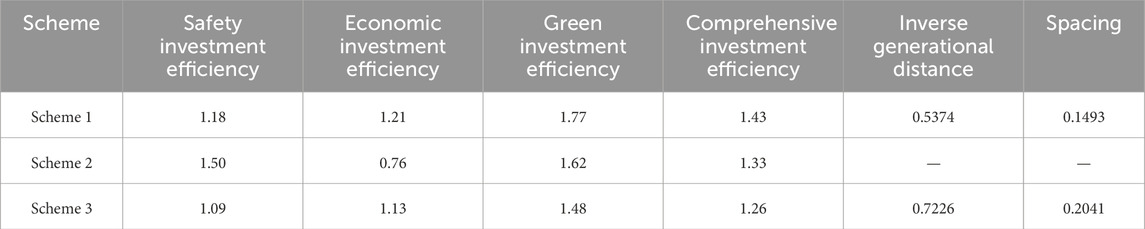
Table 2. Investment efficiency and convergence effect of the solution set under different schemes.
The proposed scheme prioritizes power infrastructure investments on the transmission capacity and flexibility capability enhancements. It can be seen from Figure 2 that the investment portfolio obtained from scheme 2 prioritizes optimizing the grid structure, and the investment portfolio obtained from scheme 3 prioritizes enhancing the transmission capacity and meeting the growing load. It can be found from the analytical results that scheme 1 demonstrates superior performance on the comprehensive investment efficiency while maintaining the balanced performance in all efficiency indicators. Compared to scheme 3, the lower inverse generational distance and spacing in scheme 1 indicate that the solution set is close to the ideal Pareto front and has a better distribution of solutions. This is because the proposed algorithm employs a super-efficiency DEA model to rank these population individuals through equilibrium distances so that the better individuals can be selected from the non-dominated population individuals. Additionally, the algorithm utilizes a super-efficiency envelopment model to extract optimal solutions from the Pareto frontier set. As a result, the power grid investment portfolio achieves higher comprehensive efficiency while maintaining the balanced performance in all efficiency indicators.
The power grid investment portfolio obtained from scheme 2 demonstrates a stronger emphasis on safety investment efficiency while exhibiting notably lower economic investment efficiency and inferior comprehensive investment efficiency compared to those of scheme 1. These results stem from the decision making of scheme 2 to improve safety benefits for the goal of protecting people’s livelihood and policies, and it easily leads to the lack of investment in enhancing economic benefits, resulting in the reduction in the comprehensive investment efficiency of power grids. Although scheme 3 shows relatively balanced performance in all indicators, all its investment efficiency indicators are lower than those of scheme 1. Moreover, the inverse generational distance and spacing of scheme 3 are significantly higher than those of scheme 1, indicating that its solution set is far away from the ideal Pareto frontier set.
In this paper, an investment efficiency-oriented strategy is proposed to improve the overall investment efficiency for power grid infrastructure planning with high penetration of renewable energy sources. The following are the key findings of this study: 1) the proposed investment portfolio model prioritizes enhancing the transmission capacity and flexibility capability of power grids with proportions of 31.35% and 22.62%, respectively, and thus, the system investment efficiency can be enhanced with renewable energy accommodation enhancement. 2) The proposed EASEHPT algorithm can improve the overall investment efficiency by 11.9% compared to traditional methods, and the obtained Pareto front solution set of the multi-objective investment portfolio exhibits both diversity and optimality.
The original contributions presented in the study are included in the article/supplementary material; further inquiries can be directed to the corresponding author.
QW: writing–original draft and writing–review and editing. MZ: conceptualization, data curation, and writing–review and editing. JY: writing–original draft and writing–review and editing. ZS: visualization and writing–review and editing. SW: formal analysis and writing–review and editing.
The author(s) declare that financial support was received for the research, authorship, and/or publication of this article. This work was supported by the State Grid Science and Technology Project (No. 5100-202456030A-1-1-ZN).
Authors QW and MZ were employed by State Grid Hubei Electric Power Company Limited. Authors JY, ZS, and SW were employed by State Grid Hubei Electric Power Company Limited Economic and Technical Research Institute.
The author(s) declare that no generative AI was used in the creation of this manuscript.
All claims expressed in this article are solely those of the authors and do not necessarily represent those of their affiliated organizations, or those of the publisher, the editors and the reviewers. Any product that may be evaluated in this article, or claim that may be made by its manufacturer, is not guaranteed or endorsed by the publisher.
Cao, Y., Zhou, B., Chung, C. Y., Wu, T., Zheng, L., and Shuai, Z. (2024b). A coordinated emergency response scheme for electricity and watershed networks considering spatio-temporal heterogeneity and volatility of rainstorm disasters. IEEE Trans. Smart Grid 15, 3528–3541. doi:10.1109/TSG.2024.3362344
Cao, Y., Zhou, B., Chung, C. Y., Zhou, K., Zhu, L., and Shuai, Z. (2024a). Resilience-oriented coordinated topology reconfiguration of electricity and drainage networks with distributed mobile emergency resources. IEEE Trans. Smart Grid 16, 786–800. doi:10.1109/TSG.2024.3419086
Chen, C., Liu, H., Tang, L., and Ren, J. (2021). A range adjusted measure of super-efficiency in integer-valued data envelopment analysis with undesirable outputs. J. Syst. Sci. Inf. 9, 378–398. doi:10.21078/JSSI-2021-378-21
Chen, Y., Li, J., Sheng, K., Yang, T., Xu, X., Han, Z., et al. (2020). Many-criteria evaluation of infrastructure investment priorities for distribution network planning. IEEE Access 8, 221111–221118. doi:10.1109/ACCESS.2020.3043248
Deb, K., and Jain, H. (2014). An evolutionary many-objective optimization algorithm using reference-point-based nondominated sorting approach, Part I: solving problems with box constraints. IEEE Trans. Evol. Comput. 18, 577–601. doi:10.1109/TEVC.2013.2281535
Deng, Z., and Wang, J. (2020). Multi-sensor data fusion based on improved analytic Hierarchy process. IEEE Access 8, 9875–9895. doi:10.1109/ACCESS.2020.2964729
Fu, X., Wu, X., Zhang, C., Fan, S., and Liu, N. (2022). Planning of distributed renewable energy systems under uncertainty based on statistical machine learning. Prot. Control Mod. Power Syst. 7, 41. doi:10.1186/s41601-022-00262-x
Garifi, K., Johnson, E. S., Arguello, B., and Pierre, B. J. (2022). Transmission grid resiliency investment optimization model with SOCP recovery planning. IEEE Trans. Power Syst., 1. doi:10.1109/PESGM48719.2022.9916881
Guelpa, E., Bischi, A., Verda, V., Chertkov, M., and Lund, H. (2019). Towards future infrastructures for sustainable multi-energy systems: a review. Energy 184, 2–21. doi:10.1016/j.energy.2019.05.057
Guo, M., Ren, M., Chen, J., Cheng, L., and Yang, Z. (2023). Tracking photovoltaic power output schedule of the energy storage system based on reinforcement learning. Energies 16, 5840. doi:10.3390/en16155840
Hussain, A., Ullah, K., Garg, H., and Mahmood, T. (2024). A novel multi-attribute decision-making approach based on T-spherical fuzzy Aczel Alsina Heronian mean operators. Granul. Comput. 9, 21. doi:10.1007/s41066-023-00442-6
Lee, C. Y., and Chen, Y. W. (2024). Reinforcement learning with data envelopment analysis and conditional value-at-risk for the capacity expansion problem. IEEE Trans. Eng. Manag. 71, 6469–6480. doi:10.1109/TEM.2023.3264566
Li, Q., Li, B., Jiang, Q., Liu, T., Yue, Y., and Zhang, Y. (2024). A novel location method for interline power flow controllers based on entropy theory. Prot. Control Mod. Power Syst. 9, 70–81. doi:10.23919/PCMP.2023.000504
Liu, C., Li, X., Liang, J., Sheng, K., Kong, L., Peng, X., et al. (2023). A multistep iterative ranking learning method for optimal project portfolio planning of smart grid. Int. Trans. Electr. Energy Syst. 2023, 1–10. doi:10.1155/2023/1358099
Lu, S., Yan, J., Zhang, Y., Qi, L., Wang, S., Wu, Q., et al. (2022). A R-GCN-based correlation characteristics extraction method for power grid infrastructure planning and analysis. Front. Energy Res. 10. doi:10.3389/fenrg.2022.888161
Ma, Y., Han, R., and Wang, W. (2020). Prediction-based portfolio optimization models using deep neural networks. IEEE Access 8, 115393–115405. doi:10.1109/ACCESS.2020.3003819
Qin, T., Liu, M., Ji, S., and Cai, D. (2024). Parameter weight analysis of synchronous induction electromagnetic coil launch system based on the entropy weight method. IEEE Trans. Plasma Sci. 52, 1865–1873. doi:10.1109/TPS.2024.3395284
Saxena, A., and Shankar, R. (2024). An interactive operating demand response approach for hybrid power systems integrating renewable energy sources. Prot. Control Mod. Power Syst. 9, 174–194. doi:10.23919/PCMP.2023.000282
Sha, J., Liu, Y., Sheng, K., Zhang, L., Jiang, T., Tan, M., et al. (2023). Opinions on power grid infrastructure investments for renewable energy accommodation in China. Front. Energy Res. 11. doi:10.3389/fenrg.2023.1221841
Tibshirani, R. (2011). Regression shrinkage and selection via the lasso: a retrospective. J. R. Stat. Soc. 73, 273–282. doi:10.1111/j.1467-9868.2011.00771.x
Wang, D., Li, Z., Dey, N., Ashour, A. S., Sherratt, R. S., and Shi, F. (2017). Case-based reasoning for product style construction and fuzzy analytic Hierarchy process evaluation modeling using consumers linguistic variables. IEEE Access 5, 4900–4912. doi:10.1109/ACCESS.2017.2677950
Wang, D., Zhang, C., Li, J., Zhu, L., Zhou, B., Zhou, Q., et al. (2024). A novel interval power flow method based on hybrid box-ellipsoid uncertain sets. IEEE Trans. Power Syst. 39, 6111–6114. doi:10.1109/TPWRS.2024.3391921
Wu, Y., Li, X., Zhang, L., Liu, C., Zhao, W., and Zhang, T. (2022). Machine learning–driven deduction prediction methodology for power grid infrastructure investment and planning. Front. Energy Res. 10. doi:10.3389/fenrg.2022.893492
Xu, L., Shen, C., Chen, J., Pan, X., and Xiao, G. (2024). Efficiency evaluation and improvement pathway of sulfur-oxide emissions in European ports based on Context-dependent SBM-DEA model. Mar. Pollut. Bull. 208, 117002. doi:10.1016/J.MARPOLBUL.2024.117002
Yan, J., Lu, S., Wang, S., Wu, A., Sang, Z., Huang, J., et al. (2022). A multi-level investment allocation indicator system for distribution network planning. Front. Energy Res. 10. doi:10.3389/fenrg.2022.889325
Yang, T., Cao, B., and Wang, C. (2024). Joint generation and voyage scheduling of all-electric ships considering power supply capacity constraints. IEEE Trans. Appl. Supercond. 34, 1–4. doi:10.1109/TASC.2024.3456556
Yi, Y., Zhao, H., Zeng, Y., Chen, F., Yang, D., Wang, B., et al. (2023). Accommodation capacity evaluation of renewable energy in power systems considering peak and frequency regulation. Front. Energy Res. 10. doi:10.3389/fenrg.2022.1067884
Keywords: cost efficiency, investment portfolio, power grid planning, renewable energy, multi-objective optimization
Citation: Wu Q, Zhou M, Yan J, Sang Z and Wang S (2025) A survey on investment efficiency-oriented power grid infrastructure planning. Front. Energy Res. 13:1561763. doi: 10.3389/fenrg.2025.1561763
Received: 16 January 2025; Accepted: 17 February 2025;
Published: 17 March 2025.
Edited by:
Zhenjia Lin, Hong Kong Polytechnic University, Hong Kong SAR, ChinaCopyright © 2025 Wu, Zhou, Yan, Sang and Wang. This is an open-access article distributed under the terms of the Creative Commons Attribution License (CC BY). The use, distribution or reproduction in other forums is permitted, provided the original author(s) and the copyright owner(s) are credited and that the original publication in this journal is cited, in accordance with accepted academic practice. No use, distribution or reproduction is permitted which does not comply with these terms.
*Correspondence: Jiong Yan, eWFuamlvbmc3MTcyQHZpcC5zaW5hLmNvbQ==
Disclaimer: All claims expressed in this article are solely those of the authors and do not necessarily represent those of their affiliated organizations, or those of the publisher, the editors and the reviewers. Any product that may be evaluated in this article or claim that may be made by its manufacturer is not guaranteed or endorsed by the publisher.
Research integrity at Frontiers
Learn more about the work of our research integrity team to safeguard the quality of each article we publish.