 Chao Yan1
 Ting Yang
94% of researchers rate our articles as excellent or good
Learn more about the work of our research integrity team to safeguard the quality of each article we publish.
Find out more
ORIGINAL RESEARCH article
Front. Energy Res. , 13 March 2025
Sec. Smart Grids
Volume 13 - 2025 | https://doi.org/10.3389/fenrg.2025.1502652
This article is part of the Research Topic Advancements in Power System Condition Monitoring, Fault Diagnosis and Environmental Compatibility View all 15 articles
Introduction: With the advancement of power electronic devices toward intelligent high-frequency operation and the widespread integration of distributed renewable energy sources, electrical power quality issues, particularly those arising from superharmonics, are becoming increasingly significant. The non-stationary and wide-frequency characteristics of superharmonic signals pose significant challenges for effective monitoring. Traditional static time-window-based methods struggle to accurately sample these non-smooth signals, leading to reconstruction errors and inefficiencies. Therefore, this study proposes a novel supraharmonics monitoring approach based on the VSSESP-DBP dynamic compressed sensing algorithm to enhance monitoring accuracy and efficiency.
Methods: To address the limitations of static time-window-based sampling, a dynamic time window with flexible modulation of window width is introduced. This modulation is achieved through a scale stretch factor, reducing reconstruction error. The study leverages the sparsity of superharmonic signals within the time window and proves the applicability of compressed sensing theory for dynamic compressive sampling. At the reconstruction end, the VSSESP-DBP dynamic reconstruction algorithm is designed. The variable step-size sparsity self-estimating subspace tracking (VSSESP) algorithm is employed to find the initial solution, while the dynamic basis tracking (DBP) algorithm exploits the time dependence of the signal support set. By using the solution from the previous moment as a priori information, the proposed method enhances reconstruction speed and efficiency.
Results: Experimental results demonstrate that the proposed method enables dynamic monitoring and reconstruction of superharmonics with reduced sampling data. The introduction of dynamic time windows significantly improves reconstruction accuracy compared to traditional methods. Furthermore, the VSSESP-DBP algorithm exhibits superior computational efficiency and real-time performance, effectively addressing the limitations of conventional approaches in continuous signal reconstruction.
Discussion: The proposed approach successfully mitigates challenges associated with non-stationary and wide-frequency superharmonic signal monitoring. The combination of dynamic time-window sampling and VSSESP-DBP-based reconstruction enhances both accuracy and computational efficiency. These findings highlight the potential of the method for real-time power quality monitoring applications. Future research could focus on optimizing algorithm parameters for different grid conditions and extending the approach to broader power quality disturbances.
The impact of superharmonics (usually referring to harmonic components with frequencies higher than 2 kHz) on new power systems is becoming increasingly significant, mainly in terms of power quality, equipment operation, communication systems, protection and control, etc. Given the introduction of dual carbon goals, the adoption of new clean energy sources like wind power and photovoltaics is steadily increasing each year (Yang et al., 2022). As efforts to optimize energy infrastructure intensify, a notable consequence is the substantial increase in harmonic content within the distribution network. In renewable energy systems, the problem of superharmonics is particularly prominent, and its main source is the widespread use of power electronic equipment (such as inverters). While these devices realize energy conversion and control, the switching frequency is increased from the original several thousand hertz to hundreds of kilohertz or even higher, and the harmonics they generate are gradually transferred from low frequency bands to high frequency bands, thus increasing the complexity of system integration and the difficulty of management (Leroi et al., 2017; Darmawardana, 2020). Superharmonics can cause distortion of voltage and current waveforms, which not only reduces equipment operating efficiency and accelerates aging, but may even cause overheating and damage. In addition, it may interfere with power line communications, affect the stable operation of smart grids, and cause malfunctions of protection devices, threatening the reliability of the system. With the development of modern power systems, superharmonic distortion problems are becoming increasingly serious and showing a high-frequency trend. Especially after the access of distributed power sources, superharmonics enter the power grid through the grid connection point, propagate between different devices, cause high-frequency mutual interference, make power quality issues more complicated, and bring new challenges to system operation (Barkas et al., 2024; Wang et al., 2019a). In this paper, the above mentioned ultra-high harmonics with frequencies ranging from 2 to 150 kHz are defined as “superharmonics”. In order to effectively grasp its propagation characteristics and further study effective suppression methods, accurate detection of superharmonics is essential.
Many scholars have conducted research on the problem of superharmonics. The literature (Espín-Delgado et al., 2021) proposed methods and formulas for evaluating the impact of superharmonics on audible noise, cable terminal faults, RCD malfunctions and light flicker interference. The literature (Barkas et al., 2022) designed and tested a superharmonic monitoring system based on a field programmable gate array (FPGA) that can measure currents up to 150 kHz. International IEC committee members have proposed various methods in the field of superharmonic monitoring: 1) IEC 61000-4-7 (Wang et al., 2019b) proposes full sampling of superharmonic signals through a 200 ms rectangular window. However, effective monitoring of superharmonics necessitates a sampling frequency (fs) that adheres to Nyquist’s theorem, requiring it to be at least twice the highest frequency component of the signal which significantly increases the data volume needed for sampling, processing, and analysis of superharmonics in the hundreds of kilohertz range, posing substantial challenges for on-site implementation. It is difficult for monitoring instruments to have sufficient storage space and computing power, so implementation is difficult. 2) In IEC 61000-4-30 (Ángela and Ronnberg, 2019), the IEC standard group proposed to select 32 small data windows of 0.5 ms at equal intervals within the range of 200 ms for sampling in response to the problem of large amounts of global sampling data for superharmonics. This method reduces the amount of sampling data to a certain extent, but the window is too narrow, resulting in low signal resolution, and only 8% of the data is easily missed or misdetected. Therefore, there is an urgent need to develop new methods in the field of superharmonic monitoring. The literature (Khokhlov et al., 2020) studied the measurement methods in the 2–150 kHz frequency band under the above standard framework by using synthetic signals and actual measurement signals, and found that all methods had difficulties in processing signals with changing frequency and/or amplitude. Since the frequency range of ultra-high harmonics is 2–150 kHz, based on Nyquist’s law, its detection method requires a sampling frequency of at least 300 kHz. Although modern hardware devices can theoretically support this sampling frequency, UHH monitoring faces multiple challenges in practical applications. Firstly, multi-node monitoring of distributed energy systems requires multi-channel synchronous sampling, which leads to a significant increase in data volume; secondly, real-time requirements place higher demands on data processing capabilities and algorithmic efficiency; in addition, long-term storage and transmission of massive monitoring data also poses a serious challenge to equipment storage and network bandwidth. With the further expansion of the scale of distributed energy resources, higher sampling frequency and stronger computing power may be required in the future, which puts forward higher requirements on the performance and economy of hardware devices. Therefore, there is an urgent need to develop new methods in the field of superharmonic monitoring to reduce its impact on the reliability and equipment life of modern power systems (Rajkumar et al., 2024).
Compressed sensing, as a new signal acquisition method, can break through the Nyquist theory. For signals that are sparse in themselves or in a certain transform domain, the measurement matrix can be used to perform low-dimensional projection of high-density data and perform compressed sampling (Candes et al., 2006; Donoho, 2006), which provides a new idea for superharmonic signal monitoring. Due to the high-frequency data dimension characteristics in superharmonic analysis, combined with the unique low data volume characteristics of compressed sensing technology, it has broad application prospects in the field of superharmonic monitoring. Many scholars are committed to exploring the application of compressed sensing technology in the field of superharmonic monitoring. The literature (Mishra et al., 2018) proposed a harmonic analysis framework based on compressed sensing, which successfully realized the accurate detection of high-frequency harmonic components in the power system. Literature (Yang et al., 2016) proposes a harmonic detection method based on compressed sensing, which successfully reconstructs the original signal with a lower measurement value, and mathematically proves the feasibility of compressed sensing technology in the field of harmonic monitoring, but does not involve high-order harmonics. The literature (Palczynska et al., 2020) proposed a compressed sensing technology based on discrete Radon transform to effectively monitor the harmonic signals of ship power grids. Its data processing algorithm is simple, and the burden of memory usage and data processing load is low; the literature (Carta et al., 2021) proposed a harmonic source identification scheme based on compressed sensing (CS), which reduces the measurement error of harmonic estimation through quadratic constraints. The literature (Li et al., 2020) further optimized the compressed sensing algorithm so that it can maintain high reconstruction accuracy in complex noisy environments. However, none of the above literatures involve ultra-high harmonics, and do not consider the impact of spectrum leakage on algorithm reconstruction. In view of the wide-band characteristics of superharmonics, literature (Mendes et al., 2019) proposes to use analog filter banks to segment superharmonic frequencies to improve signal frequency resolution, but at the same time increases the requirements for analog components. Literature (Zhuang et al., 2019) introduces interpolation factors based on compressed sensing technology to improve the frequency resolution of superharmonic signals, but the signal reconstruction uses the traditional orthogonal matching pursuit algorithm, which does not consider the limitation of unknown signal sparsity. In addition, some scholars have proposed superharmonic multi-vector measurement algorithms based on the block Bayesian compressed sensing model (Mendes et al., 2020), but they do not consider the non-stationary characteristics of superharmonics and cannot meet the dynamic monitoring requirements. To mitigate spectral leakage in superharmonic signal acquisition, window functions can be applied to enhance the accuracy of spectral analysis. However, traditional windowing methods use a fixed window width, which struggles to adapt to the fluctuating characteristics of superharmonic signals, thereby affecting the accuracy of signal monitoring (Zhong et al., 2024). Moreover, in terms of signal reconstruction, studies (Yin et al., 2024; Amaya and Inga, 2022) have proposed reconstruction methods based on transmission line signals and power signals. However, these methods fail to fully consider the correlation between signals at different time instants during the reconstruction process, leading to low reconstruction efficiency and difficulty in meeting real-time requirements. In complex power systems, the non-stationarity and randomness of signals further increase the difficulty of reconstruction, limiting their practical engineering applications. Therefore, designing a method that can effectively suppress spectral leakage, adapt to signal fluctuations, and improve reconstruction efficiency remains a key research challenge.
In summary, in the field of superharmonic monitoring, if the traditional Nyquist sampling theorem is still used, the sudden increase in the amount of sampled data and the problem of data storage compression will inevitably occur, therefore, the compressed sensing technique, with its low-dimensional projection advantage of high-density data, has a broad application prospect in the field of superharmonic monitoring; moreover, how to realize the rapid reconstruction of data and improve the reconstruction accuracy of data for sampled superharmonic data is also a key issue that needs to be solved. In addition, how to realize fast reconstruction and improve the reconstruction accuracy of the sampled superharmonic data is also a key issue that needs to be solved urgently. At present, few studies have been conducted to improve the compressed sensing on the sampling and reconstruction sides with respect to the two major characteristics of superharmonics, namely, wide bandwidth and nonsmoothness. Therefore, in this paper, from the above difficulties, we carry out research on superharmonic signals, establish a framework for superharmonic monitoring based on dynamic sampling and compressed sensing, and propose a new method for dynamic low-speed sampling and accurate reconstruction of superharmonic signals. The primary innovations are outlined as follows:
1) Aiming at the wide-frequency domain and non-stationary characteristics of superharmonics, the traditional static sampling and fixed-window-width sampling are unable to capture the rapid time-frequency changes of superharmonics, and a flexible time-window-based dynamic sampling method is proposed, which controls the window’s sliding in the time axis through the displacement factor and introduces the scale expansion factor to adjust the window width in time according to the dynamic characteristics of superharmonics and realizes the feedback-type flexible modulation on the width of the window.
2) Based on the signal sparsity, a superharmonic signal monitoring model based on compressed sensing is established, and the superharmonic dynamic monitoring model is constructed by introducing the compressed sensing technique, the frequency domain sparsity of the superharmonic signals in the flexible time window is mathematically deduced and proved and the superharmonic short-time Fourier transform (STFT) sparsity basis is given.
3) A dynamic reconstruction algorithm of VSSESP-DBP is proposed for the characteristics of superharmonic signals, in which the sparsity of superharmonic signals is predicted by the variable step-size sparsity self-estimating subspace tracking algorithm (VSSESP), and then the initial solution of the reconstruction is obtained, and in order to reduce the redundancy of successive reconstruction calculations, the dynamic basis tracking (DBP) algorithm is further proposed, in which the support set of the solution in the previous moment is taken as the a priori information of the signal recovery in the current moment. The support set of the previous moment solution is used as the a priori information of the current moment signal recovery, which improves the accuracy and speed of the signal reconstruction.
The sparse signal α is subjected to a measurement matrix Φ∈RM×N that satisfies the restricted isometry property (RIP), so that the procedure involves projecting high-density data into a low-dimensional space. This process involves the application of signal compression during sampling, followed by the reconstruction of the original signal through the use of an optimization algorithm. This entire process is commonly referred to as compressed sensing (Donoho, 2006).
The transformation process of the superharmonic signal x under the sparse basis can be expressed as:
where x∈RN×1 represents the superharmonic signal, Ψ∈RN×N represents a kind of basis function, and Φ∈RM×N represents an observation matrix that is uncorrelated with the basis functions Ψ. x = Ψα represents the sparse transformation of the superharmonic time domain signal x through a specific sparse basis Ψ, this is because the superharmonic signal is a superposition of different cosine signals in the time domain. Plus, it does not have sparsity. When only k elements (k << N) in the transformed signal α are nonzero or large, the signal α is k sparse. A = ΦΨ represents the sensing matrix, A ∈RM×N.
According to Equation 1, the compressed signal y∈RM×1 can be obtained. The dimension of the measured data M is much smaller than the original signal dimension N (M << N), thus realizing the dimensionality reduction compression sampling of the signal x. The compressed sensing framework is shown in Figure 1.
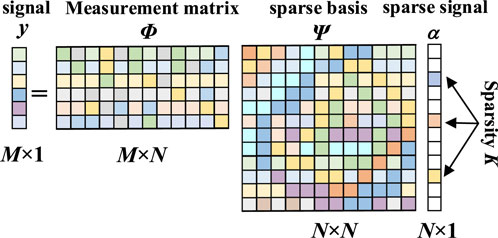
Figure 1. The compressed sensing framework.
The compressed signal y contains enough information about the original signal x. The original signal is restored by inverse transformation of the Equation 1. However, the formula is an ill-posed equation and has infinite solutions. Therefore, the original signal can be solved using an optimization problem in the sense of the l0 norm, as shown as Equation 2.
In conclusion, within the framework of compressed sensing, three crucial steps are identified: sparse transformation, the construction of a measurement matrix, and the design of the recovery algorithm.
A superharmonic dynamic monitoring framework is proposed as shown in Figure 2. On the sampling node, to overcome the limitations of traditional static sampling, which hinders the monitoring of the non-stationary characteristics of superharmonics, dynamic compressed sampling is employed. This approach utilizes a feedback-based flexible time window applied to the superharmonics, in conjunction with sparse transformation. The compressed measurement data is then transmitted to the reconstruction node with rich computing resources. On the reconstruction node, the VSSESP-DBP algorithm is designed to quickly reconstruct the signal.
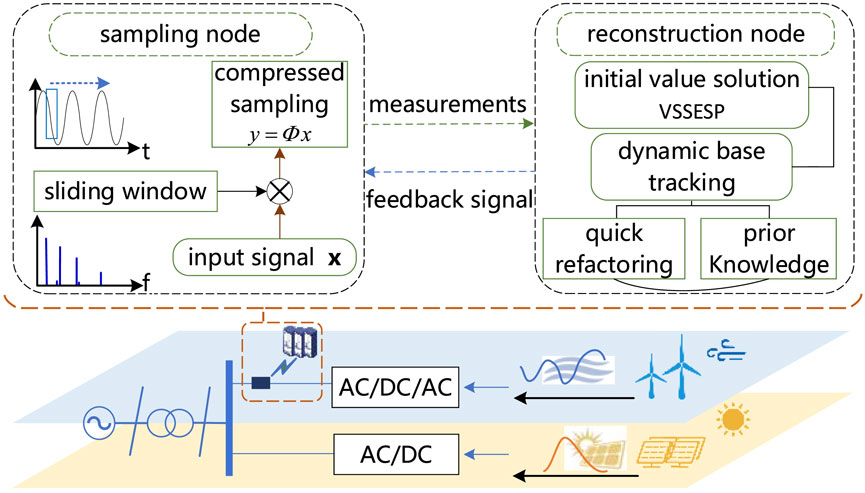
Figure 2. Dynamic monitoring framework of supra harmonics.
With the increasing number of nonlinear devices in power systems, superharmonics often have significant dynamic characteristics (Michalec et al., 2023; Ritzmann et al., 2021), such as superposition, resonance, etc. Thus the traditional static monitoring or fixed window width methods cannot capture the rapid changes of superharmonics over time. The dynamic response speed remains fixed and cannot adapt to the temporal fluctuations of the signal, resulting in disadvantages such as excessive monitoring errors. Therefore, this paper applies a window cut function to the signal, controls its sliding sampling on the time axis, and introduces a scale expansion factor λ to flexibly modulate the window function W(t) to extract the local characteristics of the signal. In order to suppress spectrum leakage, the Gaussian window function W(t) with excellent local properties is selected as the time window. According to Equation 3, the Gaussian window function is expressed as:
Then the flexible time window function Wλ(t) is expressed as Equation 4:
Where τ represents the displacement factor, which is used to control the sliding position of the window on the time axis.
Let σt be the effective window radius of W(t), for a certain Gaussian window function, σt is a constant value. Added that σt is shown as Equation 5.
Therefore, the effective window radius of Wλ(t) can be expressed as 2λσt. Let D be the time window width, then D = 2λσt and the parameter λ plays an adjusting role in the window width D.
In distributed energy grid-connected systems, superharmonic emission is related to the power electronic switching frequency, circuit topology, PWM modulation method, etc (Daubechies, 1990). The corresponding frequency fsh can be expressed as Equation 6:
where fsh represents the switching frequency, f0 represents the fundamental frequency, a* fs represents the switching frequency integer multiples of super harmonics, b* f0 represents the secondary sideband superharmonic, a,b = 0,1,2, … ,h. Therefore, the spectrogram of the superharmonic frequency component fsh exhibits double-peak characteristics, with f0 as the interval. Therefore, in order to effectively monitor superharmonic signals, the frequency interval (resolution) after the discrete Fourier transform must satisfy kanaly ≤ f0. Let fs be the sampling frequency, N be the length of the sampling sequence, and Ts be the sampling time interval, then the kanaly is shown as Equation 7:
The time window width D = TsN, combining Equation (8), we can get the time window width D ≥ 1/f0. At the same time, according to the IEC 61000-4-7 standard, the 2–150 kHz superharmonic sampling time width is a rectangular window of 10 power frequency cycles. Taking into account the accuracy and real-time requirements of superharmonic monitoring, the window width is constrained to D ≤ 10 (1/f0). Therefore, the value range of the scale expansion factor λ is:
The neighborhood reconstructed error (NRE) obtained by comparing the superharmonic adjacent time window reconstructed signals is expressed as Equation 9:
where h is the h-th frame time window (h = 1,2,3, … ,N), xh-1 and xh represent the superharmonic signals of the h-1 and h-th frame time windows respectively, ||·||2 is the L2 norm of the vector.
Compare NRE with the preset deviation Threshold to obtain the feedback signal, and then adjust the scale expansion factor λ to achieve feedback-type flexible modulation of the window width. For example: when the signal fluctuates violently, the reconstruction deviation of adjacent time windows increases, that is, when NRE > Threshold occurs, the feedback signal γ < 1 is output, and the sampling end adjusts λ to reduce the sliding window time width to γ·D to improve dynamic response speed to superharmonic signals. On the contrary, if the feedback signal γ > 1, the sampling end adjusts λ to increase the sliding window time width to γ·D and improve the frequency resolution.
Superharmonic signals are different from low-order harmonics in that they have stronger volatility (Sefl and Prochazka, 2022; Mariscotti, 2021), and high frequencies are prone to oscillation, attenuation, and other phenomena (Sandrolini and Mariscotti, 2020; Alfieri et al., 2017). Therefore, the superharmonic current signal is expressed as Equation 10:
where ash represents the amplitude of the superharmonic, ksh represents the frequency of the superharmonic, θsh represents the phase of the superharmonic, βsh represents the attenuation factor, and e(t) represents the noise signal.
The signal within time t is divided into {t0, 2t0, … , nt0} by adding windows, where t0 is approximately an instantaneous time period, and t0<<t. In actual information systems, all types of sampling signals are processed in discrete form, taking the sh-th superharmonic in time t0, the sampling interval is Ts, the signal discrete form xsh[n] and its discrete Fourier transforms Xsh[k] are shown in Equations 11, 12, respectively.
where k represents the signal index in the frequency domain,
After applying a flexible time window to the finite-length signal xsh [n]∈RN×1, its Fourier transform W [k] can be expressed as Equation 13:
where
The windowed Fourier transform of the signal is mathematically equivalent to first multiplying the time-domain signal xsh [n] by the window function Wλ[n], followed by performing the Fourier transform on the resulting product. According to the corresponding relationship between signal time and frequency domain (Roberts and Mulis, 1987), it is further equivalent to the convolution operation of frequency domain signals Xsh [k] and Wλ[k]. When any function is convolved with the impulse function δ(k), the function will move to the position where the δ(k) impulse occurs, that is shown as Equation 15:
where Fsh is the spectrum peak of the sh-th superharmonic signal,
According to the properties of the impulse function δ(k): when k = ±ksh, the signal exists, and when k≠±ksh, the signal is zero. Therefore, the continuous superharmonic signal in the time domain can be converted into the frequency domain signal W with sparsity K, and the set of superharmonic W is expressed as Equation 16:
Therefore, the superharmonic signal in the flexible time window has sparsity under the WTFT basis, and the sparse transformation expression is shown in Equation 17:
The specific expansion form is shown in Equation 18:
where W[k] represents the superharmonic sparse signal after WTFT basis transformation, k = 0,1,2, … N-1,
The dynamic sparse transformation of the superharmonic signal is shown in Figure 3.
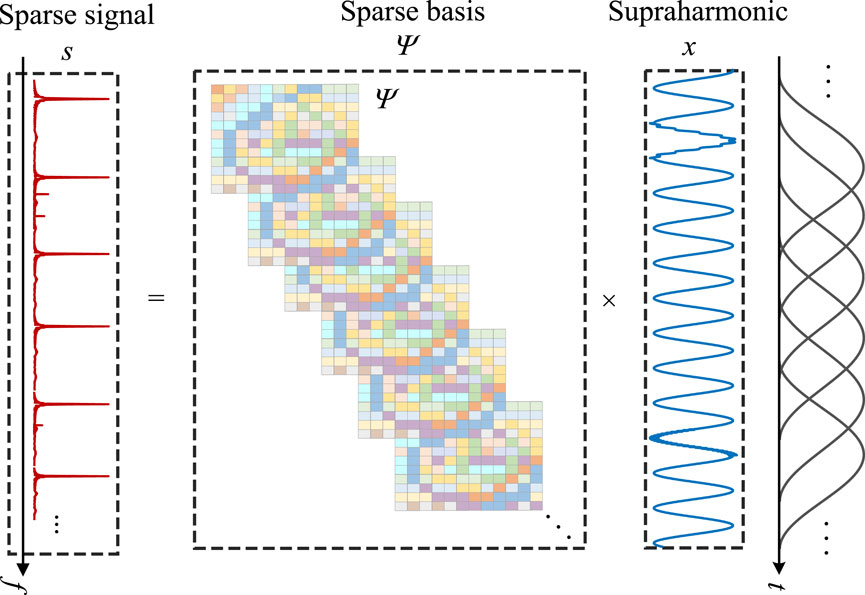
Figure 3. The dynamic sparse transformation of the superharmonic signal.
Accurate signal reconstruction relies on a crucial step: the creation of a measurement matrix. Frequently employed standard measurement matrices encompass the Gaussian random matrix, Bernoulli matrix, sparse random matrix, and others, all designed to adhere to the finite isometric property (Salari et al., 2018). Nevertheless, Gaussian random matrices, Bernoulli matrices, and similar options are dense measurement matrices, and generating their elements is a complex and challenging task, especially when implementing them with hardware. From an engineering applicability perspective, this study employs a binary sparse random matrix as the measurement matrix, consisting solely of elements with values of 0 or 1. An M × N dimensional binary sparse random matrix is 1 (p<<1) only in pM positions, and the rest are 0. This switching value of 0 and 1 is conducive to hardware implementation, such as through analog signal conversion technology, 0/1 two-potential transformation rectangular wave is implemented using switching tubes, as shown in Figure 4. The hardware implementation structure is simple, the error rate is low, and it is suitable for engineering implementation.
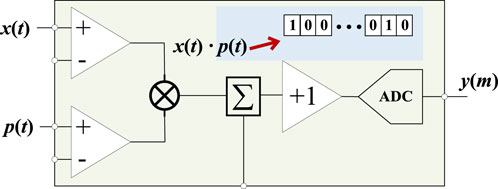
Figure 4. Measurement matrix sampling node.
The significant dynamic characteristics of superharmonics not only cause difficulties at the sampling node but also present continuous recovery problems at the reconstruction node. To overcome this problem, this paper designs the VSSESP-DBP dynamic reconstruction algorithm. First, the VSSESP is used to obtain the initial reconstruction solution. In order to reduce the redundancy of continuous reconstruction calculations, the proposed dynamic basis pursuit (DBP) algorithm is further used. The support set of the time solution serves as prior information for signal recovery at the current time, accelerating reconstruction. At the same time, the reconstruction error only exists within the variation range of the support set, and the reconstruction accuracy is improved.
In the field of signal reconstruction, the Subspace Pursuit (SP) algorithm is widely utilized due to its benefits, such as high robustness and low computational complexity. However, a drawback of the SP algorithm is its requirement to ascertain the sparsity of the signal beforehand, a challenging task in practical engineering where the true sparsity is often unknown. Therefore, this paper presents a innovative approach aimed at resolving the issues of over-estimation and under-estimation arising from the unknown superharmonic sparsity during the initial deconstruction phase.
Under conditions of blind sparsity, the VSSESP algorithm adopts an adaptive sparsity strategy by initially employing a larger step size ρ during the early iteration stages. This approach enables rapid detection of the true sparsity of superharmonic signals, significantly reducing iteration time. As the iteration progresses, the step size ρ gradually decreases, thereby enhancing reconstruction accuracy and preventing issues of sparse overestimation. This method ensures reconstruction accuracy while quickly estimating sparsity. According to the characteristics of the step size growth rate being fast first and then slowing down, the power function form g(μ) = 0.5μ(μ = 1,2,3, … ) is selected for step size adjustment. When μ becomes large enough, the step size becomes 1. The length of the support set is expanded in the form of L = L+1 and finally approaches the true sparsity.
To ensure accurate estimation of blind sparsity, the VSSESP algorithm employs a dual-threshold criterion: the step size adjustment condition is the residual threshold ε1, the iteration termination condition is the residual threshold ε2, and ε2<< ε1. When ||rk||2 ≤ ε1, the step size changes; when ||rk||2 ≤ ε2, the iteration stops. The specific algorithm flow is shown in Figure 5.
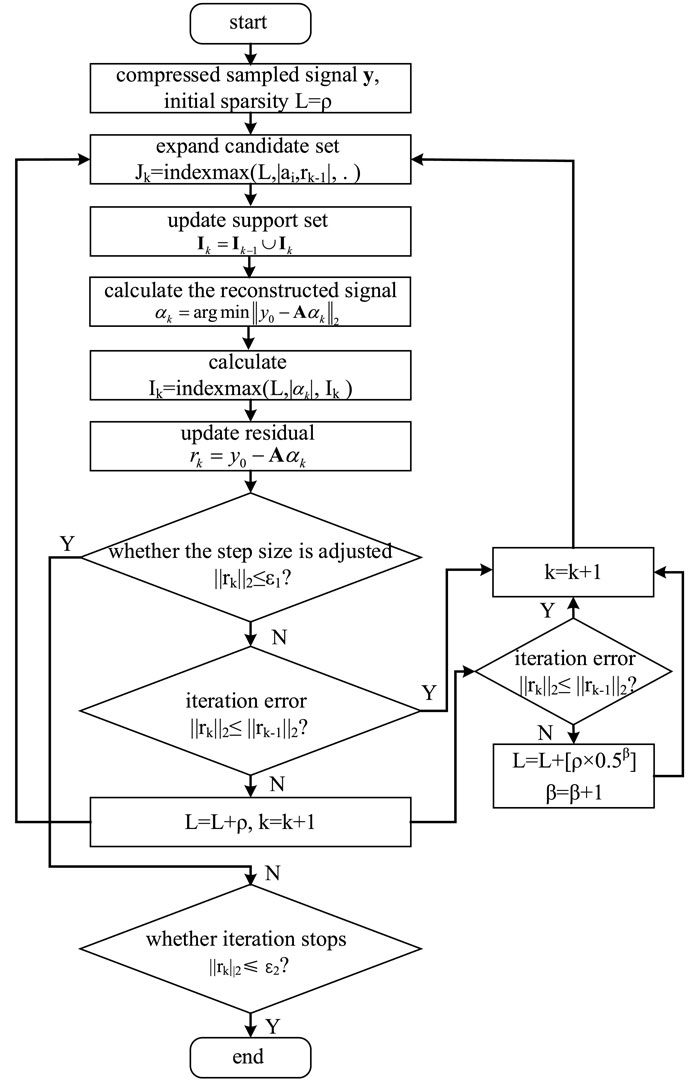
Figure 5. VSSESP algorithm.
As superharmonic signals are continuously compressed and sampled, the signal reconstruction end also needs to be continuously restored based on the initial solution.
According to Equation 19, the measurement signal yt is obtained by superharmonic dynamic compression sampling:
where yt = [y0, y1, … ,yt-1]T, et is the measurement error,
From the analysis in Sections 3.2, it can be seen that
If it is reconstructed independently after each sampling, it will bring serious computational redundancy. In practice, the superharmonic signal support sets at adjacent time instants exhibit strong temporal correlation, with signal overlap occurring within the sliding time window. Therefore, This paper introduces a Dynamic Basis Tracking Reconstruction (DBP) method. The DBP algorithm leverages the support set solution It-1 from the initial solution (last moment) as prior knowledge, facilitating the update of the current moment’s solution It with reduced computational effort. It∩It-1≠ø, and It-1 is known, so the support set It at the current moment is obtained by the union of the support set It-1 at the previous moment and the minimum increment Δmin of the support set, that is shown in Equation 21:
where the minimum increment Δmin of the support set is indexed in the complement of It-1.
Therefore, the expression of using the DBP algorithm to solve the sparsest solution of the superharmonic signal at the current moment is expressed as Equation 22:
where the solution set index range of
To sum up, the dynamic base tracking reconstruction algorithm flow is shown in Figure 6.
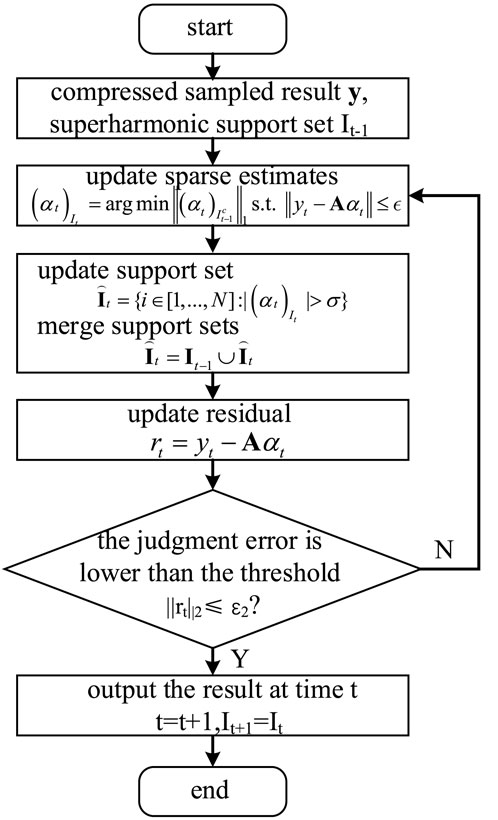
Figure 6. DBP algorithm.
To evaluate the monitoring effectiveness of the method proposed in this paper for superharmonic signals, simulation verification is conducted using superharmonic signals generated by a wind power grid-connected system, with a direct-drive permanent magnet synchronous wind turbine unit connected to the grid via a back-to-back IGBT converter as an example. The inverter is controlled through space vector pulse width modulation (SVPWM), and the 1070 V DC power output by the machine-side converter is converted into 690 V power frequency AC power, which is then connected to the grid to the system side. Its working principle is as follows as shown in Figure 7.
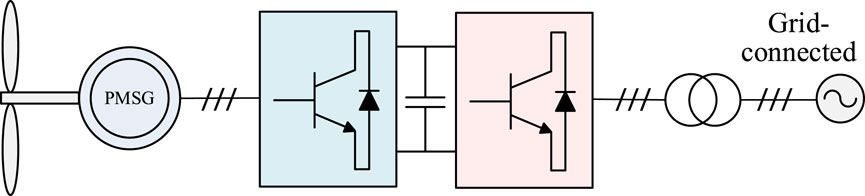
Figure 7. Working principle of wind power grid.
One of the sources of superharmonics is the high-frequency switching of power electronic devices. Configure the SVPWM to regulate the switching frequency of the IGBT at 10 kHz. Then, acquire peak current data from the point of common coupling (PCC), specifically near the switching frequency and its harmonics. The components of superharmonics are shown in Table 1.
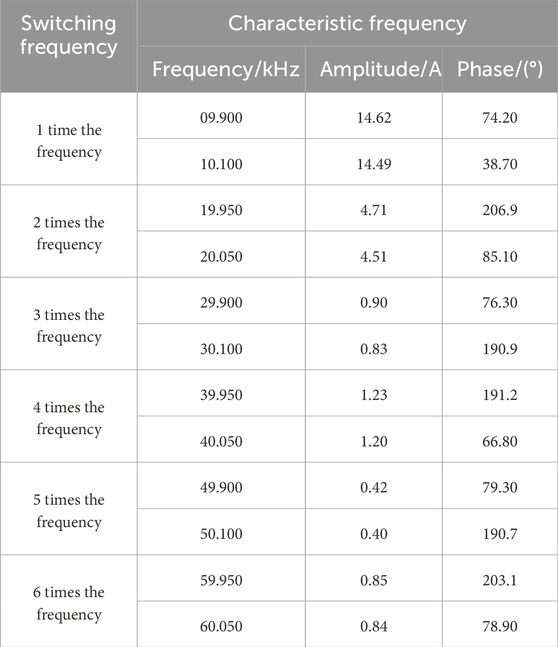
Table 1. Components of supraharmonics.
From the analysis in Table 1, it can be seen that the superharmonic frequency band mainly appears near integer multiples of the switching frequency, which is closely related to the on-off characteristics of IGBT, and is easily affected by changes in PWM modulation methods, load switching, etc., showing time-varying characteristics. In order to test the dynamic recovery effect of the reconstruction algorithm proposed in this article, the time period during which each superharmonic component appears was simulated in the experiment according to the timing sequence in Table 2, and the attenuation factor was set.
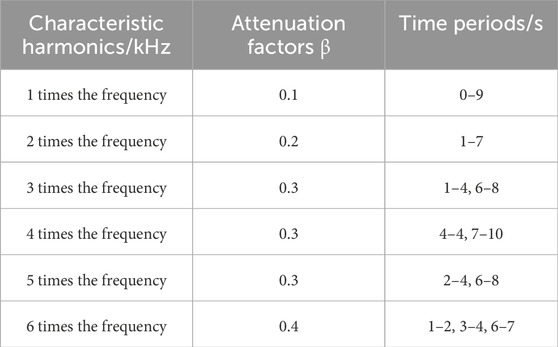
Table 2. Superharmonic components in each period.
This article selects CR (compression ratio), MSE (mean square error) and SNR (signal-to-noise ratio) as evaluation indicators to quantitatively evaluate the reconstruction accuracy of superharmonics by different methods (Shi et al., 2014).
1) The compression ratio CR is expressed as the compression sampling ratio of the number of compressed measurements M to the original signal length N, shown in Equation 23. A lower compression ratio means that the amount of data after compression is greatly reduced, the compression effect is better, the data transmission speed is faster, and the storage cost is lower.
where M represents the compression measurement number M, N represents the original signal length N.
2) The mean square error MSE reflects the relative mean square error between the original signal X(i) and the reconstructed signal x(i) to quantify the gap between the model prediction value and the actual value. Added that MSE is expressed as Equation 24.
where X(i) represents original signal, x(i) represents reconstruction signal.
3) The signal-to-noise ratio SNR reflects the reconstruction quality of the superharmonic signal, as shown in Equation 25. The higher the SNR of the reconstructed signal, the better the algorithm filters the superharmonic signal noise.
In order to test the dynamic monitoring effect of the feedback-type flexible time window proposed in this article, a fixed time window length and a feedback time window were set as a control experiment. In accordance with the IEC-61000-4-7 standard, and considering factors such as mode resolution, dynamic response speed, and computational cost in superharmonic monitoring, the maximum width of a single sampling time window is set to 10 power frequency cycles, equivalent to 200 ms. At the same time, it can be seen from Table 3 that in order to accurately identify the different frequencies of the superharmonic signal, its frequency must be able to resolve at least 50 Hz, and the corresponding sampling time window length is 20 ms. In addition, a fixed length of 300 ms time window is added. Therefore, the dynamic monitoring effect of the fixed time window length of 20, 200, 300 ms and the flexible time window with feedback mechanism (initial time window length of 200 ms) was tested at the same time.
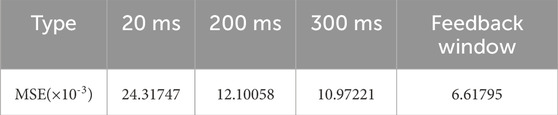
Table 3. Monitoring mean square error in different time windows.
The original sampling frequency is set to 128 kHz, the signal compression ratio is 0.2, the window overlap ratio is 0.5, and the noise interference and communication band interference in the actual working conditions are considered. Gaussian white noise is superimposed on the measurement noise, and the signal-to-noise ratio is 10 dB. For intuitive comparison, the error value is set to be output every 200 ms, and the average error of different time window monitoring after 50 repeated tests is recorded, as shown in the Figure 8.
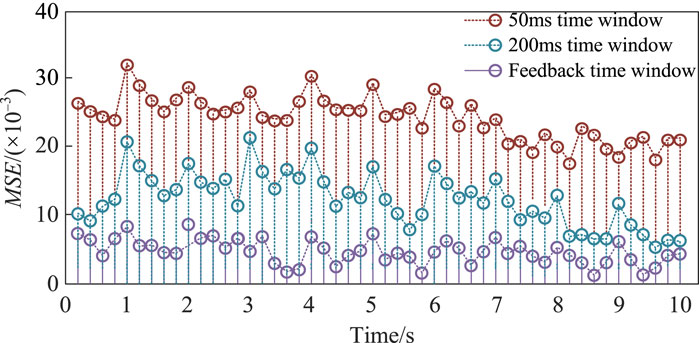
Figure 8. Recovery square error of different windows.
From the analysis of Figure 8, it can be seen that the monitoring error is generally large when using a fixed-length 50 ms time window. This is because the theoretical resolution of the 50 ms time window is 50 Hz, and the actual frequency resolution is higher than the theoretical value, resulting in inaccurate frequency identification and poor monitoring effect. The overall mean square error MSE of the 200 ms time window is relatively lower than that of the 20 ms time window. However, there is a sharp increase in error at the signal transition point, which is caused by the slow dynamic response speed caused by the large time window length. The feedback-type flexible time window proposed can flexibly adjust the time window length according to the feedback signal. The average monitoring error is only 6.62 × 10⁻³, which is completely lower than the fixed-length time window monitoring error, and there is no sharp increase in error. While taking into account the frequency resolution, it has a good dynamic response speed.
To test the performance of the proposed VSSESP-DBP dynamic reconstruction algorithm, we compare it with the SP compressed sensing reconstruction algorithm (Dai and Milenkovic, 2009), the SAMP compressed sensing reconstruction algorithm (Qiu S et al., 2017), and the BCS compressed sensing reconstruction algorithm (Wang et al., 2022) to achieve simultaneous reconstruction of superharmonic signals in different scenarios. Specifically, the SP method uses sparse representation for compressed signal recovery, SAMP uses signal adaptive matching pursuit method for compressed signal reconstruction, and BCS applies Bayesian compressed sensing to improve the reconstruction accuracy in noisy environments. This comparison aims to evaluate the reconstruction accuracy and robustness of the VSSESP-DBP algorithm with other harmonic compression and detection algorithms. Set the window sliding overlap ratio to 0.2, the initial iteration step size s = 10, establish the step size adjustment convergence threshold as ε1 = 10–2, define the iteration termination convergence threshold as ε2 = 10–6, and set the signal-to-noise ratio to 10 dB. Gradually decrease the compression ratio in steps of 0.1, ranging from 0.9 to 0.1. Record the monitoring errors of various algorithms after conducting 20 repeated tests. The reconstruction outcomes under different compression ratios are depicted in Figure 9.
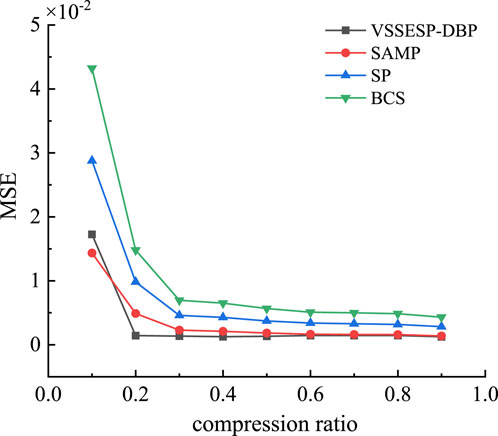
Figure 9. Algorithm reconstruction results under different compression ratios.
From the analysis of the experimental data in Figure 9, it can be seen that the reconstruction mean square error (MSE) of the proposed VSSESP-DBP algorithm is reduced by about 8.81%, 55.96%, and 71.18% for the low compression ratio of 0.9 compared to SAMP, SP, and BCS, respectively. The MSEs are also reduced by 70.72%, 85.42%, and 90.33% for high compression ratios of 0.2, respectively. The stability of the reconstruction algorithm is further analyzed, i.e., the variation of signal reconstruction error with compression ratio. As shown in Figure 9, with the compression ratio M/N decreasing from 0.9 to 0.2, the signal reconstruction errors of the SAMP, SP, and BCS algorithms significantly increased by 72.12%, 71.26%, and 70.87%, respectively, whereas the error of the VSSESP-DBP algorithm proposed in this paper remained basically stable, with an increase of only 13.17%. This reflects the stability of the reconstruction algorithm proposed in this paper. This is because the compared methods use static monitoring or give fixed window width, while the superharmonic signals often show some degree of local changes in different time domains, the same time window length is easy to ignore the characteristics of the signals in different time periods, and its monitoring effect can not reach the optimum, resulting in excessive monitoring error. The flexible time window proposed in this paper can track the monitoring error of dynamic signals through the feedback mechanism in time and adaptively adjust the window width, which effectively reduces the reconstruction error, and can effectively improve the accuracy of signal reconstruction under different compression ratio scenarios.
Comparing the reconstruction SNR of the VSSESP-DBP algorithm proposed in this paper with other algorithms, as shown in Figure 10, the SNR value of the proposed algorithm is significantly higher than the other algorithms. For example, in the case of a high compression ratio (M/N = 0.2), the SNR values of the SAMP, BCS, and SP algorithms are 95.02 dB, 48.61 dB, and 64.81 dB. The reconstruction SNR of the proposed algorithm can still be maintained at 97.207 dB, which is improved by 2.30%, 99.98%, and 49.99% compared to the previous algorithms. This is because this paper adopts the dynamic basis tracking (DBP) algorithm, which reconstructs the signal of the next moment by using the support set of the previous moment as the a priori knowledge, and effectively captures the continuity characteristics of the superharmonic signals in both time and frequency domains, which makes full use of the correlation of the adjacent moments of the superharmonics, whereas the compared methods result in the loss of information due to the neglect of the temporal correlation between before and after the signals.
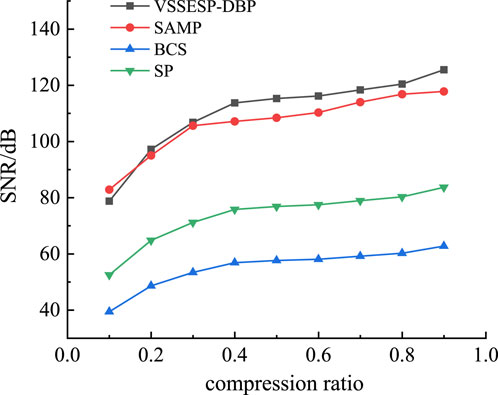
Figure 10. Algorithm reconstruction signal-to-noise ratio under different compression ratios.
To assess the algorithm’s robustness in a complex environment, the compression ratio is fixed at 0.2 (maximum compression). The signal-to-noise ratio of the superharmonic signal incrementally rises from 20 dB to 100 dB in intervals of 10 dB. Figure 11 shows the different degrees of signal application reconstruction error in the case of Gaussian white noise.
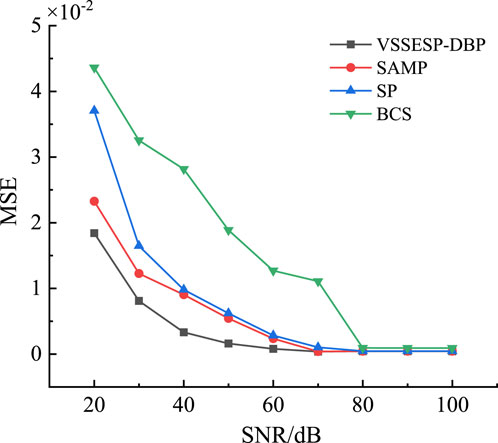
Figure 11. Reconstruction errors of various algorithms with different signal-to-noise ratios.
Analyzing the experimental data in Figure 11, it can be seen that when the signal-to-noise ratio (SNR) in the superharmonic signal is higher than 80 dB (right side of the image), several reconstruction algorithms can reconstruct the signal better. However, with an increase in noise in the signal, the reconstruction errors of the three comparison algorithms, SAMP, SP, and BCS, increase significantly as the signal-to-noise ratio decreases. From an SNR of 80 dB–20 dB, their reconstruction errors rise by 2.3 × 10⁻², 3.7 × 10⁻², 4.3 × 10⁻², respectively. Meanwhile, the proposed algorithm in this paper shows better performance in scenarios with decreasing signal-to-noise ratios. The reconstruction error increases from an SNR of 80 dB–20 dB by only 1.8 × 10⁻², which is lower than the comparison algorithms. Even when the SNR is 20 dB, the signal reconstruction relative error (MSE) remains lower than 2.0 × 10⁻², which is 20.87%, 50.32%, and 57.79% lower than those of the SAMP, BCS, and SP algorithms, respectively. Therefore, the proposed algorithm in this paper has a smaller reconstruction error under the same noise perturbation and exhibits higher robustness. The reason is that this paper adopts flexible time window and dynamic basis tracking algorithm to effectively improve the reconstruction accuracy, and further adopts the variable step size strategy to realize the sparsity self-estimation, which improves the reconstruction accuracy by continuously shrinking the step size during the iteration process of the blind sparsity, and solves the over-estimation problem due to the unknown superharmonic sparsity during the initial decomposition, and the algorithm is more robust than the three comparisons for the environments with different SNR. algorithms.
In order to realize non-stationary signal analysis of high-order harmonics, this article provides a comparative analysis of the spectrum obtained through IEC-61000-4-30 and the 3D spectrum recovered by our method, as shown in Figures 12, 13.
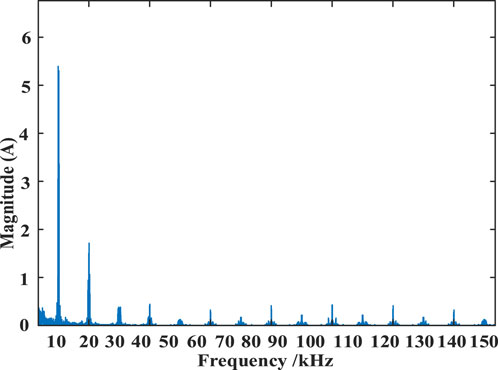
Figure 12. The spectrum obtained through IEC-61000-4-30.
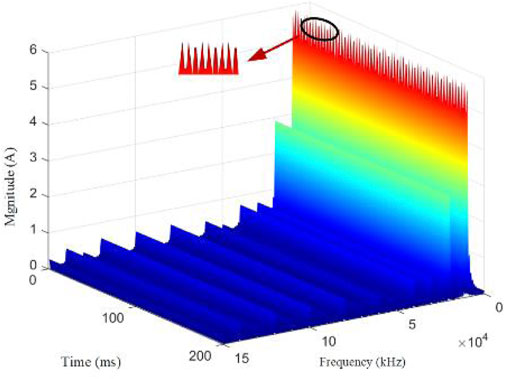
Figure 13. The 3D spectrum recovered by our method.
According to Figure 12, it can be observed that there are approximately 15 significant frequency components at the switching frequency and its integer multiples. With an increase in frequency, the amplitudes of these components gradually decrease, yet no discernible fluctuation characteristics in amplitude over time are observed. The IEC full-sampling method is suitable for steady waveforms, but due to the fluctuating nature of higher harmonic components, it results in excessive spectral leakage. From Figure 13, it can be seen that our proposed method is also capable of accurately detecting these 15 higher harmonic components. Simultaneously, the three-dimensional plots generated by dynamic sampling reveal that the amplitudes of the superharmonic components exhibit distinct non-stationary features. This phenomenon may be attributed to resonance in the low-frequency filtering of the inverter output unit in wind turbine generators can potentially induce voltage oscillations and cause damage to equipment. Through the introduced dynamic monitoring method for superharmonics, the dynamic characteristics of the signal can be analyzed, facilitating further investigation into the causes of accidents and the handling of superharmonics.
Computational efficiency determines the real-time performance of superharmonic monitoring. To test the computational efficiency of the VSSESP-DBP reconstruction algorithm proposed, a high compression ratio (compression ratio M/N = 0.2) was selected, the initial time window width was 100 ms, the sliding window overlap ratio was 0.1, and the number of continuous dynamic sampling was increased from single to 100 in steps of 10. As the number of sampling times increases, the amount of data calculated by the reconstruction algorithm also increases. The average running time of continuous reconstruction of different algorithms after 10 repeated tests is recorded, and the results are shown in Figure 14.
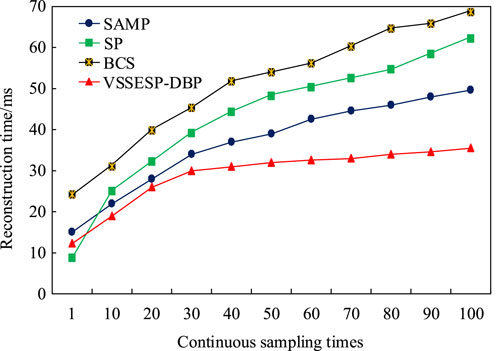
Figure 14. Reconstruction time of different algorithms.
As shown in Figure 14, in single sampling, the calculation time of the VSSESP-DBP algorithm is 12.29 ms, which is slightly higher than the SAMP algorithm, but 18.51% lower than the SP algorithm and 49.17% lower than the BCS algorithm. The reason is that the proposed algorithm approaches the sparsity of the superharmonic signal with a variable step size, avoiding the drawbacks of inaccurate sparsity estimation and increased calculation. In the continuous sampling scenario, the running time of the proposed VSSESP-DBP algorithm is significantly lower than that of the three comparison algorithms. Specific analysis shows that when sampling continuously for 100 times, the running time of VSSESP-DBP is 35.56 ms, which is 42.12% lower than SP, 23.30% lower than SAMP, and 48.85% lower than BCS algorithm. The reason for the analysis is that BCS algorithm uses linear dynamic model to describe the change of support set, while superharmonic is nonlinear, so its solution takes the most time. SP and SAMP adopt greedy iteration strategy. As the amount of data increases, the reconstruction time will increase significantly. The proposed method makes full use of the time correlation of the superharmonic signal and takes the support set of the previous moment as prior knowledge. It only needs to track the change value of the support set Δ = It−It−1. Its computational complexity is reduced from O (n3) of the basis pursuit algorithm to O (Δ3). Therefore, with the increase of the number of sampling times, the running time of continuous reconstruction is significantly lower than that of other algorithms, and the efficiency of the algorithm is improved.
In order to further highlight the novelty advantage of the proposed method in this paper and to test the detection effect of the proposed method on each component parameter of superharmonics, the signal is recovered after the compression measurement and the superharmonic components are detected. The compression ratio is set to 0.2, and the VSSESP-DBP, SAMP, SP, and BCS algorithms are used to reconstruct the signals, respectively, to analyze the amplitude and phase error detection results corresponding to the superharmonics in each frequency band as shown in Tables 4, 5.
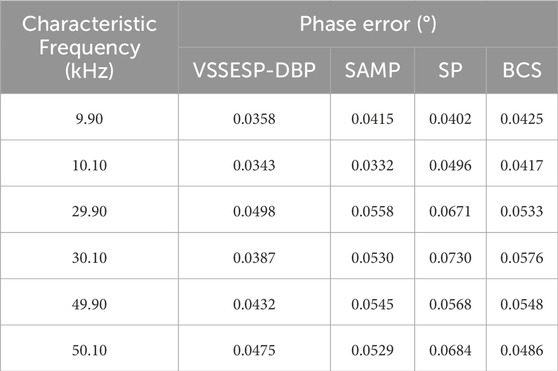
Table 4. Phase detection results (M/N = 0.2).
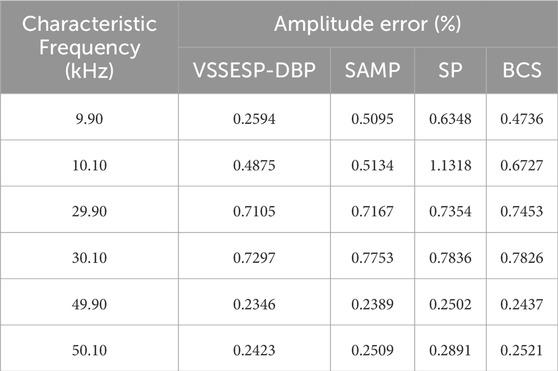
Table 5. Amplitude test results (M/N = 0.2).
From Tables 4, 5, the detection accuracy of the algorithm proposed in this paper is further improved, and when the compression ratio is 0.2, the phase error and amplitude error of each frequency component are within 0.3°and 0.8%, respectively, which meets the requirements of the power quality signal detection accuracy in the IEC 61000-4-30 standard.
Specifically analyzing the phase error, when the compression ratio is 0.2, the maximum phase error of the proposed algorithm is 0.0498°, which is lower than that of SAMP, SP and BCS algorithms by 10.75%, 31.78% and 13.54%, respectively. Further, the average phase detection error of each component is calculated, where the average phase error of the proposed algorithm is 0.0415°, the average phase error of the SAMP algorithm is 0.0485°, SP is 0.0592°, and BCS is 0.0498°, and the proposed algorithm is 14.30%, 29.79%, and 16.48% lower than the SAMP, SP, and BCS algorithms, respectively.
Further, the amplitude error is analyzed and the detection error is derived by calculating the amplitude mean value and comparing it with the reconstructed signal amplitude. When the compression ratio is 0.2, the maximum amplitude error of the proposed algorithm is 0.7297%, which is 5.88%, 35.53%, and 6.76% lower than that of SAMP, SP and BCS algorithms, respectively. The average magnitude detection error of each component is further calculated, where the average magnitude error of the proposed algorithm is 0.44%, the average phase error of the SAMP algorithm is 0.50%, SP is 0.64% and BCS is 0.53%. By comparison, it can be obtained that the algorithm proposed in this paper is lower than the SAMP, SP and BCS algorithms by 11.34%, 30.35% and 15.96%, respectively, with the optimal restoration effect, which further reflects the novel advantages of the flexible time-window acquisition and VSSESP-DBP reconstruction algorithms used in this paper.
This paper proposes a new method for high-order harmonic monitoring based on the VSSESP-DBP dynamic compressed sensing algorithm. This method has made significant progress in accurately monitoring superharmonics, which is crucial for understanding their propagation mechanism and dynamic characteristics. On the sampling side, the scale expansion factor is introduced to achieve feedback-type flexible modulation of the window width, which effectively solves the problem that traditional static sampling and fixed window width sampling cannot capture the rapid time-frequency changes of superharmonics. And the frequency domain sparsity of superharmonic signals in flexible time windows is theoretically derived. On the reconstruction side, through the variable step sparsity self-estimating subspace tracking-dynamic basis tracking reconstruction algorithm, the time correlation of superharmonics is used under blind sparsity to improve the speed and accuracy of reconstruction. Finally, the test is carried out on the wind power grid-connected system. The results show that the method proposed can still quickly recovery time-varying superharmonic signals with low error even under high compression rates, and its dynamic characteristics are significantly better than the comparative algorithms. The work in this paper provides a new measurement idea for in-depth research on the propagation mechanism and dynamic characteristics of superharmonics, and provides theoretical support and technical guarantee for the safe, stable and efficient operation of new power systems. In the future, we can study the generation mechanism and characteristic differences of superharmonics in multiple scenarios, formulate targeted governance strategies for them; study the distributed compressed sensing dynamic monitoring method suitable for high-dimensional signals, and develop dedicated hardware detection equipment; study the design methods of new filters and active compensation devices to achieve effective suppression of superharmonics.
The original contributions presented in the study are included in the article/supplementary material, further inquiries can be directed to the corresponding author.
CY: Writing–original draft, Writing–review and editing. HS: Conceptualization, Data curation, Formal Analysis, Funding acquisition, Investigation, Methodology, Project administration, Resources, Software, Supervision, Validation, Visualization, Writing–review and editing. JY: Supervision, Validation, Visualization, Writing–review and editing, Conceptualization, Data curation, Formal Analysis, Funding acquisition, Investigation, Methodology, Project administration, Resources, Software. PT: Conceptualization, Data curation, Formal Analysis, Funding acquisition, Investigation, Methodology, Project administration, Resources, Software, Supervision, Validation, Visualization, Writing–review and editing. HW: Conceptualization, Data curation, Formal Analysis, Funding acquisition, Investigation, Methodology, Project administration, Resources, Software, Supervision, Validation, Visualization, Writing–review and editing. TY: Conceptualization, Data curation, Formal Analysis, Funding acquisition, Investigation, Methodology, Project administration, Resources, Software, Supervision, Validation, Visualization, Writing–review and editing.
The author(s) declare that no financial support was received for the research, authorship, and/or publication of this article. This paper was supported by the State Grid Science and Technology Project “Analysis of the impact of high proportion distributed photovoltaic on electric energy metering and research on key technologies of harmonic electric energy metering” (kj2022-067).
Authors CY, HS, PT, and HW were employed by Marketing Service Centre, State Grid Hebei Electric Power Co, Hebei, China. Authors JY, and TY were employed by The School of Electrical and Information Engineering, Tianjin University, Tianjin, China.
The author(s) declare that no Generative AI was used in the creation of this manuscript.
All claims expressed in this article are solely those of the authors and do not necessarily represent those of their affiliated organizations, or those of the publisher, the editors and the reviewers. Any product that may be evaluated in this article, or claim that may be made by its manufacturer, is not guaranteed or endorsed by the publisher.
Alfieri, L., Bracale, A., Carpinelli, G., and Larsson, A. (2017). A wavelet-modified ESPRIT hybrid method for assessment of spectral components from 0 to 150 kHz. Energies 10 (1), 97. doi:10.3390/en10010097
Amaya, L., and Inga, E. (2022). Compressed sensing technique for the localization of harmonic distortions in electrical power systems. Sensors 22, 6434. doi:10.3390/s22176434
Ángela, E.-D., and Rönnberg, S. (2022). Modeling and analysis of supraharmonic propagation for stochastic studies. IEEE Trans. Power Deliv. 37, 4899–4910. doi:10.1109/TPWRD.2022.3162712
Barkas, D., Menti, A., Pachos, P., and Psomopoulos, C. S. (2024). Experimental investigation of the impact of environmental parameters on the supraharmonic emissions of PV inverters. AIMS Energy 12, 761–773. doi:10.3934/energy.2024036
Barkas, D. A., Ioannidis, G. C., Kaminaris, S. D., and Psomopoulos, C. S. (2022). Design of a supraharmonic monitoring system based on an FPGA device. Sensors 22, 2027. doi:10.3390/s22052027
Candes, E. J., Romberg, J., and Tao, T. (2006). Robust uncertainty principles: exact signal reconstruction from highly incomplete frequency information. IEEE Trans. Inf. Theory 52 (2), 489–509. doi:10.1109/tit.2005.862083
Carta, D., Muscas, C., Pegoraro, P. A., Solinas, A. V., and Sulis, S. (2021). Compressive sensing-based harmonic sources identification in smart grids. IEEE Trans. Instrum. Meas. 70, 1–10. doi:10.1109/TIM.2020.3036753
Dai, W., and Milenkovic, O. (2009). Subspace pursuit for compressive sensing signal reconstruction. IEEE Trans. Inf. Theory 55, 2230–2249. doi:10.1109/TIT.2009.2016006
Darmawardana, D. (2020). Higher frequency emissions in the range of 2-150 kHz (supraharmonics) in electricity distribution networks.
Daubechies, I. (1990). The wavelet transform, time-frequency localization and signal analysis. IEEE Trans. Inf. Theory 36, 961–1005. doi:10.1109/18.57199
Donoho, D. L. (2006). Compressed sensing. IEEE Trans. Inf. Theory 52 (4), 1289–1306. doi:10.1109/TIT.2006.871582
Espín-Delgado, Á., Rönnberg, S., Sudha Letha, S., and Bollen, M. (2021). Diagnosis of supraharmonics-related problems based on the effects on electrical equipment. Electr. Power Syst. Res. 195, 107179. doi:10.1016/j.epsr.2021.107179
Khokhlov, V., Meyer, J., Grevener, A., Busatto, T., and Rönnberg, S. (2020). Comparison of measurement methods for the frequency range 2–150 kHz (supraharmonics) based on the present standards framework. IEEE Access 8, 77618–77630. doi:10.1109/ACCESS.2020.2987996
Leroi, C., Jaeger, E. D., and Bekemans, M. (2017). Harmonic disturbances up to 150 kHz produced by small wind turbines on the LV distribution grid. CIRED, 663–667. doi:10.1049/oap-cired.2017.0227
Li, Y., Wang, X., and Li, F. (2020). A robust compressed sensing-based harmonic detection method for power systems under noisy conditions. IEEE Trans. Power Deliv. 35 (3), 1234–1243. doi:10.1109/TPWRD.2019.2944271
Mariscotti, A. (2021). Power quality phenomena, standards, and proposed metrics for DC grids. Energies 14, 6453. doi:10.3390/en14206453
Mendes, T. M., Duque, C. A., Manso da Silva, L. R., Ferreira, D. D., Meyer, J., and Ribeiro, P. F. (2020). Comparative analysis of the measurement methods for the supraharmonic range. Int. J. Electr. Power & Energy Syst. 118, 105801. doi:10.1016/j.ijepes.2019.105801
Mendes, T. M., Duque, C. A., Silva, L. R. M., Ferreira, D. D., and Meyer, J. (2019). Supraharmonic analysis by filter bank and compressive sensing. Electr. Power Syst. Res. 169, 105–114. doi:10.1016/j.epsr.2018.12.016
Michalec, Ł., Kostyła, P., and Leonowicz, Z. (2023). Supraharmonic pollution emitted by nonlinear loads in power networks—ongoing worldwide research and upcoming challenges. Energies 16, 273. doi:10.3390/en16010273
Mishra, S., Bhende, C. N., and Panigrahi, B. K. (2018). Detection and classification of power quality disturbances using sparse representation and compressive sensing. IEEE Trans. Instrum. Meas. 67 (2), 380–389. doi:10.1109/TIM.2017.2744409
Nguyen, T. A., and Hong, M. C. (2012). “Filtering-based noise estimation for denoising the image degraded by Gaussian noise,” in Advances in image and video technology: 5th pacific rim symposium, 157–167. doi:10.1007/978-3-642-25346-1_15
Palczynska, B., Masnicki, R., and Mindykowski, J. (2020). Compressive sensing approach to harmonics detection in the ship electrical network. Sensors 20, 2744. doi:10.3390/s20092744
Qiu, S., Hu, X., Du, X., and Chen, B. (2017). “On optimization algorithm of SAMP step size based on compressed sensing,” in 2017 4th international conference on information science and control engineering (ICISCE), 497–502. doi:10.1109/ICISCE.2017.111
Rajkumar, S., Balasubramanian, R., and Kathirvelu, P. (2024). A comprehensive review on supraharmonics—the next big power quality concern. Smart Grids Sustain. Energy 9, 15. doi:10.1007/s40866-024-00195-4
Ritzmann, D., Lodetti, S., Vega, D. d.l., Khokhlov, V., Gallarreta, A., Wright, P., et al. (2021). Comparison of measurement methods for 2–150-kHz conducted emissions in power networks. IEEE Trans. Instrum. Meas. 70, 1–10. doi:10.1109/TIM.2020.3039302
Roberts, R. A., and Mullis, C. T. (1987). Digital signal processing. Addison-Wesley Longman Publishing Co., Inc.
Salari, S., Chan, F., Chan, Y. T., and Read, W. (2018). TDOA estimation with compressive sensing measurements and hadamard matrix. IEEE Trans. Aerosp. Electron. Syst. 54, 3137–3142. doi:10.1109/TAES.2018.2826230
Sandrolini, L., and Mariscotti, A. (2020). Signal transformations for analysis of supraharmonic EMI caused by switched-mode power supplies. Electronics 9, 2088. doi:10.3390/electronics9122088
Sefl, O., and Prochazka, R. (2022). Investigation of supraharmonics' influence on partial discharge activity using an internal cavity sample. Int. J. Electr. Power & Energy Syst. 134, 107440. doi:10.1016/j.ijepes.2021.107440
Shi, Z., Tang, W., Duren, Z., and Jiang, Z. (2014). Subspace matching pursuit for sparse unmixing of hyperspectral data. IEEE Trans. Geoscience Remote Sens. 52, 3256–3274. doi:10.1109/TGRS.2013.2272076
Wang, J., Wang, W., and Chen, J. (2022). Adaptive rate block compressive sensing based on statistical characteristics estimation. IEEE Trans. Image Process. 31, 734–747. doi:10.1109/TIP.2021.3135476
Wang, Y., Luo, D., Xiao, X., Hu, W., and Xu, F. (2019b). IEEE ICHQP2018 and development directions of power quality. Electr. Power Autom. Equip. 39, 197–203. doi:10.16081/j.issn.1006-6047.2019.04.029
Wang, Z., Li, Q., Jiang, J., Huayu, Z., and Zheng, C. (2019a). “A measurement method of supraharmonics based on partial sampling and hybrid segmentation,” in 2019 IEEE sustainable power and energy conference (iSPEC), 2526–2532. doi:10.1109/iSPEC48194
Yang, H., Shi, X., Qiu, R. C., He, X., Ai, Q., and Wang, Z. (2022). Monitoring data factorization of high renewable energy penetrated grids for probabilistic static voltage stability assessment. IEEE Trans. Smart Grid 13, 1273–1286. doi:10.1109/TSG.2021.3128503
Yang, T., Pen, H., Wang, D., and Wang, Z. (2016). Harmonic analysis in integrated energy system based on compressed sensing. Appl. Energy 165, 583–591. doi:10.1016/j.apenergy.2015.12.058
Yin, S., Yu, R., and Wang, L. (2024). Transmission line monitoring technology based on compressed sensing wireless sensor network. Int. J. Adv. Comput. Sci. Appl. 15. doi:10.14569/ijacsa.2024.0150419
Zhong, F., Zhang, X., Zhu, Y., Guan, L., Jiang, Z., and Chen, Z. (2024). Supraharmonics reconstruction method based on blackman window and compressed sensing. Electronics 13, 2679. doi:10.3390/electronics13132679
Keywords: superharmonic, compressed sensing, dynamic sampling, sparse transform, algorithm reconstruction
Citation: Yan C, Shen H, Yu J, Tao P, Wang H and Yang T (2025) Supraharmonics monitoring based on VSSESP-DBP dynamic compressed sensing algorithm. Front. Energy Res. 13:1502652. doi: 10.3389/fenrg.2025.1502652
Received: 27 September 2024; Accepted: 20 February 2025;
Published: 13 March 2025.
Edited by:
Shuai Yao, Cardiff University, United KingdomReviewed by:
Constantinos S. Psomopoulos, University of West Attica, GreeceCopyright © 2025 Yan, Shen, Yu, Tao, Wang and Yang. This is an open-access article distributed under the terms of the Creative Commons Attribution License (CC BY). The use, distribution or reproduction in other forums is permitted, provided the original author(s) and the copyright owner(s) are credited and that the original publication in this journal is cited, in accordance with accepted academic practice. No use, distribution or reproduction is permitted which does not comply with these terms.
*Correspondence: Ting Yang, aHV5aWhhbzEwMTVAZm94bWFpbC5jb20=
Disclaimer: All claims expressed in this article are solely those of the authors and do not necessarily represent those of their affiliated organizations, or those of the publisher, the editors and the reviewers. Any product that may be evaluated in this article or claim that may be made by its manufacturer is not guaranteed or endorsed by the publisher.
Research integrity at Frontiers
Learn more about the work of our research integrity team to safeguard the quality of each article we publish.