 Wei Hu
 Yining Li1*
 Puliang Du
95% of researchers rate our articles as excellent or good
Learn more about the work of our research integrity team to safeguard the quality of each article we publish.
Find out more
ORIGINAL RESEARCH article
Front. Energy Res. , 04 February 2025
Sec. Smart Grids
Volume 13 - 2025 | https://doi.org/10.3389/fenrg.2025.1501537
This article is part of the Research Topic Optimal Scheduling of Demand Response Resources In Energy Markets For High Trading Revenue and Low Carbon Emissions View all 34 articles
As renewable energy sources are extensively incorporated into electrical grids, the necessity for enhanced flexibility and stability within the power system has significantly grown., Demand Response (DR) has attracted widespread attention as an effective load management tool. This study delves into the master-slave game theory-based demand response strategy integrated with renewable energy, aiming to optimize the interaction mechanism between grid operators and users participating in demand response through a game-theoretic framework, thereby enhancing the system’s economic efficiency and reliability. In this research, we first constructed a power system model that includes renewable energy sources such as wind and solar power. A master-slave game theory-based demand response strategy framework was proposed, where the energy suppliers act as the leader by setting demand response policies, while energy operators who act as followers decide their consumption behaviors to maximize their own interests. The strategy allows participants to adjust their strategies based on real-time market information and changes in renewable energy output so as to realize optimal scheduling of demand response resources. Through theoretical analysis and simulation experiments, the results illustrate that the demand response strategy affects the respective revenues of energy operators and energy suppliers by dispatching electricity purchases in four different modes. The effectiveness of the demand response strategy was verified in reducing operational costs of the grid, enhancing the system’s adaptability to fluctuations in renewable energy, and encouraging active user participation in demand response. In summary, the master-slave game theory-based demand response strategy for renewable energy integration proposed in this study not only promotes the economic and efficient operation of the power grid but also provides important theoretical support and technical references for the development of future smart grids.
As the global energy structure shifts to green and the pressure to cope with climate change increases, the development and application of renewable energy is becoming a crucial path to promote sustainable development. The integration of renewable energy sources such as wind and large-scale solar energy into the traditional power system poses a revolutionary challenge to the integrated operation and management mode of the latter. Demand response (DR) has emerged as a key strategy in dealing with an increasingly complex power environment. It subtly responds to the volatility and unpredictability of renewable energy supply by incentivising or directly regulating users’ electricity consumption behaviour, ensuring the smooth operation of the power system while improving overall operational efficiency. The interaction between the supply and demand sides of the electricity market, including grid companies, power users and renewable energy generators, can be seen as a game process. In particular, the interaction between the grid operator and the user constitutes a typical master-slave game relationship: the grid operator, as the dominant party, is responsible for formulating demand response policies and rules (Jixun, 2024); Users, as followers, decide their own electricity consumption strategies based on these policies to maximize their personal benefits. This dynamic interaction needs to be analyzed and optimized with the help of game theory, a powerful mathematical tool. Therefore, it is not only of great significance to understand and predict the behavior of power market participants, but also to design an effective incentive mechanism and improve the economy and reliability of the overall operation of the power system. In addition, the research will also help promote the development of smart grids, realize the optimal allocation of energy consumption, and promote the sustainable development of energy.
With the increase of the proportion of renewable energy, its inherent uncertainty and volatility pose new challenges to the stability and economy of the power grid, and demand response, as a flexible resource management method, is of significant significance for adjusting load, balancing supply and demand, and reducing operating costs. By constructing a master-slave game model, it provides a new perspective and method for understanding and analyzing the behavior of different stakeholders in the power grid, and enriches the application of power market theory and game theory in the energy field.
The integration of renewable energy and demand response strategies are currently hot topics of research by scholars at home and abroad. The master-slave game model, especially the Stackelberg game, has been widely studied and applied to the design of demand response mechanism due to its applicability in simulating the interaction between supply and demand in the electricity market. In foreign countries, many researchers have improved the Stackelberg model to analyze the interaction between renewable energy and demand response. Zhang proposed a distributed energy resource scheduling framework based on Stackelberg game, considering the impact of price elasticity on demand response (Cong et al., 2024). This study highlights the problem of how to use game theory methods to optimize the allocation of energy resources in an uncertain environment. In addition, Liu studied a demand response problem in a power system involving wind and solar power, and analyzed the strategic behavior of different market participants through the Stackelberg model (Xuanyue et al., 2023). The United States, Canada and other countries have also taken legislative measures to promote the development and application of integrated energy system technologies, and on this basis, focus on the way of decentralized energy utilization and combined cooling and power generation, so as to achieve an integrated energy planning strategy. In view of the current international situation, China is vigorously promoting the research and development of integrated energy systems through major projects such as the National Natural Science Foundation of China, which has significantly promoted the research and progress in related fields and accumulated considerable theoretical achievements (Ruilin et al., 2022). China actively advocates international cooperation, draws on advanced concepts and practices from around the world, especially focuses on advanced technologies for integrated energy systems, accelerates the optimization and upgrading of the domestic energy structure through project cooperation, and is committed to achieving the goals of carbon emission peak and carbon neutrality (Guang et al., 2021).
Renewable energy systems are large and complex. Combined cooling, heating and power systems consist of gas turbines, gas boilers and heat pumps. Wind power is made up of wind turbines, generators, and towers, while photovoltaic power generation is made up of solar panels, controllers, and inverters. Energy flows involve multiple types of cooling, heating and electrical, and with multiple layers of interaction between energy sources, networks, loads and storage (Ruilin et al., 2022). Therefore, the operation plan of multi-energy complementary system needs to consider many factors such as economic efficiency, environmental protection and energy saving benefits, which is a kind of multi-energy collaborative optimization problem with the characteristics of multi-objective, restrictive, nonlinear and random (Haitao et al., 2024). On this basis, two optimization objectives of maximizing energy efficiency and minimizing operating costs are established, and the operation and scheduling problems of energy integrated systems are further investigated. In this paper, the optimal control of energy flow in a multi-energy distribution network is studied, which minimizes the power supply cost, the minimum network loss and the minimum asymmetry (Cao et al., 2024). In this paper, the carbon emission factor is included in the study of integrated energy system operation optimization, and an economic optimization model with the goal of minimizing the system operation cost is constructed.
In renewable energy systems, the interests of the various actors are self-motivated, acting independently and collaboratively, which leads to conflicts of interest and privacy concerns (Shaohua et al., 2024). The existing energy integration operation optimization methods focus on the benefits of energy supply units such as energy hubs, but fail to fully balance the interests of all participants, and may ignore the protection of data privacy in information management (Yang et al., 2025). Therefore, the decision balance based on game theory and the privacy protection function of users have become a new research hotspot (Liu L. et al., 2024). These studies provide valuable perspectives and methods for understanding demand response in renewable energy integration, but they also point out some shortcomings in the existing literature, such as insufficient in-depth analysis of market mechanism design, short of empirical research on actual operating data, and insufficient exploration of the application of emerging technologies such as energy storage and smart contracts in demand response. There is also a lack of discussion on the impact of master-slave games between different subjects on the interests and decision-making behaviors of members in the whole system. Future research needs to be explored in more depth in these aspects to achieve efficient integration of renewable energy and optimal management of power systems (Xingmou et al., 2024; Christmann and Klein, 2024; Ye et al., 2024; Carreño et al., 2024).
In summary, the current research shows that the application of master-slave game model, especially Stackelberg game, in renewable energy integration and demand response strategies has made significant progress. However, there is still a need for in-depth exploration of market design, data-driven empirical research, and the integration and application of emerging technologies. Based on an in-depth analysis of the market mechanism, this paper constructs a Steinberg game model with energy suppliers and energy operators as the main body, which comprehensively considers the output characteristics of renewable energy, and studies different revenues and power purchases under four operating modes to achieve better optimal scheduling. It is expected that more innovative solutions will emerge in the future to facilitate the effective integration of renewable energy into the traditional power grid, ensuring the reliability and economic efficiency of the power system.
The energy integration system is an effective management system that organically combines energy production, transmission, conversion, distribution, consumption and other links (Li C. et al., 2024; Ahmad and Fagih, 2024). It includes multiple components such as energy conversion generation, supply network construction, and terminal energy efficiency utilization, aiming to maximize the overall benefit of energy use through the collaborative optimization of each link (Capraro et al., 2024; Hongli et al., 2024). The core energy conversion module is a new type of cogeneration (CCHP), which is a typical cogeneration method, which includes: gas generator set, gas boiler with auxiliary heat source, absorption refrigeration and electric refrigeration device for mutual conversion of cold and heat energy and electric energy. Coordinated work and optimal operation of the individual units are key to ensuring an efficient, economical and flexible power supply to the system. In this project, a distributed cooling, heating and power system based on distributed cooling, heating and power is taken as the research background, and the distributed cooling, heating and power system is mainly studied, and the power generation enterprise is the main organization to coordinate and dispatch its operation (Fischer and Toffolo, 2024). Through collaboration and decentralized management, the economic benefits, flexibility and reliability of the whole system are improved, so that the service can be best played, so that the needs of customers can be met to the greatest extent.
The study includes: (1) Build a framework of distributed combined cooling, heating and power system and analyze their respective performance characteristics; (2) The working mechanism of each unit in the distributed combined cooling, heating and power system is analyzed, and the relevant mathematical modeling is established. Finally, we focus on the optimization of the scheduling performance of a CCHP system.
As an energy supplier, the renewable energy system realizes the seamless connection between electric energy and thermal energy, realizes the efficient and flexible supply of energy, and realizes the scientific and optimal utilization of energy. Energy enterprises are the overall managers of the energy supply side, and also the bridge connecting the energy supply side and the supply side, and their main responsibilities are to integrate distributed energy consumption, market operation to achieve market equilibrium, market operation equilibrium, and accurate estimation and control of customer energy demand, as well as accurate prediction and control of customers’ energy demand, so as to ensure the coordination of market stability and energy allocation. As autonomous and rational decision-makers, energy operators use big data analysis and forecasting methods to predict customer electricity consumption. Based on the previous electricity market quotations and market expectation data, the power generation plan of the power system and the electricity price of electricity consumers are preliminarily determined. Then, through the interaction with supply and demand, the strategy is optimized to achieve the final equilibrium between supply and demand. Among them, the decentralized combined cooling, heating and power system is the core supplier introduced by energy operators. It is powered by gas consumption to produce electricity, heat and cooling, which solves the needs of residents for electricity in an all-round way (Jiang et al., 2024). In an open energy system, each CCHP system acts as an independent and rational market participant, demonstrating its vitality through autonomous bidding, where all parties compete and cooperate with each other, as shown in Figure 1.
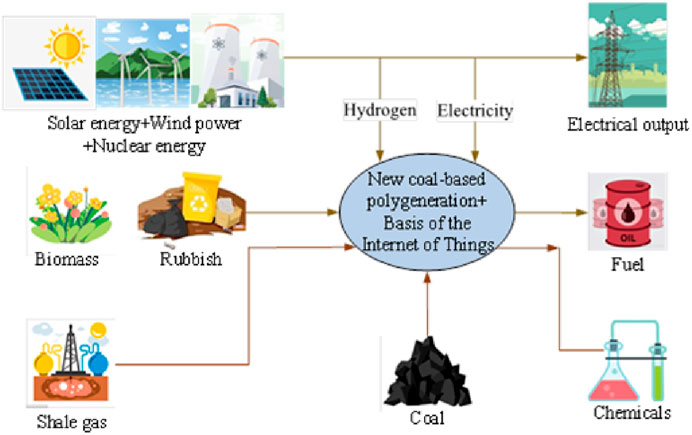
Figure 1. Geometric representation of IFS, IFS2, NFS and SFS.
The power supply mainly relies on micro-gas turbines and photovoltaic and wind power generation systems, and Figure 2 illustrates the operating principle of the combined cooling, heating and power system (Tu, 2024). The waste heat generated by small gas turbines is converted by the recovery device, and part of it is converted into cold energy through the absorption refrigeration mechanism to supply the cooling load users, and the rest is directly used for the heat load users. If the heat supply from waste heat recovery is insufficient to meet the demand, the gas boiler can provide additional heat in a timely manner. Similarly, when the cooling supply is insufficient, the cooling function of the electric refrigeration mechanism intervenes to make up for it.
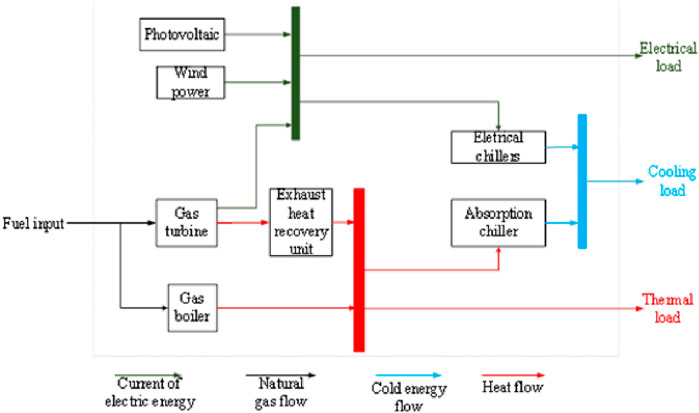
Figure 2. Structure diagram of CCHP system.
With the advancement of distributed energy systems such as combined cooling, heating and power, micro gas turbines are becoming more and more popular due to their compact size, strong flexibility, high fuel efficiency, and low environmental impact, and their operating mechanism is shown in Figure 3. In the compression process, the air is compressed into a high-pressure gas, which is then heated by a heat storage body, mixed with fuel oil in the combustion chamber and ignited to produce high-temperature gas (Li WW. et al., 2024). Ultimately, these high-temperature gases drive turbines to operate. The high-temperature exhaust gases generated by the turbine can be reheated in the recuperator to reheat the high-pressure air, and the recuperator’s own exhaust gas can then be converted into heat energy for the user to need, or treated by an absorption chiller to produce the required cold energy.
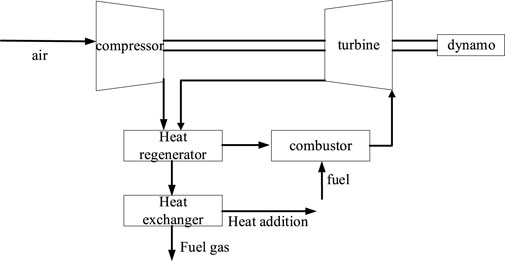
Figure 3. Working principle diagram of gas turbine.
The Equation 1 shows the relationship between the power generated by a small gas turbine and the efficiency of power generation:
In the formula, the gas turbine power is expressed in
A small gas turbine can efficiently use a part of the waste heat and convert it into cold and heatenergy, and the mathematical model Equation 2 of waste heat recovery is expressed as follows:
where m is the heat dissipation loss coefficient of the gas turbine.
The refrigeration
where the
The waste heat of the gas turbine can be converted into energy by the thermodynamic system, and the heat output
where the
The gas consumption Equation 5 per unit volume of small gas turbine power generation is
where the
When the small turbine cannot produce sufficient thermal energy, the amount of natural gas consumed in
where
In addition, when the supply of low temperature due to adsorption cooling is insufficient, an electric cooler is used to compensate for the required low temperature. The Equation 7 is shown as follows:
where
Wind power generates electricity by pushing the fan blades to rotate by the force of the wind. The characteristics of its electrical energy output are shown in Figure 4, which divides the wind power process into four periods according to the wind speed (Liu Q. et al., 2024). When the wind speed is insufficient and the motor starting condition is not triggered, the fan impeller is stationary and no electric energy is produced; Once the wind speed increases to the starting threshold, the blades start and drive the generator, and the electrical power increases linearly. When the wind speed reaches the rated standard, the electric power is stable at the rated level; If the wind speed is too high and exceeds the safe upper limit, the fan will stop running through the braking mechanism and stop the power output.
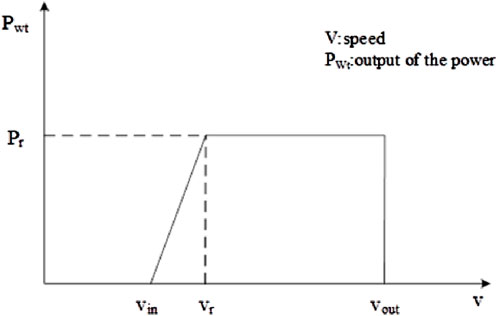
Figure 4. Wind power generation diagram.
The relationship between the speed and output of the fan can be expressed by the following Equation 8:
In the above formula,
Photoelectric conversion technology is a photoelectric conversion technology based on photoelectric conversion technology. Ideally, the equivalent circuit of a photovoltaic cell is shown in Figure 5, where U is the diode terminal voltage, the
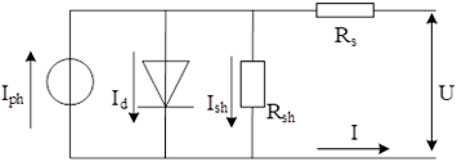
Figure 5. Equivalent circuit diagram of photovoltaic cells.
From the equivalent circuit, it is clear that as Equation 9 shows:
Among this Equations 10–12 illustrate every variable.
where
Renewable energy priority means that in the energy system, renewable energy represented by wind and solar energy should be used to achieve sustainable development, reduce dependence on traditional fossil energy, and reduce CO2 emissions. In the master-slave game, all participants should share real-time data of the energy system, including renewable energy generation, load demand, electricity price, etc., so that all parties can make reasonable decisions based on this information (Alomari, 2024). Incentives and penalties, in order to encourage users to participate in demand response, incentives can be set, such as reducing electricity prices, providing subsidies, etc. At the same time, for non-compliance, corresponding punitive measures should be taken, such as fines, restrictions on electricity use, etc.
Dynamic adjustment and optimization, demand response strategies should be dynamically adjusted based on real-time data to adapt to the volatility and uncertainty of renewable energy. In addition, optimization algorithms such as genetic algorithm and particle swarm optimization algorithm should also be used to seek the best demand response strategy. Users participate in personalized customization, and when formulating demand response strategies, the personalized needs of users, such as comfort, electricity habits, etc., should be fully considered to improve user satisfaction and engagement. System stability and security, When implementing demand response strategies, the stability and safety of the energy system should be ensured to avoid system instability or safety incidents caused by demand response. Cross-regional coordination and cooperation, Coordination and cooperation mechanisms should be established between multiple regions to jointly cope with the volatility and uncertainty of renewable energy, and to achieve complementary and optimal allocation of energy between regions.
The Stackelberg leader-follow game model is a dynamic non-cooperative strategy game theory, in which the key feature lies in the order of decision-making: the players do not act at the same time, but follow the leader’s pre-determined rules, and the followers will change their strategies according to the leader’s decision (Benjamin and Mustafa, 2024). In the master-slave countermeasure mode, the player who makes the first decision is defined as the leader, and the follower who acts next. Followers optimize their strategies based on information about the leader’s behavior, which reflects the initial action advantage that the leader enjoys (Hu, 2024; Yin, 2024).
In the Stackelberg countermeasure model, everyone is able to reach master-slave equilibrium according to their best choice. Suppose the leader has the decision space of
1. The leader first chooses strategy
2. After receiving the leader’s choice, the follower chooses
In short, the leader acts first and optimizes, and then the followers adjust according to the leader’s choices to maximize their own interests, forming a circular but stable strategy pair.
As shown in Figure 6, the renewable energy architecture in this study involves the power system, external power grid, connecting lines, and local grid power supply, and highlights the obvious master-slave energy efficiency game dynamics between the market and energy companies. As the dominant operator in the system, the source operator first initiates the decision-making process and discloses the power purchase demand to the source supplier. At the same time, power companies are also responders, adjusting prices accordingly according to their own revenues. At present, China does not have a perfect cold energy trading mechanism and a large-scale independent cooling organization, and most of the cold energy demand depends on electric energy conversion. Therefore, this paper only studies the interaction between the two markets of electricity and heat, which use gas as a factor of production, to generate electricity and heat. In the event of a shortage, energy operators purchase additional electricity and heat from electricity and heat suppliers to meet demand. It is important to note that ISO systems do not supply energy to the main grid or thermal network.
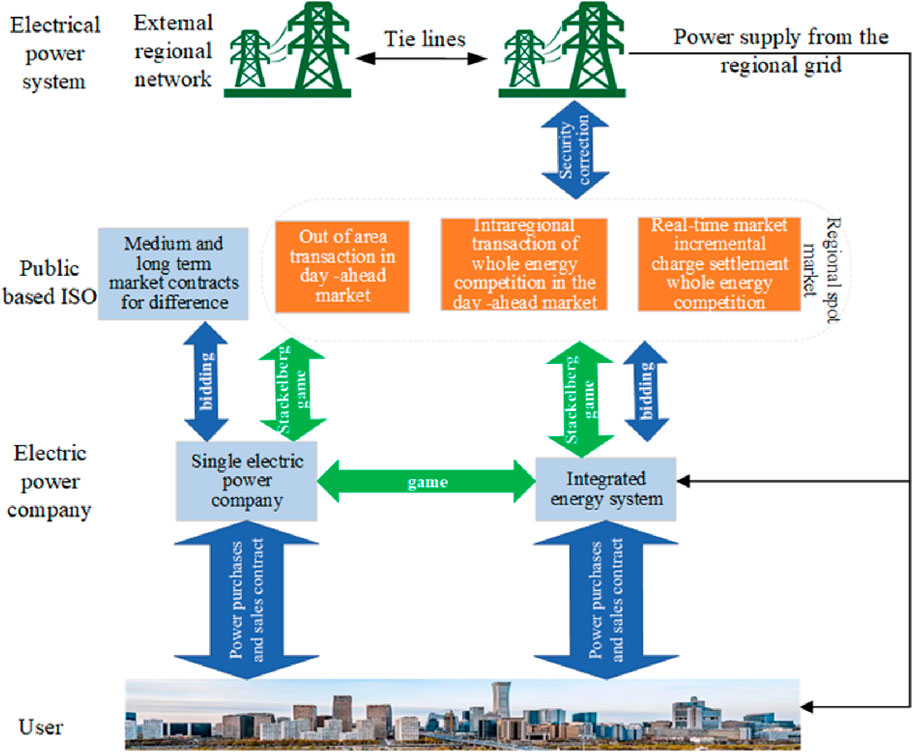
Figure 6. Structure diagram of master-slave game.
As an intermediary between users and the market, the primary task of energy operators is to use predictive technology to estimate the energy consumption needs of consumers. EO contains integrated energy system and single electric power company. Then, according to the price of the energy suppliers (public based ISO) and the rules of supply and demand balance, the goal is set to optimize its own revenue, determine the purchase volume and the price strategy of selling to users. The regional electricity spot market can optimize the allocation of regional power resources and promote the consumption of new energy. This not only ensures the balance between energy supply and demand within the system, but also promotes fair competition in market transactions. In addition, the scale of energy consumption of operators directly affects the pricing strategy of energy suppliers, resulting in a dynamic relationship between the two in a master-slave game.
EO (Energy Operator) intelligently plans the purchase quantity from power grids and heating companies and pricing according to the actual needs of users. Follower objective function is constructed with the goal of maximizing their own interests. In order to meet the needs of consumers to purchase electricity, the EO system only focuses on current and sensitive energy prices, so it adopts a unified pricing strategy over time. EO’s earnings are derived from gains from energy sales, which is net of all purchased costs. These purchased costs mainly include the cost of purchasing electricity and heat from energy suppliers (ES), as well as the purchase of electricity and heat from grid companies and heating companies.
The objective function can be expressed as Equation 14:
where T represents the entire time period, here, refers to 24 h,
where
In order to ensure the stable operation of the power supply and prevent direct trade between power users and power users, the energy cost of power generation enterprises must be slightly lower than the market price without causing losses to the operator, and the following conditions Equations 19, 20 must be met:
where
Additionally, in order to avoid EO’s blind pursuit of profit maximization, EO’s electricity sales and heat sales prices must also be met as Equations 21, 22 show
where
With the profit maximization of the power generation enterprise as the optimization goal, the profit of the power generation enterprise is the difference between the power generation profit and the power generation operating expenses. Due to the characteristics of the electricity market itself, the supply efficiency of the electricity market is only determined by the profits of power generation enterprises selling to the grid, rather than the power generation enterprises that supply power to other power grids, and the operating expenses of the power grid are also different due to the difference in the size and facilities of the power grid. Then build the following objective function Equation 23:
where
The relationship between the output of the gas turbine and the gas turbine and the fuel cost in ES can be expressed as a quadratic Equation 24:
where
For renewable resources like wind and solar power, such as absorption refrigerators, which do not use fuel in actual work, but have some equipment loss, then, their operation and maintenance costs are calculated as Equation 25:
The recovery device,
The output power and heat of the ith ES in time t should meet the following power requirements of Equations 26, 27:
In this formula,
Besides, the output power of gas turbines and gas boilers also needs to meet the following conditions like Equations 28, 29 in t time:
where
Considering that the operating cost of the energy storage system will show a quadratic relationship with the increase of the output power of the device, the pricing curve related to the energy sold should not be determined by using the simple average time-of-use pricing method, but should be determined according to its own cost function Equations 30, 31:
In the formula,
Based on the description in this section, the game relationship between EO and ES is modeled as a one-to-many leader-follower model as Equation 32 shows.
This collection clarifies and defines the three main elements of the model: agent, strategy, and benefit.
1) Participants: N + 1 participant, 1for EO, N for ES, the set of participants can be expressed as Equation 33:
2) Strategy: The EO strategy of the leading enterprise is embodied in: the pricing of power generation that is favorable to customers, and the purchase of electricity and heat from the ith vendor of ES, these data are expressed in vector form
In the Stackelberg equilibrium state, each participant achieves the optimal strategy and is reluctant to adjust it because any unilateral change will lead to the loss of their own interests. The decision variables
Finding the second-order partial derivatives of
Since the float coefficients
Taking a typical region in northern China as the research focus, this paper analyzes the operation strategy of demand-response countermeasures in the renewable energy power system. In view of the lack of a perfect cold and hot energy trading mechanism and cold energy supply center in the new energy market, a method of converting electric energy into cold energy was proposed. Taking the characteristics of summer power trading and winter power trading into account, and focusing on the situation in winter, the focus is on the operation and energy management of winter electricity and heat trading.
In this example, two ESs (power systems) were selected for simulation, and Figure 7 clearly shows the forecast data of daily wind and photovoltaic energy in winter, as well as the detailed distribution of electricity and thermal load power of the users.

Figure 7. Wind power energy and photovoltaic energy data of each ES.
The electrical load is usually between 11 and 14 o’clock during peak hours, and the heat load is mainly concentrated between 16 and 19 o’clock. According to the data in Table 1, the electricity price of the grid company and the heat price of the heat power company are as follows: The upper limit of the ES-side power purchase is determined by the sum of the gas turbine power ratings of the two suppliers and the total generation of wind and photovoltaic power. The thermal energy purchase range is set at a minimum of 0 kW and a maximum of 400 kW and 600 kW. The cost factor for the ES2 gas turbine is 0.0011 and the cost factor for the gas boiler is 0.155. Price parameters for renewable energy suppliers and energy operators in Tables 2, 3 are researched from websites of the government.
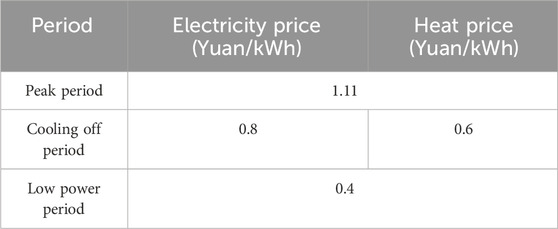
Table 1. Energy grid electricity prices and heat company heat prices.
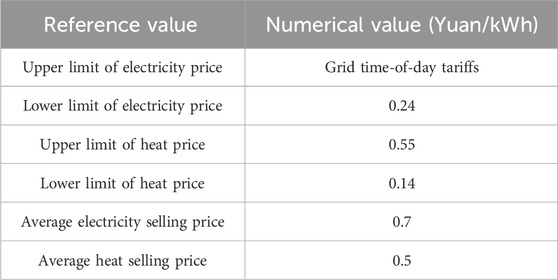
Table 2. Price factors for renewable energy operators.

Table 3. System and price parameters for renewable energy suppliers.
As shown in Figure 8, the results show that convergence has been achieved, and the experimental results show that the algorithm proposed in this paper is highly efficient and has good convergence. Figure 8 shows that with the increase of iteration time, the income of power operators increases significantly, but the changes in income and energy of power operators are irregular under the non-cooperative game. Energy operators’ earnings have grown steadily, but at a slower pace; Suppliers’ revenues and prices stabilize until market dynamics reach a supply-demand equilibrium point, reflecting the process of strategic interaction between all parties. After reaching the Nash equilibrium, each participant achieves their best interests and has no incentive to adjust their strategy. According to the profit report of the energy supplier, the revenue of the first phase was 4,349.3 yuan, and the second stage increased to 5,020.4 yuan, while the total energy expenditure of users in the period was 27,014 yuan. The base electricity price of ES2 is fixed at 0.3252 yuan/kWh, and the basic heat price is maintained at 0.1323 yuan/kWh. The base electricity price (heat price) of ES1 is higher than that of ES2, and according to the formula, the real-time electricity price (heat price) is affected by the combined real-time electricity (heat) of energy storage and the benchmark price. In view of the fact that ES1’s hourly electricity power (thermal power) is smaller than that of ES2, ES1 has chosen to increase its base electricity price (thermal price) in order to narrow the hourly tariff gap between the two. The ES1 system is relatively expensive to operate, so energy prices are set in pursuit of greater economic benefits.

Figure 8. ES renewables base price demand equilibrium.
Figure 9 illustrates the pricing model of the upper energy supplier: the time-of-use price is shown by the dotted yellow line, and the dotted purple line illustrates the minimum pricing threshold. Figure 9 clearly shows that EOs operate within their pricing strategies, strictly confined to pre-set price boundaries, with the goal of offering consumers a price plan that is more competitive with the traditional grid. EO’s pricing strategy is set with strict upper and lower bounds, with the aim of giving customers a more economical price for electricity than district heating. EO’s hourly price is the closest to the grid price and is greatly affected by the customer’s demand for electricity. During peak periods such as 10:00–15:00 and 18:00–21:00, when users consume a lot of electricity, EO’s pricing policy is to a certain extent higher than the price of the grid to incentivize transactions, motivate customers to participate in bidding, reduce the cost of purchasing electricity from the grid, and improve the economic benefits of enterprises. EO’s pricing decisions are driven by a combination of price constraints and electricity demand.
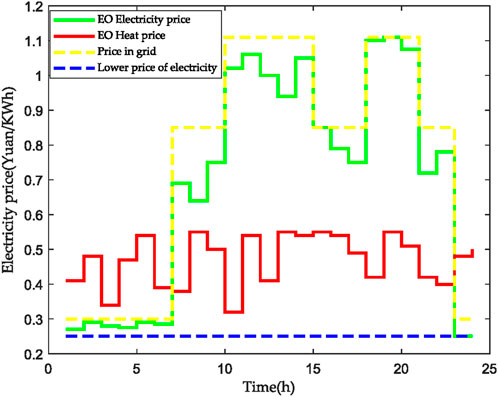
Figure 9. EO’s renewable energy price setting.
Figures 9–11 illustrate the endgame of the interaction between EO and ES. According to the upper-level EO energy procurement strategy in Figure 11, EO tends to purchase electricity from energy suppliers first, as long as the ES can meet the supply requirements. However, if the ES does not supply enough power to cover the demand, EO will turn to the grid to make up for it. On the basis of the EO thermal energy purchase strategy in Figure 11, EO tends to obtain thermal energy from ES first, and only when ES supply is in short supply, it will turn to thermal power companies to purchase.
The pricing of low-level energy suppliers depends not only on the purchasing decisions of top-level energy suppliers, but also on the demand decisions of similar manufacturers. From the comparison of Figures 10, 11, it can be concluded that the real-time electricity price dynamics of energy suppliers are synchronized with the electricity purchase volume of operators, and this correlation is due to the linear correlation between ES’s electricity price setting and EO’s power purchase. As the power purchased increases, so does the price of electricity, and this is a design strategy designed to optimize the profitability of energy suppliers. From Figure 11, the electricity prices of ES1 and ES2 are basically the same at 4:00, 11:00 and 23:00. At the rest of the time, the electricity prices of the two show alternating fluctuations in one higher than the other. Due to the non-cooperative competition among energy suppliers, they tend to attract customers through price reduction strategies and increase electricity sales to maximize their own profits. From the comparison of Figures 10, 11, it is concluded that the heat price strategy and electricity price strategy of ES are synchronized with the energy purchase strategy of EO, which is as follows: when the heat purchase volume of EO increases, ES will increase the heat price accordingly; Conversely, if EO purchases decrease, the ES hot price decreases, thereby optimizing its profitability.
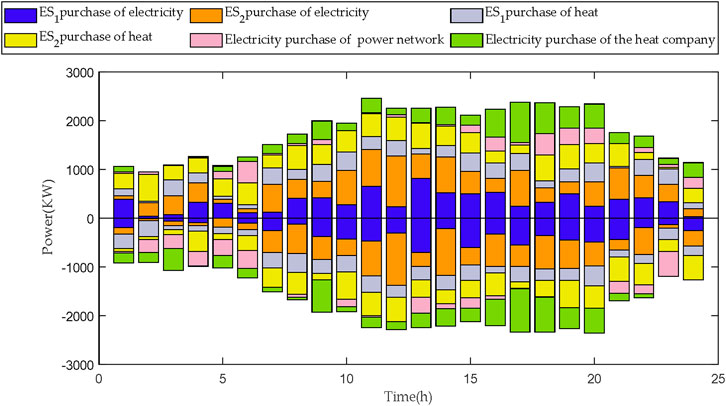
Figure 10. EO thermal energy usage.
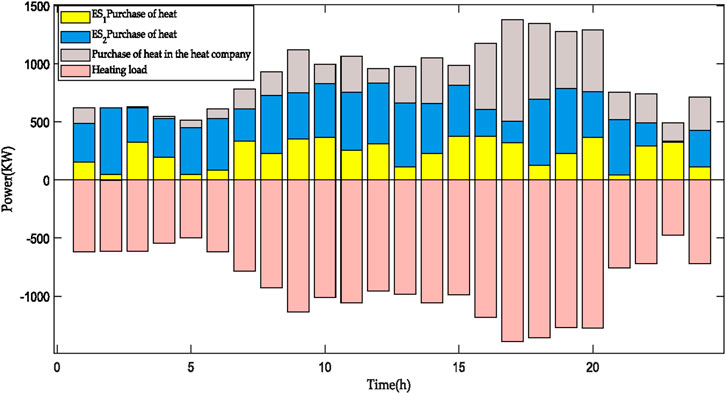
Figure 11. Electricity usage.
Through the comparison of the operation mode, the influence of the primary and secondary game between different subjects on the interests and decision-making behaviors of the members in the whole system is discussed.
Mode 1: The method in this paper encourages energy operators to cooperate with multiple energy suppliers to compete for electricity and heat.
Mode 2: Electricity trading between suppliers and operators is limited to a competitive situation, but the price of heat is set by the supplier at a fixed rate.
Mode 3: The interaction between the supplier and the operator is limited to thermal energy trading, and the price of electricity is set at a fixed rate by the supplier.
Mode 4: Renewable energy generators have a passive pricing role in their dealings with energy operators, i.e., they supply electricity and heat at a fixed price.
As shown in Table 4, energy suppliers in operating model 1 have the most significant benefits, however, as passive price recipients, they do not have the flexibility to adjust their selling prices to energy operators in response to changes in purchases, which may limit the realization of their profit potential. Under Mode 4, renewable energy operators achieve the highest profits, while energy suppliers have relatively low revenues. If the supplier adjusts the price, the operator’s profit may increase significantly, and may even lead to the formation of a market monopoly. As such, our strategy enables energy suppliers to fully integrate into the market, increase profitability through independent bidding strategies, and effectively curb the potential market dominance and monopolistic behavior of energy operators. Table 4 shows a comparison of the revenue of each agent under various price models.

Table 4. Comparison of revenue of each agent under various price models.
Figure 12 shows a comparison of the optimization of energy procurement in Mode 1 and Mode 4, with the legend at the top representing the optimization results of Mode 1 and the optimization results of Mode 4 at the bottom. The chart shows that when Mode 4 optimization is used, the amount of energy purchased by users from the power system in Mode 4 is smaller due to the increase in energy consumption in the electricity market during peak and valley periods compared to Mode 1. During the peak-to-trough period of electricity price changes, although the way EO obtains energy from ES is not much different from method 4, mode 4 is characterized by the fact that the energy price of ES is fixed and much lower than the standard price of mode 1. In the context of round-the-clock ES energy price volatility and the ongoing EO energy purchase strategy, the potential earnings of ES in Mode 4 may face a decline, while EO’s earnings are expected to show an upward trend due to reduced acquisition costs. With its autonomous bidding system and EO’s dynamic interaction, ES can improve decision-making power in the field of smart energy, realize intelligent price control, and optimize revenue expectations.
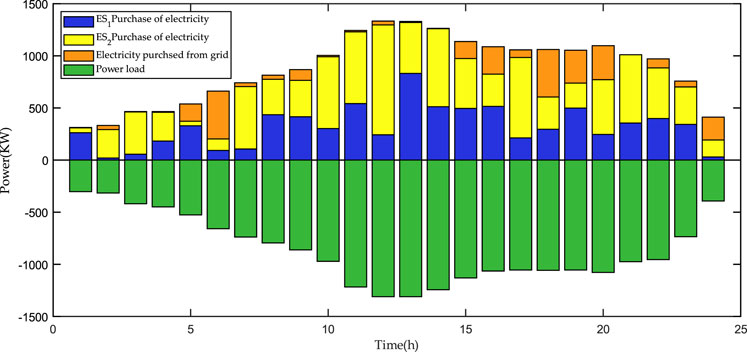
Figure 12. EO renewable energy purchases under different modes.
This study explores the master-slave game demand response strategy of renewable energy integration, aiming to optimize the operational efficiency and stability of the power system under the condition of high proportion of renewable energy grid. By combining inverter technology, smart grid facilities, advanced communication networks, and master-slave game theory, this study successfully constructs a complex system model that can not only promote the effective integration of renewable energy, but also realize dynamic load management. In terms of the selection and parameter setting of key equipment, the study focused on the efficiency and compatibility of inverters, the accuracy of smart meters, the stability of communication infrastructure, and the data processing capacity of energy management systems. The proper configuration and coordinated operation of these devices is the basis for the implementation of a demand response strategy. In the system configuration and operation commissioning stage, we ensure the reliability and effectiveness of the system in actual operation through detailed functional testing, system integration testing, performance optimization and safety verification. This process involves not only technical tuning, but also prediction and influence of participants’ behavior.
In the process of effect evaluation and improvement suggestions, this study defined a series of key performance indicators and used actual operating data to quantify and analyze. The results show that energy suppliers in operating model 1 have the most significant benefits, however, as passive price recipients, they do not have the flexibility to adjust their selling prices to energy operators in re-sponse to changes in purchases, which may limit the realization of their profit potential. Under Mode 4, renewable energy operators achieve the highest profits. The proposed demand response strategy can significantly improve the utilization rate of renewable energy, enhance the load regulation capacity of the power grid, and improve the economic benefits. Based on the evaluation results, we propose a series of improvement measures, including parameter optimization, technology upgrading, strategy adjustment, user education and market mechanism reform, etc., in order to further improve the operational performance of the system. In summary, this study not only theoretically expands the application of master-slave game in the field of demand response, but also demonstrates its potential in renewable energy integration in practice. However, this study does not consider the participation of renewable energy sources outside the combined cooling, heating and power system, such as wind power and photovoltaic power in demand response, and the objective function of ES and EO demand response strategies will change according to the increase of dependent variables, which will have different impacts on the subject. In the future, with the integration of more advanced technologies and policy support, such demand response strategies are expected to be implemented on a wider scale, making important contributions to the realization of smart grids and the construction of sustainable energy systems.
The original contributions presented in the study are included in the article/supplementary material, further inquiries can be directed to the corresponding author.
WH: Writing–original draft. YL: Writing–original draft. PD: Writing–original draft. JL: Writing–original draft.
The author(s) declare that financial support was received for the research, authorship, and/or publication of this article. This research received Shanghai Yangfan Program (23YF1414300).
Author JL was employed by Economic and Technological Research Institute of State Grid Fujian Electric Power Co., Ltd.
The remaining authors declare that the research was conducted in the absence of any commercial or financial relationships that could be construed as a potential conflict of interest.
All claims expressed in this article are solely those of the authors and do not necessarily represent those of their affiliated organizations, or those of the publisher, the editors and the reviewers. Any product that may be evaluated in this article, or claim that may be made by its manufacturer, is not guaranteed or endorsed by the publisher.
Ahmad, F., and Fagih, A. L. (2024). Travel behaviour and game theory: a review of route choice modeling behaviour. J. Choice Model., 50100472. doi:10.1016/j.jocm.2024.100472
Alomari, M. H. A. (2024). Game theory in entrepreneurship: a review of the literature. J. Bus. Socio-economic Dev. 4 (1), 81–94. doi:10.1108/jbsed-01-2023-0005
Benjamin, C. C., and Mustafa, K. (2024). A game theoretic decision-making approach to reduce mine closure risks throughout the mine-life cycle. Impact Assess. Proj. Apprais. 42 (1), 43–55. doi:10.1080/14615517.2023.2299619
Cao, Y., Ren, W., and Yue, L. (2024). Environmental regulation and carbon emissions: new mechanisms in game theory. Cities 149, 104945. doi:10.1016/j.cities.2024.104945
Capraro, V., Paolo, D. R., Perc, M., and Pizziol, V. (2024). Language-based game theory in the age of artificial intelligence. J. R. Society,Interface 21 (212), 20230720. doi:10.1098/rsif.2023.0720
Carreño, L. R., Ikumi, T., Fuente, L. D. A., Galeote, E., and Pujadas, P. (2024). Neural network - game theory coupled approach for predicting flexural performance of fibre-reinforced concrete. J. Build. Eng. 86, 108909-. doi:10.1016/j.jobe.2024.108909
Christmann, R., and Klein, D. (2024). Game theory, compliance, and corporate criminal liability: insights from a three-player inspection game. Decis. Anal. J. 11, 100431. doi:10.1016/j.dajour.2024.100431
Cong, P., Guanbing, H., Fulin, H., Yuehan, L., and Xiaohan, H. (2024). Frequency stability analysis of new power system under the integration of high proportion of renewable energy. Electron. components Inf. Technol. 8 (01), 154–156+166. doi:10.19772/j.cnki.2096-4455.2024.1.040
Fischer, R., and Toffolo, A. (2024). Game theory-based analysis of policy instrument consequences on energy system actors in a Nordic municipality. Heliyon 10 (4), e25822. doi:10.1016/j.heliyon.2024.e25822
Guang, C., Fei, X., Bo, H., Ling, H., Lei, C., Guiping, Z., et al. (2021). Research on synergistic performance and combination design of integrated coupling of renewable energy and thermal power. Power Grid Technol. 45 (06), 2178–2191. doi:10.13335/j.1000-3673.pst.2021.0110
Haitao, W., Pan, Z., Heng, L., Zhong, B., Guo, S., Fung, I. W. H., et al. (2024). Blockchain impact on construction quality management and its adoption analysis: a game theory–based method. J. Constr. Eng. Manag. 150 (6). doi:10.1061/jcemd4.coeng-14306
Hongli, Y., Dandan, Z., Tingting, W., and Hong, Y. (2024). Optimal scheduling method of low-carbon energy supply chain based on machine learning and game theory. J. Phys. Conf. Ser. 2728 (1), 012007. doi:10.1088/1742-6596/2728/1/012007
Hu, B. (2024). Game theory analysis of corporate donations in the context of emergencies. Management 7 (1). doi:10.31058/J.MANA.2024.71001
Jiang, W., Han, H., He, M., and Gu, W. (2024). When game theory meets satellite communication networks: a survey. Comput. Commun. 217, 217208–217229. doi:10.1016/j.comcom.2024.02.005
Jixun, L. (2024). Integrated application of renewable energy and energy-saving technology in modern urban buildings. Foshan Ceram. 34 (03), 90–92.
Li, C., Wu, H., Lu, Y., Xiong, L., Dong, C., and Li, J. (2024a). Smart contract-based right-of-way trade with game theory in blockchain-enabled internet of vehicles. Appl. Sci. 14 (6), 2492. doi:10.3390/app14062492
Li, W. W., Gu, B. X., Yang, C., and Zhao, C. (2024b). Level evaluation of concrete dam fractures based on game theory combination weighting-normal cloud model. Front. Mater. 11. doi:10.3389/fmats.2024.1344760
Liu, L., Mao, W., Li, W., Duan, J., Liu, G., and Guo, B. (2024a). Edge computing offloading strategy for space-air-ground integrated network based on game theory. Comput. Netw. 243, 243110331. doi:10.1016/j.comnet.2024.110331
Liu, Q., Xu, X., Zhang, S., and Wang, M. (2024c). Dynamic assessment of seawater quality based on semi-partial subtraction set pair potential method and game theory. Environ. Monit. Assess. 196 (2), 223. doi:10.1007/s10661-024-12346-2
Ruilin, W., Jie, S., and Hui, H. (2022). A systematic review of the integration and complementarity of renewable energy and coal-fired power generation. Clean. coal Technol. 28 (11), 10–18+4. doi:10.13226/j.issn.1006-6772.RE22101901
Shaohua, Y., Keng-Weng, L., Hongxun, H., and Yulin, C. (2024). Secure distributed control for demand response in power systems against deception cyber-attacks with arbitrary patterns. IEEE Trans. Power Syst. 39 (6), 7277–7290. doi:10.1109/tpwrs.2024.3381231
Tu, L. (2024). Tripartite game analysis of zunyi pepper industry chain based on game theory. Agric. & For. Econ. Manag. 7 (1). doi:10.23977/AGRFEM.2024.070103
Xuanyue, S., Zhicheng, M., Xiuli, W., Hui, G., and Han, Z. (2023). Research on optimal operation of shared energy storage and integrated energy microgrid based on master-slave game theory. Power Syst. Technol. 47 (02), 679–690. doi:10.13335/j.1000-3673.pst.2021.2191
Xingmou, L., Yuan, Z., Ning, Y., Yao, X., and Jadoon, A. (2024b). Game theory guided data-driven multi-entity distribution network optimal strategy. Eng. Lett. 32 (4).
Yang, S., Lao, K.-W., Hui, H., Chen, Y., and Wang, S. (2025). Secure frequency regulation in power system: a comprehensive defense strategy against fdi, DoS, and latency cyber-attacks. Appl. Energy 380, 124772. doi:10.1016/j.apenergy.2024.124772
Ye, F., Xu, H., and Gao, J. (2024). Relay selection in Underwater Acoustic Sensor Networks for QoS-based cooperative communication using game theory. Comput. Commun. 219, 104–115. doi:10.1016/j.comcom.2024.03.003
Keywords: renewable energy, demand response, master-slave game, bi-level optimization, optimal scheduling of demand response resources
Citation: Hu W, Li Y, Du P and Li J (2025) Research on master-slave game theory-based demand response strategies for renewable energy integration. Front. Energy Res. 13:1501537. doi: 10.3389/fenrg.2025.1501537
Received: 25 September 2024; Accepted: 09 January 2025;
Published: 04 February 2025.
Edited by:
Haifeng Qiu, Nanyang Technological University, SingaporeReviewed by:
Shiyu Liu, Shanghai University of Political Science and Law, ChinaCopyright © 2025 Hu, Li, Du and Li. This is an open-access article distributed under the terms of the Creative Commons Attribution License (CC BY). The use, distribution or reproduction in other forums is permitted, provided the original author(s) and the copyright owner(s) are credited and that the original publication in this journal is cited, in accordance with accepted academic practice. No use, distribution or reproduction is permitted which does not comply with these terms.
*Correspondence: Yining Li, bHluNzM4NkAxNjMuY29t
Disclaimer: All claims expressed in this article are solely those of the authors and do not necessarily represent those of their affiliated organizations, or those of the publisher, the editors and the reviewers. Any product that may be evaluated in this article or claim that may be made by its manufacturer is not guaranteed or endorsed by the publisher.
Research integrity at Frontiers
Learn more about the work of our research integrity team to safeguard the quality of each article we publish.