 Taiyu Gu
 Yidong Zhu
 Ye Tian1
 Yanhong Cheng
- 1State Grid Liaoning Electric Power Co., Ltd., Shenyang, Liaoning, China
- 2Electric Power Technology Collaboration, Beijing, China
With the increasing integration of a high proportion of renewable energy, the fluctuation characteristics of distributed power generation such as wind and photovoltaic energy affect the safe and stable operation of the power system. Improving the operational resilience of the distribution network is of great significance for ensuring reliable power supply and improving user satisfaction with electricity consumption. In this paper, a multi objective day-ahead resilience improvement method for distribution network is proposed. Firstly, a detailed mathematical model of distribution network and its internal components was established; then, taking into account the economic costs of network loss and wasted renewable power punishment, as well as voltage safety margin indicators, a multi-objective optimization model is given, and the multi-objective optimization problem is transformed into a single objective optimization problem through the weight method. Meanwhile, considering the uncertainty of both source and load sides, a clear equivalence class method is adopted to transform the uncertain optimization problem into a deterministic optimization problem. Due to the existence of nonlinear and non-convex terms in the model, in order to reduce computational complexity, particle swarm optimization (PSO) algorithm is used to achieve the optimal solution. Finally, the effectiveness and feasibility of the proposed method are demonstrated with the modified IEEE-33 node testing system.
1 Introduction
With the integration of a large number of distributed power sources into the power system, the volatility and fluctuation of photovoltaic and wind power generation have caused serious interference to the safe and stable operation of power system (Liu et al., 2016; Liao et al., 2023). The time-varying characteristics of power demand in the load side increase the burden of reliable operation of the power system. On this condition, actual operation of the power system needs to withstand a large number of random disturbances. In order to cope with the interference of this random disturbance and ensure the safe operation of the power network, the concept of power system resilience is proposed (Kushal and Illindala, 2021). Power system resilience refers to the ability of the power system to maintain normal operation without collapsing or splitting under continuous random disturbances (Mahzarnia et al., 2020; Lei et al., 2018).
The research on resilience assessment methods for distribution networks is still in its early stages, and there is no unified definition of assessment methods and resilience indicators. Ma et al. (2022) proposed an indicator that reflects the resilience of distribution networks from a temporal perspective; Panteli et al. (2015) designed a toughness evaluation method that considers wind speed level and load capacity; Min et al. (2012) considered the resilience calculation method under the simultaneous action of multiple disaster weather conditions; He et al. (2022) conducted research on urban resilient power grids from several aspects, such as adaptability in response to extreme events; Xu et al. (2021) proposed an operational resilience assessment method for distribution networks with sensitive loads; Yu et al. (2022) evaluated the resilience of each partition of the distribution network through the feeder partitioning method. Although the above references considered different toughness indicators, none of them considered the impact of high permeability distributed power sources. In order to improve the ability of the distribution network to withstand disasters under extreme weather conditions and reduce the severity of system load losses, it is necessary to adopt certain resilience enhancement methods to ensure that normal power as much as possible (Zhou et al., 2018a; Yong et al., 2022) considered the impact of extreme natural disasters and enhanced the resilience of the distribution network by forming initial isolated islands and utilizing demand response technology; Zhou et al. (20211) proposed a method for improving the resilience of AC/DC hybrid distribution networks by line reinforcement and energy storage resource allocation; Tao et al. (2022) proposed a distribution network resilience improvement planning method using stochastic optimization with information gap theory. At present, traditional planning methods such as strengthening high probability fault lines are mostly considered for improving the resilience of distribution networks. Due to limited investment costs, the effectiveness of traditional methods is limited.
Establishing comprehensive quantitative resilience indicator and diversified resilience assessment methods under various extreme events is an important theoretical basis for system resilience analysis. A single resilience indicator can only measure system resilience from a certain aspect and each indicator is interdependent, so resilience assessment should be considered as a multi-attribute decision-making problem with inherent correlation (Ruan et al., 2020). The current research on quantitative indicators of distribution network resilience mainly includes two types: static indicators and dynamic indicators (Su et al., 2022): A static index system based on network topology factors refers to quantitative indicator of distribution network topology resilience that combines network seepage theory and complex network analysis (Chen et al., 2019; Chanda and Seivastava, 2016). Regarding the diversity of static indicators, Bajpai et al. (2018) used Choquet integral to aggregate fuzzy measures of different resilience indicators, and combined graph theory to obtain the comprehensive values. From the perspective of dynamic indicators, Panteli et al. (2017) proposed quantitative indicator values for toughness triangle and trapezoidal models based on the missing area of function curve under a single extreme event. In response to the uncertainty and complexity of fault scenarios caused by multiple attacks, Monte Carlo simulation (Li et al., 2020) and information entropy method (Zhou et al., 2018b) were used to extract the set of fault scenarios, and probabilistic quantitative indicators such as expected values and probability distributions were used for resilience evaluation (Andersson et al., 2021). A multi-stage mapping evaluation model for distribution networks was established based on the multi-dimensional dynamic characteristics of resilience quantification indicators, and a toughness evaluation index that comprehensively was proposed in Qing et al. (2021), Li et al. (2022), Zhang et al. (2021a) introduces a model for restoring services in unbalanced distribution systems and microgrids dominated by inverters, incorporating constraints on frequency dynamics to enhance load restoration and ensure the system’s frequency response performs optimally throughout the restoration phase; in the study presented in Zhang et al. (2021b), a two-phase stochastic mixed-integer linear programming approach is introduced to streamline the preparation and allocation of resources in anticipation of forthcoming extreme weather events, ultimately facilitating swifter and more effective restoration efforts following such events. Despite remarkable results being achieved, the aforementioned method is still limited by computational complexity.
To address the aforementioned issues, this paper proposes a multi-objective day-ahead resilience improvement method for distribution networks, considering the uncertainty of both load and source sides. The main innovations of this paper can be summarized as follows:
(1) In response to the impact of the fluctuation of distributed generation on the safe and stable operation of power systems, this paper introduces a multi-objective day-ahead resilience improvement method. This method comprehensively considers economic costs of network losses, penalties for wind and solar curtailment, and voltage security margin indicators to construct a multi-objective optimization model. By using a weighting method, the multi-objective optimization problem is converted into a single-objective optimization problem, thereby achieving a comprehensive improvement in the resilience of distribution networks.
(2) Taking into account the uncertainty on both the source and load sides, this paper adopts a clear equivalence class method to transform uncertain optimization problems into deterministic optimization problems. This effectively addresses the issue of how to handle uncertainty factors during the optimization process, improving the accuracy and practicality of the optimization results and reducing the conservativeness of traditional robust optimization methods.
The research framework of this paper is as follows: Firstly, a mathematical model of the distribution network and its internal components is established in Section 2.1. Based on the analysis of Section 2.1, a multi-objective optimization model is established by comprehensively considering the economic cost of network loss, wasted renewable power punishment, and voltage safety margin indicators. In Section 3, the solution method for the proposed resilience improvement strategy is given. Considering the uncertainty of both source and load ends, the clear equivalence class method is introduced in Section 3.1, which converts uncertain optimization problems into deterministic optimization problems. Considering the nonlinear and nonconvex characteristics of the model, PSO algorithm is used to determine the optimal solution. Finally, the effectiveness and feasibility of the proposed method are demonstrated through an modified IEEE33 node system.
2 Mathematical model for improving the resilience of distribution networks
2.1 Introduction to cloud model
2.1.1 Power supply related constraints
Wind power and photovoltaic power stations can output active power while quickly and continuously compensating for dynamic reactive power. Their participation in distribution network optimization scheduling requires consideration of power factor limitations and inverter capacity constraints, as shown in Equations 1–3.
Here,
2.1.2 Modeling of power consumption on the load side
Some distribution network loads, such as central air conditioning and electric ve-hicles, have strong controllability and can achieve cross temporal and spatial transfer of electricity consumption, with good peak shaving and valley filling effects. Equation 4 represents the power regulation capacity constraints of controllable loads partici-pating in the coordinated scheduling of multiple flexible resources, while Equation 5 represents that the total electricity consumption of controllable loads remains un-changed during a certain period of time.
Here,
2.1.3 Modeling of energy storage system
To protect the service life of energy storage system (ESS) and prevent excessive charging and discharging, ESS needs to consider its own state of charge and balance constraints [as shown in (Equation 6)] and charging and discharging power constraints [as shown in (Equation 7)] when adjusting the flexibility of charging and discharging.
Here,
2.1.4 Operation constraints of distribution network
For distribution networks, operational constraints mainly include power flow constraints, power balance constraints, node voltage and current related constraints, and power purchase constraints, which are given as follows. Firstly, the power flow constraint is shown in Equation 8:
Here, Pij,t and Qij,t represent the active and reactive power of branch ij, respectively; gij and bij represent the conductivity and susceptance of branch ij, respectively; bC,ij represents the ground admittance of branch ij;
The power balance constraint is shown in Equation 9:
Here,
Meanwhile, node voltage and branch current constraints should also be satisfied, as shown in Equations 10–12:
Equation 12 provides the calculation method for line current. As shown in Equation 12, the active power, reactive power flowing through the line, and the node voltage all have an impact on the line current.
Finally, the distribution network is connected to the upper power grid through the root node, and in some scenarios with heavy load, the safe operation of the distribution network can be met by purchasing electricity from the upper network. The purchasing electricity amount constrains are shown in Equation 13:
Here,
2.2 Objective function for resilience enhancement of distribution networks
For distribution networks, the common scheduling goal is to minimize network losses. On the other hand, as the proportion of renewable energy access in the distribution network continues to increase, in order to improve the level of renewable energy consumption, waste renewable power penalty fees have been added, as shown in Equation 14:
In Equation 14,
Here, A and B represent the transmission matrix parameters of the distribution network; α represents the complex angle value of parameter A; β represents the complex angle value of parameter B; δ represents the phase angle difference of the voltage at both ends;
Here, Z1 and Z2 represent assignment factors. When system dispatchers pay more attention to network loss, Z1 can be assigned a larger value. Similarly, when dispatchers are more concerned about the voltage safety of the distribution network, Z2 can be assigned a larger value. In other words, the objective function f1 here represents the economic level and f2 focuses more on the safety aspect. In this paper, the values of Z1 and Z2 are set to 0.5, achieving a balance between system safety and economy.
3 Solving algorithm
3.1 Clear equivalence class transformation method
In the power balance constraint Equation 9, both the power consumption on the load side and the output of renewable energy have certain uncertainties and cannot be directly solved. In this section, we first relax the strict power balance constraint into a chance constraint form using fuzzy chance constraints, and then adopt the clear equivalence class method to transform the uncertain optimization problem into a deterministic optimization problem for solution. The specific steps are as follows:
As shown in Figure 1, this paper adopts trapezoidal fuzzy number, in the figure r1, r2, r3, r4 represent membership parameters and H (rn) represents membership function. The specific mathematical expression is shown in Equation 18:
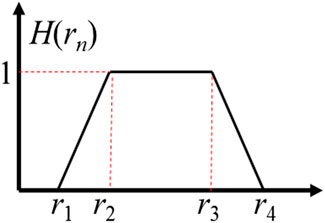
Figure 1. Trapezoid fuzzy number used in this paper.
With the help of trapezoidal fuzzy number, original strict power constraint Equation 9 can be relaxed as (Equation 19):
Then, considering the value of confidence level r in this paper is larger than 0.5, (Equation 20) is satisfied and the corresponding proof of sufficiency and necessity can refer to literature (Zhang et al., 2022).
According to (Equations 20, 21) can be obtained.
Next, the relaxed constraints (Equation 19) be written in a compact form as (Equation 22). Here, x represents decision variables,
More generally, g (x,
Here,
According to the addition and multiplication rules of fuzzy programming, (Equation 26) can be written in an expanded form as (Equation 27).
We substitute (Equation 27) into (Equation 21), and the original chance constraints (Equation 19) can be translated into clear equivalence class model (Equation 28).
Through the above processing, the uncertain optimization problem is transformed into a deterministic optimization problem for solution.
3.2 PSO algorithm
By using the clear equivalence class method, the initial uncertain optimization problem is transformed into a deterministic optimization problem. However, it essentially belongs to mixed integer nonlinear optimization problems, which have a significant computational burden. In order to facilitate the solution, we use the PSO algorithm for fast solution. The specific solution process includes the following steps:
(1) Establish a high-dimensional solution space for the optimal scheduling of distributed power sources, purchased electricity amount, and energy storage devices.
(2) Initialize particle swarm parameters. Under the premise of ensuring the stable operation of the distribution network and meeting the constraints, generate appropriate basic parameters such as the number and position of particles, particle motion speed, etc. Set the number of iterations m = 1 at the beginning.
(3) Evaluate the fitness of particles. On the premise of reducing active power loss and improving voltage stability in the distribution network, judge whether the power balance in the distribution network is met.
(4) Update the velocity and direction of particles in contemporary particle swarm, and continue to search for new particles that meet the conditions for the next-generation.
(5) Update the number of iterations m = m+1, and proceed to step (4).
(6) Determine whether the particle swarm optimization algorithm converges. Check the fitness in the particle swarm, output the optimal calculation result, terminate the iteration, otherwise continue with the iterative calculation.
(7) Store the optimal particle data in the solution space matrix established in (1), and obtain the output data of the reactive power compensation device and energy storage device.
To gain a better understanding, the specific solution process is shown in Figure 2.
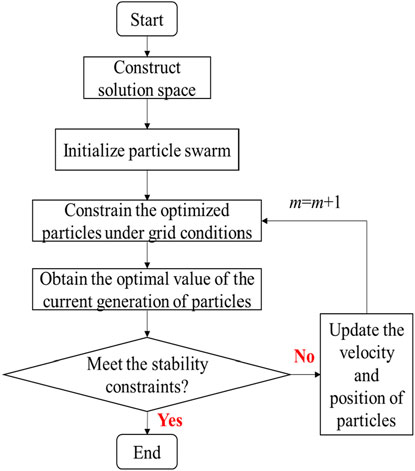
Figure 2. Schematic diagram of particle swarm optimization solution.
4 Case study
In this section, an modified IEEE-33 node system is used for case validation. The testing system includes multiple distributed power sources (wind power and photovoltaic), with three energy storage systems. The distribution network is connected to the upper power network through the root node, and during periods of power shortage, electricity can be purchased from the upper power grid to meet the demand for electricity supply; similarly, the local distribution network can also choose to sell electricity to the upper power grid to achieve profitability. The topology of modified IEEE-33 node system is shown in Figure 3. Other information including load power and renewable energy output are shown in Figures 4, 5, respectively.
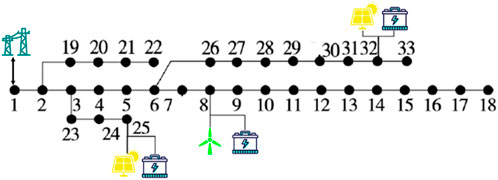
Figure 3. The topology of modified IEEE-33 node system.
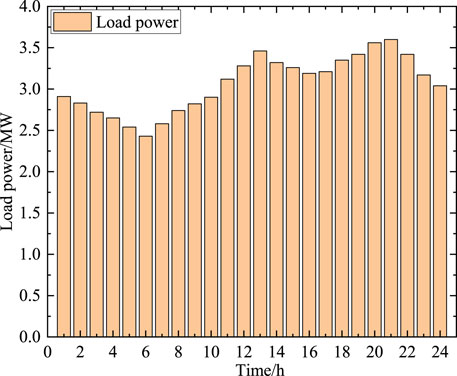
Figure 4. Detailed data of load power.
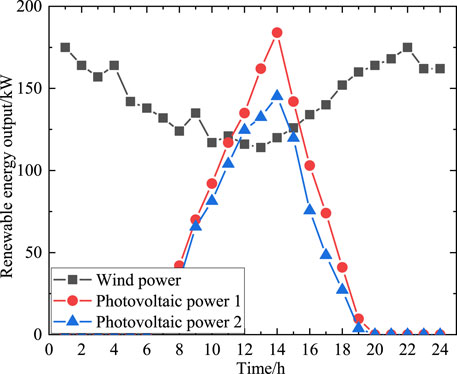
Figure 5. Detailed data of renewable energy output.
The reconstruction of distribution networks is currently widely adopted to reduce network losses. In order to more intuitively demonstrate the effectiveness of the proposed method, two comparative cases are set up for analysis:
Method 1: The Multi objective day ahead resilience improvement method for distribution network proposed in this paper considers the coordinated scheduling of multiple flexible resources.
Method 2: The method proposed in Zhang et al. (2022) adopts a dynamic reconfiguration strategy for the distribution network.
Through analysis, the renewable energy consumption rate of the proposed method is 93.86%, while the renewable energy consumption rate of method 2 is 87.12%. This also demonstrates the advantages of the proposed method. The proposed method can fully utilize the flexibility of the source and load sides, economically and efficiently improve the level of renewable energy consumption, while avoiding the damage to mechanical equipment caused by the traditional distribution network reconstruction strategy. Figure 6 shows the shift ratio of controllable load using different methods. By observing Figure 6, it can be obtained that during the periods of 1: 00–5: 00 and 19: 00–24: 00, when wind power output is high, the shift rate of controllable loads is higher. Increasing the load power consumption during these periods can effectively reduce the wind abandonment rate. On the other hand, compared to Method 2, the proposed method has a lower controllable load shift rate because ESSs participate in scheduling, avoiding frequent adjustments to the user’s electricity consumption behavior, which is beneficial for improving the user’s electricity consumption experience. In fact, ESS has the highest flexibility in power system scheduling. ESS has a dual identity, and when the energy storage device is discharged, it can be considered as a power source; when the energy storage device is charged, it can be considered as a load. The participation of ESS in power system scheduling will significantly improve the scheduling flexibility of the system. Figure 7 shows the charging and discharging power of different ESSs. During periods of high output of renewable energy, ESSs are used to charge and store renewable energy that cannot be absorbed by power grid. During peak load periods, ESSs release power to meet the load electricity demand, reduce the demand for electricity from the upper power grid, and thus reduce overall operating costs.
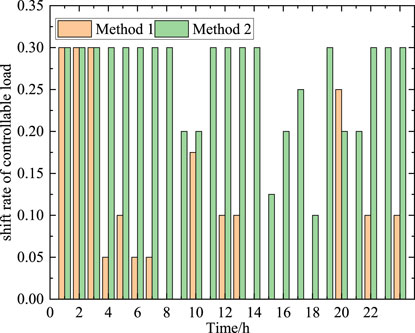
Figure 6. Shift ratio of controllable load using different methods.

Figure 7. Charging and discharging power of different ESSs.
Meanwhile, the optimization scheduling strategy proposed in this paper not only considers active power, but also reactive power. By implementing reactive power compensation, the voltage level of nodes can be improved, and the operational risks caused by unstable renewable energy output can also be reduced. A certain number of capacitor banks are installed in the distribution network. Each group of capacitors has a capacity of 200 MVar and is equipped with 5 sets of capacitors at nodes 7, 24, and 30. The number of capacitor banks put into operation during the dispatch process of the distribution network is shown in Figure 8.
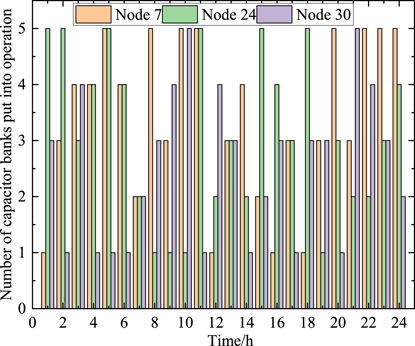
Figure 8. Number of capacitor banks put into operation.
The network loss during 24 h are shown in Figure 9. From Figure 9, it can be seen that by using the reactive power compensation equipment obtained from the optimization results, the network losses in the distribution network can be obtained. Adding reactive power compensation equipment can reduce network losses of the distribution network by approximately 1 MW at each time period. The voltage amplitude of the wind power node is also shown in Figure 10. As shown in Figure 10, while ensuring the safe, economic and stable operation of the distribution network, capacitor banks put into operation also increases the voltage amplitude of wind power generation nodes, ensuring the reliability of power supply.
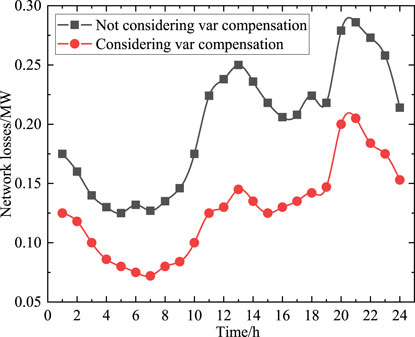
Figure 9. Network losses in the distribution network.
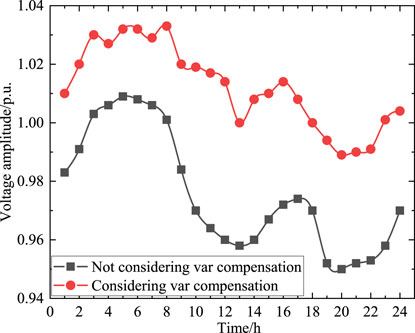
Figure 10. The voltage amplitude of the wind power node.
Voltage stability is an important index of the resilience of power systems. After calculating the values of node voltage and current in the network, the voltage stability index can be obtained. The voltage stability index of the distribution network are shown in Figure 11. From Figure 11, it can be seen that the voltage stability of the entire distribution network is significantly improved after the addition of reactive power compensation devices and energy storage devices. After the participation of compensation devices, the voltage stability fluctuations tend to flatten out, and the value of voltage stability index fluctuate between 0.001 and 0.002. Compared to the drastic fluctuations in voltage stability of the distribution network before the participation of compensation equipment, the quantitative index of voltage stability fluctuate between −0.006 and 0.002. From the perspective of voltage stability, compensation equipment has a significant effect on improving the resilience of the distribution network.
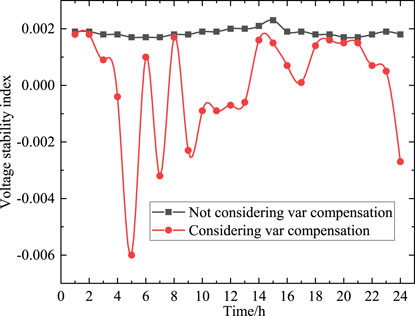
Figure 11. The voltage stability index of the distribution network.
Comparisons with some commonly used methods are also added, including the reactive power compensation voltage control method (Method A) (Win et al., 2015), dynamic reconfiguration of distribution networks (Method B) (Luo et al., 2024), load demand response method (Method C) (Rabiee et al., 2019), a multi-objective method based on stochastic optimization (Method D) (Xie et al., 2021), and a multi-objective optimization algorithm based on the box-type robust model (Method E) (Melgar-Dominguez et al., 2022). The relevant calculation results are shown in Table 1 below.
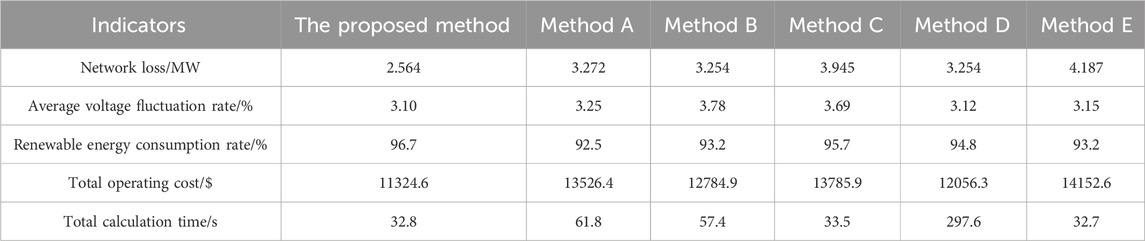
Table 1. Comparison of indicators under different methods.
Observing the above table, it can be seen that the method proposed in this paper achieves a balanced effect across various indicators. Compared with Method A, the proposed method reduces network losses by 27.6% while the calculation time is only half of that of Method A. This is mainly because Method A adjusts voltage by regulating steady-state reactive power, introducing integer variables such as the switching status and number of capacitor banks, which further increases computational complexity. Additionally, Method A adjusts voltage from the perspective of reactive power balance, whereas renewable energy integration is more often regulated through active power, leading to a lower renewable energy absorption rate under Method A. Similarly, Method B enhances the reliability and resilience of distribution network operation through dynamic reconfiguration, but it introduces a large number of 0–1 variables to describe the switching status of lines, especially for large-scale distribution networks with numerous lines, resulting in extremely high computational complexity. Method C guides orderly electricity consumption through demand response strategies, encouraging loads to consume more electricity during periods of high renewable energy output to improve renewable energy absorption rates. However, it should be noted that when load power consumption increases, the power transmission demand on distribution network lines also increases, leading to an increase in system network losses. Compared with the proposed method, Method C increases network losses by 53.9%. Meanwhile, for the load side, as China still uses a long-term fixed time-of-use electricity pricing mechanism, to assist in renewable energy absorption, the load side needs to increase electricity consumption during periods of higher electricity prices, requiring the system to provide additional compensation, which increases system operating costs. From the perspective of uncertainty handling, this paper adopts a fuzzy chance-constrained method to deal with uncertainty. Fuzzy chance-constrained programming does not require precise modeling of the probability distribution of random variables, but instead uses fuzzy sets to describe uncertainty. This reduces the need for a large amount of historical data, thereby simplifying data collection and processing. Method D requires generating a large number of scenarios to simulate uncertainty, while fuzzy chance-constrained programming directly handles uncertainty through fuzzy sets and chance constraints without generating numerous scenarios, thus reducing computational effort. Fuzzy chance-constrained programming can convert uncertainty into deterministic constraints and obtain decision-making solutions by solving optimization problems under these constraints. This process is relatively straightforward and efficient, avoiding the complex scenario combinations and optimization solutions that may be involved in scenario-screening-based stochastic optimization algorithms. Method E ensures that decisions are valid under all possible uncertainty scenarios by setting a boundary for uncertainty (i.e., a box set). This method often leads to overly conservative decisions because it ignores the diversity and probability distribution of uncertainty in actual situations. In contrast, fuzzy chance-constrained programming allows decisions to satisfy constraints within a certain confidence level, thereby reducing the conservativeness of decisions.
To quantitatively describe the impact of Z1 and Z2 on the objective functions, Figure 12 presents the results of voltage fluctuation and total operating cost under different weight factors. Observing the figure below, it can be found that there is an approximately linear increasing relationship between the average voltage fluctuation rate and Z1. The larger the value of Z1, the better the system’s economy and the lower the total operating cost. For system decision-makers, during periods of heavy load or significant fluctuations in renewable energy, reducing the value of Z1 can provide a larger margin of safety for voltage stability. In conventional scenarios, such as light load conditions where the risk of voltage instability is lower, increasing the value of Z1 can be considered to achieve better economic efficiency.
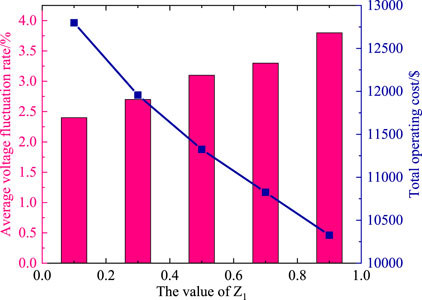
Figure 12. Analysis of indicators under different assignment factors.
5 Conclusion
In this paper, a multi objective day-ahead resilience improvement method for distribution network is proposed. Firstly, a detailed mathematical model of distribution network and its internal components was established; then, taking into account the economic costs of network loss and wasted renewable power punishment, as well as voltage safety margin indicators, a multi-objective optimization model is given, and the multi-objective optimization problem is transformed into a single objective optimization problem through the weight method. Through case analysis of the IEEE-33 node testing system, the following conclusions can be drawn:
(1) Adding ESSs and reactive power compensation devices into the distribution network to mitigate the impact of such random interference, keeping the node voltage around 3% of the rated voltage, ensuring that nodes do not experience significant fluctuations, and improving the resilience of the distribution network.
(2) The clear equivalence class method and PSO algorithm are used to model and solve the 33 node distribution system. In the established distribution network resilience improvement model, by comparing the active power loss, the data showed that the network losses in the distribution network decreased by approximately 0.03 MW during each time period.
(3) In the calculation results, the voltage stability index of the distribution network fluctuates smoothly within the range of 0.001–0.002, ensuring the safe and stable operation of the distribution network.
Data availability statement
The raw data supporting the conclusions of this article will be made available by the authors, without undue reservation.
Author contributions
TG: Conceptualization, Methodology, Software, Writing–original draft, Writing–review and editing. YZ: Conceptualization, Methodology, Validation, Writing–original draft, Writing–review and editing. YT: Writing–original draft, Writing–review and editing. XC: Conceptualization, Investigation, Software, Supervision, Writing–original draft, Writing–review and editing. YC: Conceptualization, Data curation, Methodology, Validation, Writing–original draft, Writing–review and editing. WG: Conceptualization, Formal Analysis, Validation, Writing–original draft, Writing–review and editing.
Funding
The author(s) declare that financial support was received for the research, authorship, and/or publication of this article. This work is supported by the Science and Technology Project of State Grid Corporation of China (Research on Standard Demand Analysis and System Construction Technology of New Distribution System, No. 5108-202218280A-2-368-XG).
The funder was not involved in the study design, collection, analysis, interpretation of data, the writing of this article, or the decision to submit it for publication.
Conflict of interest
Authors TG, YZ, and YT were employed by State Grid Liaoning Electric Power Co., Ltd. Authors XC, YC, and WG were employed by Electric Power Technology Collaboration.
Publisher’s note
All claims expressed in this article are solely those of the authors and do not necessarily represent those of their affiliated organizations, or those of the publisher, the editors and the reviewers. Any product that may be evaluated in this article, or claim that may be made by its manufacturer, is not guaranteed or endorsed by the publisher.
References
Andersson, J., Grassi, V., Mirandola, R., and Perez-Palacin, D. (2021). A conceptual framework for resilience: fundamental definitions, strategies and metrics. Computing 103 (4), 559–588. doi:10.1007/s00607-020-00874-x
Bajpai, P., Chanda, S., and Seivastava, A. K. (2018). A novel metric to quantify and enable resilient distribution system using graph theory and Choquet integral. IEEE Trans. Smart Grid 9 (4), 2918–2929. doi:10.1109/tsg.2016.2623818
Chanda, S., and Seivastava, A. K. (2016). Defining and enabling resiliency of electric distribution systems with multiple microgrids. IEEE Trans. Smart Grid 7 (6), 2859–2868. doi:10.1109/tsg.2016.2561303
Chen, X., Qiu, J., Reedman, L., and Dong, Z. Y. (2019). A statistical risk assessment framework for distribution network resilience. IEEE Trans. Power Syst. 34 (6), 4773–4783. doi:10.1109/tpwrs.2019.2923454
He, W., Wang, S., Xu, T., Shen, H., Su, Y., Liu, Z., et al. (2022). Construction and development path of the urban resilient distribution network. Power Syst. Technol. 46 (2), 680–690.
Kushal, T. R. B., and Illindala, M. S. (2021). Decision support framework for resilience-oriented cost-effective distributed generation expansion in power systems. IEEE Trans. Industry Appl. 57 (2), 1246–1254. doi:10.1109/tia.2020.3047595
Lei, S., Hou, Y., Qiu, F., and Yan, J. (2018). Identification of critical switches for integrating renewable distributed generation by dynamic network reconfiguration. IEEE Transactions on Sustainable Energy, 10 August 2017 (IEEE), 420–432.
Li, Z., Wang, F., Guo, W., et al. (2020). Resilience evaluation of smart distribution network in extreme weather. Automation Electr. Power Syst. 44 (9), 60–68.
Li, Z., Zhao, B., Lin, D., et al. (2022). Optimal allocation strategy of demand response for improving distribution network elasticity. Electr. Power Autom. Equip. 42 (7), 143–149.
Liao, C., Li, Y., Ma, J., Zhou, N., Yu, H., Cao, Y., et al. (2023). A resilience evaluation method considering power source ability and network topology of power systems. IEEE Syst. J. 17 (3), 3527–3538. doi:10.1109/jsyst.2023.3273922
Liu, Y., Wu, Q. H., and Zhou, X. X. (2016). Co-ordinated multiloop switching control of DFIG for resilience enhancement of wind power penetrated power systems. IEEE Trans. Sustain. Energy 7 (3), 1089–1099. doi:10.1109/tste.2016.2524683
Luo, F., Bu, Q., Ye, Z., Yuan, Y., Gao, L., and Lv, P. (2024). Dynamic reconstruction strategy of distribution network based on uncertainty modeling and impact analysis of wind and photovoltaic power. IEEE Access 12, 64069–64078. doi:10.1109/access.2024.3394856
Ma, L., Wang, H., Lu, Z., et al. (2022). Flexible resource planning for improving distribution network resilience under typhoon disasters considering relevance impact. Automation Electr. Power Syst. 46 (7), 60–68.
Mahzarnia, M., Moghaddam, M. P., Baboli, P. T., and Siano, P. (2020). A review of the measures to enhance power systems resilience. IEEE Syst. J. 14 (3), 4059–4070. doi:10.1109/jsyst.2020.2965993
Melgar-Dominguez, O. D., Quijano, D. A., Mantovani, J. R. S., and Chicco, G. (2022). A robust multiobjective strategy for short-term distribution system upgrading to increase the distributed generation hosting capacity. IEEE Trans. Power Syst. 37 (6), 4352–4364. doi:10.1109/tpwrs.2022.3155934
Min, O. Y., Duenasosorio, L., and Xing, M. (2012). A three-stage resilience analysis framework for urban infrastructure systems. Struct. Saf. 36/37, 23–31.
Panteli, M., Mancarella, P., Trakas, D. N., Kyriakides, E., and Hatziargyriou, N. D. (2017). Metrics and quantification of operational and infrastructure resilience in power systems. IEEE Trans. Power Syst. 32 (6), 4732–4742. doi:10.1109/tpwrs.2017.2664141
Panteli, M., Mancarella, P., Wilkinson, S., Dawson, R., and Pickering, C. (2015). “Assessment of the resilience of transmission networks to extreme wind events in 2015 IEEE eindhoven PowerTech (IEEE), 1–6.
Qing, Q., Han, B., Li, G., et al. (2021). Multi-Stage elastic mechanical modelling and evaluation of distribution networks with soft open point. Trans. China Electrotech. Soc. 36 (21), 4444–4458.
Rabiee, A., Mohseni-Bonab, S. M., Parniani, M., and Kamwa, I. (2019). Optimal cost of voltage security control using voltage dependent load models in presence of demand response. IEEE Trans. Smart Grid 10 (3), 2383–2395. doi:10.1109/tsg.2018.2797103
Ruan, Q., Xie, W., Xu, Y., Hua, B., Song, P., He, J., et al. (2020). Concept and key features of resilient power grids. Proc. CSEE 40 (21), 6773–6783.
Su, Y., The, J., Bai, Z., et al. (2022). Review of research on resilience of distribution network with massive resources considering uncertainty disturbance. Automation Electr. Power Syst. 46 (16), 17–30.
Tao, R., Zhao, D., and Wang, H. (2022). Planning method for resilience enhancement of distribution network based on information gap decision theory. Automation Electr. Power Syst. 46 (9), 32–41.
Win, T. S., Hisada, Y., Tanaka, T., Hiraki, E., Okamoto, M., and Lee, S. R. (2015). Novel simple reactive power control strategy with DC capacitor voltage control for active load balancer in three-phase four-wire distribution systems. IEEE Trans. Industry Appl. 51 (5), 4091–4099. doi:10.1109/tia.2015.2437972
Xie, Y., Li, Z., Wu, Y., Zhou, S., and Zhang, Y. (2021). “Multi-objective stochastic optimization planning method based on microgrid,” in 2nd International Conference on Artificial Intelligence and Computer Engineering (ICAICE), Hangzhou, China, 632–636. doi:10.1109/icaice54393.2021.00125
Xu, Y., Li, B., Sun, J., et al. (2021). Evaluation of voltage sag management in distribution network based on operation resilience assessment. Automation Electr. Power Syst. 45 (5), 104–110.
Yong, W., Li, Y., and Cao, Y. (2022). Research on improvement technology of distribution network resilience based on demand response. Power Demand Side Manag. 24 (2), 20–26.
Yu, A., Jin, B., and Wang, Y. (2022). Energy storage planning strategy for improving resilience of distribution network under typhoon weather. Proc. CSU-EPSA 34 (8), 60–67.
Zhang, Q., Ma, Z., Zhu, Y., and Wang, Z. (2021b). A two-level simulation-assisted sequential distribution system restoration model with frequency dynamics constraints. IEEE Transactions on Smart Grid, 09 June 2021 (IEEE) 3835–3846.
Zhang, Q., Wang, Z., Ma, S., and Arif, A. (2021a). Stochastic pre-event preparation for enhancing resilience of distribution systems. Renew. Sustain. Energy Rev. 152, 111636. doi:10.1016/j.rser.2021.111636
Zhang, T., Huang, M., Liu, K., et al. (2022). Optimal scheduling of regional comprehensive energy systems considering source load uncertainty and variable operating conditions. Smart Power 50 (08), 109–117.
Zhou, S., Liu, X., Xiong, Z., Wang, X., Jiang, C., Zhang, S., et al. (2021). Line hardening and energy storage system configuration strategies for resilience enhancement of a hybrid AC-DC distribution system. J. Shanghai Jiao Tong Univ. 55 (12), 1619–1630.
Zhou, X., Ge, S., Li, T., and Liu, H. (2018a). Assessing and boosting resilience of distribution system under extreme weather. Proc. CSEE 38 (2), 505–513.
Keywords: resilience improvement, distribution network, multi objective optimization, clear equivalence class method, particle swarm optimization (PSO) algorithm
Citation: Gu T, Zhu Y, Tian Y, Chen X, Cheng Y and Gao W (2025) Multi-objective day-ahead resilience improvement method for distribution network with high renewable energy penetration considering uncertainty of load and source sides. Front. Energy Res. 13:1416309. doi: 10.3389/fenrg.2025.1416309
Received: 12 April 2024; Accepted: 30 January 2025;
Published: 21 February 2025.
Edited by:
Jinpeng Tian, Hong Kong Polytechnic University, Hong Kong SAR, ChinaReviewed by:
Qianzhi Zhang, Cornell University, United StatesZhenjia Lin, Hong Kong Polytechnic University, Hong Kong SAR, China
Copyright © 2025 Gu, Zhu, Tian, Chen, Cheng and Gao. This is an open-access article distributed under the terms of the Creative Commons Attribution License (CC BY). The use, distribution or reproduction in other forums is permitted, provided the original author(s) and the copyright owner(s) are credited and that the original publication in this journal is cited, in accordance with accepted academic practice. No use, distribution or reproduction is permitted which does not comply with these terms.
*Correspondence: Taiyu Gu, NzE3NTU4NjE2QHFxLmNvbQ==