- 1Northeast Branch of State Grid Corporation of China, Shenyang, China
- 2Shenyang Institute of Computing Technology, Chinese Academy of Sciences, Shenyang, China
Given the complexity and dynamic nature of short-term load sequence data, coupled with prevalent errors in traditional forecasting methods, this study introduces a novel approach for short-term load forecasting. The method integrates multi-frequency sequence feature analysis and multi-point correction using the FEDformer model. Initially, variational mode decomposition (VMD) technology decomposes the load sequence into multiple subsequences, each exhibiting distinct frequency characteristics. Subsequently, for each frequency band of the load sequence, the LightGBM algorithm quantifies the correlation between the load and various influencing factors. The filtered features are then input into the FEDformer model, providing preliminary short-term and long-term sequence prediction results. Finally, a point-by-point forecasting method based on a tree model generates multi-point load prediction results by training multiple LightGBM models. Throughout the forecasting process, a weighted threshold α is set, and a hybrid weighting method is utilized to combine the forecast results from different models, culminating in the final short-term load forecast results. Validation of the proposed hybrid model was conducted on an actual dataset from a specific area, The results exhibit higher prediction accuracy, affirming the proposed method as a novel and effective approach for short-term load forecasting.
1 Introduction
The power system holds a central position in the national economy, and with the increasing share of electricity in the global energy structure (Zhou et al., 2024; Liao and Chakrabortty, 2019; Wang et al., 2024; Zhang, 2024), its significance has become more prominent. However, the issue of supply and demand imbalance during the power dispatching process is not uncommon, underscoring the criticality of power load forecasting. Accurate power load forecasting serves two major purposes: firstly, it effectively bridges the demand on the power side with the output on the power supply side, thereby providing vital support in addressing various dispatching challenges. Secondly, it significantly enhances the operational efficiency, safety, and economic benefits of the entire power system. Therefore, the research and practical application of power load forecasting hold immense practical significance and yield far-reaching social impact.
Load forecasting encompasses three distinct time spans: short-term, medium-term, and long-term. Short-term load forecasting holds particular significance due to its close correlation with daily climate variations. Given the significant impact of weather conditions on power consumption, precise short-term load forecasting assumes a critical role, especially in grid dispatch and generation planning.
In the realm of short-term load forecasting, a multitude of forecasting techniques have been developed by experts and scholars, leading to noteworthy outcomes. As artificial intelligence research progresses rapidly, conventional prediction approaches are being eclipsed by AI algorithms. The adoption of AI algorithms for comprehensive analysis has become a dominant trend in the industry.
Representative prediction methods in short-term load forecasting include support vector regression (SVR) (Tan et al., 2020), artificial neural network (ANN) (Li et al., 2015), and extreme learning machine (Mao et al., 2012). Additionally, artificial intelligence technologies, such as tree ensemble algorithms (Zheng et al., 2023) and deep learning (Wang et al., 2019), have demonstrated exceptional prediction capabilities in short-term power load forecasting. These advancements provide robust support for precise decision-making within the power industry.
Shi et al. (2018) proposes a prediction method based on deep structured multi-task learning. Shi and Zhang (2019) introduces a stacking-based prediction method that greatly improves prediction accuracy. Guo et al. (2022) presents a combined load forecasting approach based on the BiLSTM model for multi-task learning. Tang et al. (2023) proposes a two-stage short-term adaptive prediction method. Bu et al. (2023) proposes a hybrid short-term load forecasting model based on the CGAN-CNN neural network. Jiang et al. (2023) analyzes the similarity of power loads and proposes an interpretable method for similar day filtering and load prediction. Zang et al. (2021) combines self-attention mechanism with LSTM to achieve more accurate load forecasting. Chen et al. (2019) presents a short-term power load forecasting model based on deep residual networks. Zhang et al. (2021) proposes a medium- and long-term load forecasting method for group objects based on image representation learning (IRL).
While most research has concentrated on one-step load forecasting, multi-step load forecasting holds greater practical significance, particularly in electricity market bidding and spot price calculation. In the field of time series forecasting, the self-attention mechanism of Transformers has gained significant attention due to its excellent performance in modeling long and short-term dependencies (Vaswani et al., 2017). However, directly applying the original Transformer to time series modeling still faces many challenges. Among them, the most prominent issues are the high computational complexity and significant memory consumption when dealing with long sequences. To address these challenges, the academic community has proposed various variants of Transformers, such as convolutional self-attention (Li et al., 2019a), sparse self-attention (Zhou et al., 2021), attention-based deep neural network architectures (Lim et al., 2021), seasonal trend decomposition architecture (Wu et al., 2021), and frequency augmentation mechanisms (Zhou et al., 2022). These variants have not only successfully alleviated the difficulties of modeling long and short-term dependencies in practice but also significantly reduced computational complexity. Therefore, in this study, we choose FEDformer (Zhou et al., 2022), a Transformer variant with outstanding predictive performance, as the core model for load sequence modeling. By cleverly combining it with models like VMD (Liu et al., 2024) and LightGBM (Ke et al., 2017), this study achieves high-precision short-term load forecasting.
The main contributions of this paper are as follows:
1) This paper proposes an innovative method for multi-frequency sequence feature selection, combining Variational Mode Decomposition (VMD) and the LightGBM algorithm. By decomposing the original load sequence into multiple frequency components using VMD, the method quantifies the correlation between each component and candidate features using the LightGBM model, constructing more effective feature inputs. This approach not only enables in-depth exploration of hidden information in load data but also enhances prediction accuracy, providing new insights for short-term load forecasting.
2) This paper presents a point-by-point forecasting method based on tree models (POFtree). Considering that in sequence prediction, the correlation between later predicted values and historical data decreases, resulting in potentially higher errors. To address this issue, this paper trains multiple LightGBM models to perform weighted fusion based on the predictions of FEDformer, correcting the predictions made by FEDformer. This method further improves prediction accuracy, making the predictions more accurate and reliable.
3) This paper proposes a hybrid weighted fusion approach to combine the predictions of different models. For timestamps in the prediction results with differences greater than the threshold α, mean fusion is applied, while for timestamps with differences smaller than α, weighted fusion is used. This hybrid weighted fusion approach significantly reduces the impact of error amplification on the prediction results, making the final predictions more stable and reliable.
The subsequent sections of this paper are structured as follows: Section 2 offers a comprehensive introduction to the fundamental principles and pertinent techniques of the models. Section 3 delves into the design structure and implementation specifics of the hybrid model. Section 4 validates the efficacy of the proposed model through numerous simulation analyses and comparative experiments. Lastly, Section 5 summarizes the primary research findings and outlines potential future research directions.
2 Model fundamentals
2.1 Variational mode decomposition
Addressing the challenges posed by the nonlinear and non-stationary nature of load time series, conventional direct training of prediction models on raw data often falls short in capturing the intricate temporal features, thereby impacting prediction accuracy. To mitigate this, this study proposes leveraging the Variational Mode Decomposition (VMD) (Liu et al., 2024) technique to decompose multivariate load sequence data. VMD efficiently breaks down complex signals into a series of sub-sequences exhibiting diverse frequency characteristics. These sub-sequences demonstrate enhanced periodicity and stability compared to the original load sequence, rendering them more amenable to modeling and prediction tasks. Assuming the decomposition yields K modes, the corresponding constrained variational model expression is constructed as shown in Formula 1:
In the formula:
In order to obtain the optimal solution to the above variation problem, penalty factors and Lagrange multipliers are introduced to construct an enhanced Lagrangian function as shown in Formula 2.
In the formula:
2.2 FEDformer
FEDformer, as a remarkable variant of the Transformer model in time series forecasting, incorporates a core structure that includes the classical encoder-decoder architecture, along with innovative frequency domain augmentation and time series decomposition mechanisms. These advanced design elements enable FEDformer to accurately capture the underlying patterns in time series data, leading to more precise and efficient predictions when dealing with time series data.
2.2.1 FEDformer overall structure
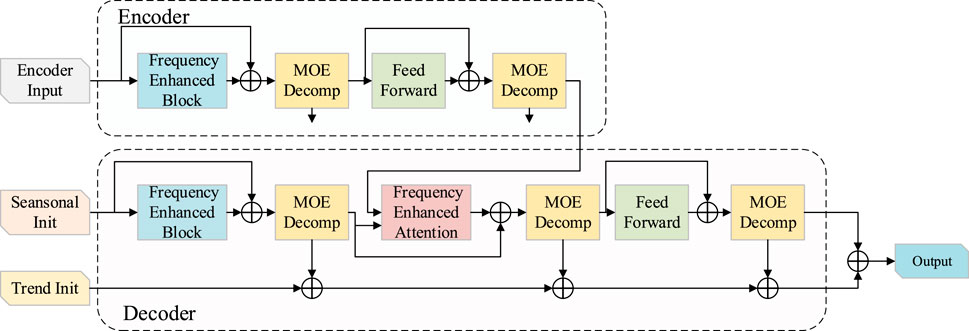
The main architecture of FEDformer cleverly utilizes the encoder-decoder structure as shown in Figure 1. Its core feature lies in the periodic-trend decomposition module, which accurately separates the sequence into periodic and trend components. It is worth noting that this decomposition is not done all at once but follows an iterative and hierarchical decomposition pattern, ensuring a more detailed and precise decomposition of the sequence.
In the processing flow of the encoder, the input signal undergoes refined processing in two decomposition layers. Each decomposition layer finely divides the signal into two major components: the periodic component and the trend component. The trend component, which has a minor impact on the overall sequence, is discarded, while the periodic component carries the main fluctuation characteristics of the sequence and is passed on to the next layer for further learning. Through layer-by-layer propagation, these periodic components are ultimately transmitted accurately to the decoder, providing strong support for subsequent prediction tasks. This can be represented as shown in Formulas 3–5:
In the formula,
In the decoder, the input undergoes a refined processing flow. It is first finely decomposed into periodic components and trend components through three decomposition layers. The periodic components, which carry the key information of the sequence’s fluctuation characteristics, are passed on to subsequent layers for deeper learning. Notably, this process introduces a Frequency Enhanced Attention (FEA) layer, which cleverly establishes the frequency domain correlation between the periodic components of the encoder and decoder. This allows the model to have a deeper understanding of the frequency domain characteristics of the sequence, enhancing the depth and breadth of learning. At the same time, the trend components are not neglected. These components are accumulated and added back to the periodic components, thus reconstructing a more complete original sequence. This design not only increases the utilization of information, enabling the model to comprehensively capture the features of the sequence but also improves the model’s inference capability, showcasing outstanding performance in time series prediction tasks. The decoding process is represented as shown in Formulas 6–10:
In the formula,
2.2.2 Frequency domain enhancement mechanism
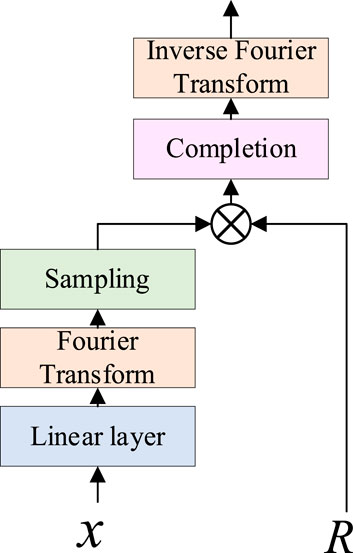
The Frequency Enhanced Block with Fourier Transform (FEB) module cleverly utilizes the Fourier transform to strengthen sequence information as shown in Figure 2. In the FEB, the sequence is first subjected to one-dimensional Fourier transform, smoothly transitioning to the frequency domain. Then, the module employs a unique weighting mechanism to finely enhance the frequency components, highlighting the key information in the sequence. Compared to traditional self-attention blocks, the introduction of FEB significantly enhances the modeling capability of the sequence, allowing the model to have a deeper understanding of the underlying patterns in the data. Finally, the enhanced sequence is returned to the time domain through inverse transformation, providing stronger support for subsequent time series prediction tasks. Its specific implementation can be represented as shown in Formulas 11, 12:
In the formula:
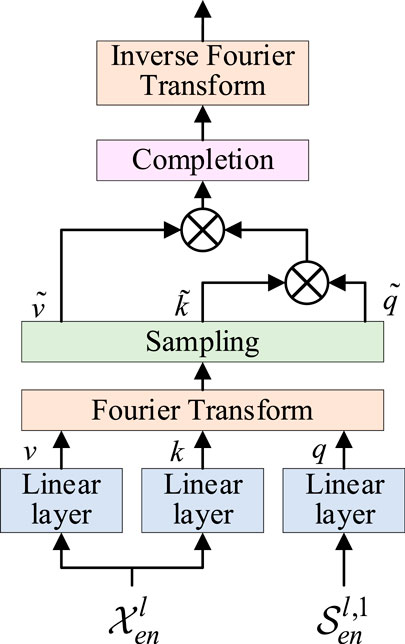
Frequency Enhanced Attention with Fourier Transform (FEA) is an attention mechanism that leverages Fourier transform to enrich sequence information as shown in Figure 3. Unlike conventional attention mechanisms, FEA maps the sequence into the frequency domain, where attention weights are calculated, thereby enhancing sequence information. FEA can substitute traditional cross-attention blocks, thereby enhancing the sequence modeling capability. Initially, the sequence undergoes one-dimensional Fourier transform to transition into the frequency domain. Subsequently, attention weights for the sequence in the frequency domain are computed. Finally, the sequence reverts to the time domain through inverse transformation, resulting in an enriched sequence. The specific implementation is outlined as shown in Formulas 13–16:
In the formula: q, k, v represent query vector, key vector and value vector respectively, and represent activation function.
2.3 LightGBM
LightGBM has made significant optimizations to the traditional boosting framework, particularly in improving computational efficiency and enhancing scalability (Ke et al., 2017).
One major innovation of LightGBM is the histogram algorithm. It cleverly discretizes continuous floating-point feature values into multiple integers and constructs corresponding histograms with appropriate widths, significantly optimizing the data processing pipeline. During the data traversal process, LightGBM accumulates statistical information in the histograms based on the discretized feature values. This not only reduces memory usage but also significantly lowers computational costs, thereby greatly improving overall computational efficiency.
LightGBM has revolutionized the growth strategy of decision trees by adopting the Leaf-wise algorithm with depth constraints, a departure from the traditional level-wise strategy. This approach selects the leaf node with the maximum split gain during each iteration, continuously refining the model for enhanced accuracy. By employing this strategy, LightGBM achieves superior error reduction with the same number of splits, thus significantly improving model performance. Additionally, LightGBM mitigates overfitting by setting a maximum depth limit.
In model parameter optimization, LightGBM utilizes Gradient-based One-Side Sampling (GOSS), a crucial technique that samples data based on gradient magnitudes. By focusing on high-gradient samples, GOSS ensures model accuracy while reducing data volume, further optimized by excluding small-gradient samples. This balance between data size and accuracy enhances LightGBM’s efficiency.
Exclusive feature bundling, a concept introduced by LightGBM, is particularly effective in sparse feature spaces. By merging mutually exclusive features that seldom take nonzero values simultaneously, LightGBM reduces feature dimensionality, thus enhancing training efficiency. This innovative approach reinforces LightGBM’s capability in handling complex data with improved efficiency and performance.
3 Hybrid model design
3.1 Hybrid weighting mechanism
Contrasted with the conventional single-point weighted method utilized for point prediction, sequence prediction yields a continuous sequence of values. As this sequence progresses, its correlation with historical data diminishes, leading to increased prediction errors towards the sequence’s end. To mitigate the cumulative error’s adverse effects on overall prediction accuracy, this paper introduces a novel hybrid weighting mechanism to finely tune the predicted results.
To address the potential decline in fusion performance caused by outliers in mean fusion, this paper proposes a hybrid weighting strategy that integrates mean fusion and weight fusion, as detailed in Formulas 17–19. Specifically, an error threshold α is introduced. When the deviation between the predicted and actual values at a given time point exceeds the threshold α, mean fusion is employed to smooth abnormal fluctuations. Conversely, when the deviation falls below the threshold α, weight fusion is applied to better capture the varying significance of data points across different time periods. This strategy ensures that the forecasting results are not only stable and reliable but also capable of accurately capturing the dynamic characteristics of the time series.
The threshold α is determined using the following formula, which quantifies the overall deviation of the 96-point prediction results produced by the two models:
In this formula,
Once the threshold α is determined, the prediction deviation for each pair of corresponding points from the two models is calculated using the following formula:
Finally, the hybrid weighting mechanism is expressed using the following formula:
In the formula, y is the prediction result after weighted combination; β is the weight value, which is taken as 0.8 in this article.
3.2 Hybrid model structure
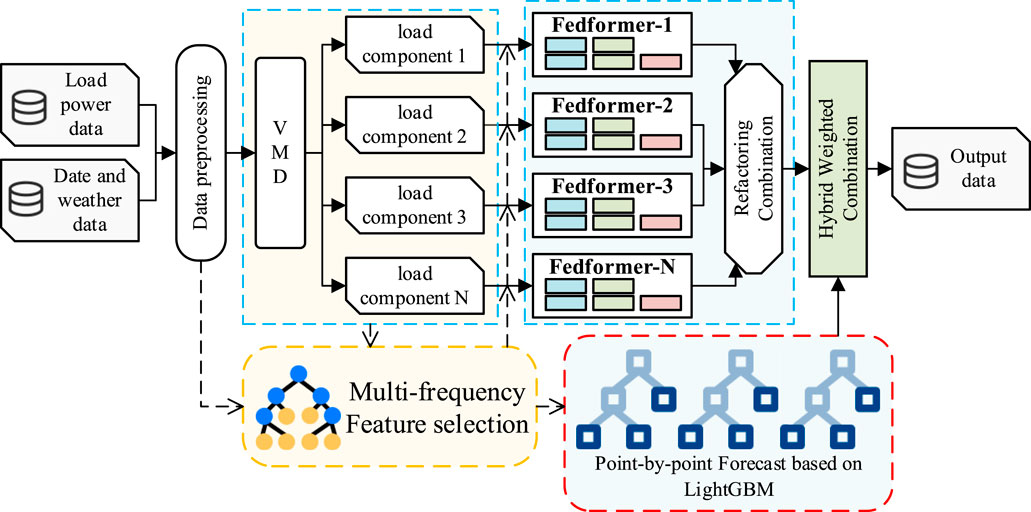
The structure of the FEDformer short-term load forecasting model based on multi-frequency sequence feature analysis and multi-point correction is shown in Figure 4. The model consists of five core modules: VMD decomposition module, multi-frequency feature analysis module, FEDformer prediction module, Point-wise prediction based on tree models (POFtree) module, and hybrid weighting module. Among them, the number of models in the FEDformer module and POFtree module matches the number of multi-frequency components obtained from VMD decomposition to ensure accurate prediction of each frequency component.
Step 1: Considering the possibility of anomalies and errors in sensor data collection, datasets often contain a large number of outliers and missing values. In order to obtain a more complete and high-quality dataset and reduce the adverse effects of these anomalies and missing values on the prediction results, we conducted rigorous data preprocessing on the original load data as well as weather data such as temperature and humidity. During the preprocessing process, we effectively removed outliers and reasonably imputed missing values, providing the model with a more reliable and accurate data foundation.
In this paper, linear interpolation is used to handle as shown in Formula 20:
In the formula, y represents the missing value, and x represents the abscissa of the missing value. y0 and x0 represent the horizontal and vertical coordinates of the first selected point respectively. Moreover, y1 and x1 represent the abscissa and ordinate of the second selected point.
Step 2: After preprocessing, we divided the data into training and testing sets. To better extract data features, accelerate the convergence speed of model training, and improve prediction accuracy, we performed normalization on the data. This operation maps the data range to the interval between 0 and 1. Normalization is applied from the beginning of the training set to the end of the testing set, ensuring that the entire dataset is analyzed and modeled on a unified scale.
Data standardization can be expressed as Formula 21:
In the formula, ymax represents the maximum value in the data set; ymin represents the minimum value in the data set; y’ represents the uninitialized actual value, and y represents the initialized value.
Step 3: We input the load power data into the VMD decomposition module to extract multiple load components with different frequencies. At the same time, the weather calendar dataset is input into the multi-frequency component feature analysis module. These two modules interact closely and dynamically construct the feature input set by calculating the feature correlations of different frequency components. This step aims to avoid introducing noise from weakly correlated features during the prediction process, which may affect the accuracy of the model.
Step 4: To save computational resources without sacrificing prediction accuracy, we feed the decomposed multi-frequency component feature data into the FEDformer prediction module for training and prediction. Simultaneously, the original combined load dataset that has not been decomposed is input into the POFtree prediction module for the same operations. The FEDformer module is specifically designed for long sequence time series prediction. It uses multi-step prediction to directly output the load power values for a future period. On the other hand, the POFtree module performs point-wise prediction based on tree models, working in a single-step prediction manner. Each LightGBM model sequentially outputs the load value for the next time point, and multiple models are used to make predictions sequentially. The final result is aggregated as the short-term power prediction value.
Step 5: We integrate the predictions from multiple FEDformer models to form preliminary long sequence short-term load predictions. Then, we use the predictions from the POFtree module to perform point-wise correction on the predictions from the FEDformer module. This correction process utilizes a hybrid weighting mechanism with the predictions from the FEDformer module as the reference. If the error between the POFtree predictions and the FEDformer predictions exceeds the set error threshold α, mean fusion is used for correction. If the error between the two is less than α, weighted fusion with a weight of β is used for correction. Finally, the corrected 96-point predictions are considered as our load power prediction results.
3.3 Error evaluation index
For accuracy evaluation, this study employs the mean absolute error (MAE), root mean square error (RMSE), and mean absolute percentage Error (MAPE) as assessment metrics. These indicators are defined as shown in Formulas 22–24:
In the formula,
4 Simulation results and analysis
4.1 Dataset description
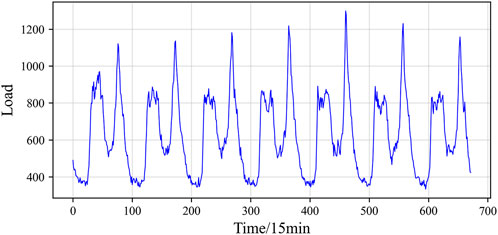
This study analyzes actual measurement data from a specific area spanning an entire year, from October 2022 to October 2023. The dataset comprises 35,040 records with a sampling interval of 15 min, encompassing electricity consumption in a specific region alongside closely associated parameters such as temperature, humidity, wind speed, and rainfall. To visually illustrate the load’s periodic characteristics, a continuous 1-week load curve commencing from midnight of a particular day was specifically chosen, as depicted in Figure 5. The figure highlights notable periodic variations in both daily and weekly loads, consistent traits observed in most power system loads.
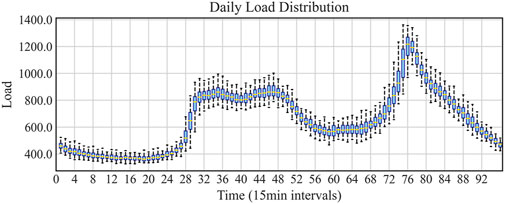
Figure 6 presents the statistical distribution of the collected dataset in a 24-h period (from midnight 0:00 to 24:00) in the form of a box plot. By careful observation, we can observe different maximum values, minimum values, medians, and quartiles for each hour’s load, which demonstrates the significant fluctuations caused by the periodic nature of the dataset. This, in turn, increases the difficulty of learning load forecasting patterns. Additionally, the box plot of the 24-h load distribution clearly reveals the load distribution within the dataset. The research results indicate significant variations in quartiles during different time periods, largely influenced by holiday electricity consumption behavior.
The dataset used in this study contains a total of 35,040 segments. To facilitate effective model training and evaluation, we divided the dataset into training, validation, and testing sets in a ratio of 60%, 20%, and 20%, respectively. This division ensures that the model has sufficient data for learning during the training process, allows for initial performance evaluation on the validation set, and ultimately tests the model’s generalization ability on the testing set.
4.2 Experimental setup
The predictive model in this study was meticulously constructed utilizing the PyTorch deep learning framework within a Python 3.11 environment. To effectively manage data and incorporate intuitive visualization capabilities, Python libraries including NumPy, pandas, Matplotlib, and sklearn were extensively utilized. The experimental setup relied on a powerful hardware platform consisting of a 12th generation Intel Core i5-12600KF CPU, 32GB of RAM, 3TB of storage capacity, and an NVIDIA GeForce RTX 4070 Ti GPU, providing robust computational support for model training and testing.
The experimental process was structured into three main phases. Firstly, we presented the outcomes of the VMD decomposition, offering a detailed analysis of the load characteristics. Secondly, we employed the LightGBM model to conduct feature correlation analysis for various components and selected features highly relevant to the prediction target. Subsequently, comprehensive comparisons were drawn between our proposed model and other advanced time series forecasting models such as LSTM, Informer, and Autoformer. This comparison encompassed the assessment of prediction accuracy across different seasons and the predictive performance for varying forecast horizons. Finally, ablation experiments were carried out to scrutinize the specific impact of VMD and POFtree on prediction accuracy, thereby furnishing comprehensive evidence regarding the effectiveness of our proposed model.
4.3 Multi-frequency sequence feature selection
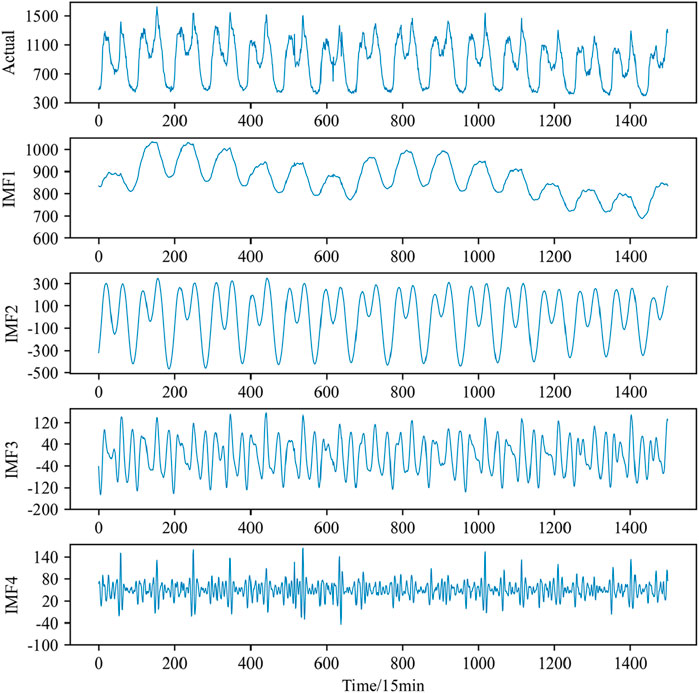
For enhanced accuracy in load value prediction, we utilized Variational Mode Decomposition (VMD) on the dataset. Figure 7 illustrates the decomposed components of the power load data following VMD processing. Default parameter settings were employed during the VMD process, with the medium bandwidth constraint set to 2000, noise tolerance set to 0, and the convergence criterion tolerance set to 10–7.
It is worth noting that the choice of the decomposition number K has a significant impact on the decomposition results and subsequent prediction performance. If K is too small, it may lead to the loss of load sequence information or mode confusion, thereby affecting the accuracy of the prediction. On the other hand, if K is too large, it may result in excessive analysis, increased computational complexity, and decreased prediction performance. Therefore, when selecting the decomposition number K, it is necessary to consider the data characteristics, computational resources, and prediction requirements in order to achieve the optimal prediction effect.
Based on empirical knowledge, we initially selected load history information, weather information, and calendar rules as input data. Specifically, the load information included the historical load data from the previous 4 h, while the weather data consisted of key information such as temperature, humidity, wind speed, and rainfall at the starting point of the prediction. Additionally, calendar rule information was incorporated, including the hour, day of the week, and whether it was a holiday, corresponding to the prediction target. The selected input information and their processing methods are detailed in Table 1.
To prevent interdependencies among continuous data and considering the periodic nature of load fluctuations, we applied one-hot encoding to features such as hour, day of the week, and holiday. Through this encoding method, we transformed these features into a discrete form that is easier for the model to process. The encoded features were then added to the input features to form the final input vector. This approach helps the model better capture the correlations between data and improves the accuracy of the prediction.
The feature contributions calculated by the LightGBM algorithm are shown in Figure 8. From the graph, it is evident that load history information has a significant impact on the prediction target. Particularly, load history data closer to the prediction target exhibits higher feature importance. The historical load data from the previous 1 h stands out as having a particularly prominent contribution. Additionally, factors such as temperature information, holidays, and weekends also have a considerable influence on electricity load.

Figure 8. (A) Original component feature correlation, (B) IMF1 component feature correlation, (C) IMF2 component feature correlation, (D) IMF3 component feature correlation, (E) IMF4 component feature correlation.
Among weather factors, temperature stands out as a crucial determinant of electrical load. During the hot summer months, rising temperatures typically lead to increased usage of air conditioning and refrigeration equipment, which, in turn, boosts electricity demand. Conversely, during cold winters, lower temperatures heighten the need for heating, particularly in regions dependent on electric heating systems. This results in a corresponding rise in electricity demand, a phenomenon that aligns with common knowledge and everyday experience. Moreover, changes in weather significantly influence people’s daily activities. For instance, on rainy weekends, individuals are more inclined to stay indoors, leading to a slight reduction in the area’s electricity load compared to days with more favorable weather.
In addition to weather factors, calendar rule information is also an indispensable element in model construction. Holidays, days of the week, and hours of the day are particularly crucial. Different time periods within a day are closely linked to people’s daily routines and production activities, exerting important influence on electricity load prediction.
It is worth noting that the calendar features such as hour and day of the week, which were one-hot encoded, appear sparse and scattered in the graph. However, this encoding method plays an indispensable role in model training, as it helps the model better capture and understand the impact of these features on the prediction target.
By conducting a meticulous analysis of the model’s feature contributions, we indirectly affirm the efficacy of the feature selection process in this study. The chosen features not only adhere to the practical demands of electricity load forecasting but also play a crucial role in enhancing the prediction accuracy and generalization capability of the model.
After an in-depth analysis of the contribution of each feature, we can conclude that feature selection helps reduce the complexity of the model from the perspective of input attributes. As shown in Figure 8, certain factors have low or zero contributions to the model construction, indicating that not all selected features have a positive impact on the model construction. Therefore, based on the feature contribution scores, this study ranked all input information from low to high and gradually removed features with low or zero contributions, retaining only the highly contributing feature information.
Based on the aforementioned processing, we established hybrid prediction models for each new subsequence and obtained output values for each prediction model. By summing these values and performing inverse normalization, we obtained the final predicted load value. This approach not only improves the accuracy of the prediction but also helps enhance the efficiency of the model’s operation.
4.4 Model comparison experiment
To further validate the effectiveness of the proposed model and ensure the fairness of the experiment, this study conducts a comprehensive comparison between the developed model and several baseline methods. Specifically, we selected three well-established models in the field of time series forecasting—LSTM, Informer, and Autoformer—as well as a hybrid model that integrates these three with VMD + POFtree, totaling six models for comparison. These models are tailored to address the challenges posed by traditional RNNs in handling long-term dependencies. Notably, the Informer and Autoformer models build upon the Transformer architecture and enhance performance through the incorporation of an attention mechanism. The predictive performance of the model proposed in this paper for typical working days and holidays is detailed in Supplementary Appendix SA1.
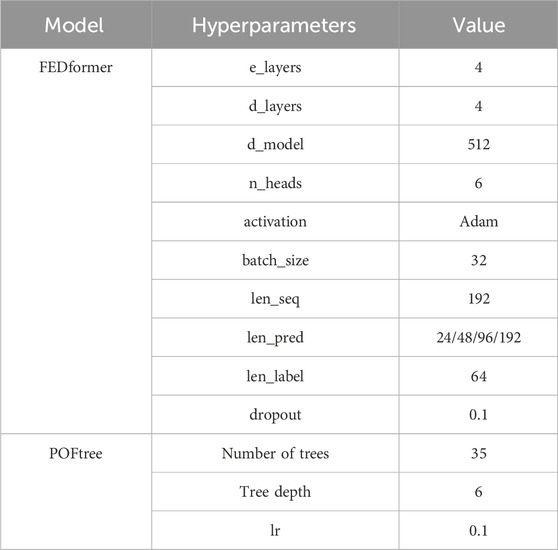
To ensure the fairness and reliability of the experiments, we carefully set the hyperparameters of the proposed model, which are detailed in Table 2. At the same time, for the other comparative models, we also performed parameter tuning to ensure that they participate in the comparison in their best states. With such settings, we can more accurately evaluate the performance of each model under the same conditions, leading to more objective and reliable conclusions.
To thoroughly verify the effectiveness and stability of the model, we meticulously selected multiple representative days across the four seasons and performed detailed load forecasts for various forecast step sizes. Specifically, we predicted load data at future intervals of 24 points (6-h steps), 48 points (12-h steps), 96 points (24-h steps), and 192 points (48-h steps), with the length of input data uniformly set to 96 points. This series of prediction experiments is designed to comprehensively evaluate the model’s performance across different prediction step sizes, ensuring broad applicability and robustness.
Figures 9, 10 provide detailed representations of the 96-point load data predictions made by different models on various typical days. From Figure 9, it is evident that the model proposed in this paper demonstrates outstanding performance across various evaluation metrics. Given the extended prediction span of 96 points, the LSTM model exhibits subpar prediction outcomes, with its prediction curve significantly deviating from the original data in both shape and timing. This underscores the tendency of RNN networks to lose information in long-term sequence prediction and their ineffectiveness in capturing sequence features, consequently leading to reduced prediction accuracy.
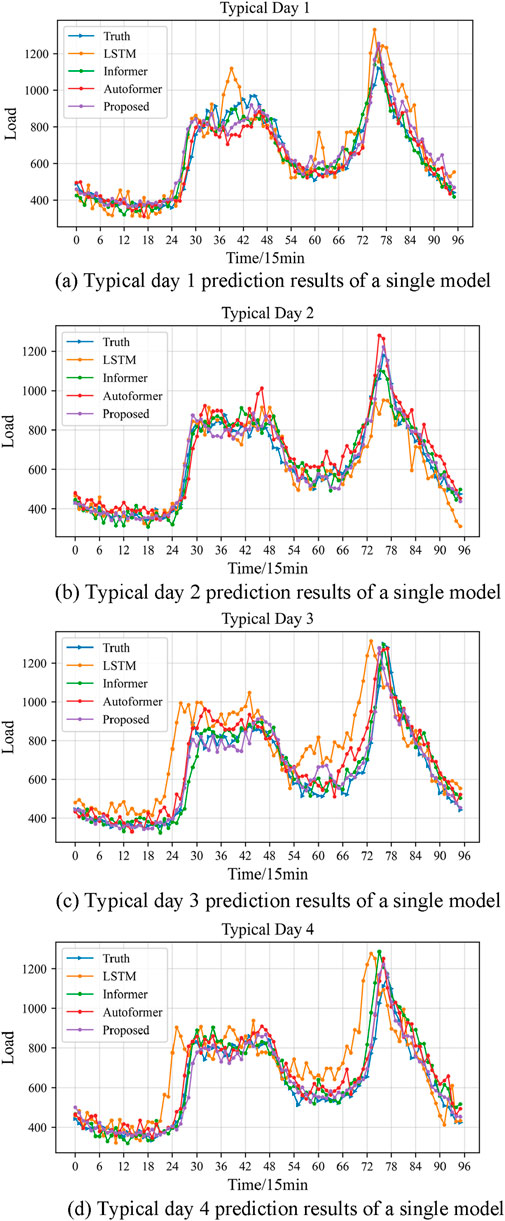
Figure 9. (A) Typical day 1 prediction results of a single model, (B) Typical day 2 prediction results of a single model, (C) Typical day 3 prediction results of a single model, (D) Typical day 4 prediction results of a single model.
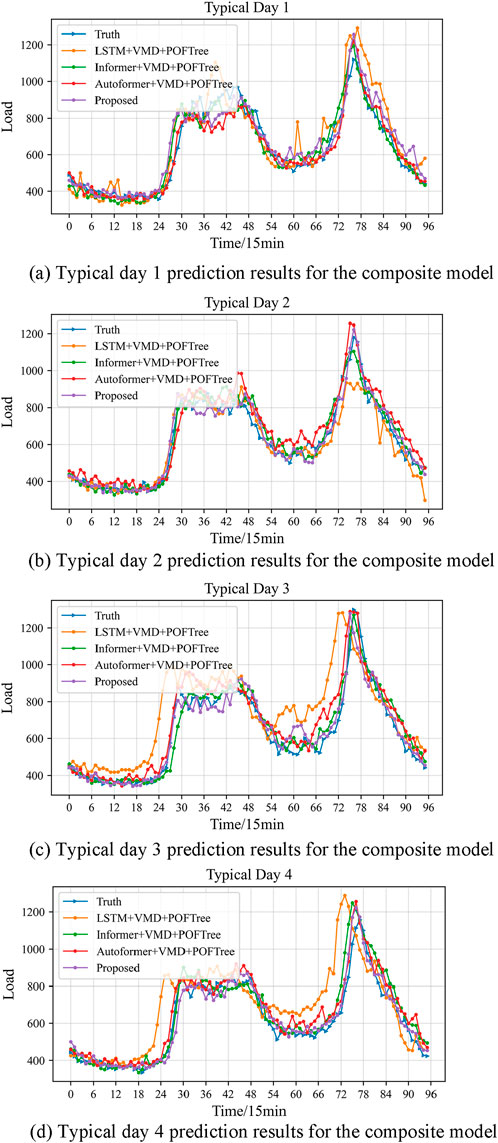
Figure 10. (A) Typical day 1 prediction results for the composite model, (B) Typical day 2 prediction results for the composite model, (C) Typical day 3 prediction results for the composite model, (D) Typical day 4 prediction results for the composite model.
Compared to others, the series of models based on the Transformer architecture demonstrate superior performance in predicting outcomes. Their prediction curves generally capture the fluctuation trends of the load data accurately, particularly at points of fluctuation. However, there remains a discrepancy in their ability to predict the amplitude of these fluctuations accurately. This indicates that while the attention mechanism excels at learning dependencies in long-term sequential data, it still has limitations in capturing the finer details of fluctuations precisely. Notably, although the prediction results of the other three Transformer-based models are relatively similar, the model proposed in this paper exhibits a distinct advantage in overall accuracy.
Observing Figure 10, it is evident that the prediction curve fitting degrees of the three models enhanced by the VMD + POFtree structure have improved over their single-model counterparts, yet they still fall short of the model proposed in this paper. The enhancement in accuracy and trend in the prediction curves can be attributed to the VMD decomposition and the point-by-point correction mechanism integrated into the model. This advantage becomes particularly notable in long-span forecasts, indicating that this model exhibits significant stability and robustness in long-term forecasting.
Overall, the model proposed in this paper demonstrates stable and realistic prediction performance. Its success is primarily due to three factors: First, the FEDformer framework incorporates a frequency enhancement mechanism and a temporal decomposition mechanism, which enable the model to better learn data features across different time scales and capture periodic patterns in the data. Second, the VMD decomposition and multi-frequency feature analysis clarify the input features, enhancing the precision and efficiency of the predictions. Lastly, the POFtree point-by-point correction mechanism effectively minimizes the cumulative error in long-sequence time series predictions, thereby further elevating the accuracy of the forecasts.
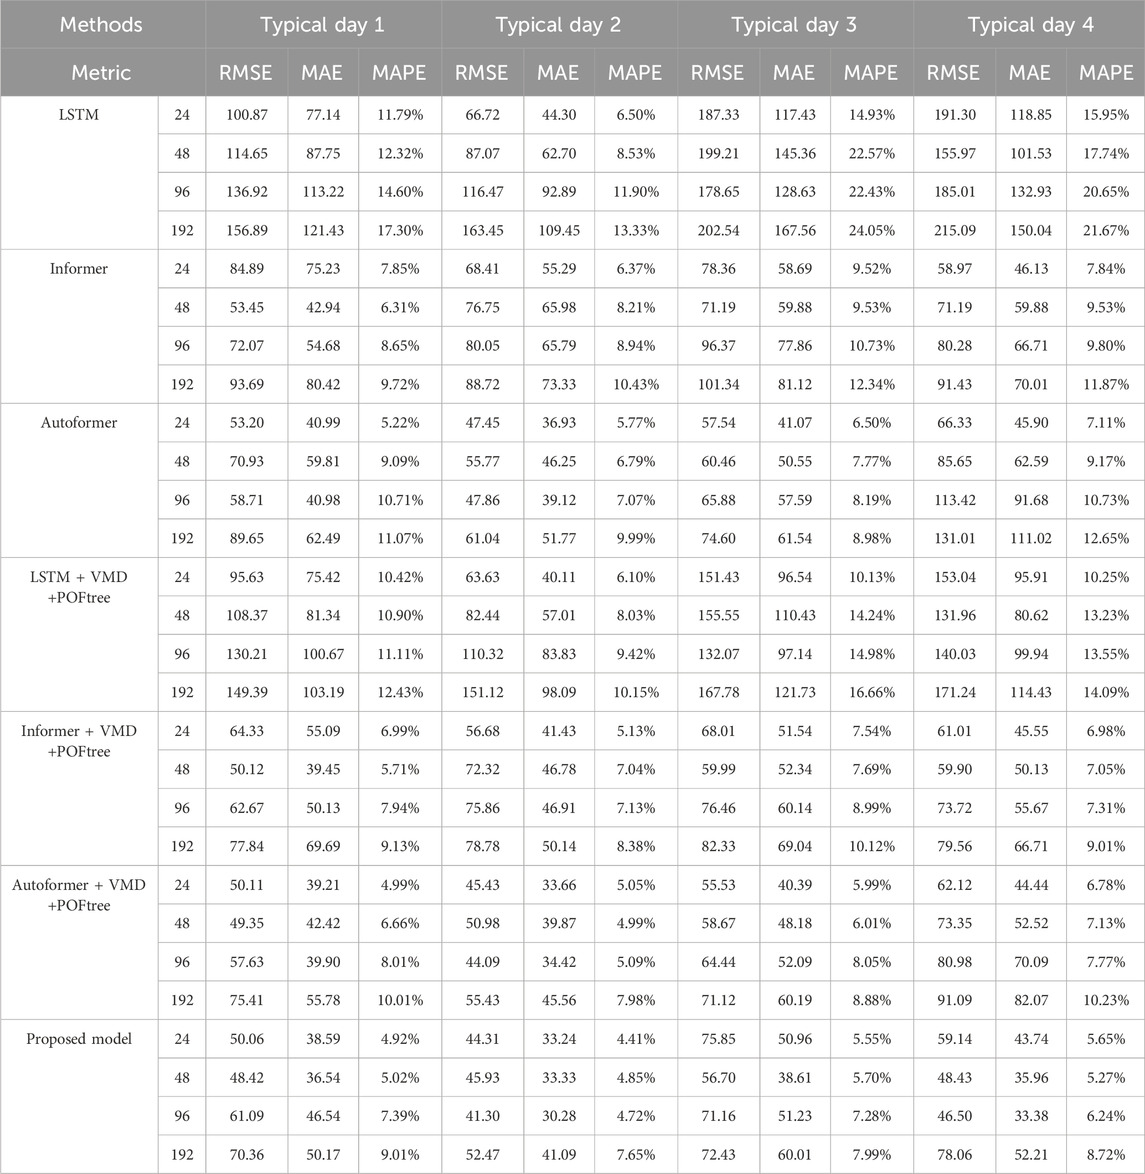
The quantitative evaluation results for each model are presented in Table 3. When compared with the other six methods, the approach proposed in this paper exhibited the highest prediction accuracy. Its forecasts not only precisely capture cyclical and long-term changes but also maintain the highest accuracy rate across various forecast step sizes on multiple typical days. Regarding the evaluation metrics—RMSE, MAE, and MAPE—the model proposed in this article achieved optimal performance.
Among all the models compared, the prediction performance of LSTM is the least effective. In contrast, the series of models based on the Transformer architecture, which utilize the attention mechanism, are more adept at capturing both long-term and short-term dependencies in time series data, resulting in better prediction performance. However, the model proposed in this paper demonstrates more substantial improvements in predicting long-term time series data, primarily due to the integration of VMD decomposition and the point-by-point correction architecture.
Taking Typical Day 2 as an example, in the 24-h 96-point prediction task, the model proposed here significantly reduced the prediction error. When compared with LSTM, the RMSE was reduced by 75.17, MAE by 62.61, and MAPE by 7.18%. When compared with the Informer model, the reductions were 38.75 in RMSE, 35.51 in MAE, and 4.22% in MAPE. Against the Autoformer, reductions were 6.55 in RMSE, 8.84 in MAE, and 2.35% in MAPE. These results underscore the significant advantages of the model proposed in this paper in terms of prediction accuracy and stability, offering an effective solution to the challenges of long-term time series prediction.
In comparing the prediction accuracy of the combined models, the model proposed in this paper shows substantial improvements. Relative to the LSTM + VMD + POFtree model, this model achieved a reduction in RMSE of 69.02, MAE by 53.55, and MAPE by 4.70%. When compared with the Informer + VMD + POFtree model, the reductions were 34.56 in RMSE, 16.63 in MAE, and 2.41% in MAPE. Even against the Autoformer + VMD + POFtree model, the new model still displayed noticeable enhancements, with RMSE reduced by 2.79, MAE by 4.14, and MAPE by 0.37%.
These results clearly demonstrate the significant strides made by the new model in reducing prediction errors, particularly in terms of accuracy and error percentage. This improvement underscores the model’s potential advantage in application scenarios where high accuracy is paramount.
Furthermore, the error distribution for each model is depicted in Figure 11. It is evident that among the three prediction indicators, the model proposed in this paper demonstrates the most favorable distribution, as illustrated by the green histogram, which is positioned on the far left of the graph. This indicates that the predictions made by this model are stable, exhibit robustness across all seasons, and achieve the highest accuracy. In contrast, the LSTM model performs the poorest, as indicated by the pink and yellow histograms, with a scattered error distribution predominantly on the right side of the graph.
Although the Informer, Autoformer, and their combined models do not perform as well as the model discussed in this paper, they still display commendable prediction effects and stability, as shown in the blue histograms.
4.5 Ablation experiment
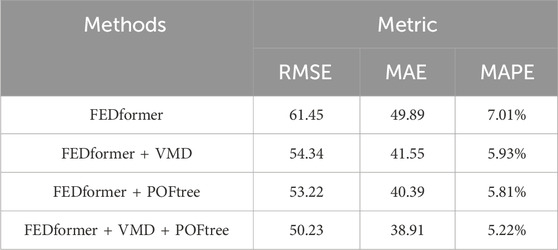
In this section, we conducted a series of ablation experiments to delve into the specific impact of VMD and POFtree’s point-wise correction mechanism on the prediction performance. To do so, we took FEDformer as the baseline model and compared it with the combinations of VMD and POFtree separately. Specifically, we tested three variants of FEDformer: FEDformer + VMD, FEDformer + POFtree, and FEDformer + VMD + POFtree.
To clearly demonstrate the effectiveness of VMD and POFtree in improving prediction performance, we specifically selected a multi-step test with a horizon of 48 as the experimental scenario. Through detailed recording of experimental data, we obtained corresponding tables and figures, as shown in Figure 12 and Table 4, to intuitively display the prediction results of each model.
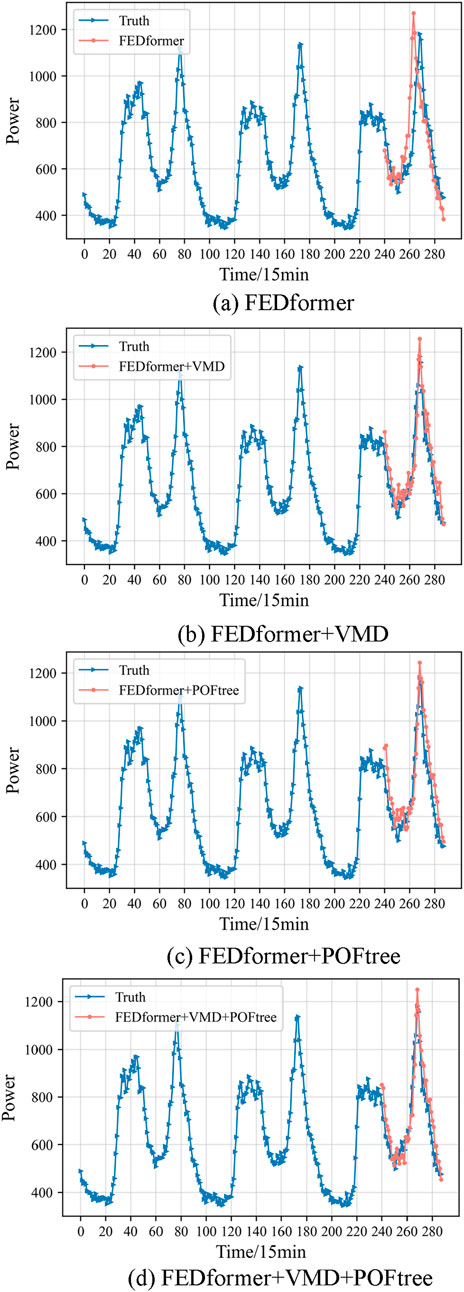
Figure 12. (A) FEDformer, (B) FEDformer + VMD, (C) FEDformer + POFtree, (D) FEDformer + VMD + POFtree.
Through in-depth analysis combining experimental data and charts, we found that both VMD and POFtree can significantly enhance the prediction performance of FEDformer. The FEDformer + VMD variant effectively improves the model’s handling of multi-frequency features by introducing VMD decomposition, thereby enhancing prediction accuracy. On the other hand, the FEDformer + POFtree variant improves prediction stability by reducing cumulative errors in long sequence forecasting through the point-wise correction mechanism.
Most notably, when we simultaneously incorporate VMD and POFtree into FEDformer, forming the FEDformer + VMD + POFtree variant, the model achieves the best prediction performance. This result fully validates the effectiveness of VMD and POFtree in improving prediction performance and demonstrates their crucial role in constructing efficient and accurate time series prediction models.
5 Conclusion
This paper proposes a short-term load forecasting method called FEDformer, which is based on multi-frequency sequence feature analysis and point-wise correction, and it has achieved significant effectiveness. Specifically, this method introduces several innovations:
Firstly, in the data preprocessing stage, this paper combines VMD and LightGBM in a novel way and proposes a new multi-frequency sequence feature selection method. By decomposing the original load sequence into multiple frequency components using VMD and utilizing the LightGBM model to measure the correlation between each component and candidate features, effective feature inputs are selected, thereby improving prediction accuracy.
Secondly, this paper presents a tree-based point-wise correction method. Considering that the correlation between subsequent values in a sequence and historical data gradually decreases, which may lead to error accumulation, this method further trains multiple LightGBM models based on the predictions of FEDformer. The predictions of FEDformer are then corrected using a weighted fusion approach, thereby further improving prediction accuracy.
Furthermore, this paper introduces a hybrid weighted fusion approach. It combines mean fusion for timestamps with significant prediction differences and weighted fusion for those with minor differences, thereby mitigating the impact of increased errors on prediction outcomes. Validation conducted on a dataset from a specific district in a specific area demonstrates the superior prediction accuracy of the proposed hybrid model.
Looking ahead, we will delve into the influence of factors such as renewable energy integration, electric vehicles, and extreme weather on load forecasting. Incorporating these factors into consideration is anticipated to enhance the accuracy of load forecasting, providing more reliable support for the stable operation and efficient management of power systems in the future.
Data availability statement
The datasets presented in this article are not readily available because they are confidential. Requests to access the datasets should be directed to the corresponding author.
Author contributions
KH: Methodology, Validation, Writing–original draft, Writing–review and editing. XZ: Writing–original draft, Writing–review and editing, Data curation, Methodology. JY: Writing–review and editing, Data curation, Methodology. JH: Conceptualization, Software, Writing–original draft. GY: Data curation, Software, Writing–review and editing. JZ: Methodology, Visualization, Writing–original draft.
Funding
The author(s) declare that no financial support was received for the research, authorship, and/or publication of this article.
Conflict of interest
Authors KH, XZ, JH, GY, and JZ were employed by Northeast Branch of State Grid Corporation of China.
The remaining author declares that the research was conducted in the absence of any commercial or financial relationships that could be construed as a potential conflict of interest.
Generative AI statement
The author(s) declare that no Generative AI was used in the creation of this manuscript.
Publisher’s note
All claims expressed in this article are solely those of the authors and do not necessarily represent those of their affiliated organizations, or those of the publisher, the editors and the reviewers. Any product that may be evaluated in this article, or claim that may be made by its manufacturer, is not guaranteed or endorsed by the publisher.
Supplementary material
The Supplementary Material for this article can be found online at: https://www.frontiersin.org/articles/10.3389/fenrg.2024.1524319/full#supplementary-material
References
Bu, X., Wu, Q., Zhou, B., and Li, C. (2023). Hybrid short-term load forecasting using CGAN with CNN and Semi-supervised regression. Appl. Energy 338 (2023), 120920. doi:10.1016/j.apenergy.2023.120920
Chen, K., Chen, K., Wang, Q., He, Z., Hu, J., and He, J. (2019). Short-term load forecasting with deep residual networks. IEEE Trans. Smart Grid 10 (4), 3943–3952. doi:10.1109/TSG.2018.2844307
Guo, Y., Li, Y., Qiao, X., Zhang, Z., Zhou, W., Mei, Y., et al. (2022). BiLSTM multitask learning-based combined load forecasting considering the loads coupling relationship for multienergy system. IEEE Trans. Smart Grid 13 (5), 3481–3492. doi:10.1109/TSG.2022.3173964
Jiang, Z., Zhang, L., and Ji, T. (2023). NSDAR: a neural network-based model for similar day screening and electric load forecasting. Appl. Energy 349 (2023), 121647. doi:10.1016/j.apenergy.2023.121647
Ke, G., Meng, Q., Finley, T., Wang, T., Chen, W., Ma, W., et al. (2017). LightGBM: a highly efficient gradient boosting decision tree. Adv. neural Inf. Process. Syst., 30.
Li, L., Wei, J., Li, C., Cao, Y., Song, J., and Fang, B. (2015). Load model prediction based on artificial neural network. J. Electr. Eng. 30 (08), 225–230. doi:10.19595/j.cnki.1000-6753.tces.2015.08.028
Li, S., Jin, X., Xuan, Y., Zhou, X., Chen, W., Wang, Y.-X., et al. (2019a). Enhancing the locality and breaking the memory bottleneck of Transformer on time series forecasting. Adv. neural Inf. Process. Syst. 32. doi:10.48550/arXiv.1907.00235
Li, S., Jin, X., Xuan, Y., Zhou, X., Chen, W., Wang, Y.-X., et al. (2019b). “Enhancing the locality and breaking the memory bottleneck of transformer on time series forecasting,” in NeurIPS.
Liao, M., and Chakrabortty, A. (2019). Optimization algorithms for catching data manipulators in power system estimation loops. IEEE Trans. Control Syst. Technol. 27 (3), 1203–1218. doi:10.1109/TCST.2018.2805294
Lim, B., Arık, S. Ö., Loeff, N., and Pfister, T. (2021). Temporal fusion Transformers for interpretable multi-horizon time series forecasting. Int. J. Forecast. 37 (4), 1748–1764. doi:10.1016/j.ijforecast.2021.03.012
Liu, W., Bai, Y., Yue, X., Wang, R., and Qi, S. (2024). A wind speed forcasting model based on rime optimization based VMD and multi-headed self-attention-LSTM. Energy 294, 130726. doi:10.1016/j.energy.2024.130726
Mao, L., Wang, Y., Liu, X., and Li, C. (2012). Short-term power load forecasting method based on improved extreme learning machine. Power System Protection and Control 40 (20), 140–144. doi:10.48550/arXiv.1608.00299
Shi, J., Tan, T., Guo, J., Liu, Y., and Zhang, J. (2018). Multi-task learning based on deep architecture for various types of load forecasting in regional energy system integration. Power Syst. Technol. 42 (3), 698–706. doi:10.13335/j.1000-3673.pst.2017.2368
Shi, J., and Zhang, J. (2019). Load forecasting based on multi-model by stacking ensemble learning. Proc. CSEE 39 (14), 4032–4041. doi:10.13334/j.0258-8013.pcsee.181510
Tan, Z., Zhang, J., He, Y., Zhang, Y., Xiong, G., and Liu, Y. (2020). Short-term load forecasting based on integration of SVR and stacking. IEEE Access 8, 227719–227728. doi:10.1109/ACCESS.2020.3041779
Tang, Y., Tang, Z., Gao, Y., Wei, L., Zhou, J., Han, F., et al. (2023). An adaptive forecasting method for the aggregated load with pattern matching. Front. Energy Res. 10, 1088100. doi:10.3389/fenrg.2022.1088100
Vaswani, A., Shazeer, N., Parmar, N., Uszkoreit, J., Jones, L., Gomez, A. N., et al. (2017). Attention is all you need. NIPS, 5998–6008. doi:10.48550/arXiv.1706.03762
Wang, D., Zhang, C., Li, J., Zhu, L., Zhou, B., Zhou, Q., et al. (2024). A novel interval power flow method based on hybrid box-ellipsoid uncertain sets. IEEE Trans. Power Syst. 39 (4), 6111–6114. doi:10.1109/TPWRS.2024.3391921
Wang, Z., Zhao, B., Ji, W., Gao, X., and Li, X. (2019). Short-term load forecasting method based on GRU-NN model. Power [8]System Autom. 43 (05), 53–58. doi:10.7500/AEPS20180620003
Wu, H., Xu, J., Wang, J., and Long, M. (2021). Autoformer: decomposition Transformers with auto-correlation for long-term series forecasting. Adv. Neural Inf. Process. Syst. 34, 22419–22430. doi:10.48550/arXiv.2106.13008
Zang, H., Xu, R., Cheng, L., Ding, T., Liu, L., Wei, Z., et al. (2021). Residential load forecasting based on LSTM fusing self-attention mechanism with pooling. Energy 229 (2021), 120682. doi:10.1016/j.energy.2021.120682
Zhang, D., Guan, W., Yang, J., Yu, H., Xiao, W., and Yu, T. (2021). Medium—and long-term load forecasting method for group objects based on the image representation learning. Front. Energy Res. 9, 739993. doi:10.3389/fenrg.2021.739993
Zhang, W. (2024). “Spatial–temporal resilience assessment of distribution systems under typhoon coupled with rainstorm events,” in IEEE transactions on industrial informatics. doi:10.1109/TII.2024.3450079
Zheng, Q., Zheng, J., Mei, F., Gao, A., Zhang, X., and Xie, Y. (2023). TCN-GAT multivariate load forecasting model based on SHAP value selection strategy in integrated energy system. Front. Energy Res. 11, 1208502. doi:10.3389/fenrg.2023.1208502
Zhou, H., Zhang, S., Peng, J., Zhang, S., Li, J., Xiong, H., et al. (2021). Informer: beyond efficient Transformer for long sequence time-series forecasting. Proc. AAAI Conf. Artif. Intell. 35 (12), 11106–11115. doi:10.48550/arXiv.2106.13008
Zhou, T., Ma, Z., Wen, Q., Wang, X., Sun, L., and Jin, R. (2022). “FEDformer: frequency enhanced decomposed Transformer for long-term series forecasting,” in International conference on machine learning. PMLR, 27268–27286. doi:10.48550/arXiv.2201.12740
Keywords: short-term load forecasting, FEDformer, VMD, time series forecasting, lightgbm, multi-point modify
Citation: Hou K, Zhang X, Yang J, Hu J, Yao G and Zhang J (2025) Short-term load forecasting based on multi-frequency sequence feature analysis and multi-point modified FEDformer. Front. Energy Res. 12:1524319. doi: 10.3389/fenrg.2024.1524319
Received: 11 November 2024; Accepted: 23 December 2024;
Published: 29 January 2025.
Edited by:
Junhua Zhao, The Chinese University of Hong Kong, Shenzhen, ChinaCopyright © 2025 Hou, Zhang, Yang, Hu, Yao and Zhang. This is an open-access article distributed under the terms of the Creative Commons Attribution License (CC BY). The use, distribution or reproduction in other forums is permitted, provided the original author(s) and the copyright owner(s) are credited and that the original publication in this journal is cited, in accordance with accepted academic practice. No use, distribution or reproduction is permitted which does not comply with these terms.
*Correspondence: Kaiyuan Hou, NjgxNTE2NDdAcXEuY29t
 Kaiyuan Hou
 Xiaotian Zhang1