- 1State Grid Sichuan Electric Power Company, State Grid Sichuan Economic Research Institute, Chengdu, China
- 2College of Electrical and Information Engineering, Hunan University, Changsha, China
As the penetration rate of renewable energy in the power grid continues to rise, the reserve criteria for traditional power grids dominated by synchronous generators (SGs) have difficulty meeting system frequency security requirements. This study proposes a frequency security-constrained optimization approach for the allocation of reserve capacity in high-penetration renewable energy grids that utilize multitype reserve resources, including SGs and nonsynchronous units, to address the frequency security issue. First, strategies and models for expanding the sources of frequency regulation reserves are analyzed, including various types of renewable energy generation, such as wind turbine (WT) curtailment and the combination of photovoltaic (PV) cells and battery storage. A refined reserve criterion is then proposed that considers multidimensional evaluation indices from both operational economy and frequency security aspects. Finally, a bilevel optimization model for reserve capacity allocation on multiple timescales that considers frequency security is constructed. The rationality and effectiveness of the proposed reserve allocation scheme were verified using a practical power grid in Southwest China.
1 Introduction
Accelerating the development of renewable energy is an important goal for achieving energy transformation and China’s dual carbon goals (Yuan et al., 2023). The installed capacity of renewable energy units in China (accounting for 53.9% of the total installed capacity) will surpass that of thermal generation units for the first time by the end of 2023 (National Development and Reform Commission of People’s Republic of China, 2023). The installed capacity of wind and photovoltaic units has exceeded 1 billion kW, and new energy sources have become the first or second largest installed power sources in 23 provinces. However, wind and solar energy generation are volatile, intermittent, and uncertain (Hakami et al., 2023). When hosting them on a large scale in a power grid, a considerable amount of additional reserve capacity must be allocated. The existing reserve capacity criteria used for traditional power grids, which primarily rely on synchronous generators (SGs), are too crude to be applicable to power grids with a high penetration of renewable energy (Hedayati-Mehdiabadi et al., 2015). Consequently, determining the optimal allocation of reserve capacity in a reasonable manner is an urgent problem.
Studies have been conducted to expand the reserve capacity sources. These studies primarily focused on retrofitting existing thermal generators and configuring new flexible resources. Various peak-shaving strategies employed during the operation of thermal generators have been analyzed to validate the advantages of their flexibility improvements (Zhao et al., 2018). Some studies have examined the impact of flexibility retrofitting schemes on the operating costs and level of accommodating renewable energy based on dispatch models involving thermal units (Garoarsdottir et al., 2018). From the perspective of peak-shaving markets, a few researchers have integrated the flexibility retrofitting of thermal power units into the market cost (Navid and Rosenwald, 2012). However, simply retrofitting thermal power units cannot effectively cope with the continuous integration of renewable energy generators and the phasing out of old thermal generators in the future. Therefore, it is essential to explore the configuration of new flexible resources to expand the sources of the system reserve capacity. For instance, coordinated planning of battery energy storage (Li and Wang, 2021), thermal storage (Gottwalt et al., 2017), and other equipment can supplement the reserve requirements of high-proportion renewable energy grids. In addition, some authors have investigated existing resources within the system, such as electric vehicles (Zhang et al., 2022) and load demand (Chen et al., 2020), and quantitatively analyzed their potential to provide reserve support (Kong et al., 2023). However, existing studies rarely consider the reserve potential of a large number of renewable energy generation units connected to the power grid, which can not only overcome the limitations of retrofitting thermal power units by leveraging their existing scale but also offer greater economic feasibility than the configuration of flexible resources.
In terms of evaluating reserve allocation, the literature mainly focuses on economic and reliability evaluations, such as determining the optimal reserve capacity based on the cost-benefit method (Ortega-Vazquez and Kirschen, 2009) and evaluating the reserve capacity demand of the system by combining the capacity outage probability table (COPT) and the expected energy not served (ENS) index of the net load prediction error (Shao et al., 2021). Liu and Tomsovic (2012) considered the uncertainty of renewable generation and load and proposed a probabilistic ENS calculation method. Based on this method, the factors of unit failure outages were embedded in the unit commitment model with reliability constraints (Lv et al., 2017). However, a considerable number of SGs are being replaced by renewable energy generators, the rotational inertia level and the frequency support capability of the power grid continue to decrease. With the same active power disturbance, the rate of change of frequency (RoCoF) and maximum frequency deviation of the system will experience a greater increase than those of traditional power grids dominated by SGs (Heylen et al., 2021). When the RoCoF and frequency deviation reach their thresholds, protection relay devices are triggered, causing large-scale power outages (Delkhosh and Seifi, 2021). Therefore, it is necessary to consider the frequency security issue when studying reserve allocation optimization to ensure sufficient frequency regulation reserves and guarantee the frequency security of power grids with high-penetration renewable generation.
Based on this background, this study describes a frequency security-constrained optimization approach for allocating multitype reserve capacity in high-penetration renewable energy grids. Strategies and models consisting of synchronous and nonsynchronous units that expand reserve sources are analyzed, and a refined reserve criterion is proposed that considers multidimensional evaluation indices from both operational economy and frequency security perspectives. A bilevel optimization model for reserve capacity allocation on multiple timescales, considering frequency security, was developed. The rationality and effectiveness of the proposed reserve allocation scheme were verified using a practical power grid in Southwest China.
2 Reserve strategy of renewable energy units participating in frequency regulation
Frequency control strategies for multitype flexible resources have been developed in response to the frequency security challenges posed by high-penetration renewable energy grids in the future (Xin et al., 2013). This section primarily focuses on the frequency control strategies for renewable energy units, which are anticipated to constitute the largest proportion of future power grids.
2.1 Wind turbine frequency regulation strategy
When there is a power shortage disturbance, wind turbine (WT) participation in system frequency regulation requires that the WT has a certain reserve available. There are two main schemes for providing frequency regulation reserves via WTs: the proportional curtailment strategy (PCS) and the constant curtailment strategy (CCS) (Karbouj et al., 2019). The primary frequency regulation reserve capacity of the WT utilizing the PCS is adjusted according to the real-time output. Equation 1 shows the curtailment capacity of the WT:
where
For the CCS scheme, only when the output power of the WT is greater than the threshold
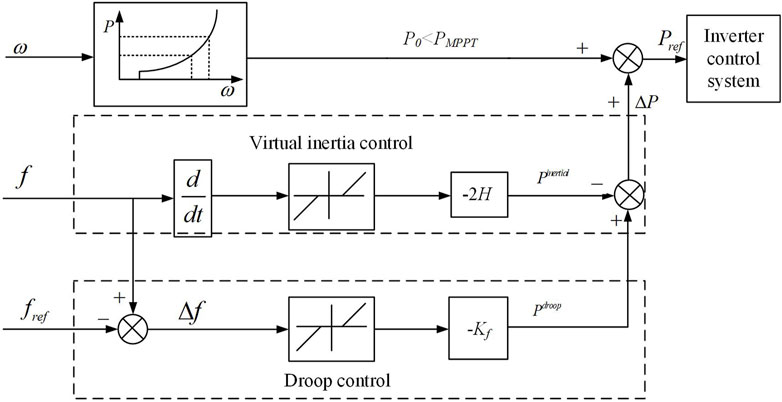
The primary frequency regulation control strategy of the WT is similar to that of the SG. A virtual synchronous generation (VSG) control strategy (Ebrahimi et al., 2019) combining virtual inertia support and primary frequency regulation is adopted here. Virtual inertia response can be expressed in terms of a first-order inertia element, and primary frequency regulation can be regarded as a droop control process. A certain proportion of the reserve capacity is reserved for the WT in normal operation conditions, and the WT increases/absorbs active power to the system through the VSG control strategy when a power disturbance occurs in the system. The detailed scheme of the VSG control strategy is shown in Figure 1. With the VSG control strategy, the change in the active power of the WT can be determined by Equation 3:
where
2.2 Photovoltaic frequency regulation strategy
To maximize the utilization of light energy, photovoltaics (PVs) typically need to provide frequency regulation reserve for the system in combination with battery storage (Rehman et al., 2021). The system frequency deviation is introduced into the battery management module of PV power stations so that the battery has the characteristics of the primary frequency regulation of the SG. Equation 4 shows the power response model:
where
3 Refined reverse criterion considering multidimensional evaluation indices
3.1 Operational economic indices
3.1.1 Total operation cost
The total operational cost of the system includes power generation, reserve, and penalty costs for the curtailment of renewable energy generation. The specific expressions are introduced in detail in Section 4.
3.1.2 Curtailment of WT/PV
The energy utilization efficiency of WTs and PVs can be quantitatively evaluated using the real-time generation penetration rate (Chen et al., 2020) and other indices. In this paper, the system’s real-time penetration rate
where
3.2 Operational security indices
3.2.1 Inertial level
The inertia level of the system at period t is expressed by the equivalent inertia constant Hsys,t of the system (Liu et al., 2021):
where
3.2.2 Multidimensional frequency indices
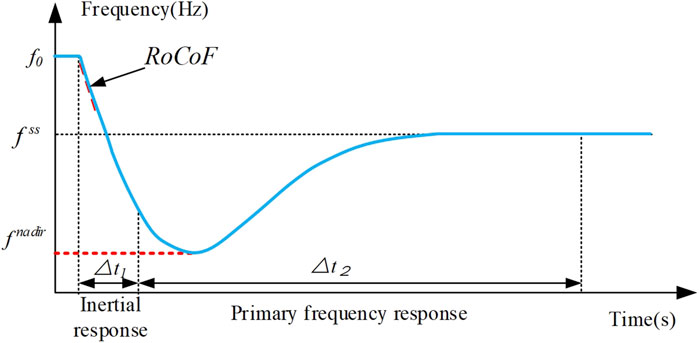
The dynamic frequency response process of a system with a disturbance is shown in Figure 2. The frequency dynamics can be expressed by Equation 10 using the rotor motion equation of the generator:
where
Assuming that the mechanical power input by the generator remains unchanged for a relatively short period after a disturbance, the initial unbalanced power of the system is the disturbance power
Considering that the power response of the generator governor responds to a power imbalance, the rotor motion equation of the generator can be modified as
where
where
Using
Assuming that the primary frequency regulation rate of the generator is constant, it can be seen from Equation 13 that the postfault system frequency deviation f(t) is a quadratic function of time. The frequency nadir will appear at tnadir when
By substituting tnadir into Equation 13, the frequency nadir of the system is
Combined with Equations 15, 16, the relationship between fnadir and tnadir can be derived as Equation 17:
The frequency nadir directly determines the actions of the protection relays. Therefore, it is necessary to restrict the system frequency nadir, fnadir, under credible contingencies:
where fUFLS is the threshold of under-frequency load-shedding protection devices. The frequency dynamics are integrated into the reserve model. The constraint of fnadir is transferred to the limitation of tnadir in Equation 18, which means that the frequency regulation of the system should have a sufficient response speed.
Combined with Equation 16, the constraints on the reserve of units participating in primary frequency regulation can be derived as
where
The frequency security limits of the power grid considered in this study are summarized as follows:
1. Maximum RoCoF limit
The RoCoF describes the speed of the system frequency change following a disturbance. To avoid exceeding the threshold
2. Frequency nadir limit
To avoid triggering the action of frequency protection relays with power loss/increase disturbance, the frequency nadir of the system should be limited using the upward reserve constraint derived in Equation 19.
3. Quasi-steady frequency limit
The quasi-steady-state frequency deviation
where D is the load damping constant of the system, and
3.3 Discussion of the proposed frequency security indices
This paper focuses on incorporating the frequency support capability for renewable energy generation units into system frequency response. However, in addition to renewable energy generation units, energy storage resources such as electrical energy storage and pumped hydro storage can provide rapid frequency support during certain periods. High-voltage direct current (HVDC) is regarded as an ideal resource for frequency support. Hence, this section discusses the applicability of the proposed frequency security indices in incorporating additional flexible resources.
The control strategy for electrical energy storage with converter interfaces participating in frequency response typically employs the VSG strategy, which is consistent with that used for WT. Considering the equivalent frequency response of pumped hydro storage units with turbine-governor dynamics, it aligns with that of hydropower units, and the expression of the latter’s frequency response control model is comparable to that of SG (Chen et al., 2022). HVDC can rapidly compensate for power shortages or surpluses within milliseconds through emergency frequency response control strategies with the frequency control model presented in Equation 22, where
4 Multiple timescale reserve capacity allocation optimization model
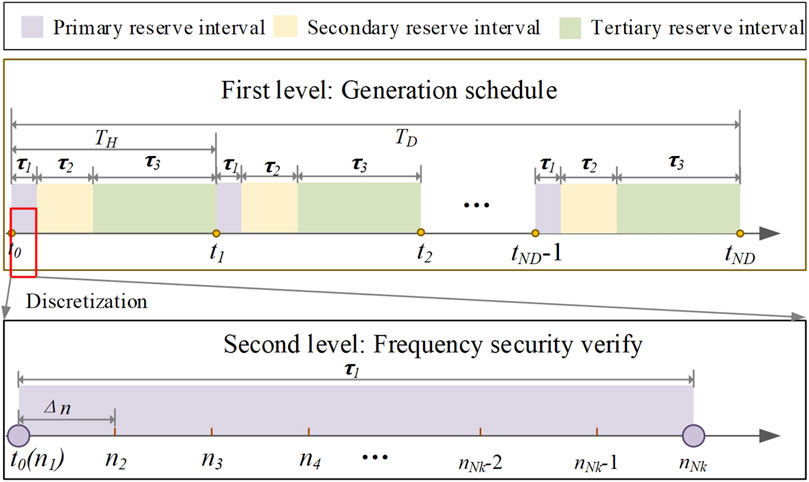
This section describes the bilevel multiple timescale reserve capacity allocation optimization model formulated in this study. The model includes a day-ahead generation schedule and intraday frequency security verification. The timescales of the different levels of the model are shown in Figure 3. Day-ahead scheduling is the first level of the model and uses 1 h as the interval to optimize the startup and shutdown of SGs and the output and reserve of all units. The second level considers the inertial response of the system and primary frequency regulation to cope with credible contingencies. The operating points of each unit determined in the first-level problem are utilized as inputs to the second level to verify the frequency security of the power grid under predefined contingencies.
4.1 Framework of the bilevel optimization model
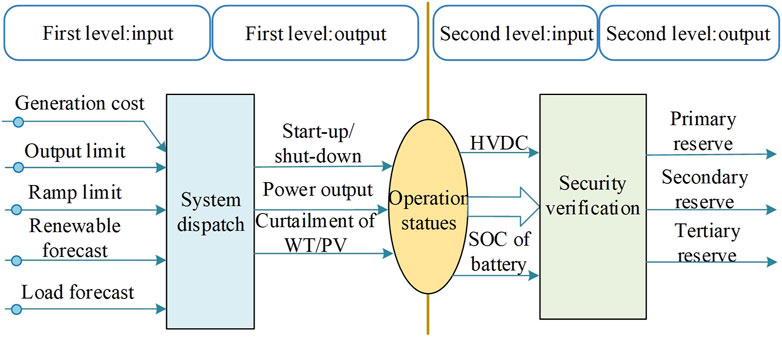
The first level of the model achieves the economic operation of the system considering system power balance and unit schedule constraints (Cui et al., 2020). The variables of the first level include the on/off state and power output of each SG unit and renewable curtailment during each dispatch period. The second level uses the operating state and real-time output of all units calculated in the first level as the input. The inertia response and primary frequency regulation of the system are considered, and the primary, secondary, and tertiary reserve capacities of the system are optimized. The framework of the reserve capacity allocation optimization model is shown in Figure 4.
4.2 Reserve allocation optimization model
Considering the power generation costs of SGs and their upward/downward reserve costs, as well as the curtailment penalty costs of renewable units incurred by setting reserves, the objective of Equation 25 is to minimize the total operating cost within the dispatch period:
where ND is the number of time intervals in the dispatch period; Ni and Nw are the number of SGs and WTs, respectively;
4.2.1 Constraints of the generation schedule level
The constraints of the generation scheduling layer include the output of various types of generations, the unit commitment of SGs, and system power balance limitations. The output limits of the generation units are expressed in Equation 26:
where
The WT must provide some power to participate in the system frequency adjustment. The reserve capacity provided by the w-th WT in period t is denoted by Equation 27:
Equations 28, 29 determine ramp limits and startup and shutdown times:
where
Equation 30 limits the power balance of the system.
4.2.2 Constraints of the security verification level with infeed power loss disturbance
The second-level model is discretized with a time scale of τ1, and the time interval is set to Δn. System frequency security is verified for each time interval.
4.2.2.1 Output constraints
The output constraints can be expressed as Equations 31, 32:
where
The VSG frequency control strategy can be implemented in PV using battery storage, whereas the PV power generation module still adopts the traditional maximum power point tracking (MPPT) operation strategy, with its actual output equal to the predicted maximum power:
where
4.2.2.2 Power distribution and quasi-steady state power balance constraints
The power distribution constraints can be expressed as Equation 36:
where ΔPt,n is the power loss after the n-th step of the disturbance occurrence.
The quasi-steady-state power balance constraint can be expressed as Equation 37:
where
4.2.2.3 Reserve constraints
The reserve can be divided into primary, secondary, and tertiary reserves based on the frequency recovery process of the system with a predefined disturbance. The overall primary reserve of the system can be expressed as Equation 38:
where
A secondary reserve is used to eliminate frequency deviation and is undertaken by SGs with automatic generation control (AGC) systems. Considering the timescale of secondary frequency regulation in the system (5 min), the secondary reserve constraint is formulated as Equation 39:
where
To ensure the frequency security of the system, the power grid must reserve sufficient primary and secondary reserve capacity to return the system frequency to a reasonable range, with the relevant constraints as Equation 40:
Tertiary reserves can be provided by SGs with upward regulation space. When a disturbance occurs, the primary and secondary reserves respond first. To ensure that the system has a sufficient response rate to cope with the next disturbance, it is necessary to replace primary and secondary reserves with tertiary reserves after the frequency is restored. The total tertiary reserve of the system can be described as Equation 41:
where
In addition, constraints on the system inertia level (Equations 7–9) and multidimensional frequency security limit constraints (Equations 19–21) should be embedded in the model.
5 Case study
5.1 Input data and scenario setting
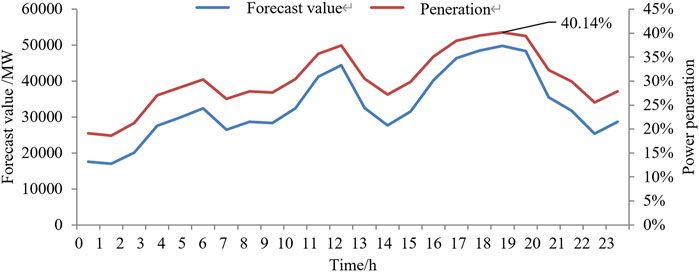
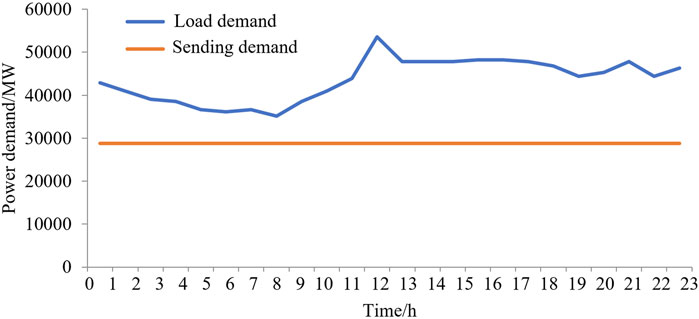
The effectiveness of the proposed approach was verified and applied to a provincial power grid located in Southwest China. The installed capacity of the SGs in the system was 143,396 MW, and the installed capacity of the renewable energy generators was 91,000 MW (including 71,000 MW for WTs and 22,000 MW for PVs). The forecast data for renewable energy generation in the future operation scenarios are shown in Figure 5. Renewable energy generation is forecast at a high proportion, and the penetration rates of renewable generation at hours 5, 9–12, and 15–20 are higher than 30%. Figure 6 shows the hourly load demand. The system must transmit a large amount of electricity to the external power grid through DC lines, with a total of six feed-out HVDC lines. The power demand for external transmission is 28,800 MW and represents more than 40% of the total power generation. The inertia constant of the WT was set as 8 s, and the primary frequency regulation coefficients of the WT and battery storage systems were set to 10. The discharge efficiency of battery storage was
Scenario 1: Proposed reserve allocation optimization model considering multitype reserves and system frequency security limits.
Scenario 2: Traditional reserve allocation scheme without considering renewable energy reserves and system frequency security limits.
Scenario 3: Traditional reserve allocation scheme enforcing system frequency security constraints. The frequency support of the renewable energy units was neglected.
5.2 Change of multidimensional evaluation indices
5.2.1 Total operating cost of the system
Table 1 presents the economics of the different scenarios from multiple perspectives, including the generation cost, reserve cost, wind curtailment, and total operating cost. The curtailment provided in the table is the average wind curtailment (MW). The total operating and generation costs of the system in Scenario 2 are the lowest of the three scenarios because Scenario 2 does not consider the WT to provide frequency support, and system frequency security constraints are not enforced. For Scenario 3, because only SGs ensure system frequency security under predefined disturbances, more WT output is curtailed to maintain a higher SG online capacity; therefore, the curtailment penalty cost is significantly higher than that of Scenario 1.
5.2.2 Consumption of renewable energy
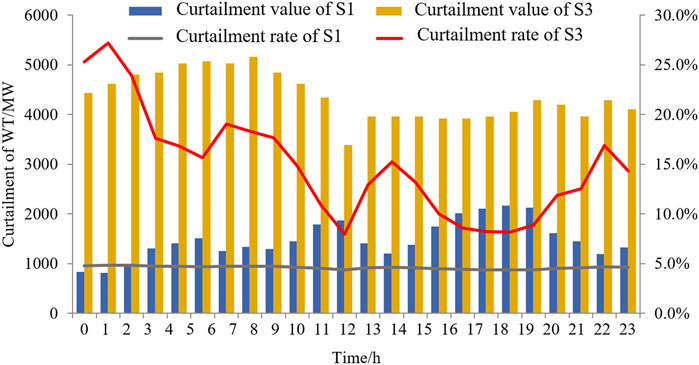
Owing to the utilization of the MPPT operation strategy and participation in frequency regulation through battery storage of PVs, there was no PV curtailment in the three scenarios. The wind curtailment in the power grids of Scenarios 1 and 3 during the dispatch period is shown in Figure 7. In Scenario 1, the wind curtailment rate of the system was maintained below 5%, and the average wind curtailment rate during the entire dispatch period was 4.57%. In Scenario 3, the wind curtailment rate of the system at hour 1 was 27.2%, and the wind curtailment amount was 4615 MW. During the entire dispatch period, the average wind curtailment rate was 13.45%, and more wind-power generation was curtailed.
5.2.3 System inertia
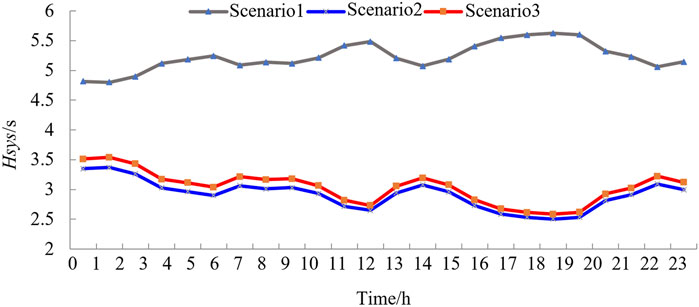
Figure 8 compares the inertia levels in the three scenarios. It can be seen that the proposed optimization model considers the virtual inertia support of renewable energy. Hence, the fluctuation in the system equivalent inertia level in Scenario 1 was smaller and could be maintained at a high level (approximately 5.23 s). Owing to the single source (only SGs) of inertia in Scenarios 2 and 3, the system inertia level was not significantly improved even when the wind curtailment rate reached 13.45%, and the low-inertia risk was noticeable.
5.2.4 Multidimensional frequency security indices
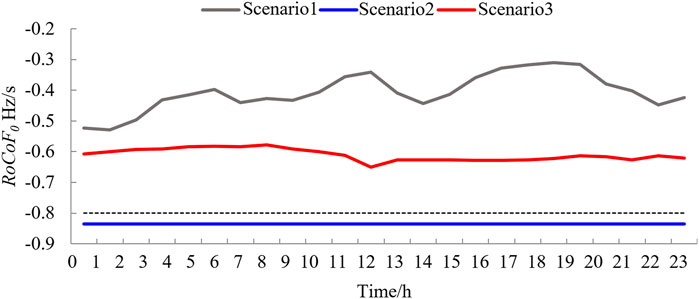
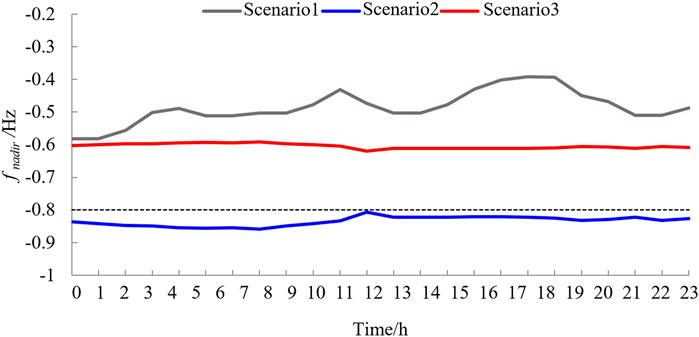
Figure 9 compares the postfault initial RoCoF during the scheduling period of the three scenarios. Scenario 1 had a smaller RoCoF than the traditional reserve optimization methods (Scenarios 2 and 3). Because frequency security is not considered in Scenario 2, the frequency change rate exceeds the threshold, and system frequency security cannot be guaranteed. A comparison of the frequency nadir for the three scenarios is shown in Figure 10. Similar to the frequency change rate index, the proposed reserve optimization method (Scenario 1) had a smaller frequency nadir with the same disturbance as the other traditional methods (Scenarios 2 and 3). The frequency nadir in Scenario 2 exceeded the threshold.
5.3 Reserve capacity allocation result
5.3.1 Primary reserve
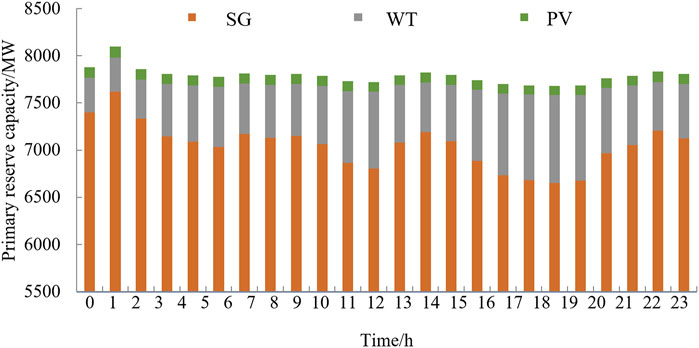
Figure 11 shows the detailed allocation optimization results of the primary reserve capacity in Scenario 1. The primary frequency regulation of the system is dominated by SGs, supplemented by WT and PV battery storage. According to the primary reserve Equation 39, the primary frequency regulation reserve capacity of the system is related to the disturbance. Therefore, the primary frequency regulation reserve in Scenario 1 is nearly equal to the initial system disturbance.
5.3.2 Secondary reserve and tertiary reserve
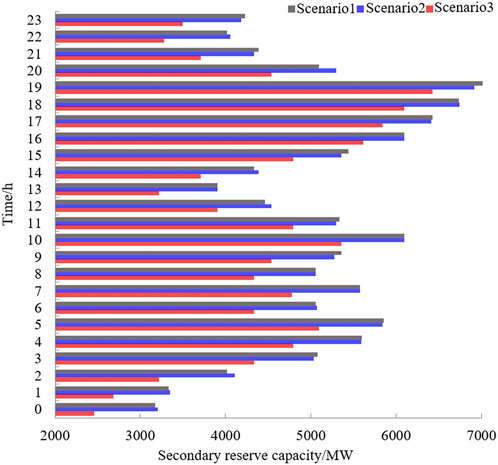
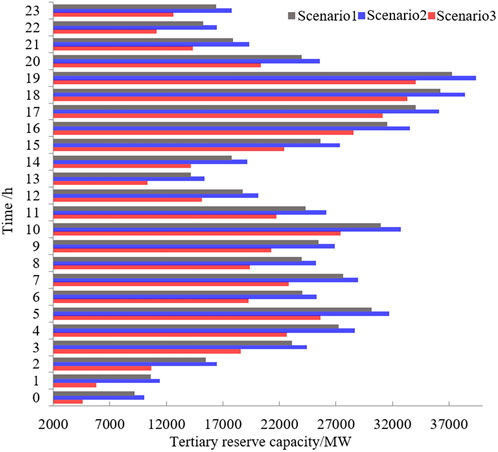
Figure 12 shows the configuration results of the secondary reserve capacity for the three scenarios. The upward adjustment space for the secondary reserve capacity of the system fluctuated significantly in all three scenarios. Because of the significant wind curtailment in Scenario 3, the upward adjustment space of the SGs was compressed, and the secondary reserve capacity in Scenario 3 was relatively small. The tertiary reserve capacity of the system during the dispatch period is shown in Figure 13. In Scenario 1, because of the upward reserve reservation for the WT, the SGs support more load demand than in the traditional scheme, and the total tertiary reserve capacity of the system in Scenario 1 is smaller than that in Scenario 2 without wind curtailment measures. Similar to the secondary reserve, the tertiary reserve adjustment space for the SGs in Scenario 3, where there is a large amount of wind curtailment, is also compressed. Thus, the total tertiary reserve of Scenario 3 was significantly lower than that of Scenario 2, which had no wind curtailment, and lower than that of Scenario 1, which had only a small amount of wind curtailment.
5.4 Accuracy evaluation of frequency indices
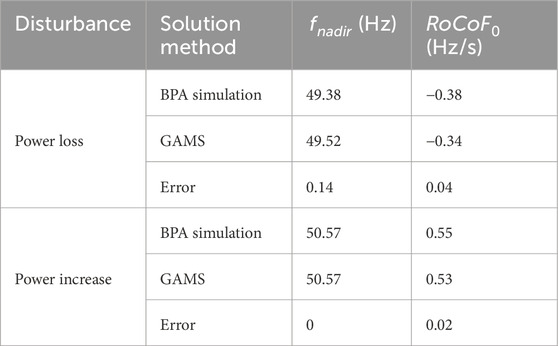
This section simulates and calculates the frequency indices of all reserve scenarios for the test system with 8000 MW power loss using PSD-BPA software. The postfault frequency response curves at 9 h for the three scenarios are shown in Figure 14. In Scenario 1, the frequency nadir is 0.62 Hz (
6 Conclusion
This study proposes a reserve capacity allocation optimization approach for high-penetration renewable energy power grids that integrates multiple reserve sources to ensure system frequency security. A reserve criterion based on multidimensional evaluation indices for operational economy and frequency security was constructed. In addition, a bilevel optimization model for reserve capacity allocation that considers frequency security is proposed. Case studies on a practical power grid show that compared with traditional reserve schemes, the proposed method can achieve an optimized reserve capacity distribution with higher economic efficiency and frequency security. Moreover, compared to the PSD-BPA simulation, the calculation deviations for the frequency security indices of the optimization model were within acceptable ranges.
Data availability statement
The original contributions presented in the study are included in the article/supplementary material; further inquiries can be directed to the corresponding author.
Author contributions
FL: formal analysis, project administration, and writing–original draft. YS: investigation, resources, and writing–review and editing. YL: software, validation, and writing–review and editing. DC: data curation, funding acquisition, and writing–original draft. WC: supervision, visualization, and writing–review and editing. LK: conceptualization, methodology, and writing–original draft.
Funding
The author(s) declare that financial support was received for the research, authorship, and/or publication of this article. This work was supported by the Science and Technology Project of State Grid Sichuan Electric Power Company under Grant 521996230006.
Conflict of interest
Authors FL, YS, YL and WC were employed by State Grid Sichuan Electric Power Company. The remaining authors declare that the research was conducted in the absence of any commercial or financial relationships that could be construed as a potential conflict of interest.
The authors declare that this study received funding from Science and Technology Project of State Grid Sichuan Electric Power Company, under Grants 521996230006. The funder had the following involvement in the study: study design, collection, analysis, interpretation of data.
Publisher’s note
All claims expressed in this article are solely those of the authors and do not necessarily represent those of their affiliated organizations, or those of the publisher, the editors, and the reviewers. Any product that may be evaluated in this article, or claim that may be made by its manufacturer, is not guaranteed or endorsed by the publisher.
References
Chen, Y., Xu, W., Liu, Y., Rashad, E., Bao, Z., Jiang, J., et al. (2022). Reduced-order system frequency response modeling for the power grid integrated with the type-II doubly-fed variable speed pumped storage units. IEEE Trans. POWER Electron. 37 (9), 10994–11006. doi:10.1109/TPEL.2022.3166567
Chen, Z., Li, F., Zhao, X., and Song, X. (2020). A bi-level interactive optimization scheduling considering source-load characteristics. Power Syst. Prot. Control 48 (1), 135–141. doi:10.19783/j.cnki.pspc.190191
Cui, Y., Hu, Z., and Luo, H. (2020). Optimal day-ahead charging and frequency reserve scheduling of electric vehicles considering the regulation signal uncertainty. IEEE Trans. Industry Appl. 56 (5), 5824–5835. doi:10.1109/TIA.2020.2976839
Delkhosh, H., and Seifi, H. (2021). Power system frequency security index considering all aspects of frequency profile. IEEE Trans. POWER Syst. 36 (2), 1656–1659. doi:10.1109/TPWRS.2020.3047510
Ebrahimi, M., Khajehoddin, S. A., and Karimi-Ghartemani, M. (2019). An improved damping method for virtual synchronous machines. IEEE Trans. Sustain. ENERGY 10 (3), 1491–1500. doi:10.1109/TSTE.2019.2902033
Garoarsdottir, S. O., Goransson, L., Normann, F., and Johnsson, F. (2018). Improving the flexibility of coal-fired power generators: impact on the composition of a cost-optimal electricity system. Appl. ENERGY 209, 277–289. doi:10.1016/j.apenergy.2017.10.085
Gottwalt, S., Gaerttner, J., Schmeck, H., and Weinhardt, C. (2017). Modeling and valuation of residential demand flexibility for renewable energy integration. IEEE Trans. Smart Grid 8 (6), 2565–2574. doi:10.1109/TSG.2016.2529424
Hakami, A. M. M., Hasan, K. N. N., Alzubaidi, M., and Datta, M. (2023). A review of uncertainty modelling techniques for probabilistic stability Analysis of renewable-rich power systems. ENERGIES 16 (1), 112. doi:10.3390/en16010112
Hedayati-Mehdiabadi, M., Zhang, J., and Hedman, K. W. (2015). Wind power dispatch margin for flexible energy and reserve scheduling with increased wind generation. IEEE Trans. Sustain. ENERGY 6 (4), 1543–1552. doi:10.1109/TSTE.2015.2455552
Heylen, E., Teng, F., and Strbac, G. (2021). Challenges and opportunities of inertia estimation and forecasting in low-inertia power systems. Renew. and Sustain. ENERGY Rev. 147, 111176. doi:10.1016/j.rser.2021.111176
Karbouj, H., Rather, Z. H., Flynn, D., and Qazi, H. W. (2019). Non-synchronous fast frequency reserves in renewable energy integrated power systems: a critical review. Int. J. Electr. POWER and ENERGY Syst. 106, 488–501. doi:10.1016/j.ijepes.2018.09.046
Kong, X., Wang, Z., Liu, C., Zhang, D., and Gao, H. (2023). Refined peak shaving potential assessment and differentiated decision-making method for user load in virtual power plants. Appl. ENERGY 334, 120609. doi:10.1016/j.apenergy.2022.120609
Li, X., and Wang, S. (2021). Energy management and operational control methods for grid battery energy storage systems. CSEE J. POWER ENERGY Syst. 7 (5), 1026–1040. doi:10.17775/CSEEJPES.2019.00160
Liu, G., and Tomsovic, K. (2012). Quantifying spinning reserve in systems with significant wind power penetration. IEEE Trans. POWER Syst. 27 (4), 2385–2393. doi:10.1109/TPWRS.2012.2207465
Liu, M., Chen, J., and Milano, F. (2021). On-line inertia estimation for synchronous and non-synchronous devices. IEEE Trans. POWER Syst. 36 (3), 2693–2701. doi:10.1109/TPWRS.2020.3037265
Lv, J., Ding, T., Bie, Z., and Wang, X. (2017). A novel linearization variant of reliability costs in the optimal scheduling model. IEEE Trans. POWER Syst. 32 (5), 4140–4142. doi:10.1109/TPWRS.2017.2650783
National Development and Reform Commission of People's Republic of China (2023). China's renewable energy development in 2022. Available at: https://www.ndrc.gov.cn/fggz/hjyzy/jnhnx/202302/t20230215_1348799_ext.html (Accessed August 28, 2024).
Navid, N., and Rosenwald, G. (2012). Market solutions for managing ramp flexibility with high penetration of renewable resource. IEEE Trans. Sustain. ENERGY 3 (4), 784–790. doi:10.1109/TSTE.2012.2203615
Ortega-Vazquez, M. A., and Kirschen, D. S. (2009). Estimating the spinning reserve requirements in systems with significant wind power generation penetration. IEEE Trans. POWER Syst. 24 (1), 114–124. doi:10.1109/TPWRS.2008.2004745
Rehman, H. U., Yan, X., Abdelbaky, M. A., Jan, M. U., and Iqbal, S. (2021). An advanced virtual synchronous generator control technique for frequency regulation of grid-connected PV system. Int. J. Electr. POWER and ENERGY Syst. 125, 106440. doi:10.1016/j.ijepes.2020.106440
Shao, C., Feng, C., Fu, X., Yang, P., Wang, X., and Wang, X. (2021). Multi energy power system production simulation: state of arts and challenges. Proc. CSEE 41 (6), 2029–2040. doi:10.13334/j.0258-8013.pcsee.200801
Shi, Z., Xu, Y., Wang, Y., He, J., Li, G., and Liu, Z. (2022). Coordinating multiple resources for emergency frequency control in the energy receiving-end power system with HVDCs. IEEE Trans. POWER Syst. 38 (5), 4708–4723. doi:10.1109/TPWRS.2022.3215201
Xin, H., Liu, Y., Wang, Z., Gan, D., and Yang, T. (2013). A new frequency regulation strategy for photovoltaic systems without energy storage. IEEE Trans. Sustain. ENERGY 4 (4), 985–993. doi:10.1109/TSTE.2013.2261567
Yuan, K., Zhang, T., Xie, X., Du, S., Xue, X., Abdul-Manan, A. F. N., et al. (2023). Exploration of low-cost green transition opportunities for China's power system under dual carbon goals. J. Clean. Prod. 414, 137590. doi:10.1016/j.jclepro.2023.137590
Zhang, S., Fang, Y., Zhang, H., Cheng, H., and Wang, X. (2022). Maximum hosting capacity of photovoltaic generation in SOP-based power distribution network integrated with electric vehicles. IEEE Trans. Industrial Inf. 18 (11), 8213–8224. doi:10.1109/TII.2022.3140870
Keywords: reserve, frequency security, primary frequency regulation, optimization, allocation
Citation: Liu F, Su Y, Liu Y, Chen D, Chen W and Kuang L (2024) Reserve allocation of high-penetration renewable energy grids considering frequency security. Front. Energy Res. 12:1501711. doi: 10.3389/fenrg.2024.1501711
Received: 25 September 2024; Accepted: 15 November 2024;
Published: 10 December 2024.
Edited by:
Can Huang, Lawrence Livermore National Laboratory (DOE), United StatesReviewed by:
Jiehui Zheng, South China University of Technology, ChinaGang Huang, Zhejiang University, China
Muyang Liu, Xinjiang University, China
Copyright © 2024 Liu, Su, Liu, Chen, Chen and Kuang. This is an open-access article distributed under the terms of the Creative Commons Attribution License (CC BY). The use, distribution or reproduction in other forums is permitted, provided the original author(s) and the copyright owner(s) are credited and that the original publication in this journal is cited, in accordance with accepted academic practice. No use, distribution or reproduction is permitted which does not comply with these terms.
*Correspondence: Dawei Chen, MTgwNzc5NjQ3NEBxcS5jb20=
 Fang Liu1
 Dawei Chen