- 1Economic and Technological Research Institute of Jilin Electric Power Co., LTD., Changchun, China
- 2State Grid Jilin Electric Power Co., LTD., Changchun, China
Virtual Power Plant (VPP) is a key to aggregate various distributed energy sources. With the vigorous rise of various distributed energy sources, the direct access of large-scale electric vehicle load will increase the complexity of VPP coordinated operation. Hence, this paper proposes a VPP optimization method for Electric Vehicle Virtual Energy Storage (EV-VES). Firstly, the travel characteristics of electric vehicles are analyzed, and EV-VES model is established to coordinate and manage the charge-discharge behavior of EV. Secondly, the “carbon charge rate” model of energy storage (ES) is introduced to establish the relationship between carbon emission and electricity price, and the VPP operation model considering the “carbon charge rate” of energy storage is established. Finally, the two-stage robust optimization operation model of VPP is constructed, Wasserstein distance is used to describe the confidence set of uncertain probability distribution of wind power generation and load, and the uncertainty of system source and load are described by the confidence set. The Column and Constraint Generation (C&CG) algorithm was used to determine the optimal operational benefit solution. The effectiveness of the proposed VPP optimal operation model was validated through case study.
1 Introduction
The problem of energy crisis and global warming is becoming more and more obvious, which has aroused people’s wide attention. Virtual power plant uses advanced communication technology and control theory to aggregate massive distributed resources and coordinate scheduling to realize effective allocation of internal resources (Zhang et al., 2023). Electric Vehicles (EVs) have developed rapidly in recent years and have played a significant role as an important way to alleviate energy shortages (Guo et al., 2022; Zhang, 2022a).
With the development of EV network access technology, its aggregation as flexible virtual energy storage has broad application prospects. Existing literature has studied the effects of EV renewable energy consumption (Zhang, 2022b), wind and landscape fluctuation reduction, and peak cutting and valley filling (Wang et al., 2024) from the aspects of EV flexible regulation potential (Kaile et al., 2020), orderly charge and discharge control strategy (Yao et al., 2022), and temporal and spatial dis-tribution. In terms of EV modeling, similar EVs or charging piles are regarded as an aggregate by fuzzy C-means (Li et al., 2022) or self-organizing mapping neural network (Sun et al., 2021) according to EV charging time and other characteristics. Above literature have a fixed probability distribution in EV modeling, which is a simple aggregation of numerical relations. While the generalized load of electric vehicles with the dual attributes of power generation and electricity consumption can realize the increase or decrease of energy demand in a certain period of time to a certain extent, which is similar to physical energy storage, so it can be modeled as virtual energy storage.
In the VPP optimization scheduling problem, the wind-driven force is usually a non-linear optimization problem. The existing methods to deal with uncertainty mainly focus on stochastic optimization and robust optimization. Literature (Sui et al., 2020) improves the existing robust optimization method by finiting discretization of the uncertain domain, generates the uncertain domain boundary with echelon deviation, and expands the “bad scenario set.” Literature (Xu et al., 2022; Qi et al., 2023) uses the two-stage robust optimization theory to construct the uncertainty set of wind power and load, and seeks the optimal solution of system optimization operation under the worst scenario. The stochastic programming method builds several typical scenarios based on historical data and the probability distribution function of un-certain factors to analyze the randomness of load and renewable energy (U. Akram et al., 2021; Li et al., 2019). However, stochastic optimization requires accurate probability distribution function, which makes stochastic optimization lack robustness, and the robust optimization value considers the optimal solution of the uncertain set in the worst case, and the result is too conservative. Literature (Liu et al., 2020) uses the 1 norm and ∞ norm constraints in the maximum scheduling to restrict the confidence interval. Compared with the above two methods, the distributionally robust optimization (Yang et al., 2021; Yang et al., 2022) does not require a completely accurate distribution function and has stronger robustness. At the same time, it makes up for the shortcoming that the result of robust optimization is too conservative because the probability distribution is not considered.
In summary, the current research on optimal scheduling of VPPs only considers electric-hydrogen energy storage, without considering the ES capacity of flexible load and the carbon emission model of energy storage equipment. Therefore, this paper proposes a two-stage robust optimal operation model considering EV-VES and the “carbon charge rate” of energy storage. The proposed method has several advantages.
(1) The research in this paper breaks through the limitations of the existing virtual power plant optimal scheduling and fills in the field other than the consideration of electric-hydrogen energy storage. Through in-depth analysis of the travel characteristics of electric vehicles, an innovative EV-VES power model is established, which not only improves the flexibility of virtual power plant scheduling, but also enhances its ability of peak cutting and valley filling.
(2) The concept of “carbon charge rate” is proposed, which closely combines carbon emission with energy storage system, and provides a new perspective for constructing the relationship between carbon emission and trading price.
(3) A two-stage robust optimal operation model is proposed, which uses Wasserstein distance to describe the uncertainty of wind power generation and load demand, and effectively describes the uncertain probability distribution set of the source load of the system.
2 EV-VES model
By statistical analysis of the historical data of EV, the distribution function of parking time, driving distance and parking time of electric vehicles can be obtained (Chen et al., 2024). The charging time, discharging time and remaining capacity of the EVs when they arrive at the station can be expressed as Equations 1–3:
where,
Considering the factors discussed above, the feasible range of electric power for a single electric vehicle under the limit condition is established as Equation 4:
where,
Thus, the upper and lower limits of the power of electric vehicles in the limit condition are obtained, as Equation 5:
where,
Aggregating electric vehicles into VES, the energy boundary is as Equation 6:
where,
3 Virtual power plant operation model considering “carbon charge rate” of energy storage
3.1 Energy storage “carbon charge rate” model
After integrating the energy storage device, since it functions as a unique electrical load during charging, it will absorb part of the carbon emissions while charging, and it is considered to be a special power generation device when the energy storage is discharged. Therefore, carbon emissions will not be conserved in real time when extending the translation of energy storage at the energy level to the translation of carbon emissions level, but in a scheduling cycle. Energy storage “carbon charge rate” model is established as Equations 7–10.
where,
where,
where,
where,
3.2 Virtual power plant operation model
VPPs aim to minimize operating costs, as Equation 11, VPP operation constraints are shown in Equations 12–16:
where,
3.2.1 Power balance constraints
where,
3.2.2 Energy market trading constraints
where,
3.2.3 Constraints on battery charging and discharging
where,
3.2.4 Operation constraints of traditional power plants
where,
3.2.5 Electric vehicle virtual energy storage constraints
where,
4 Two-stage distributionally robust optimization operation model for virtual power plant
4.1 Model transformation
The deterministic optimization model (11) is changed to the two-stage distributionally robust optimization model (17). In the first stage, the internal unit combination problem of VPP is solved, and in the second stage, the operation result of the maximum benefit of VPP is solved under the worst case of source load uncertainty.
where,
Formula 17 is a two-stage max-min max problem that cannot be solved directly, so the C&CG algorithm is used to solve the main problem and sub-problem iteratively. The main question is expressed as Equation 18:
where,
Solve the main problem and get
The main problem passes the combination solution to the sub-problem, and solves the maximum VPP payoff in the worst case. Since the subproblem is a Min-Max two-layer problem, the two-layer problem needs to be transformed into a max single-layer problem as Equation 20 by KKT condition or duality theory.
where,
4.2 Uncertain set
In this paper, Wasserstein distance (Grani and Hanasusanto, 2018; Zhao and Guan, 2016) is used to construct fuzzy uncertainty sets. Wasserstein distance is defined as Equation 21:
where,
Taking the empirical distribution as the center, the source load prediction error probability distribution set, also known as fuzzy uncertainty set, is constructed. The uncertainty set
where,
where,
The uncertain set Ξ is specified by the upper and lower bounds of the uncertain parameters as shown in Equation 24:
where,
where,
4.3 Model solving procedure
Step 1: Set the lower bound
Step 2: Solve the main problem, pass the solution
Step 3: Solve the main problem according to
Step 4: If
5 Example analysis
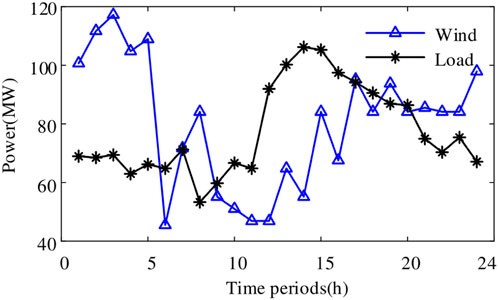
This paper optimizes the operation of the VPP with a cycle of 24 h. The maximum tradable power is 50 MW, the efficiency of storage equipment is 0.9, the fixed cost of the traditional power plant is 200 yuan, and the power generation cost is 450 yuan. The time-based electricity price is shown in Table 1, and the load and wind power generation forecast data are indicated in Figure 1.
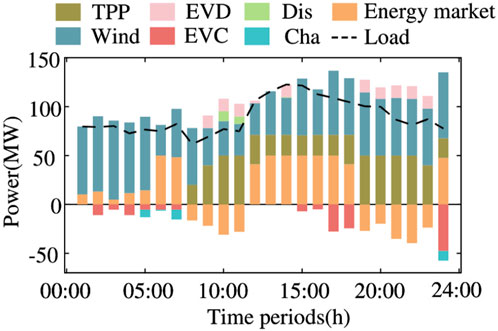
The results of VPP internal resource scheduling are shown in Figure 2. During 9:00–11:00 and 19:00–23:00, when the load demand is high and the wind power level is low, the electric vehicle discharges. A positive trading power in the energy market indicates the purchase of energy, and a negative one is the opposite. The trading price of the power market peaks at 9:00–11:00 and 19:00–23:00, and VPP tends to sell energy during the period of high electricity price, virtual energy storage and battery discharge promote the sale of energy by VPP, thus reducing the operating cost of VPP.
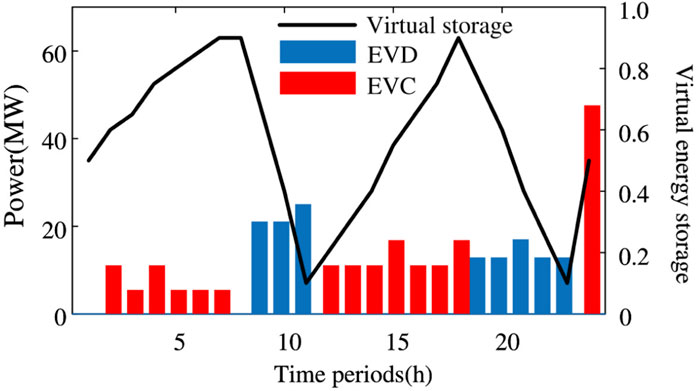
The charge and discharge power of VES and EVs are shown in Figure 3. EVs engage in the optimization scheduling of VPPs according to the guidance of price signals. From 0:00 to 7:00, electric vehicles purchase electricity from the market to supply VES and batteries. The power market trading price is at its peak between 9:00–11:00 and 19:00–23:00, and VES discharged during this period, improving the operating profit of VPP.
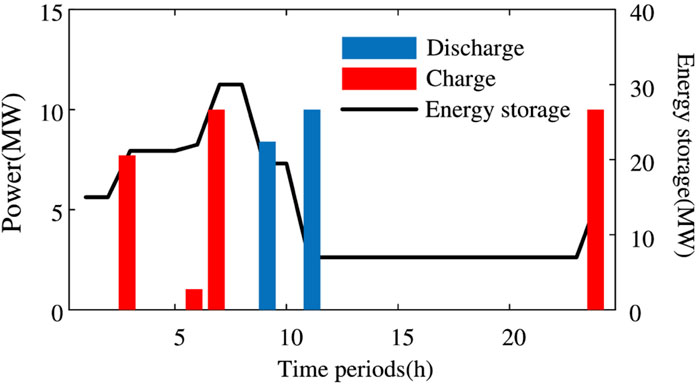
The charge-discharge power of the battery is shown in Figure 4. At 9:00–11:00 when the load demand is high and the wind power level is low, the energy storage discharge relieves the pressure of the VPP load demand.
As indicated in Table 2, after utilizing the “carbon charge rate” of energy storage to participate in the VPP market pricing mechanism, the operating cost of VPP decreases and the carbon emission increases.
The relationship between robust confidence and VPP profit is shown in Table 3. With the increase of confidence level
6 Conclusion
To improve the benefit ability of VPP in the power market, this paper analyzes the travel characteristics of electric vehicles, establishes the virtual energy storage power model of electric vehicles, proposes the coupling of carbon emission and energy storage system with “carbon charge rate” of energy storage, and constructs the relationship between carbon emission and transaction price. Finally, a two-stage robust optimization operation model of VPP considering the VES model of EV and the carbon charge rate model of ES is established. With simulation, conclusions can be drawn:
1) Creating a simulated ES model for EVs, ascertaining the controlled power output of this virtual storage to integrate into VPPs, optimizing within designated charge and discharge thresholds, thereby enhancing the VPP’s capability for peak shaving and load balancing.
2) This paper puts forward the concept of “carbon charge rate” of energy storage, which represents the ratio between the carbon emissions absorbed in the energy storage and the stored electricity, that is, the amount of carbon emissions per unit of electricity in the energy storage. The “carbon charge rate” model can be well applied to systems containing energy storage and carbon emissions, and combined with its pricing mechanism can change the operation of VPP.
3) Aiming at the uncertainty of system source load, a two-stage robust optimization operation model is proposed. With the increase of Wasserstein sphere radius, the operational robustness of VPP is also enhanced, and its operating cost is increased.
In general, by introducing electric vehicles as virtual energy storage resources and considering carbon emissions, this paper provides a new perspective and method for the optimal scheduling of virtual power plants. It is of great significance to improve the competitiveness and adaptability of virtual power plants in the power market. The extended application of “carbon charge rate” model is also a possible direction of this research in the future, and it is considered to combine it with other environmental impact indicators (such as the value of ecosystem services, water resources consumption, etc.) to conduct a comprehensive environmental impact assessment.
Data availability statement
The original contributions presented in the study are included in the article/supplementary material, further inquiries can be directed to the corresponding author.
Author contributions
BW: Methodology, Software, Writing–original draft. YJ: Resources, Writing–review and editing. MJ: Project administration, Writing–review and editing. KM: Data curation, Writing–review and editing.
Funding
The author(s) declare that financial support was received for the research, authorship, and/or publication of this article. State Grid Jilin Electric Power Co., LTD. Strategic project: Research on the development path of Virtual power Plant adapting to the new power system with Jilin Characteristics (SGJLJY00GPJS2300067). The funder was not involved in the study design, collection, analysis, interpretation of data, the writing of this article, or the decision to submit it for publication.
Conflict of interest
Authors BW, MJ, and KM were employed by Economic and Technological Research Institute of Jilin Electric Power Co., LTD. Author YJ was employed by State Grid Jilin Electric Power Co., LTD.
Publisher’s note
All claims expressed in this article are solely those of the authors and do not necessarily represent those of their affiliated organizations, or those of the publisher, the editors and the reviewers. Any product that may be evaluated in this article, or claim that may be made by its manufacturer, is not guaranteed or endorsed by the publisher.
References
Akram, U., Mithulananthan, N., Raza, M. Q., Shah, R., and Milano, F. (2021). RoCoF restrictive planning framework and wind speed forecast informed operation strategy of energy storage system. IEEE Trans. Power Syst. 36 (1), 224–234. doi:10.1109/tpwrs.2020.3001997
Chen, Y., Niu, Y., Qu, C., Du, M., and Wang, J. (2024). Data-driven-based distributional robust optimization approach for a virtual power plant considering the responsiveness of electric vehicles and Ladder-type carbon trading. Int. J. Electr. Power and Energy Syst. 157, 109893. doi:10.1016/j.ijepes.2024.109893
Grani, A., and Hanasusanto, D. (2018). Conic programming reformulations of two-stage distributional robust linear programs over Wasserstein balls. Operations Res. 66 (3), 849–869. doi:10.1287/opre.2017.1698
Guo, J., Zhang, Z., and Dou, C. (2022). Bi-level economic dispatch strategy for electric vehicles connecting to virtual power plant based on information gap decision theory and dynamic time-of-use price. Electr. Power Autom. Equip. 42 (10), 77–85. doi:10.16081/j.epae.202208001
Kaile, Z., Cheng, L., Wen, L., Lu, X., and Ding, T. (2020). A coordinated charging scheduling method for electric vehicles considering different charging demands. Energy 213, 118882. doi:10.1016/j.energy.2020.118882
Li, D., Zhang, K., Yao, Y., and Lin, S. (2022). Clustering and markov model of plug-in electric vehicle charging profiles for peak shaving applications. Int. Trans. Electr. Energy Syst. 2022, 1–14. doi:10.1155/2022/5006110
Li, Y., Wang, J., Cao, X., Zhou, B., and Lu, S. (2019). A chance-constrained IGDT model for joint planning of wind farm, energy storage and transmission. Power Syst. Technol. 43 (10), 3715–3724. doi:10.13335/j.1000-3673.pst.2018.1929
Liu, Z., Wang, L., and Ma, L. (2020). A transactive energy framework for coordinated energy management of networked microgrids with distributionally robust optimization. IEEE Trans. Power Syst. 35 (1), 395–404. doi:10.1109/tpwrs.2019.2933180
Qi, C., Che, B., Yang, Y., and Chen, B. (2023). Master-slave game-based robust pricing method of shared energy storage considering renewable energy accommodation and energy storage participating in frequency modulation. Electr. Power 56 (08), 26–39. doi:10.11930/j.issn.1004-9649.202301004
Sui, Q., Lin, X., Tong, N., Li, X., Wang, Z., Hu, Z., et al. (2020). Economic dispatch of active distribution network based on improved two-stage robust optimization. Proc. CSEE 40 (7), 2166–2179. doi:10.13334/j.0258-8013.pcsee.182259
Sun, Y., Mao, Y., Li, Z., Zhang, X., and Li, F. (2021). A comprehensive clustering method of user load characteristics and adjustable potential based on power big data. Proc. CSEE 41 (18), 6259–6271. doi:10.13334/j.0258-8013.pcsee.201928
Wang, Y., Mao, M., Yang, C., Zhou, K., Du, Y., and Hatziargyriou, N. D. (2024). Modeling for large-scale EV aggregated dispatchable capacity considering multi-scenario ancillary services. Automation Electr. Power Syst., 1–20. doi:10.7500/AEPS20230627012
Xu, H., Long, T., Zhao, Q., Li, P., Nan, L., Zhang, Q., et al. (2022). Day-ahead coordinated low carbon robust scheduling of hydro-electricity natural gas system considering power-to-gas to accommodate excessive hydro generation. Electr. Power 55 (11), 163–174. doi:10.11930/j.issn.1004-9649.202204086
Yang, L., Xu, Y., Gu, W., and Sun, H. (2021). Distributionally robust chance-constrained optimal power-Gas flow under bidirectional interactions considering uncertain wind power. IEEE Trans. Smart Grid 12 (2), 1–1735. doi:10.1109/tsg.2020.3029027
Yang, L., Xu, Y., Sun, H., and Wu, W. (2022). Tractable convex approximations for distributional robust joint chance-constrained optimal power flow under uncertainty. IEEE Trans. Power Syst. 37 (3), 1927–1941. doi:10.1109/tpwrs.2021.3115521
Yao, Y., Zhao, R., Li, C., Yan, Z., and Xie, K. (2022). Control strategy of electric vehicles oriented to power system flexibility. Trans. China Electrotech. Soc. 37 (11), 2813–2824. doi:10.19595/j.cnki.1000-6753.tces.210515
Zhang, P., Xie, L., Ma, R., Lu, P., Song, X., Yang, J., et al. (2022a). Multi-player two-stage low carbon optimal operation strategy considering electric vehicle cluster schedulability. Power Syst. Technol. 46 (12), 4809–4825. doi:10.13335/j.1000-3673.pst.2022.0775
Zhang, W., Song, J, Guo, M., Yang, L., Chen, L., and Gao, H. (2022b). Load balancing management strategy for virtual power plants considering charging demand of electric vehicles. Automation Electr. Power Syst. 46 (09), 118–126. doi:10.7500/AEPS20210318001
Zhang, W., Xu, Q., Chen, K., and Lin, H. (2023). External characteristics of electric vehicle virtual power plant considering electricity price-sensitive user behavior. High. Volt. Eng. 49 (04), 1372–1379. doi:10.13336/j.1003-6520.hve.20221886
Keywords: electric vehicles, carbon charge rate, wasserstein distance, two-stage robust, C&CG
Citation: Wang B, Jiang Y, Jiang M and Ma K (2024) Two-stage distributionally robust optimization operation of virtual power plant considering the virtual energy storage of electric vehicles. Front. Energy Res. 12:1495823. doi: 10.3389/fenrg.2024.1495823
Received: 13 September 2024; Accepted: 30 October 2024;
Published: 18 November 2024.
Edited by:
Qingshan Xu, Southeast University, ChinaCopyright © 2024 Wang, Jiang, Jiang and Ma. This is an open-access article distributed under the terms of the Creative Commons Attribution License (CC BY). The use, distribution or reproduction in other forums is permitted, provided the original author(s) and the copyright owner(s) are credited and that the original publication in this journal is cited, in accordance with accepted academic practice. No use, distribution or reproduction is permitted which does not comply with these terms.
*Correspondence: Bowen Wang, MjYwNzk3ODYzOEBxcS5jb20=
 Bowen Wang
 Yong Jiang2


