- Suzhou Power Supply Company, State Grid Jiangsu Electric Power Co., Ltd., Suzhou, China
Accurate line parameters are critical for and dispatch in distribution systems. External operating condition variations affect line parameters, reducing the accuracy of state estimation and power flow calculations. While many methods have been proposed and obtained results rather acceptable, there is room for improvement as they don’t fully consider line connections in known topologies. Furthermore, inaccuracies in measurement devices and data acquisition systems can introduce noise and outliers, impacting the reliability of parameter identification. To address these challenges, we propose a line parameter identification method based on Graph Attention Networks and Multi-gate Mixture-of-Experts. The topological structure of the power grid and the capabilities of modern data acquisition equipment are utilized to capture. We also introduce a multi-task learning framework to enable joint training of parameter identification across different branches, thereby enhancing computational efficiency and accuracy. Experiments show that the GAT-MMoE model outperforms traditional methods, with notable improvements in both accuracy and robustness.
1 Introduction
The rapid development of new power systems has increased the complexity of power grid operations. The integration of distributed power sources and energy storage introduces randomness and volatility, presenting new challenges for the control and operation of distribution networks. Nowadays, power grids are mutating into Smart EEPS with highly integrated cyber systems, physical systems, and social systems. Among ML, RL has strong adaptability; thus, it is applied in many aspects of Smart EEPS, such as stability control, AGC (Automatic Generation Control), VQC (Voltage Quadergy Control), OPFC (Optimal Power Flow Control) and other scenarios (Cheng and Yu., 2019). Accurate line parameters are crucial for state estimation (SE), event detection, fault analysis, and various calculations within the distribution network (Zhang et al., 2020; Shi et al., 2020).
Unlike the transmission network, where line parameters can be derived from physical or empirical formulas based on line length, resistivity, and geometric positioning, the distribution network requires different approaches due to its radial topology and numerous feeder nodes (Wang et al., 2016; Asprou and Kyriakides, 2018; Li et al., 2018). Blueprints and planning documents can provide design parameters, but real parameters often differ due to system upgrades. As a result, traditional transmission line parameter identification (TLPI) methods struggle when applied to distribution networks. The key challenge is linking collected data to the line model. Existing parameter estimation methods can be grouped into two categories: model-driven and data-driven.
In medium voltage distribution networks, the complexity of operations and time-varying loads make it hard to build accurate mathematical models. To obtain more accurate line parameters, real-time line parameter identification can be carried out based on measurement data obtained by on-site measuring devices (Singh et al., 2018; Yu et al., 2018; Yu et al., 2019). Currently, the data used in parameter estimation mainly comes from two types of sensors: Supervisory Control and Data Acquisition (SCADA) systems and Phasor Measurement Units (PMUs). SCADA devices have been widely installed in medium voltage distribution networks, capable of collecting the amplitude of the electrical quantities but unable to obtain the phase data. PMUs can provide synchronized electrical quantities, but their high cost has limited large-scale deployment in distribution networks, failing to meet observability requirements under most conditions. Therefore, domestic and foreign scholars have conducted research on distribution network line parameter identification methods using phase-free data (Xiao et al., 2021). When PMUs are not available (Shi et al., 2024), applied a linear regression to estimate line parameters, topology, and phase labels, with nodal angles recovered via non-linear regression.
Since measurement devices characteristics can lead to outliers, it is essential to consider the DLPI problem with outliers and propose a new robust method to improve the accuracy of line parameter identification, especially under conditions involving PMU outliers and discrepancies in the accuracy of the coefficient matrix and observation data matrix. Research methods mainly focus on the least, squares method, residual sensitivity analysis, and regression methods (Zhu and Abur, 2010; Lin and Abur, 2018). A new iterative weighted least squares (WLS) method for dealing with line parameter deviations from systematic errors is also proposed, using estimates to calculate the gain matrix and prior knowledge to calculate the covariance matrix Pegoraro and his team focused on the estimation of measurement uncertainty and correction factors of D-PMUs, conducting a series of studies (Pegoraro et al., 2017; Puddu et al., 2018; Pegoraro et al., 2019a; Pegoraro et al., 2019b; Pegoraro et al., 2022). However, these methods assume widespread deployment of micro-PMUs, which limits their application. Thus, the performance of the linear regression method is limited by the incomplete configuration of measuring equipment in distribution networks. Meanwhile, as noted in Yu et al. (2019), imperfect synchronism and time interval deviations in smart meters may not ensure instant measurements for distributed generations (DGs), flexible loads, and electric vehicles with relatively dynamic behaviors.
Thanks to the development of machine learning and deep learning technologies, data-driven methods are gradually being widely applied to analyze and extract deep insights from data based on partial real-time data. In Li et al. (2022), a differential evolution algorithm is employed to identify line parameters, even when many original parameters are missing. Chen and his team find out that the integration of heuristic swarm intelligence search algorithms and AI technologies offers a significant approach to addressing the behavioral decision-making challenges (Cheng, 2020; Cheng et al., 2021; Cheng et al., 2022). Another study (Wang and Yu, 2022) develops a physics-informed graphical learning algorithm, using stochastic gradient descent to update the three-phase series resistance and reactance (Yang et al., 2022) proposed an RBFNN-MRO method combining a radial basis function neural network with multi-run optimization, which does not require synchronized phasor measure data as it uses a constant feeder parameter model over a specified short period. Other study Li et al. (2024); Yang et al. (2023) introduced a deep-shallow neural network to approximate power flow equations, employing reinforcement learning to optimize while ensuring maximal physical consistency. To reduce the influence of noise and deviation, different robust methods are used to improve accuracy. Sun et al. (2019) use convolutional neural networks (CNNs) to classify line impedance values and the results deviate from the original within 10%. Also, recent research in parameter identification focuses on overcoming limitations related to data structure, noise, and accuracy. Graph-based models (MNGAN, MFAGCN) are proposed using attention mechanism to enhance identification with non-Euclidean structures (Xia et al., 2022; Zou et al., 2024; Wang et al., 2022).
Above all, future works in DLPI should integrate physics information with deep learning methodologies. This paper introduces a multi-branch method for identifying line parameters using data from both ends of distribution lines. Addressing current limitations in identifying parameters of branched medium voltage distribution networks with topological constraints, the paper proposes a GAT-MMoE based DLPI method. This approach employs a multi-task neural network incorporating graph convolutional networks to tackle the line parameter identification problem. The graph attention network (GAT) uses an attention mechanism to learn the importance of neighboring nodes in a graph. Unlike traditional methods, where the contribution of neighbors is fixed, GAT dynamically adjusts the influence of each neighboring node based on its relevance to the target node. This leads to more accurate and nuanced feature representation. The MMoE model extracts topology features of the distribution network, with node features derived from graph attention networks and a multi-task learning model employing homoscedastic uncertainty loss.
The rest of this paper is structured as follows: Section 2 describes the modeling of the task of multi-branch line parameter identification in the distribution network, including problem formulation and the construction of the graph attention and multi-task modules. Section 3 covers the overall framework and workflow of the suggested method. Section 4 presents results and discussion, along with dataset description and comparison to alternative machine learning methods. Finally, this paper is summarized in Section 5.
2 Problem formulation
2.1 Parameter identification task and system construct
Current line parameter identification technologies face several challenges: 1) The low investment and high construction costs of smart devices impede the deployment of PMUs at each bus node, making real-time monitoring of voltage phase angle information difficult. 2) The integration of distributed photovoltaic systems on the user side causes reverse power flow and significant voltage fluctuations, making it difficult to maintain accuracy and robustness in the task of distribution line parameter identification.
The objective of DLPI is to find the mapping between node characteristics and line parameters and to identify the line resistance and reactance of each branch. Given the features of power grid branch, it is achieved using the active power, reactive power, and voltage amplitude provided by measuring equipment in medium-voltage distribution networks. The powerful learning ability of neural networks can be utilized to build a power flow model, mine constraints, and learn historical data to train the model. The power flow calculation using polar form of the nodal power Equation 1 is:
where
Meanwhile, parameter identification can be considered as a multi-task regression problem. Considering that the phase angle difference between the two ends of each branch of the distribution network is tiny, we assume that the phase angle difference of adjacent nodes i and node j is 0 for easy analysis. Thus, the linear voltage drop equation for line k is:
where
In traditional line parameter identification, the problem can be generalized as a linear regression problem or a quadratic programming problem. However, due to the fitting properties of linear regression, outliers can have significant effects on the regression, resulting in poor robustness. As the distribution network often encounters noise interference, data missing, or other situations due to the complicated operational conditions and numerous measurement devices, the performance of the linear regression model will deteriorate. Therefore, we select the deep learning method to extract the features of nodes on the premise of obtaining reconstituted measurement data samples. Deep learning techniques offer robust feature extraction capabilities, making them well-suited to handle the complexities and noise inherent in medium-voltage distribution networks.
2.2 System graph construction
Using network topology as a graph to analyze features allows for a more comprehensive utilization of structural information compared to solely relying on measurement data. Graph data
In constructing the general distribution network diagram model, the bus is typically regarded as the node and the connecting line as the edge. However, graph learning focuses on node features. Therefore, for parameter identification tasks, we consider parameters as nodes of the graph and common buses between lines as edges to represent the connection relationships between lines. The feature extraction process is illustrated in the following Figure 1.
For undirected graph
Use Chebyshev polynomials
Then the convolution process is approximately defined as Equation 5 by using first-order Chebyshev polynomial to generate the local convolution kernel:
In this formula,
where
3 GAT-MMoE model design for line parameter identification
3.1 Graph attention module design
Graph Attention Network (GAT) combines a graph neural network (GNN) with an attention mechanism, specifically tailored for processing graph-structured data by assigning different attention to neighboring nodes on a graph (Velickovic et al., 2017). It can reduce the computational cost and make it more scalable than methods that consider all neighbors equally, such as traditional Graph Convolutional Networks (GCNs). This flexibility is particularly important for large, sparse graphs. In this paper, GAT module is applied to transform the feature of each node into an inter-node attention coefficient through the graph attention layer, producing a new feature that allows for monitoring changes in neighboring nodes. Thus, information about each branch line and the distribution of impedance values between adjacent branches can be learned, improving the accuracy of parameter identification. We input
First, the voltage amplitude of nodes under a single time section is input into the graph attention network to calculate the similarity between each node and its neighbors in the distribution network. For each node i, calculate the corresponding coefficient between node j and itself:
where
After obtaining the correlation coefficient for all the neighboring nodes of node i, the attention coefficient is normalized using softmax:
Where
After the attention weights of all nodes are normalized, the information of nodes is extracted through the graph attention layer. For different features, different attention weights need to be assigned. If only single-layer attention is used, the same attention weights are applied to all attributes of the neighbourhood node, which will weaken the learning ability of the model. The specific calculations in each layer are shown in Equations 9–11.
In each attention layer, we use this to weigh the messages of a node’s neighbours, which are the neighbour’s features multiplied by the same learnable weight matrix W. We do this for each attention head and concatenate the result of the heads together:
K is the attention head number and we choose Sigmoid as the activation function. The feature hi'
3.2 Multi-task module design
In the parameter identification work of distribution networks, multiple branches typically require parameter identification, with each branch having multiple target parameters to identify. The magnitudes of branch resistance and reactance are generally quite different, but their characteristics depend on the same factors. Moreover, branch data are strongly interrelated, and variations in the electrical variables of one transmission branch often affect the measurement data of the entire distribution network. Multi-task learning leverages the correlations between multiple tasks to optimize the performance of multi-parameter identification. In this paper, a multi-task strategy is employed to identify multiple targets simultaneously, thereby reducing computational effort. According to previous works, different branches are identified as independent tasks.
3.2.1 Model choosing and sharing policy
The Mixture of Experts (MoE) approach was initially developed and explored within the field of artificial neural networks, where experts are typically neural network models used to predict numerical values in regression or class labels in classification. To capture differences among multiple branch line parameter identification tasks, a gating network is added for each task, forming the Multi-gate Mixture of Experts (MMoE) model on the basis of MoE (Shazeer et al., 2017; Ma et al., 2018). The MMoE enhances performance by allowing multiple tasks to share a set of expert networks, while also assigning different combinations of those experts to each task. The architecture setup which contains a set of expert networks and gating networks enables better task-specific learning and reduces the risk of overfitting, especially when different tasks are related but still require some specialization. For medium-voltage distribution systems, which face constantly changing conditions like load variations and fault scenarios, traditional methods like FCNs often struggle to adapt in real-time across multiple tasks without significant re-calibration. MMoE excels in these environments by providing a more efficient and adaptive solution, improving both accuracy and reliability in parameter identification across different branches.
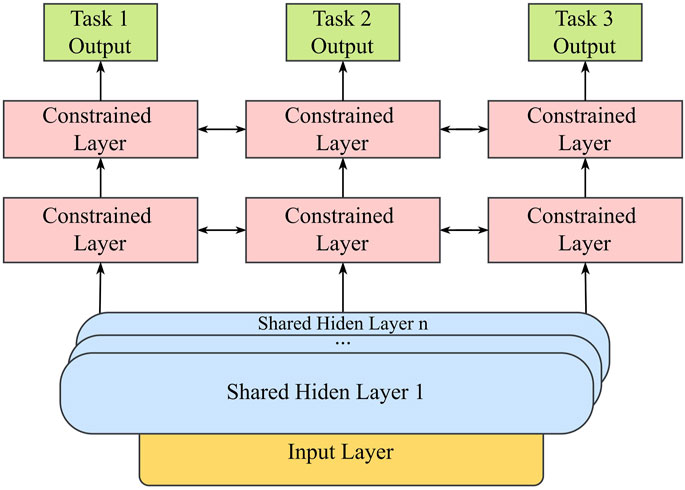
Multi-task learning can be divided into two mechanisms: hard parameter sharing, where different tasks share the bottom hidden layer, and soft parameter sharing. Both mechanisms have their advantages and disadvantages. In the hard sharing mechanism, parameter sharing is used for feature extraction and output, reducing the risk of overfitting. However, if task differences are large, the model results become less credible (Jacobs et al., 1991; Eigen et al., 2013). The MMoE module represents a soft parameter sharing model, using expert networks as shared substructures for parameter sharing. Each task employs a gating network to learn different combination patterns of the expert networks. Compared to the hard parameter sharing model, MMoE handles task differences more effectively and has demonstrated better performance in practice. The principle is shown in Figure 2.
The MMoE model primarily consists of two core components: Gate Net and Experts. The role of Gate Net is to establish a connection between the data and the expert model, determining which expert model should process the input sample. Experts form a relatively independent set of models, each responsible for handling a specific input subspace. First, multiple branch identification tasks are decomposed into several sub-tasks, each corresponding to a network, with an expert model trained in each subnet. We use Equations 12–14 to represent the model construction.
Let x represent the model input, for task k, the MMoE model is formulated as
where n represents the number of tasks,
For the multi-branch parameter identification task, only highly correlated experts are selected to provide accurate answers. The expert model in this paper is implemented using Multilayer Perceptrons (MLPs). Output results are obtained using pooling methods to achieve a weighted sum prediction based on expert weights. The gated model then receives data elements as input, assigns them to different expert models for inference, and outputs weights representing each expert’s contribution to processing the data. The pooling system calculates a weighted sum of the classifier outputs for each class and selects the class with the highest weighted sum. To control overall sparsity, the design and parameter adjustment of the gated network are primarily relied upon when there are many learning tasks. The involvement of more expert models increases the complexity of the calculation. If the gated network activates more expert models in a single selection, model performance improves and sparsity is reduced.
3.2.2 Loss function design
In MTL, label loss is the loss in the calculation of real data labels and network prediction labels for each task. Usually, the label loss is determined by the nature of the learning task and is realized through Equation 15 by weighted summation of the loss of different tasks:
However, simply using linear weighting of multiple task losses has some significant disadvantages. Therefore, according to Cipolla et al. (2018) and Fernandez-Delgado et al. (2019), considering the distinctive contributions of different tasks to helping the final results, we use homoscedastic uncertainty as a basis for weighting losses to adjust the influence of tasks in the final loss function for optimizing the whole framework. Take two tasks, for example, the log likelihood for this output can then be written as Equations 16, 17:
The multiple final loss is Equation 19:
3.3 Overall framework of the proposed method
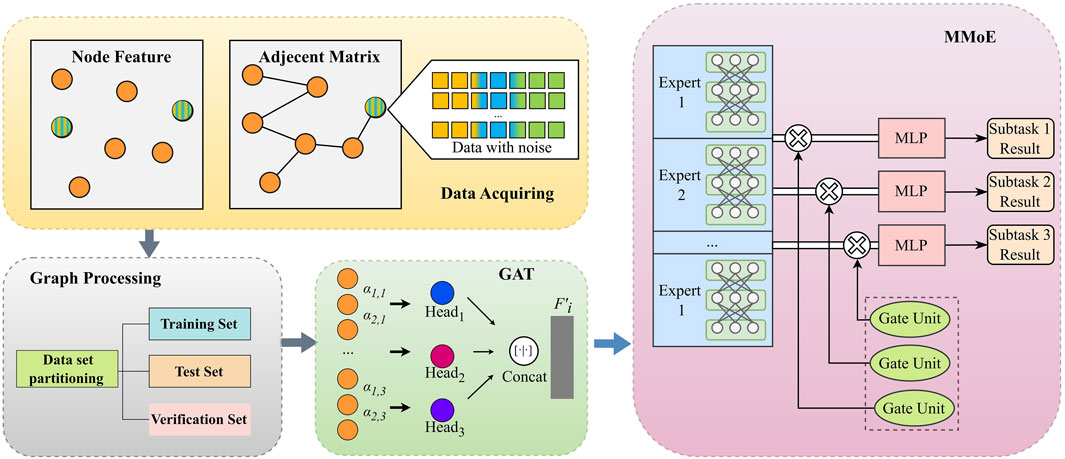
The overall framework of the proposed GAT-MMoE for distribution line parameter identification is depicted in Figure 3 As shown in Figure 3, a multi-task learning model based on an attention graph is constructed. The input of GAT-MMoE we proposed is feature matrix X and the adjacency matrix A, which means that our input features contain
where
To overcome the DLPI problems, the system graph is established according to the description in Section 2, with each node corresponding to a physical bus in the distribution network. The input feature of the distribution system is expressed as
The GAT module extracts the characteristics of the system and pays attention to different branch information in different subspaces by using multi-head attention mechanism. Then the different subspaces are concatenated to infuse the learnt information. The features information is then input into the multi-task module for training. The multi-task module is an MMoE-backboned MTL module, which contains multiple expert subnetworks. Gate control units are used to calculate the loss for different tasks during the training process and update the parameters related to each task based on the loss. The model’s outputs are the estimated branch line impedance.
4 Case studies
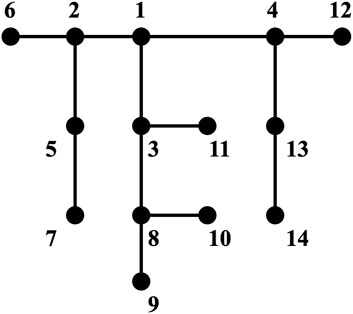
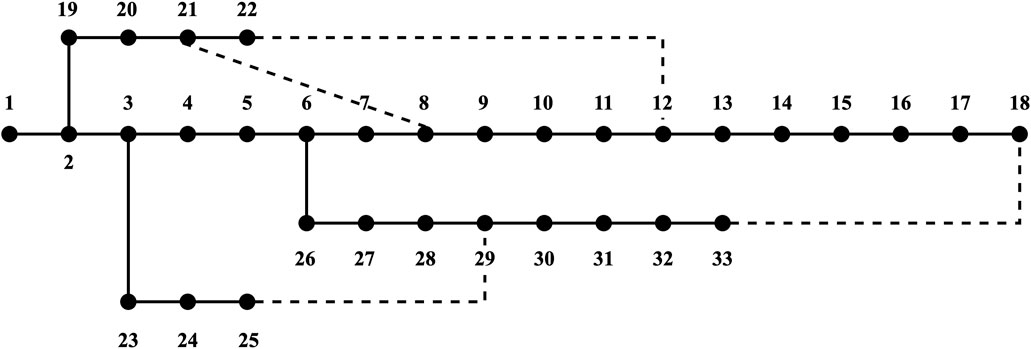
In this section, the IEEE 14-node distribution network (case 1) and the IEEE 33-node distribution network (case 2) are selected as research objects to verify the effectiveness and robustness of the proposed method. The corresponding topological structure of the system is represented by Figures 4, 5. Experiments are performed on a computer with Intel Core i7-8700K @ 3.70 GHz CPU, and NVIDIA GeForce RTX 3060 Ti GPU. It utilizes Python3.10, Pytorch2.0.1 and pandapower2.13.1.
4.1 Dataset description
The power flow formula of power system is as follows:
According to Equation 21, Node voltage, active power and reactive power data are simulated by pandapower toolkit (Thurner et al., 2018). The active power injected by nodes in the load data is sampled by the Latin hypercube sampling method at
where
In this paper, 20 types of radiative network topologies are selected, then we add Gaussian noise with σ of 0.01, 0.03, 0.5, 1, 2 to each load level, and sample each noise 6 times. A total of 69,120 sets of samples are obtained and divided, including 70% data as training set, 20% data as test set, 10% data as verification set. The hyperparameters of the model, such as the attention coefficient α, and learning rates are determined by 10% of the data set.
4.2 Evaluation index and baseline model setup
A suite of metrics is employed to manifest the performance of the model proposed in this work. Specific calculation formula as shown in Equations 23, 24:
Root mean square error (RMSE):
Mean absolute percentage error (MAPE):
Where
In order to prove the validity of our proposed model, we adopt the following methods as baselines:
1) LR: By minimizing the sum of squares of errors, the linear regression model is used to provide coefficients that quantify the contribution of each feature to the target variable, but may face the problem of overfitting.
2) SVR: Support vector regression is a machine learning method, which adopts the idea of support vector and the Lagrange multiplier to perform regression analysis on data when doing data fitting.
3) FCN: Fully connected neural network is a type of linear neural network, which inevitably faces the problem of poor precision in dealing with nonlinear data sets and overfitting. Fully connected prediction is accomplished by flattening the input matrix.
In our implementation, the GAT module utilizes three attention heads, with a hidden representation dimensionality set to 128 and a dropout rate of 0.3. For optimization, we use a batch size of 128 and a learning rate of 0.005. The MMoE module is trained with the Adam optimizer and the learning rate is grid searched from [0.0001, 0.001, 0.01]. To prevent overfitting in both the expert and gating networks, the dropout rate is 0.2. Different weights of each task are assigned using homoscedastic uncertainty.
4.3 Results and discussion
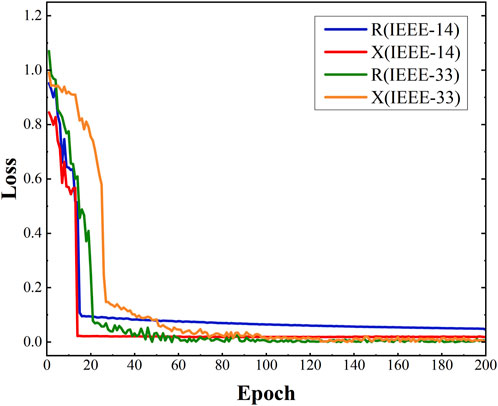
According to Figure 6, We can find that the gradient of our proposed model decreases rapidly and converges fast after around the 20th epoch with little change in accuracy, which demonstrates the superiority of our model in deep learning-based algorithms.
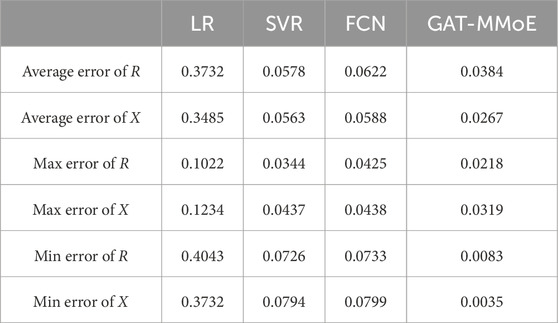
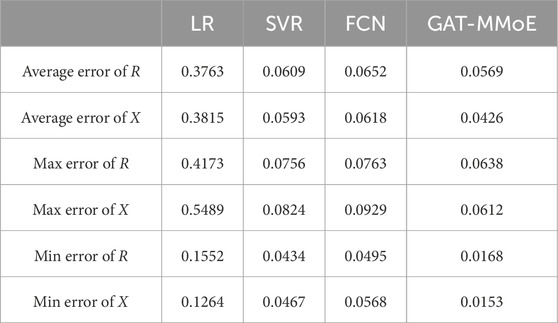
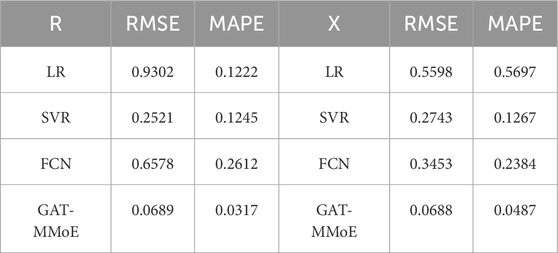
From Figure 7, it can be noticed that the proposed GAT-MMoE model can effectively identify the branch line parameters. For case 1, the max relative errors lie in branch 7 and 1 respectively for R and X, reaching 3.83% and 4.35%. Table 1 shows the parameter identification errors of branch resistance and reactance, the corresponding average errors are 3.84% and 2.67% for R and X. For case 2, the relative max errors are 9.63% and 9.87%. From Table 2, average errors for R and X are 6.69% and 7.24%. The GAT-MMoE model can achieve the lowest error in most cases. The deviation comes from the Gaussian noise we add and as the resistance and reactance have different orders of magnitude, the errors are within the allowable range.
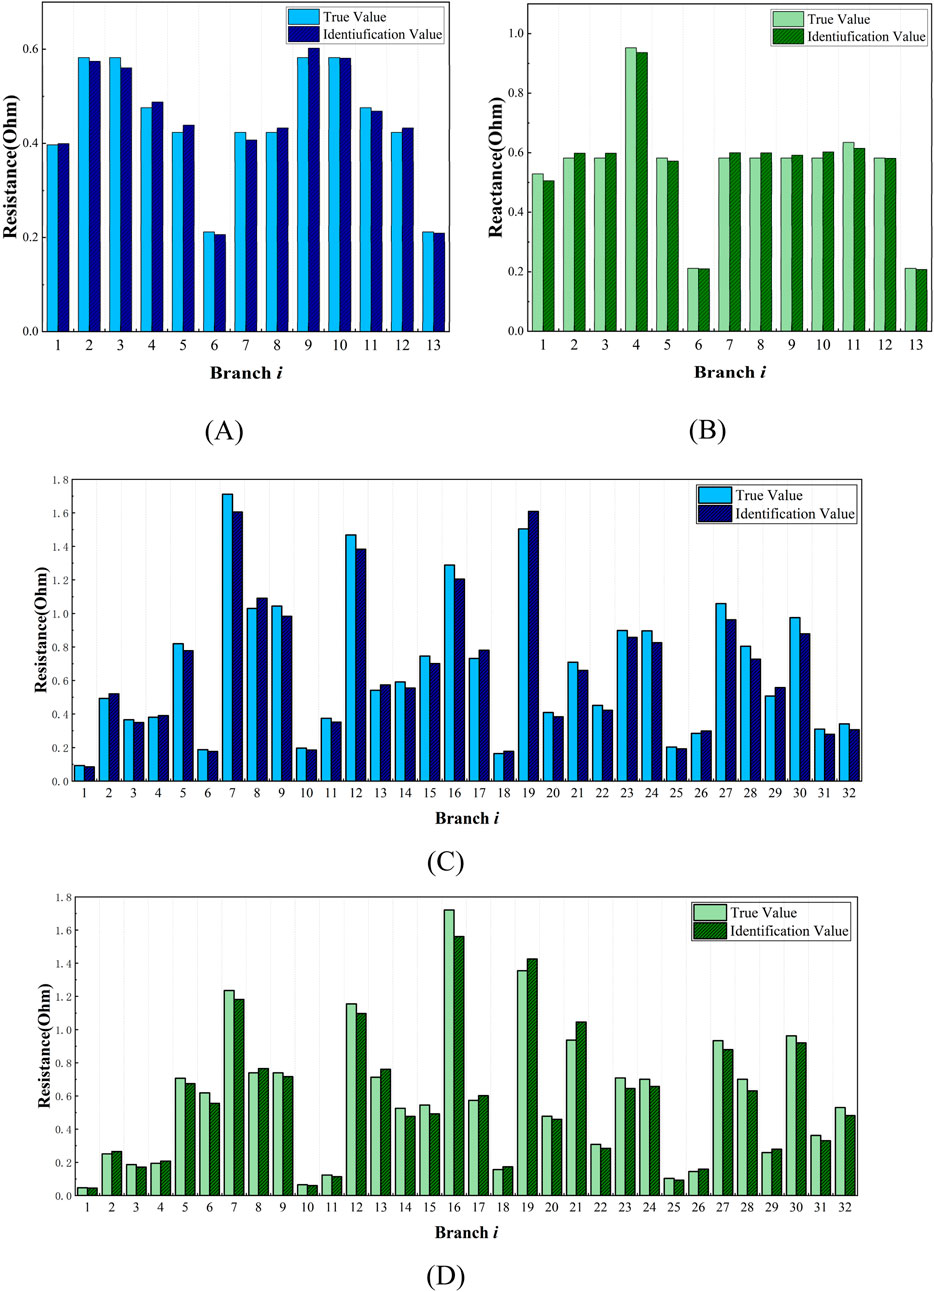
Figure 7. Identification results presented with true values and identification values. (A) line resistance of IEEE-14 system; (B) line reactance of IEEE-14 system; (C) line resistance of IEEE-33 system; (D) line reactance of IEEE-33 system.
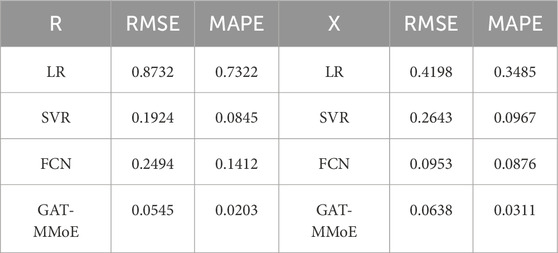
Compared with the baseline model, our proposed GAT-MMoE model demonstrates higher accuracy and better robustness considering measurement error. The results in Tables 1–4 indicate that the proposed GAT-MMoE method outperforms all other models in terms of RMSE and MAPE. Network-based methods generally show superior performance compared to linear regression and traditional machine learning methods, underscoring the value of graph attention learning in extracting high-quality features for DLP prediction. The superior performance of GAT-MMoE can be attributed to its effective utilization of related knowledge between neighboring nodes in the graph. Most baseline methods do not specifically address the issue of sparsity in their models, resulting in suboptimal performance. Our model leverages multiple data sources to construct the information network and employs a multi-task learning framework to address the specific task of predicting branch line parameters. Consequently, GAT-MMoE outperforms the selected baselines. Additionally, the model demonstrates good robustness when photovoltaic power supply is integrated into the system. Once the model training is completed, it can simultaneously predict all parameters of the power grid branch. Despite the lengthy training process, the method’s robustness and accuracy compensate for this drawback. Moreover, the trained neural network model can be easily and rapidly deployed to the required locations, making it a practical solution for real-world applications.
From Tables 3, 4, different we can find that our proposed GAT-MMoE model achieves the best identification results in most cases. The indexes of multi-task learning model are better than that of single task learning model. By comparing the machine learning methods, we can find that the LR method achieves very good identification results without noise, but when the input features contain disturbance and noise, the accuracy of branch parameter identification is greatly reduced. Deep learning method like FCN fail to balance accuracy between resistance and reactance, as the loss function is only simple addition. Also, the method is more inclined to the identification result of line resistance R and ignores the branch reactance X.
The influence of distributed photovoltaic access on the proposed identification method is further explored. We incorporated multiple distributed photovoltaic (PV) systems into the distribution network, with the power data of the PV sources derived from the Desert Knowledge Australia Solar Centre (DKA Solar Center, 2024) We integrated PV1 and PV2 at nodes 7 and 12 in the IEEE 14-bus system, and at nodes 22 and 33 in the IEEE 33-bus system. Based on the sampling frequency of every 15 min, the system node data is obtained by power flow calculation. After collecting system P, Q, and V data over multiple time profiles, we input them into the model for parameter identification. Figure 8 shows that the identification error increases when a distributed power supply is present in the network. This increase is due to the changes in power flow direction caused by the integration of distributed photovoltaics. However, the identification errors remain within the acceptable range, demonstrating the robustness of the method.

Figure 8. Identification results in IEEE-33 system with PV access: (A) line resistance MAPE of IEEE-33 system; (B) line reactance MAPE of IEEE-33 system.
For most existing distribution power system, the complexities and dynamic conditions present unique challenges and opportunities for parameter identification. Given that most existing power grid branch parameter identification methods are model-driven, resulting in low accuracy and poor reliability, our proposed model leverages a large volume of multi-source power grid operation data. It is constrained by the grid topology while integrating both local and global information. This approach allows for the comprehensive use of historical data to more accurately identify branch parameters, which can be then fed back to the power grid dispatch center. As a result, dispatch operators gain a clearer understanding of the changing trends in branch parameters, ensuring the safe and stable operation of the power grid.
5 Conclusion
Parameter identification is crucial for distribution network scheduling and control, making it a significant research task. Current methods, which are primarily model-driven, are sensitive to data loss and noise. This paper introduces a novel line parameter identification method for medium-voltage distribution networks, considering the topology constraints of power network branches and being validated on IEEE14-M and IEEE33 systems. When there are too many layers of adjacent nodes, the global information tends to become similar, resulting in redundancy. By introducing an attention mechanism, the proposed method focuses on relatively important nodes and perform feature fusion on key branches and features. The proposed method consists of three components: graph generation, attention calculation, and multi-task prediction. The GAT module uses adaptive attention weights to flexibly model dependencies among different nodes. The MMoE algorithm addresses the coupling characteristics among multiple branches by utilizing multiple expert networks, thereby improving accuracy.
The method’s effectiveness and robustness are validated through simulated grid tests, demonstrating improved results compared to traditional methods. Results show that the GAT-MMoE method achieves lower identification deviations 3.84% and 2.67% in IEEE14-M, and 5.69% and 4.26% in IEEE33 compared to the LR, SVR and FCN methods, achieving high prediction accuracy, good performance, and robustness against various types of noise.
Moreover, the GAT-MMoE method relies solely on nodal measurements of injected active power, reactive power, and voltage magnitude, streamlining the identification process without compromising accuracy. As smart grid technologies continue to evolve, data-driven deep learning approaches will play an increasingly important role in improving parameter identification in distribution networks. Future work will aim to extend this approach to a wider range of line parameters while addressing issues such as limited data availability and dynamic topology adaptation.
Data availability statement
The original contributions presented in the study are included in the article/supplementary material, further inquiries can be directed to the corresponding author.
Author contributions
XJ: Writing–original draft, Writing–review and editing. CZ: Formal Analysis, Methodology, Writing–review and editing. QP: Validation, Visualization, Writing–review and editing. LW: Investigation, Writing–review and editing. BW: Writing–original draft. YX: Software, Writing–review and editing. KC: Resources, Writing–review and editing. LF: Supervision, Writing–review and editing.
Funding
The author(s) declare that financial support was received for the research, authorship, and/or publication of this article. The authors received funding from the Technology Project of State Grid Co., Ltd. of Jiangsu Province (J2023018).
Acknowledgments
The authors would like to thank and acknowledge the Suzhou Power Supply Company, State Grid Jiangsu Electric Power Co., Ltd.
Conflict of interest
Authors XJ, CZ, QP, LW, BW, YX, KC, and LF were employed by Suzhou Power Supply Company, State Grid Jiangsu Electric Power Co., Ltd.
The authors declare that this study received funding from the Technology Project of State Grid Co., Ltd. of Jiangsu Province .The funder had the following involvement in the study: study design, data collection and analysis, decision to publish, preparation of the manuscript.
Publisher’s note
All claims expressed in this article are solely those of the authors and do not necessarily represent those of their affiliated organizations, or those of the publisher, the editors and the reviewers. Any product that may be evaluated in this article, or claim that may be made by its manufacturer, is not guaranteed or endorsed by the publisher.
References
Abomazid, A. M., El-Taweel, N. A., and Farag, H. E. Z. (2022). Optimal energy management of hydrogen energy facility using integrated battery energy storage and solar photovoltaic systems. IEEE Trans. Sustain. Energy 13, 1457–1468. doi:10.1109/TSTE.2022.3161891
Asprou, M., and Kyriakides, E. (2018). “Identification and estimation of erroneous transmission line parameters using PMU measurements,” in 2018 IEEE power and energy Society general meeting (PESGM), 1. doi:10.1109/PESGM.2018.8585896
Cheng, L. (2020). Equilibrium analysis of general N-population multi-strategy games for generation-side long-term bidding: An evolutionary game perspective. J. Clea. Product. 276, 124123. doi:10.1016/j.jclepro.2020.124123
Cheng, L., Chen, Y., and Liu, G. (2022). 2PnS-EG: a general two-population n-strategy evolutionary game for strategic long-term bidding in a deregulated market under different market clearing mechanisms. Int. J. Electr. Power Energy Syst. 142, 108182. doi:10.1016/j.ijepes.2022.108182
Cheng, L., Yin, L., Wang, J., Shen, T., Chen, Y., Liu, G., et al. (2021). Behavioral decision-making in power demand-side response management: a multi-population evolutionary game dynamics perspective. Int. J. Electr. Power Energy Syst. 276, 106743. doi:10.1016/j.ijepes.2020.106743
Cheng, L., and Yu, T. (2019). A new generation of AI: a review and perspective on machine learning technologies applied to smart energy and electric power systems. Int. J. Energy Res. 43, 1928–1973. doi:10.1002/er.4333
Cipolla, R., Gal, Y., and Kendall, A. (2018). “Multi-task learning using uncertainty to weigh losses for scene geometry and semantics,” in 2018 IEEE/CVF Conference on computer Vision and pattern Recognition, (Salt lake City, UT, USA: IEEE), 18-23 June 2018, 7482–7491. doi:10.1109/CVPR.2018.00781
DKA Solar Center (2024). General: Desert Knowledge Australia Centre. Alice Springs, Australia: Download Data. Alice Springs. Available at: http://dkasolarcentre.com.au/download (Accessed June 20, 2024).
Eigen, D., Ranzato, M., and Sutskever, I. (2013). Learning factored representations in a deep mixture of experts. arXiv.Org. Available at: https://arxiv.org/abs/1312.4314v3 (Accessed July 10, 2024). doi:10.48550/arXiv.1312.4314
Fernández-Delgado, M., Sirsat, M. S., Cernadas, E., Alawadi, S., Barro, S., and Febrero-Bande, M. (2019). An extensive experimental survey of regression methods. Neural Netw. 111, 11–34. doi:10.1016/j.neunet.2018.12.010
Jacobs, R. A., Jordan, M. I., Nowlan, S. J., and Hinton, G. E. (1991). Adaptive mixtures of local experts. Neural comput. 3, 79–87. doi:10.1162/neco.1991.3.1.79
Li, C., Zhang, Y., Zhang, H., Wu, Q., and Terzija, V. (2018). Measurement-based transmission line parameter estimation with adaptive data selection Scheme. IEEE Trans. Smart Grid 9, 5764–5773. doi:10.1109/TSG.2017.2696619
Li, H., Weng, Y., Vittal, V., and Blasch, E. (2024). Distribution grid topology and parameter estimation using deep-shallow neural network with physical consistency. IEEE Trans. Smart Grid 15, 655–666. doi:10.1109/TSG.2023.3278702
Li, X., Wang, S., and Lu, Z. (2022). Reverse identification method of line parameters in distribution network with multi-T nodes based on partial measurement data. Electr. Pow. Syst. Res. 204, 107691. doi:10.1016/j.epsr.2021.107691
Li, Y., Zhang, H., Liang, X., and Huang, B. (2019). Event-triggered-based distributed cooperative energy management for multienergy systems. IEEE Trans. Ind. Inf. 15, 2008–2022. doi:10.1109/TII.2018.2862436
Lin, Y., and Abur, A. (2018). Strategic use of synchronized phasor measurements to improve network parameter error detection. IEEE Trans. Smart Grid 9, 5281–5290. doi:10.1109/TSG.2017.2686095
Ma, J., Zhao, Z., Yi, X., Chen, J., Hong, L., and Chi, E. H. (2018). “Modeling task relationships in multi-task learning with multi-gate mixture-of-experts,” in Proceedings of the 24th ACM SIGKDD International Conference on knowledge Discovery & data mining, 1930–1939. doi:10.1145/3219819.3220007
Pegoraro, P. A., Brady, K., Castello, P., Muscas, C., and von Meier, A. (2019a). Compensation of systematic measurement errors in a PMU-based monitoring system for electric distribution grids. IEEE Trans. Instrum. Meas. 68, 3871–3882. doi:10.1109/TIM.2019.2908703
Pegoraro, P. A., Brady, K., Castello, P., Muscas, C., and von Meier, A. (2019b). Line impedance estimation based on synchrophasor measurements for power distribution systems. IEEE Trans. Instrum. Meas. 68, 1002–1013. doi:10.1109/TIM.2018.2861058
Pegoraro, P. A., Castello, P., Muscas, C., Brady, K., and von Meier, A. (2017). “Handling instrument transformers and PMU errors for the estimation of line parameters in distribution grids,” in 2017 IEEE international workshop on applied measurements for power systems (AMPS), 1–6. doi:10.1109/AMPS.2017.8078339
Pegoraro, P. A., Sitzia, C., Solinas, A. V., and Sulis, S. (2022). PMU-based estimation of systematic measurement errors, line parameters, and tap changer ratios in three-phase power systems. IEEE Trans. Instrum. Meas. 71, 1–12. doi:10.1109/TIM.2022.3165247
Puddu, R., Brady, K., Muscas, C., Pegoraro, P. A., and Von Meier, A. (2018). “PMU-based technique for the estimation of line parameters in three-phase electric distribution grids,” in 2018 IEEE 9th international workshop on applied measurements for power systems (AMPS), 1–5. doi:10.1109/AMPS.2018.8494886
Shazeer, N., Mirhoseini, A., Maziarz, K., Davis, A., Le, Q., Hinton, G., et al. (2017). Outrageously large neural networks: the sparsely-gated mixture-of-experts layer. doi:10.48550/arXiv.1701.06538
Shi, X., Qiu, R., He, X., Ling, Z., Yang, H., and Chu, L. (2020). Early anomaly detection and localisation in distribution network: a data-driven approach. IET Gener. Transm. Distrib. 14, 3814–3825. doi:10.1049/iet-gtd.2019.1790
Shi, Z. ., Xu, Q., Liu, Y., Wu, C., and Yang, Y. (2024). Line parameter, topology and phase estimation in three-phase distribution networks with non-μPMUs (2024). Int. J. Electr. Power Energy Syst. 155, 109658. doi:10.1016/j.ijepes.2023.109658
Singh, R. S., Cobben, S., Gibescu, M., van den Brom, H., Colangelo, D., and Rietveld, G. (2018). “Medium voltage line parameter estimation using synchrophasor data: a step towards dynamic line rating,” in 2018 IEEE power and energy society general meeting (PESGM), 1–5. doi:10.1109/PESGM.2018.8586111
Sun, J., Xia, M., and Chen, Q. (2019). A classification identification method based on phasor measurement for distribution line parameter identification under insufficient measurements conditions. IEEE Access 7, 158732–158743. doi:10.1109/ACCESS.2019.2950461
Thurner, L., Scheidler, A., Schäfer, F., Menke, J.-H., Dollichon, J., Meier, F., et al. (2018). Pandapower—an open-source python tool for convenient modeling, analysis, and optimization of electric power systems. IEEE Trans. Power Syst. 33, 6510–6521. doi:10.1109/TPWRS.2018.2829021
Velickovic, P., Cucurull, G., Casanova, A., Romero, A., Lio', P., and Bengio, Y. (2017). Graph attention networks. ArXiv. doi:10.48550/arXiv.1710.10903
Wang, W., and Yu, N. (2022). Estimate three-phase distribution line parameters with physics-informed graphical learning method. IEEE Trans. Power Syst. 37, 3577–3591. doi:10.1109/TPWRS.2021.3134952
Wang, Y., Xu, X., and Xue, H. (2016). Method to measure the unbalance of the multiple-circuit transmission lines on the same tower and its applications. IET Gener. Transm. Distrib. 10, 2050–2057. doi:10.1049/iet-gtd.2015.0979
Wang, Z., Xia, M., Lu, M., Pan, L., and Liu, J. (2022). Parameter identification in power transmission systems based on graph convolution network. IEEE Trans. Power Del. 37, 3155–3163. doi:10.1109/TPWRD.2021.3124528
Xia, M., Wang, Z., Lu, M., and Pan, L. (2022). MFAGCN: a new framework for identifying power grid branch parameters. Electr. Pow. Syst. Res. 207, 107855. doi:10.1016/j.epsr.2022.107855
Xiao, M., Xie, W., Fang, C., Wang, S., Li, Y., Liu, S., et al. (2021). Distribution line parameter estimation driven by probabilistic data fusion of D-PMU and AMI. IET Gener. Transm. Distrib. 20, 2883–2892. doi:10.1049/gtd2.12224
Yang, L., Li, X., Sun, M., and Sun, C. (2023). Hybrid policy-based reinforcement learning of adaptive energy management for the energy transmission-constrained island group. IEEE Trans. Ind. Inf. 19, 10751–10762. doi:10.1109/TII.2023.3241682
Yang, N.-C., Huang, R., and Guo, M.-F. (2022). Distribution feeder parameter estimation without synchronized phasor measurement by using radial basis function neural networks and multi-run optimization method. IEEE Access 10, 2869–2879. doi:10.1109/ACCESS.2021.3140123
Yu, J., Weng, Y., and Rajagopal, R. (2018). PaToPa: a data-driven parameter and topology joint estimation framework in distribution grids. IEEE Trans. Power Syst. 33, 4335–4347. doi:10.1109/TPWRS.2017.2778194
Yu, J., Weng, Y., and Rajagopal, R. (2019). PaToPaEM: a data-driven parameter and topology joint estimation framework for time-varying system in distribution grids. IEEE Trans. Power Syst. 34, 1682–1692. doi:10.1109/TPWRS.2018.2888619
Zhang, Y., Wang, J., and Li, Z. (2020). Interval state estimation with uncertainty of distributed generation and line parameters in unbalanced distribution systems. IEEE Trans. Power Syst. 35, 762–772. doi:10.1109/TPWRS.2019.2926445
Zhu, J., and Abur, A. (2010). Improvements in network parameter error identification via synchronized phasors. IEEE Trans. Power Syst. 25, 44–50. doi:10.1109/TPWRS.2009.2030274
Keywords: line-parameter identification, multi-task learning, mixture of experts, medium-voltage distribution system, graph attention network
Citation: Jiang X, Zhou C, Pan Q, Wang L, Wu B, Xu Y, Chen K and Fu L (2024) A multi-task learning based line parameter identification method for medium-voltage distribution network. Front. Energy Res. 12:1485369. doi: 10.3389/fenrg.2024.1485369
Received: 23 August 2024; Accepted: 18 October 2024;
Published: 04 November 2024.
Edited by:
Yang Yu, Nanjing University of Posts and Telecommunications, ChinaCopyright © 2024 Jiang, Zhou, Pan, Wang, Wu, Xu, Chen and Fu. This is an open-access article distributed under the terms of the Creative Commons Attribution License (CC BY). The use, distribution or reproduction in other forums is permitted, provided the original author(s) and the copyright owner(s) are credited and that the original publication in this journal is cited, in accordance with accepted academic practice. No use, distribution or reproduction is permitted which does not comply with these terms.
*Correspondence: Chenbin Zhou, ZW5ldHdvcmtfc3pAMTYzLmNvbQ==
 Xuebao Jiang
 Chenbin Zhou
