- 1Electric Power Research Institute, State Grid Shanxi Electric Power Company, Tai Yuan, China
- 2School of Electrical Engineering, Xi’an Jiaotong University, Xi’an, China
Distribution transformers are vital to the stability of the power system, but long-term operation and environmental factors can cause distribution transformers to discharge, posing a potential threat. The impulse voltage withstand test rigorously evaluates the insulation of the transformer windings, to prevent accidents caused by insulation breakdown. However, due to the small size of distribution transformers, impulse voltage withstand test breakdown usually cause less damage, and it is challenging to locate the point of failure using traditional methods such as spatial positioning or disassembly. Therefore, the study of the discharge location method based on the characteristic value of the frequency response waveform is of great significance to find and deal with potential faults. This paper discusses the waveform characteristics of different discharge signals transmitted from different positions of the winding to the end. By analyzing the frequency response of different breakdown current signals measured at the end of the transformer winding, support vector machine is used to identify the breakdown position of the distribution transformer. The approximate location of the fault was identified with more than 80% accuracy. The feasibility and effectiveness of this localization method are verified by experiments.
1 Introduction
Distribution transformer plays a vital role in power system, but due to the influence of long-term operation and environmental factors, it may have breakdown phenomenon, which poses a potential threat to the stability and security of power system. The impulse voltage has the characteristics of high amplitude and high steepness, which can detect small defects in the insulation system, improve the reliability of the transformer, reduce the risk of damage, and extend the life of the equipment, so as to ensure the safe and stable operation of the distribution transformer (Zhang et al., 2020). At present, the impulse voltage withstand test has become one of the distribution transformer factory must do the test. By studying the transformer fault location method, it can avoid the multiple pendant checks caused by the fault point is not obvious, the operation and maintenance personnel misjudge the fault cause and increase the workload, improve the test efficiency and reduce the waste of manpower and material resources.
At present, common discharge detection methods are divided into non-electrical and electrical measurement methods, mainly including ultrasonic method, Ultra High Frequency (UHF) method, pulse current method, etc., which detect discharge by measuring different physical phenomena (ultrasonic wave, electromagnetic wave, current pulse) simultaneously with discharge (Cavallini et al., 2010; Desai and Sarathi, 2018). Among them, ultrasonic method and UHF method use sensors for discharge detection (Liu et al., 2020). The ultrasonic positioning technology determines the discharge position by measuring the time difference between the ultrasonic signal and the electrical pulse signal (Xie et al., 2013; Al-Masri et al., 2016), and its strong anti-interference ability and portability make it popular in field applications. However, due to the complexity of the internal structure of the transformer, the propagation speed of the ultrasonic wave in different media is difficult to keep constant, and this fixed sound speed assumption often leads to the deviation of the positioning results. UHF positioning technology (Mirzaei et al., 2012; Jahangir et al., 2020) uses the electromagnetic wave signal generated during discharge to locate, and its high anti-interference and fast positioning speed make it a research hotspot. However, the penetration ability of electromagnetic waves in metals and other media is limited, especially in the environment filled with metal parts such as transformers, the signal attenuation problem is particularly prominent, thus limiting the positioning accuracy of the technology. Due to the high sealing of oil-immersed distribution transformers, the installation of sensors is inconvenient, and it is difficult to apply in thea transformer factory test (Xiao et al., 2014). Pulse current method can conduct quantitative and qualitative analysis of discharge signals, and is an effective method for locating discharge sources (Cavallini et al., 2010; Okabe et al., 2011). However, it requires input voltage signals and has weak anti-interference ability, so it is not suitable for discharge detection under impulse voltage withstand test (Okabe et al., 2012). In view of this situation, it is important to study the efficient method of breakdown point location of distribution transformer under impact test for transformer fault detection and location.
As the core component that undertakes most of the functions of the transformer, the health of the winding directly determines the safety of the transformer operation. In the incomplete statistics of power transformer failure events, more than half of the cases are caused by winding failure, most of which are caused by insulation problems (Martin et al., 2018). Therefore, the maintenance of good insulation condition of windings and timely detection and maintenance of insulation faults are very important support for stable transmission of electric energy.
With the increasing scale and complex structure of transformers, positioning methods based on measuring signal frequency spectrum have emerged gradually in the 21st century. In these studies, the double exponential pulse signal is used as the analog signal type. The positioning method based on signal spectrum analysis has gradually emerged and become the mainstream. Reference (Akbari et al., 2002) utilized the measured segmental winding transfer function curve to restore the local discharge waveform to the time-domain curve of each internal point, and positioned it by the degree of waveform coincidence. Reference (Hettiwatte et al., 2002; Wang et al., 2005) proposed a positioning method based on the measured signal itself, by calibrating the formula parameters and measuring the resonance point of the local signal to complete the positioning. These methods based on frequency spectrum analysis effectively deal with the challenges brought by complex transformer structures, and gradually become a reliable positioning technology. Reference (Eldery et al., 2006) used the power spectrum density estimation method based on the period diagram to analyze the voltage signal of the low voltage winding during the local discharge of the high voltage winding, and used the distance function to compare the simulated and measured power spectrum of the local discharge to determine the discharge position. Some studies (Jafari et al., 2008) achieved discharge localization by calculating the reference curve of the fragment transfer function in advance and comparing the distance function with the measured partial discharge spectrum. Reference (Naderi et al., 2008) completes the ratio method electrical positioning by using the all-time wavelet transform of the local discharge signals at the head and end of the winding and the α value determined by the capacitive component method.
Based on the winding design parameters, reference (Jyabalan and Usa, 2009) uses Gram-Schimidt orthodontic method to process the reference spectrum signal, and then compares with the measured local discharge spectrum and positioning, achieving good results. Later, the scholar studied the winding local discharge positioning based on regression analysis, statistical correlation method and correlation phase analysis (Jeyabalan and Usa, 2011). Based on the reference signal and actual local discharge signal of each node during discharge obtained by simulation of winding model, reference (Guillen et al., 2014) used Laplace wavelet transform and Hellinger distance comparison algorithm to accurately locate the discharge.
However, the discharge pulse signals in actual operation are often more complex and diverse (Mohseni et al., 2016). Therefore, it is of great significance to establish a more accurate simulation model based on real distribution transformers and study the propagation characteristics of discharge pulse signals in windings to improve the accuracy of fault location.
This paper investigates the feasibility of a location algorithm based on the frequency diagram of breakdown current signals for oil-immersed distribution transformers under different signal types. The study focuses on the distinct frequency responses of the transformers to these signals and their implications for identifying and localizing faults within the transformer windings. Through simulation and experimentation, the paper explores how the position of the injected signal within the transformer winding affects the spectrum distribution of the resulting signal, with particular attention paid to the variations in high-frequency components. Ultimately, a method based on the frequency response characteristics of breakdown current signals is proposed for localization, utilizing the support vector machine (SVM) algorithm.
2 Establishment of winding model
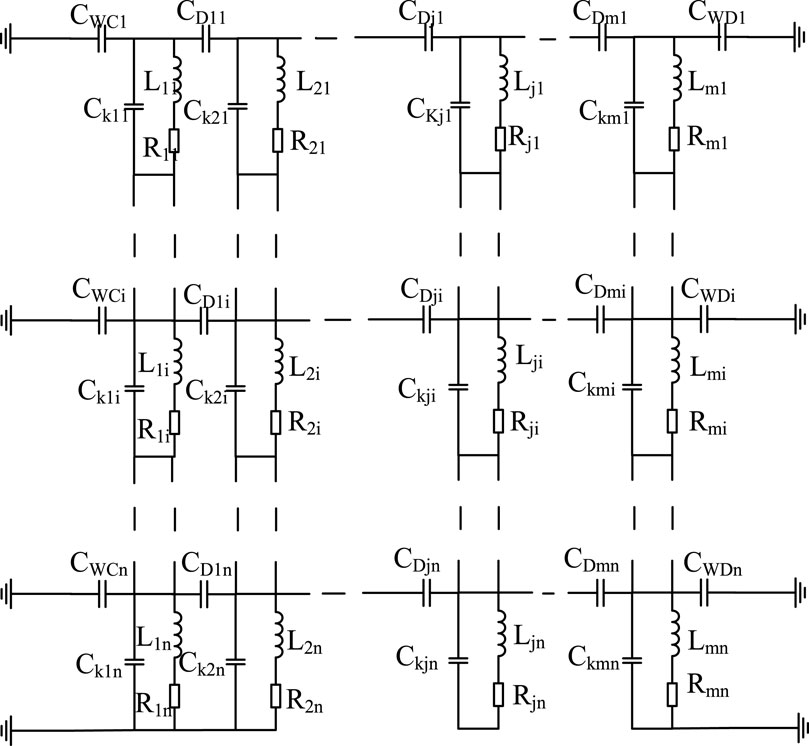
The winding model is established based on the layered structure of a 10kV/250kVA oil-immersed distribution transformer winding. Table 1 shows the relevant parameters of the transformer, which are measured based on the transformer. Modeling and simulation are conducted using the winding parameters of the oil-immersed distribution transformer. Due to the frequency range of breakdown current signals being several hundred kHz to several MHz, the capacitance and inductance parameters play a major role in the equivalent circuit. The winding inductance can be considered as an air-core inductance, with the addition of high-frequency resistance that takes into account the skin effect. When modeling, the capacitance distribution between layers is considered, and some lumped parameters are used to replace the distributed parameters. To enhance the accuracy of breakdown localization, each of the ten layers of windings is divided into three sections, resulting in a total of 30 sections. The broadband equivalent distributed parameter model of the transformer is established. The equivalent model of RLC is established based on the layer winding of 10 kV distribution transformer, as shown in Figure 1. Each layer of the winding is divided into n units, with a total of m layers.
2.1 Capacitance parameter calculation
The geometric capacitance of the winding can be divided into: axial geometric capacitance (interturn geometric capacitance), radial geometric capacitance (interlayer geometric capacitance, winding capacitance to the core, winding capacitance to the fuel tank).
The formula for calculating the interturn geometric capacitance and interlayer geometric capacitance is as follows.
In the formula:
The axial capacitance equivalent is (
The radial capacitance of winding consists of winding interlayer capacitance, winding to core capacitance and winding to shell capacitance. The geometric capacitance value is obtained by coaxial cylindrical capacitance formula.
The formula for solving the geometric capacitance
In the formula:
The calculated parameters of longitudinal capacitance, interlayer capacitance and ground capacitance of some windings are shown in the Table 2.
2.2 Inductance parameter calculation
The simplified calculation formula of winding mutual inductance
In the formula:
The self-inductance of winding i is calculated, namely:
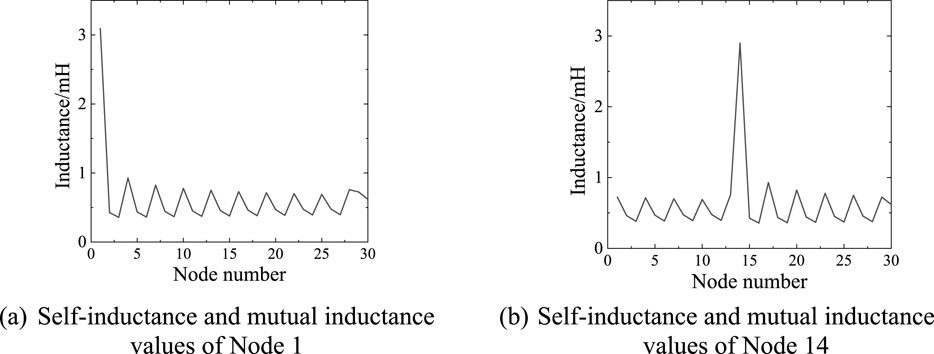
Figure 2. Calculated value of unit inductance. (A) Self-inductance and mutual inductance values of Node 1. (B) Self-inductance and mutual inductance values of Node 14.
2.3 Resistance parameter calculation
Ignoring the common-ground loop resistance, the skin effect at high frequency is considered in the calculation of the resistance matrix, and the calculation formula for the unit length of the conductor is as follows:
Where:
3 Frequency spectrum distribution under different analog signals
The standard lightning impulse voltage is applied to the first end of the model, and the wave head/wave tail time is 1.2/50 μs. The node voltage waveform under the impulse voltage and the measured terminal current waveform are shown in Figure 3.
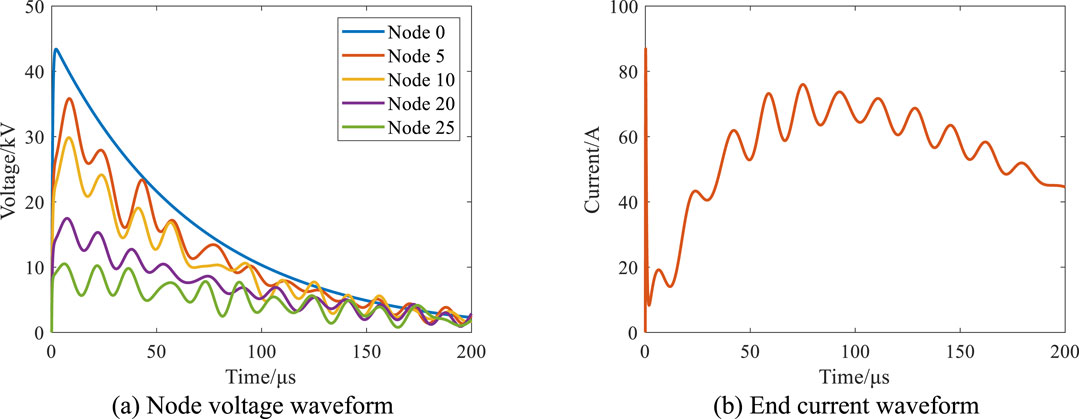
Figure 3. Voltage and current waveform under impulse voltage. (A) Node voltage waveform. (B) End current waveform.
When the impulse voltage starts to act, the initial distribution of potential is determined by the coupling between the winding longitudinal capacitance, ground capacitance and interlayer capacitance. Most of the voltage drop is near the head end of the winding, so the assessment of the longitudinal insulation of the transformer winding is relatively strict. After the shock voltage wavefront time, there are capacitors, inductors and resistors acting in the winding, and oscillation occurs based on the natural frequency of the winding resonance frequency. The voltage signal amplitude of each node in the winding is distributed according to the position, and the voltage value of some points will exceed the shock voltage value. The end current signal is an oscillating waveform after the peak of the tip.
When breakdown faults occur at different positions in transformer windings, the changes in electrical parameters within their equivalent networks exhibit variability. The frequency spectrum curves and the amplitude and phase information of the frequency response curves of the breakdown current also vary with the faults. This paper extracts numerous features based on changes in the amplitude-frequency characteristic curves, transforming the curve variations into numerical feature differences. This significantly enhances the efficiency of identifying winding breakdown faults and the accuracy of localization. Several widely used numerical features are selected for fault identification. The Pearson correlation coefficient serves as a pivotal statistical tool, enabling the precise quantification of the degree of similarity and dissimilarity between fault and normal state curves. Furthermore, the incorporation of Absoulte sum of logarithmic error enhances the sensitivity to subtle variations within fault states. In terms of characterizing waveform alterations, statistical metrics including standard deviation, kurtosis, and skewness are utilized to unveil the intricate patterns within the distribution of waveforms. These metrics not only elucidate the inherent characteristics of the waveform but also delve into the profound impacts of faults on its dispersion, sharpness, and symmetry. Additionally, the computation of critical parameters such as root mean square and crest factor offers a holistic assessment of the overall changes in current intensity and the pronounced augmentation of peak characteristics during fault conditions. The calculation formula is as follows:
(1) Pearson Correlation Coefficient (PCC)
(2) Absoulte Sum of Logarithmic Error (ALSE)
Where Xi and Yi are the amplitudes of the frequency point i’s frequency response curves for the normal and faulty winding conditions, respectively, and N is the total number of frequency points.
(3) Standard Deviation (SD)
(4) Kurtosis (Ku)
(5) Skewness (Sk)
(6) Root Mean Square (RMS)
(7) Crest Factor (CF)
3.1 Signal characteristics under Gaussian pulse injection
In order to simulate the characteristics of the actual breakdown current waveform, two methods are used to simulate the pulse current source as the input current Iin to simulate the breakdown discharge: Gaussian current pulse and simulated breakdown current pulse. The Gaussian pulse signal has good mathematical and statistical properties and can be used to simulate the discharge process. The formula for the change of Gaussian pulse input Iin-G current with time t is:
The parameters are all international system of Units. This pulse has a peak current of 12.5 mA and a duration of about 4 μs.
Gaussian pulse signals are injected into the first node of layers 2, 4, 6, and 8 of the model, and the current signal waveforms measured at the end. Figure 4 shows the time-domain and frequency-domain characteristics of the current signals measured at Node 30 after injecting Gaussian pulse signals into the first node of different layers (2, 4, 6, and 8) of the model.

Figure 4. Time domain and frequency domain characteristics of current signal obtained by node injection measurement at different layers. (A) Time domain. (B) Frequency domain.
As shown in Figure 4, the time and amplitude of the first peak in the time domain waveform of the resulting current signal correspond to the distance of the layer from the injection point and the characteristic impedance of the winding on that particular layer. The variations in delay and amplitude demonstrate the influence of winding structure on signal propagation. When the Gaussian pulse is input at the upper end of the winding, the amplitude of the spectrum fluctuation of the resulting signal is larger. As the input position of the Gaussian pulse moves toward the lower end, the low-frequency components increase.
In the low frequency band (1 kHz–10 kHz), the spectrum distribution at all locations has a low amplitude, which then rapidly increases as the frequency rises. The amplitude at the layer 2 position increases the fastest, indicating that the Gaussian pulse signal at this position has the greatest impact on the low frequency band. In the middle frequency band (around 100 kHz), the amplitude of the curves at all locations reaches its highest point and exhibits some fluctuation. The fluctuation at the layer 2 position is the most significant in the middle frequency band, while the current signal at other positions shows relatively stable fluctuations. In the high frequency band (100 kHz–10,000 kHz), the amplitude of the curves at all positions begins to decline and displays significant fluctuations. The current signals at layer 2 and layer 6 have the largest fluctuations in the high frequency band, while those at layer 4 and layer 8 have smaller fluctuations but also show a noticeable downward trend.
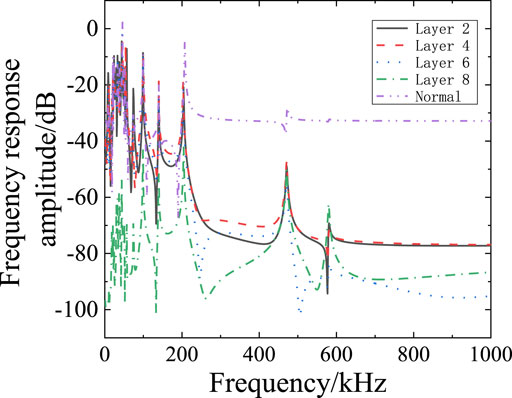
Furthermore, the signal characteristics of the transfer function are analyzed, and the correlation coefficient between it and the transfer function under normal working conditions, the absolute sum of the logarithm of error, and the waveform characteristics of the obtained amplitude-frequency curve are considered to analyze the relationship between it and the position. Figure 5 shows the frequency response curve of the transfer function obtained under the injection of Gaussian pulse signals at different positions, from which it can be seen that its amplitude and waveform have changed, and its numerical characteristics are calculated and extracted.
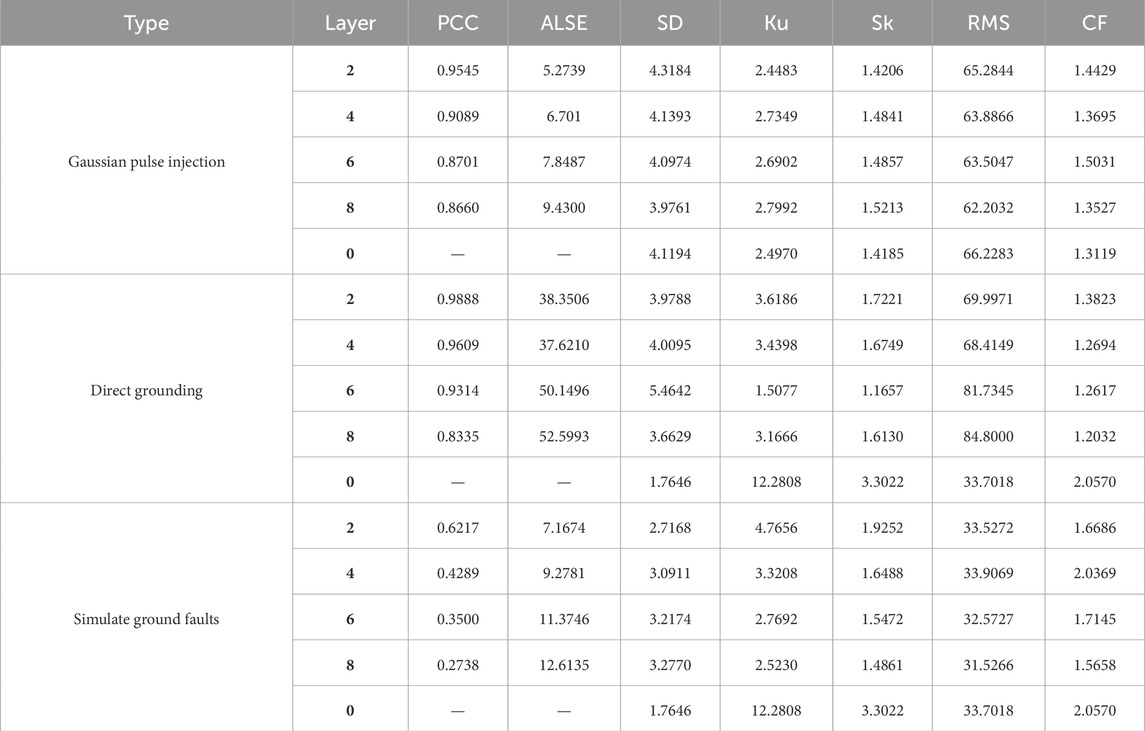
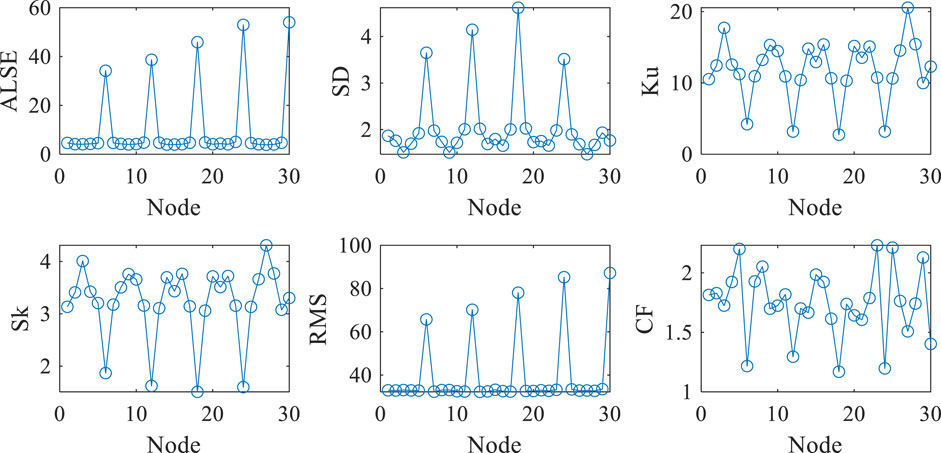
The amplitude-frequency curve waveform characteristics obtained under the injected Gaussian pulse are shown in Table 3. The correlation coefficient, standard deviation and root mean square decrease as the injection position moves to the end, and the absolute sum and skewness of the error logarithm increase as the injection position moves to the end.
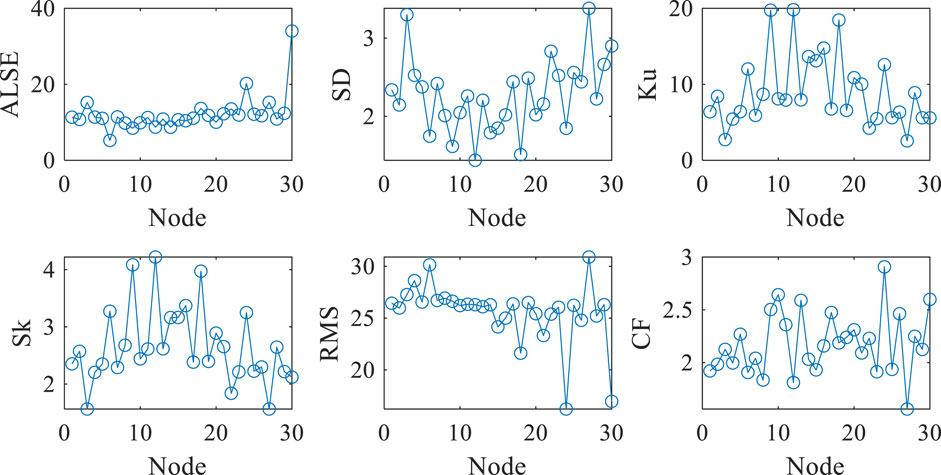
In addition, Gaussian pulse signals are injected into each node in the model, and its characteristic parameters are obtained as shown in Figure 6. It can be concluded that the numerical characteristics obtained by different nodes of the same layer winding will also be different, and the results near the end of the injected layer are more obvious.
3.2 Direct grounding of different nodes
In the model, the winding nodes are grounded successively, the impulse voltage is applied, the grounding current signal and the voltage signal of the head end are measured. Based on the analysis of grounding conditions at different positions of the winding, waveform characteristics of amplitude-frequency curves directly connected to the ground at different positions are obtained, as shown in Figure 7. It can be seen from the frequency response curves of different ground layers and no ground (0), that applying impulse voltage in the ground state has influence on both amplitude and resonance point.
The numerical characteristics of the frequency response curve were calculated and extracted, and the characteristic parameters were obtained as shown in Figure 8. It can be concluded that the variation law of characteristic values of the winding is the same as that of waveform characteristics obtained under Gaussian pulse injection. For 2nd, 4th, 6th, 8th layer windings, the correlation coefficient decreases from 0.9888 to 0.8335, and the absolute sum of the logarithm of errors increases from 38.3506 to 52.5993.
3.3 Simulate grounding faults at different positions
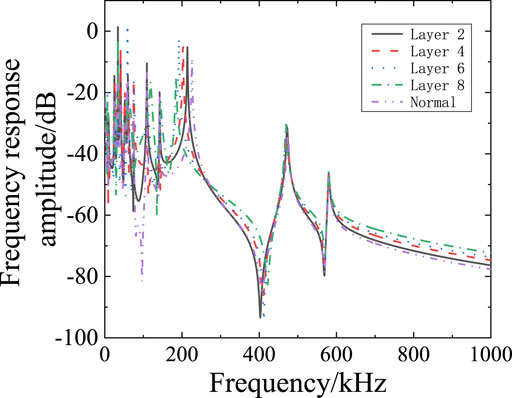
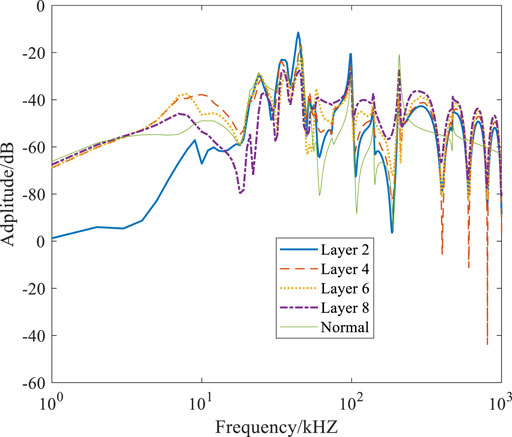
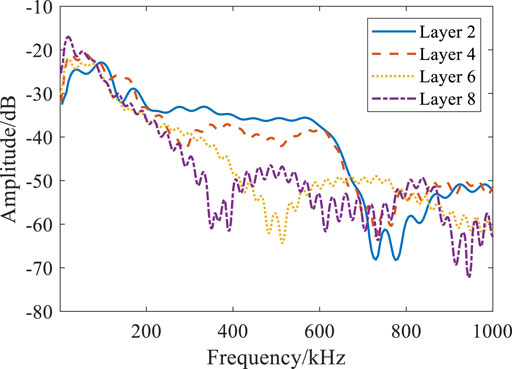
The impulse voltage is applied to the head end of the winding model and the grounding breakdown fault is simulated by the switch module. The current spectrum distribution obtained is shown in Figure 9. It can be found that the impact of the breakdown current signal at different positions on the spectrum distribution of the measured current signal at the end after the simulated breakdown fault. It can be compared that the fault has little influence on the low frequency band of the signal at different locations, and mainly affects the frequency distribution above 10 kHz.
With the breakdown position moving to the end, the fluctuation of the spectrum distribution in the frequency band near 400 kHz becomes larger, and the distribution change is obvious in the frequency band 10–100 kHz. By analyzing the influence of different fault locations on the frequency response of the system, the characteristics of each fault location and its specific influence on the system are revealed. The frequency response data of the system under normal state and four different fault locations layer 2, layer 4, layer 6 and layer 8 are collected in the experiment, and it is found that the faults at different locations show significant differences in each frequency segment.
In the low frequency band (10 kHz to about 100 kHz), the fault curve at position layer 2 shows a significant high amplitude, indicating that the fault location has a greater impact on the low frequency band. As the frequency increases, the layer 2 curve shows significant fluctuations and peaks and valleys in the mid-band (about 100 kHz–300 kHz), indicating that the fault at position layer 2 also has a significant impact in the mid-band. In contrast, the fault curve at position layer 4 has a slightly lower amplitude and less fluctuation in the low and mid-frequency bands.
In the high frequency band (300 kHz–1,000 kHz), the fault curve at position layer 8 shows significant fluctuations and multiple peaks, indicating that the fault at this position has a very large impact on the high frequency band. The fault curve of layer 6 position is slightly different in some frequency segments, but the overall trend is similar to that of layer 4 position, indicating that the fault of layer 6 position mainly affects some specific frequencies in the middle and high frequency band.
The low frequency band is mainly affected by the fault at layer 2 position, which shows high amplitude. The fluctuation of the middle frequency band is mainly caused by the fault at layer 2 position, and the fault at layer 4 and layer 6 position also has a certain impact. The high frequency band is most affected by fault at layer 8 position, followed by fault at layer 2 position, showing significant fluctuations and multiple peaks. Under normal condition, the frequency response curve is the most stable and the fluctuation is the least.
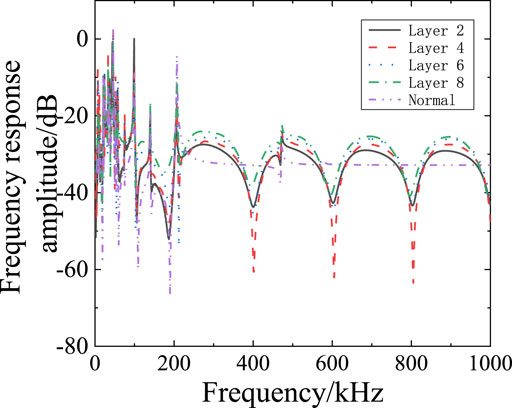
The transfer function of 0–1 MHz obtained under ground faults at different positions under impulse voltage is shown in Figure 10. Under normal condition, the peak value of the transfer function is in the range of 0–200 kHz. After breakdown fault occurs, the fluctuation becomes obvious within the range of 200 k–1 MHz, and multiple resonance points appear, which change with the fault position to the end position. The fluctuation is more severe when the fault occurs in the middle part of the winding.
Based on the results obtained from the three analog signals set, it can be concluded that the fault closer to the first end has a more obvious impact on the winding, and the impact of different fault locations on the frequency response of the system is significantly different in different frequency segments. The fault at layer 2 has the greatest impact on low frequency and middle frequency band, while the fault at layer 6 has a significant impact on high frequency band. The frequency response analysis can effectively identify and locate the fault location and provide an important basis.
3.4 Spectral positioning method based on eigenvalues
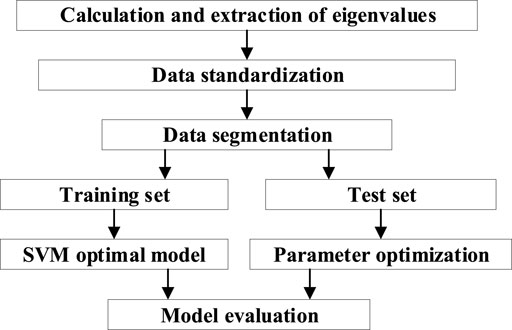
Support vector machine (SVM) is a supervised machine learning algorithm based on structural risk minimization principle, which can obtain good learning ability and classification accuracy according to limited sample information, and has the best generalization ability while realizing the global optimal solution. Because SVM can obtain the structured concept of data distribution, it performs better on small sample training sets and is suitable for the data set in this paper. Based on the simulation results, a method for distribution transformer spectrum positioning is proposed. The diagnostic flow of support vector machine is shown in the Figure 11.
The specific process is as follows: First, the signal frequency response characteristic value obtained by simulation is used as the basis of data. The data is then normalized to ensure that the magnitude of different eigenvalues does not affect the results of model training. Then, the simulation data is used as the training set and the experimental data is used as the test set for the training and evaluation of the model. Select an appropriate model support vector machine (SVM), and train on the training set to learn the patterns and features of the data. Use test sets to evaluate the performance of the model and understand how the model performs on classified experimental measurement data through metrics such as accuracy and confusion matrix. Finally, the evaluation results are analyzed to explain how the model effectively identifies and classifies different types of experimental measurement data.
The objective of SVM is to find a maximum margin hyperplane to maximize the robustness of the classification boundary. This can be achieved by solving the following convex optimization problem:
Given the training set
Minimize the constrained objective function:
where
The constraint conditions are:
The identification accuracy of simulation data by support vector machine is shown in Table 4.
4 Experimental verification
When the transformer winding is pulsed, the Gaussian pulse generated by the signal generator and the fault pulse signal when different winding taps break down to the ground under the impact test are mainly used to obtain the voltage and current signal at the head and end of the winding under different pulse signals. The circuit diagram is shown in Figure 12.
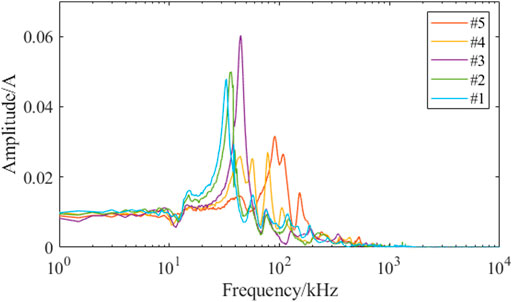
As the injection position of the current signal gradually approaches the end of the winding, the frequency corresponding to the maximum value of the signal spectrum distribution gradually increases. The reason is that when the winding is regarded as a two-port network, the equivalent capacitance of the winding increases while the inductance decreases. For the same signal, a higher frequency signal will be generated. Therefore, different characteristics of spectrum distribution appear in the detection position. The same is true of the signal spectrum distribution under the actual breakdown fault, the closer the breakdown position is to the end, the more high-frequency components in the signal.
As can be seen from Figure 13, there are obvious rules in the spectrum characteristics of signals injected with Gaussian pulses from different nodes. In the low frequency band (1 kHz–10 kHz), the spectrum distribution obtained from different injection locations is close, and the amplitude is less than 0.01 A. The spectrum features of all nodes cover the frequency range from 1 kHz to 1 MHZ. Near 70 kHz, the resonance peak of node layer 3 is the most significant, with A amplitude of about 0.065 A, while the main resonance peak of other nodes is concentrated between 50 kHz and 200 kHz, with A amplitude of about 0.04 A–0.06 A. As the position of the node moves towards the end, the frequency corresponding to the resonance peak increases gradually. In addition, each node also has some secondary resonance peaks in the 1 kHz∼10 kHz and 200 kHz∼1 MHz regions, but the amplitude is small, usually below 0.01A. In general, the spectrum distribution of all nodes is similar, but there are differences in the specific position and amplitude of the main resonance peak. When the frequency is higher than 1,000 kHz, the amplitude of all nodes is significantly reduced to close to zero.
The impulse voltage withstand test after setting defects was carried out on a 10 kV distribution transformer layer winding. In the test, Marx loop generator was used to generate the impulse voltage, and the maximum amplitude of the impulse voltage could reach 100 kV. The voltage signal at the first end is measured by the voltage divider and the current signal at the end is measured by the damage resistance. A 1 mm thick tungsten steel needle electrode is inserted into the layer winding, so that there is an electrical connection between the electrode and the winding, and the tip is simulated to discharge to the ground, and the distance between the tip and the ground electrode is adjusted to 2 mm, so that the discharge starting voltage of each node is the same. The needle electrode discharge occurs when the impulse voltage is applied, and the fault location can be located by analyzing the voltage waveform at the first end and the current waveform measured at the end. The signal spectrum characteristics under ground breakdown of different nodes in the impact test are shown in Figure 14. The analysis of the results shows that the measured signal spectrum distribution results are consistent with the simulation results under the impact voltage.
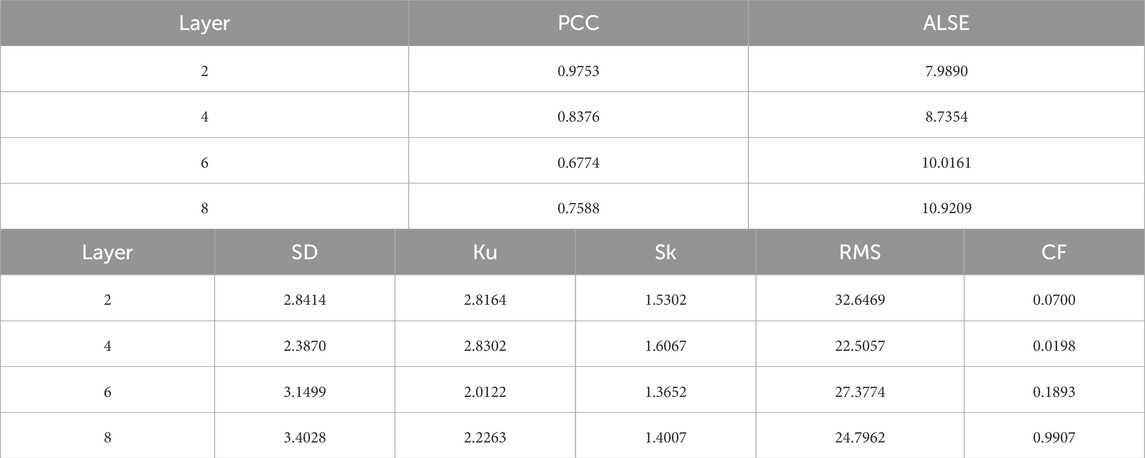
Among them, the curve feature of node layer 2 is particularly significant. In the low frequency band (100 kHz to 1 MHz), the amplitude of the curve is relatively low and stable. With the increase of frequency, the amplitude begins to rise gradually and reaches a peak at a certain frequency point. After that, the amplitude begins to decline, and the decline is the fastest. The numerical characteristic values extracted from the calculation are shown in Table 5.
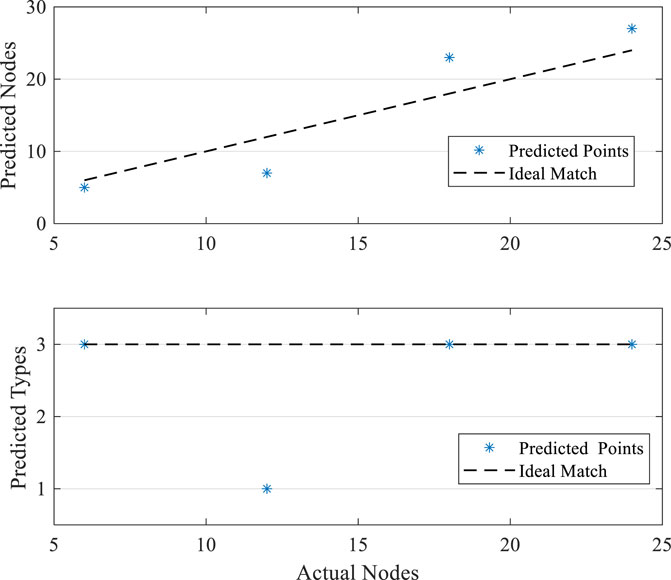
The characteristic values measured by the experiment are substituted into the support vector machine for solving, and the result of predicting the fault node was obtained, as shown in Figure 15. The actual fault location of the winding could be basically located within the error range of 20%. In addition, the prediction result of the end of the winding is better than that of the middle, and the fault type of the winding can also be predicted.
5 Conclusion
In this paper, aiming at the different frequency responses of oil-immersed distribution transformers under different signal types, the feasibility of the location algorithm based on breakdown current signal frequency diagram is studied by simulation and experiment. The main conclusions of this paper are as follows:
1) The position of the injected signal in the transformer winding has different effects on the spectrum distribution of the obtained signal. The closer the signal is injected to the end, the higher the high-frequency component of the spectrum distribution
2) In the Gaussian pulse injection experiment, the signal spectrum distribution caused by different injection positions is significantly different. Especially in the low frequency zone, the fault effect near the end is more significant, showing a high amplitude and rapid rise trend. In the fault current signal injection experiment, when the breakdown position is near the end, the high frequency component of the signal increases, so that the frequency corresponding to the maximum of the spectrum distribution increases.
3) Based on the frequency response characteristics of the signal, support vector machine (SVM) algorithm is used to classify the fault type and location. Under the impulse voltage withstand test, the location of breakdown fault can be located within 20% error.
Data availability statement
The original contributions presented in the study are included in the article/supplementary material, further inquiries can be directed to the corresponding author.
Author contributions
XL: Conceptualization, Methodology, Writing–original draft. HW: Writing–original draft. ZG: Writing–original draft. XH: Writing–review and editing.
Funding
The author(s) declare that financial support was received for the research, authorship, and/or publication of this article. This work is supported by the Science and Technology Program of China State Grid Shanxi Electric Power Company: Research on Fault Location Method for Impulse Voltage Testing of Distribution Transformers (52053023000R).
Conflict of interest
Authors XL and HW were employed by State Grid Shanxi Electric Power Company.
The remaining authors declare that the research was conducted in the absence of any commercial or financial relationships that could be construed as a potential conflict of interest.
The authors declare that this study received funding from China State Grid Shanxi Electric Power Company. The funder had the following involvement in the study: the study design, collection, analysis, interpretation of data, the writing of this article, and the decision to submit it for publication.
Publisher’s note
All claims expressed in this article are solely those of the authors and do not necessarily represent those of their affiliated organizations, or those of the publisher, the editors and the reviewers. Any product that may be evaluated in this article, or claim that may be made by its manufacturer, is not guaranteed or endorsed by the publisher.
Supplementary material
The Supplementary Material for this article can be found online at: https://www.frontiersin.org/articles/10.3389/fenrg.2024.1477556/full#supplementary-material
References
Akbari, A., Werle, P., Borsi, H., and Gockenbach, E. (2002). Transfer function-based partial discharge localization in power transformers: a feasibility study. IEEE Electr. Insul. Mag. 18 (5), 22–32. doi:10.1109/MEI.2002.1044318
Al-Masri, W. M. F., Abdel-Hafez, M. F., and El-Hag, A. H. (2016). A novel bias detection technique for partial discharge localization in oil insulation system. IEEE Trans. Instrum. Meas. 65 (2), 448–457. doi:10.1109/TIM.2015.2482259
Cavallini, A., Montanari, G., and Tozzi, M. (2010). PD apparent charge estimation and calibration: a critical review. IEEE Trans. Dielectr. Electr. Insulation 17 (1), 198–205. doi:10.1109/TDEI.2010.5412018
Desai, B. M. A., and Sarathi, R. (2018). Identification and localisation of incipient discharges in transformer insulation adopting UHF technique. IEEE Trans. Dielectr. Electr. Insulation 25 (5), 1924–1931. doi:10.1109/TDEI.2018.007294
Eldery, M. A., Abdel-Galil, T. K., El-Saadany, E. F., and Salama, M. (2006). Identification of partial discharge locations in transformer winding using PSD estimation. IEEE Trans. Power Deliv. 21 (2), 1022–1023. doi:10.1109/TPWRD.2005.864067
Guillen, D., Idarraga-Ospina, G., and Mombello, E. (2014). Partial discharge location in power transformer windings using the wavelet Laplace function. Electr. Power Syst. Res. 111, 71–77. doi:10.1016/j.epsr.2014.02.007
Hettiwatte, S. N., Wang, Z. D., Crossley, P. A., Darwin, A., and Edwards, G. (2002). Experimental investigation into the propagation of partial discharge pulses in transformers. 2002 IEEE Power Eng. Soc. Winter Meet. 2, 1372–1377. doi:10.1109/PESW.2002.985240
Jafari, A. M., Akbari, A., Mirzaei, H. R., Kharezi, M., and Allahbakhshi, M. (2008). Investigating practical experiments of partial discharge localization in transformers using winding modeling. IEEE Trans. Dielectr. Electr. Insulation 15 (4), 1174–1182. doi:10.1109/TDEI.2008.4591240
Jahangir, H., Akbari, A., Azirani, M. A., Werle, P., and Szczechowski, J. (2020). Turret-electrode antenna for UHF PD measurement in power transformers - Part I: introduction and design. IEEE Trans. Dielectr. Electr. Insulation 27 (6), 2113–2121. doi:10.1109/TDEI.2020.008874
Jeyabalan, V., and Usa, S. (2011). Statistical techniques for partial-discharge location in transformer windings. IEEE Trans. Power Deliv. 26 (3), 2064–2065. doi:10.1109/TPWRD.2011.2112490
Jyabalan, V., and Usa, S. (2009). Frequency domain correlation technique for PD location in transformer winding. IEEE Trans. Dielectr. Electr. Insulation 16 (4), 1160–1167. doi:10.1109/TDEI.2009.5211871
Liu, K., Guo, L., Chen, B., Bao, Y., Ma, J., and Feng, T. (2020). “Analysis of ultrasonic propagation characteristics of partial discharge in oil immersed power transformer,” in 2020 7th international forum on electrical engineering and automation (IFEEA) (Hefei, China: IEEE), 66–70. doi:10.1109/IFEEA51475.2020.00022
Martin, D., Marks, J., Saha, T. K., Krause, O., and Mahmoudi, N. (2018). Investigation into modeling Australian power transformer failure and retirement statistics. IEEE Trans. Power Deliv. 33 (4), 2011–2019. doi:10.1109/TPWRD.2018.2814588
Mirzaei, H. R., Akbari, A., Zanjani, M., Miralikhani, K., Gockenbach, E., and Borsi, H. (2012). “Investigating suitable positions in power transformers for installing UHF antennas for partial discharge localization,” in 2012 IEEE International Conference on Condition Monitoring and Diagnosis, Bali, Indonesia, 625–628. doi:10.1109/CMD.2012.6416223
Mohseni, B., Hashemnia, N., Islam, S., and Zhao, Z. (2016). “Application of online impulse technique to diagnose inter-turn short circuit in transformer windings,” in 2016 australasian universities power engineering conference (AUPEC) (Brisbane, QLD, Australia: IEEE), 1–4. doi:10.1109/AUPEC.2016.7749309
Naderi, M. S., Blackburn, T. R., and Phung, B. T. (2008). Application of wavelet analysis to the determination of partial discharge location in multiple-α transformer windings. Electric Power Systems Research 78 (2), 202–208. doi:10.1016/j.epsr.2007.02.004
Okabe, S., Ueta, G., and Wada, H. (2011). Partial discharge signal propagation characteristics inside the winding of gas-filled power transformer study using the equivalent circuit of the winding model. IEEE Trans. Dielectr. Electr. Insulation 18 (5), 1668–1677. doi:10.1109/TDEI.2011.6118640
Okabe, S., Ueta, G., and Wada, H. (2012). Partial discharge signal propagation characteristics inside the winding of oil-immersed power transformer using the equivalent circuit of winding model in the oil. IEEE Trans. Dielectr. Electr. Insulation 19 (2), 472–480. doi:10.1109/TDEI.2012.6180240
Wang, Z. D., Hettiwatte, S. N., and Crossley, P. A. (2005). A measurements-based discharge location algorithm for plain disc winding power transformers. IEEE Trans. Dielectr. Electr. Insulation 12 (3), 416–422. doi:10.1109/TDEI.2005.1453445
Xiao, X., Yong, L., Xiao, T., Peng, C., and Yan, L. (2014). Relocatable ultrasonic array and UHF combined sensor applied to PD location in oil. IEEE Sensors J. 14 (2), 357–361. doi:10.1109/JSEN.2013.2283156
Xie, Q., Cheng, S., Lü, F. F., and Li, Y. (2013). Location of partial discharge in transformer oil using circular array of ultrasonic sensors. IEEE Trans. Dielectr. Electr. Insulation 20 (5), 1683–1690. doi:10.1109/TDEI.2013.6633698
Keywords: oil-immersed distribution transformers, breakdown current signal, frequency response, support vector machine (SVM), location
Citation: Liu X, Wang H, Gao Z and Han X (2024) Research on fault localization of distribution transformers based on frequency response analysis and support vector machine (SVM). Front. Energy Res. 12:1477556. doi: 10.3389/fenrg.2024.1477556
Received: 08 August 2024; Accepted: 31 October 2024;
Published: 20 November 2024.
Edited by:
Wei Qiu, Hunan University, ChinaReviewed by:
Ren Fuqiang, Shandong University, ChinaHe Weisheng, Chongqing University of Posts and Telecommunications, China
Lipeng Zhong, Hunan University, China
Muthamil Sudar K., Mepco Schlenk Engineering College, India
Copyright © 2024 Liu, Wang, Gao and Han. This is an open-access article distributed under the terms of the Creative Commons Attribution License (CC BY). The use, distribution or reproduction in other forums is permitted, provided the original author(s) and the copyright owner(s) are credited and that the original publication in this journal is cited, in accordance with accepted academic practice. No use, distribution or reproduction is permitted which does not comply with these terms.
*Correspondence: Xutao Han, eGp0dWhhbnh1dGFvQHFxLmNvbQ==
 Xingting Liu1
 Zhuo Gao
