- Department of Electrical Engineering, University of National Cheng-Kung (NCKU), Tainan, Taiwan
Extreme weather causes an increase in power system failure. Previous studies on system resilience have often overlooked the user-side of a microgrid. This study proposes composite resilience indices (RI) based on the power supply of a large-scale manufacturing campus microgrid to quantify its ability to withstand extreme events. The proposed RI consider load priority, minimum supply load, total energy supplied, and the performance recovery-to-degradation slope ratio in an islanding microgrid. Accordingly, this study presents a three-stage resilience optimal dispatch and reconfiguration strategy, including energy-level scheduling, grid-level reconfiguration, and dynamic-level verification. A multi-objective optimization approach is used for energy scheduling, followed by system reconfiguration via DIgSILENT system modeling to meet the grid code and maximize load supply. Value at Risk methods are used to verify microgrid stability and load shedding requirements, supported by the virtual synchronous generator control of the energy storage system. The test results from a practical large-scale manufacturing campus microgrid validate the proposed approaches for enhancing system resilience considering load values.
1 Introduction
Recently, extreme weather disasters have occurred frequently, leading to an increasing number of considerable impacts on power systems. These events unfold rapidly and cause extensive damage, resulting in high repair costs and economic loss. In the United States, weather-related power outages cost between $250 to $750 billion annually (Vugrin et al., 2017). Infrastructure damage is not limited to singular occurrences and may result in complex events affecting communication, water, transportation, natural gas, and other systems (Stankovic et al., 2023).
Globally, governments invest in carbon reduction technology to combat the greenhouse effect and promote the integration of renewable energy (RE) into the grid. However, RE lacks inertia and stops operating during power outages, limiting its effective utilization despite its capacity to supply electricity.
Technological progress and societal advancements have increased the demand for reliable electricity supplies, prompting a focus on grid resilience (Bie et al., 2017). Microgrid technology improves resilience by integrating and managing distributed energy resources (DERs) to minimize costs and facilitate seamless transitions between grid-connected and islanded modes as required (Hamidieh and Ghassemi, 2022).
Microgrid technology ensures an uninterrupted power supply during outages by enabling grid-following DERs to continue generating power, optimizing energy efficiency, and enhancing resilience. This makes microgrid deployment attractive to users affected by power interruptions.
Traditional reliability indices consider the performance of a power system in withstanding unexpected failures or outages of a single or multiple facilities (N-1 or N-2) within a specified period. For example, probabilistic indices such as loss of load probability and expected power not supplied (da Costa et al., 2021). These accidents have a high probability of occurrence, but a relatively low impact, affecting only a few users for seconds to hours.
However, high-impact, low-probability (HILP) events resulting from disasters can cause multiple system component failures. During such events, system operators are primarily concerned with maintaining functionality throughout the event to reduce potential losses (Braun et al., 2020). The literature Kaloti and Chowdhury (2023) extensively describes reliability and resilience, and explains the clear distinction between the two.
Resilience quantification involves assessing the entire process from a HILP event occurrence to restoration, considering the time-response relationships at each stage. HILP event severity profoundly affects resilience assessments, with event selection being crucial and often contingent on maintenance manager budgets and risk tolerance.
Reference Huang et al. (2022) resents a method for developing multiple scenarios of HILP events, accounting for equipment failure probabilities. Modern power grids, categorized as cyber-physical power systems, require the consideration of failures in information and communication facilities (Ti et al., 2022). Assessing HILP event severity (Zhou et al., 2020) recommends employing the conditional value at risk (VaR) method, allowing managers to set confidence levels for decision making.
Resilience indices (RI) are often quantified using resilience trapezoids (Li et al., 2017; Mahzarnia et al., 2020; Panteli et al., 2017; Yao et al., 2023) or customized formulas (Chanda et al., 2018). However, customized formulas may rely on the dispatcher experience and lack universal applicability. Additionally, resilience assessment based on predicted weather intensity (Ti et al., 2022; Wang et al., 2021a), such as typhoon wind speed, is common. However, regions that face multiple natural disasters may simultaneously challenge the applicability of specific resilience assessment mechanisms. Further discussion of their universal applicability is required.
Regarding resilience improvement methods, several studies have focused on determining the repair sequences of damaged components. According to Liu et al. (2023) maintenance resources are limited, and the repair sequence affects system resilience. Therefore, it proposed a method based on stochastic search to determine the arrangement of repair sequences. To reduce the computation time and ensure solution quality, (Li et al., 2022), adopts a reinforcement learning method for decision making in the repair stage.
Reference Jiang et al. (2022) first calculated the impact of each component on resilience based on the probability of equipment failure and its impact on the system. The repair sequence was determined according to the impact indicator. When a system includes multiple microgrids, prioritizing the restoration with shorter islanding durations can enhance grid resilience (Liu et al., 2017).
Microgrid applications support grid resilience. Reference Hong et al. (2022) introduces a dynamic shedding strategy that leverages real-time system inertia, validated through dynamic simulations, but is limited by measurement, communication, and computation speeds. With advancements in energy storage system (ESS) technology, Wang et al., (2021) proposed a multi-objective optimization method to determine ESS capacity and location, alongside a three-stage scheduling method to enhance resilience.
In (Mohan et al., 2022), a fuzzy control method was proposed to control ESS for preventing microgrid blackouts. The method can effectively delay the depletion of energy, but it lacks integration with other technologies. The method of mutual support between microgrids Bian et al. (2018) has also been proposed to enhance resilience. However, the method is limited to closely connected situations and are not feasible during interruptions in the utility grid. Reference Confrey et al. (2020) focused on scheduling methods for microgrids with high photovoltaic (PV) penetration, while overlooking system constraints.
In practical applications, the scheduling of power resources should be integrated with system reconfiguration (SR) to ensure that solutions can satisfy system constraints. Literature Huang et al. (2017) proposes an optimization method to obtain generator scheduling and system topology that minimize load shedding and costs. Additionally, a two-stage optimization method to achieve minimal load shedding through reconfiguration has also been proposed Shen et al. (2021). Although reducing load shedding can mitigate system performance degradation, it does not consider other aspects such as degradation or recovery speed.
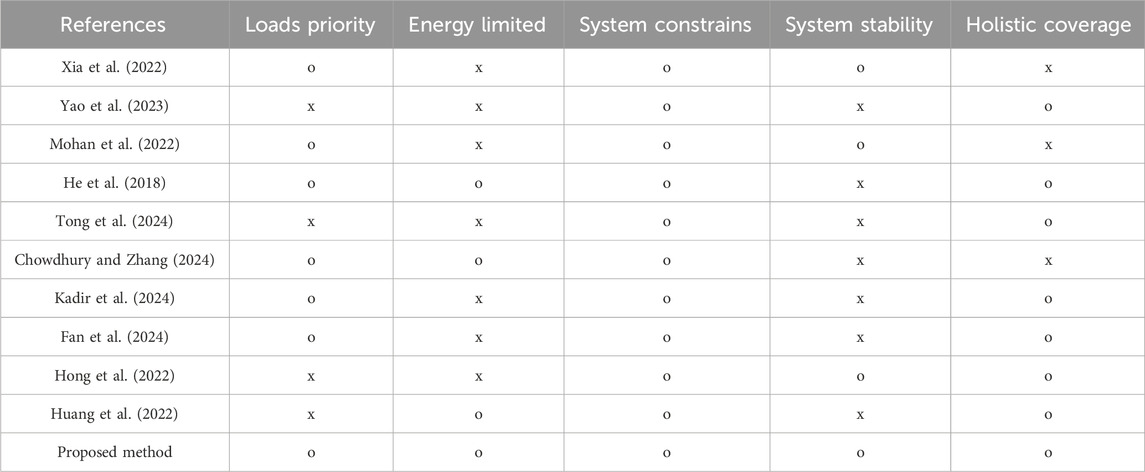
Furthermore, both Yang et al. (2023); Xia et al. (2022) use system reconfiguration as a method for power restoration. Yang et al. (2023) proposes an optimal investment strategy for soft open points, which can be combined with distribution system reconfiguration to reduce costs and enhance resilience. Xia et al. (2022) employs fuzzy control to execute the optimal power restoration strategy, considering load importance and generation ramp rate. However, both methods focus solely on the reconfiguration during the power restoration phase, and only (Xia et al., 2022) considers system stability.
In terms of improving decision-making speed, Chowdhury and Zhang (2024), uses the two-stage stochastic optimal power flow method to improve system resilience. Reinforcement learning (RL) techniques have also been used to enhance system resilience (Kadir et al., 2024; Fan et al., 2024). While RL’s fast computation can facilitate real-time decision-making, training decisions through a reward mechanism does not guarantee that the decisions will always meet system constraints.
To improve user-side system resilience, He et al., (2018), proposes a three-stage optimization method that simultaneously considers electricity and gas demand. The proposed strategy not only accounts for load priority and energy limited but also handles HILP events from onset to completion (holistic coverage). However, the lack of discussion on system constraints and stability may affect its practical feasibility. In contrast, Tong et al. (2024) provides a comprehensive analysis of users’ gas and electricity demand but lacks consideration of system and equipment-level constraints.
Most existing methods for distribution system reconfiguration to enhance resilience only consider capacity constraints without addressing the issue of limited energy because the upstream side is generally assumed to have sufficient energy. However, this is not applicable to user systems when the main grid interrupts.
Based on the discussion above, this paper proposes a three-stage resilience enhancement optimal scheduling strategy, which involves energy, grid, and dynamic levels. From the three perspectives, the strategy ensures that scheduling meets system constraints and manages net load fluctuations, thereby maintaining system stability. In addition, the proposed method can also cope with HILP accidents from start to finish. A comparison of resilience enhancement strategies is detailed in Table 1. The main contributions of this study are as follows:
• Modification of composite resilience indices: This paper refines the existing composite RI to make the index more suitable for large power consumers rather than transmission/distribution systems. The load curve used to calculate resilience is passed through a weighted process to incorporate load prioritization considerations. In addition, the index that considers degradation and recovery ratios (Yao et al., 2023) was modified to account for both time and amplitude, rather than just time. All indices are presented as percentages or ratios, enhancing comparability between different sites. Furthermore, the index representation method has been standardized to ensure that “the bigger, the better” applies to all composite indices, facilitating easier comparisons.
• Three-stage resilience enhancement optimal scheduling strategy: This paper proposes a three-stage resilience enhancement optimal scheduling strategy. Given that the values in the composite RI are not consistent with each other, resilience optimization is treated as a multi-objective optimization problem. Most existing distribution system restoration methods consider only capacity constraints, neglecting the issue of limited energy since upstream side is assumed to have sufficient energy. To properly manage energy supply and avoid a complete blackout, the first stage of proposed algorithm uses multi-objective genetic algorithm (MOGA) to search for an optimal power scheduling that maximizes the composite RI. In the second stage, SR strategy is designed to incorporate system constraints based on the optimal power scheduling.
• Dynamic simulation in outage process: In the third stage of proposed method, dynamic simulation is considered. Existing scheduling methods seldom addresses stability throughout the entire outage process. By analyzing the probability distribution of the rate of change in historical load and PV generation data, the proposed method employs value at risk (VaR) and predefined confidence levels to assess the necessary variation conditions. Using the dynamic simulation function of DIgSILENT PowerFactory software, the system tolerability of the power scheduling obtained in the first two stages is tested. If oscillations cause frequency to drop below the lower limit, load shedding is performed until the constraints are met, enhancing practical applicability.
• Integration of virtual synchronous generator (VSG) control and dynamic Modeling: This study integrates the VSG control of ESS and constructs a dynamic model. In the third stage, dynamic simulations demonstrate that VSG can effectively support frequency, thereby reducing the need for load shedding and further enhancing resilience.
The remainder of this study is organized as follows: Section 2 introduces RI for power systems. The detailed three-stage resilient optimal dispatch and reconfiguration strategies are presented in Section 3. The computational results are presented in Section 4. Finally, Section 5 concludes the study.
2 Resilience indices
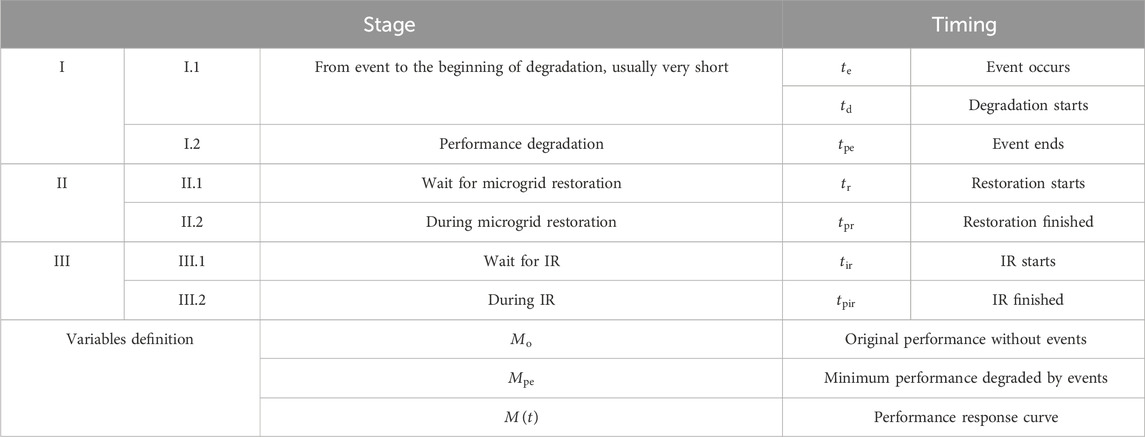
Resilience assessment methods for power systems often focus on calculating the duration from event occurrence to full recovery, referred to as event duration (ED). Early studies, such as the resilience triangle (Vugrin et al., 2017), emphasized post-incident recovery capability. Recent discussions have expanded this concept to a trapezoid Li et al. (2017), as shown in Figure 1, considering factors such as degradation speed and extent, and investigating the impact of ED. The event process was divided into three stages: Stage I, degradation; Stage II, recovery; and Stage III, infrastructure recovery (IR). An explanation of each stage and its corresponding time points is provided in Table 2; Figure 1.
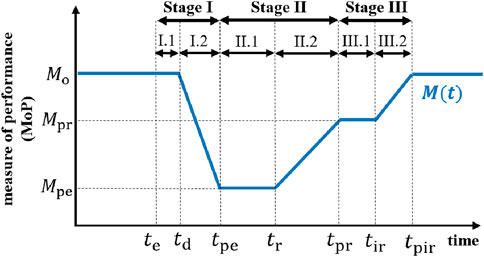
Figure 1. Schematic diagram of resilience trapezoid evolution (Li et al., 2017).
When system encounters a HILP event, a performance measure (MoP) is often used to assess its resilience. The MoP can represent various state variables of the grid such as voltage, frequency, and supplied load. For large-power users, primary consideration of the load supply is to support production. Therefore, it is more appropriate to use the supplied load or critical demand as MoP to measure resilience. Based on different considerations, existing RI can be categorized into two types: those based on resilience trapezoid and those that consider the cost. These are described as follows.
In the calculation of the indicators mentioned in Section 2.1, the definitions of the related variables are shown in Table 2; Figure 1.
2.1 Resilience indicators based on the resilience trapezoid
The vulnerability index (VI), calculated as (Equation 1), is suitable for assessing the extent of MoP decline during extreme events (Li et al., 2017), which can be improved by applying microgrid technology. Ideally, VI should be zero and reach 1 when the system is completely out of power.
A drawback of VI is lack of representation of the temporal behavior. To address this, the normalized degradation index can be adopted to assess system resilience (Li et al., 2017), as shown in (Equation 2). The physical significance of degradation index (DI) is the ratio of electrical energy lost during the degradation period to the original electrical energy supplied over the same time interval without any events. Therefore, a smaller value of DI is preferable. The time interval considered ranges from the degradation start time,
Literature Mahzarnia et al. (2020) introduces a composite index based on the resilience trapezoidal concept by incorporating three performance metrics, including power-supply shortage, recovery speed, and recovery degree. Simultaneously, the probability of occurrence of different HILP scenarios was also considered. Reference Panteli et al. (2017) proposed a composite index,
Most indicators focus on the trapezoidal area. Although the area of power trapezoidal can represent a partial symbol of resilience, an assessment of response capability is lacking. Literature Yao et al. (2023) highlights the significance of shape, noting that varying rates of degradation and recovery can affect resilience. Therefore, the resistance to recovery ratio (
2.2 Resilience indicators with cost considerations
A previous study Panteli et al. (2017) proposed a RI, recovery resilience (RR), that considered costs, as shown in (Equation 9). Lost revenue impact (LRI) represents the energy shortage indicator and total restoration (TR) represents cost investment, which is aggregated using a weight factor (
The unit of
Determining the weighting values between LRI and TR is challenging. Additionally, consumers should prioritize the recovery of power supply over the cost of additional investments required to enhance resilience. For example, in steel enterprises, an unexpected power outage can cause blast furnace slag solidification, leading to significant economic losses. The resilience indices,
This study focuses on optimizing resilience in user-side microgrid systems, necessitating the modification of existing indices to a more suitable form. Industrial loads have varying levels of importance and priority. Therefore, the original load curve
Based on the analysis above, it can be observed that composite indicators provide a more comprehensive representation of system resilience. Therefore, this paper proposes RI tailored for user-side applications, as shown in (Equation 14–16). Where
Equations 14, 15 respectively represent robustness and restorability of the system, which are more classical and frequently used indicators in the existing literature. However, current indicators seldom inspect the shape of resilience trapezoid, specifically the degradation and recovery slopes. In practical applications, even if the supplied energy or minimum load values are the same, users prefer slower power supply degradation and faster recovery. Although (Yao et al., 2023) mentions the shape of resilience trapezoid, the indicators are ratios of time lengths and do not consider the magnitude. Therefore, this paper proposes a modified index, as shown in (Equation 16), representing the ratio of recovery to degradation slop. To ensure all three indices are interpreted as “the larger, the better,”
3 Three-stage resilience optimal dispatch and reconfiguration strategy
The methodology proposed in this study (Figure 2) consists of three stages: energy, grid, and dynamic levels. Defining the detailed characteristics of HILP event beforehand is crucial, including the event type, ED, and DERs status. Factors such as equipment availability, ESS State of Charge (SOC), and fuel storage conditions influence the blackout occurrence. Consideration of RE and load forecasting during events is essential for comprehensive supply scheduling and planning.
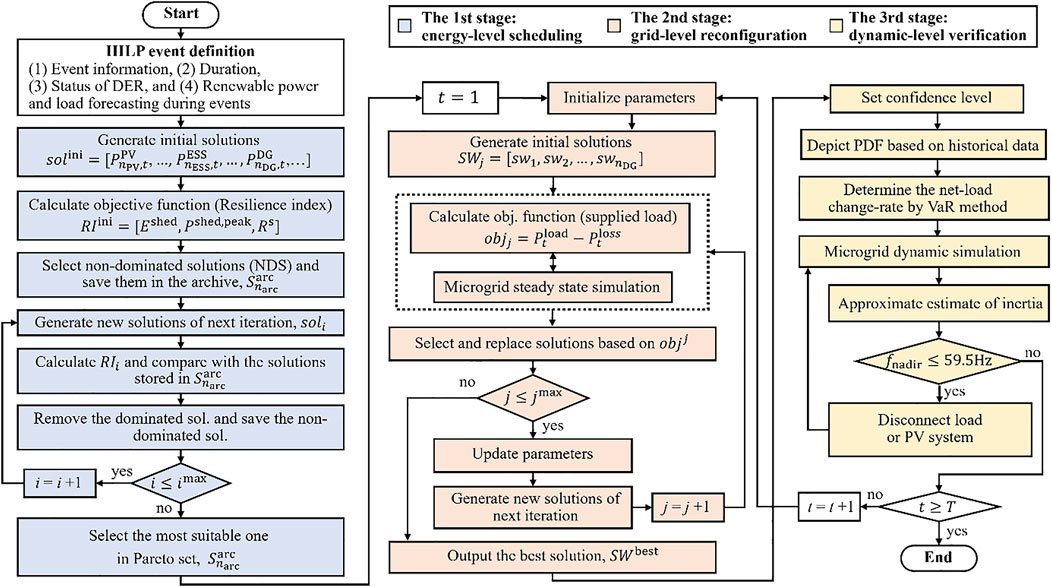
Figure 2. Flowchart of the proposed three-stage resilience optimal dispatch and reconfiguration strategy.
The first stage, energy-level scheduling, aims to ensure a continuous power supply during an event by optimizing DERs scheduling while considering the limited energy capacity. It prioritizes resilience optimization and energy adequacy without considering grid code compliance.
In the second stage, SR is adjusted to satisfy grid codes and maximize load supply based on the first-stage power scheduling results. The first two stages focus on steady-state planning and scheduling, without considering operational variations. The third stage verifies the dynamic-level capability of handling system fluctuations.
3.1 Energy-level scheduling
In the first stage, the generation scheduling of each DER within the microgrid considers energy adequacy and grid resilience. The input data for the generation scheduling model includes ED of HILP, as well as the status of DERs and loads. The status of DERs and loads must be obtained through forecasting techniques. Objective function (Equation 17) optimizes three RI: minimum load supply (
This is a multi-objective optimization problem, where the decision variables are the output powers of ESS and diesel generators (DGs). The optimal solution is searched using a multi-objective genetic algorithm to ensure that permitted solutions satisfy the constraints of DERs’ equipment. The ESS charging or discharging power (
In addition, ESS instant energy storage behavior conformed to charging and discharging in continuous time intervals (Equation 19).
The SOC of ESS is defined as ratio of the stored energy to battery capacity, as shown in (Equation 20), where
For DG, the power output (
Equation 25 represents the power-balance constraint, where
The power output from DG and ESS in this stage optimizes the trapezoidal shape of resilience. However, energy-level scheduling does not consider power flow analysis, leading to overly ideal results due to the neglect of line losses. Therefore, in the second stage, grid-level scheduling incorporates simulation analysis to correct scheduling results and ensure feasibility.
3.2 Grid-level reconfiguration
In this stage, the objective is to minimize the disparity between energy-level scheduling results and actual supply load by optimizing SR while meeting the grid code. In addition, DIgSILENT power simulation software ensured grid safety through power flow analysis.
The objective function of grid-level scheduling (Equation 26) is to maximize power supplied while minimizing total system losses. The total power is calculated by summing the product of importance-based weight factor of each load and its respective demand.
Particle Swarm Optimization (PSO) is used to maximize resilience considering load value and system losses. The PSO algorithm adjusts the controllable switches
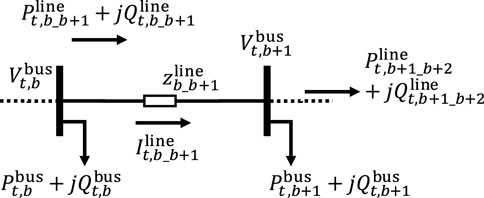
A schematic representation of distribution network is shown in Figure 3. According to Kirchhoff’s voltage law, voltage (
The feeder impedance is a complex number comprising resistive (
Compliance with the grid code, including bus voltage limits (Equation 32) and branch current limits (Equation 33), is crucial at this stage, where
The adjusted real and reactive power from DERs satisfy power conservation theorems (Equation 34) and (Equation 35), where
However, power systems that incorporate hybrid energy sources involve significant uncertainty. When system operators need to consider energy uncertainty while performing unit commitment or economic dispatch, the interval power flow (IPF) method is required (Zhang et al., 2023). The algorithms used to solve IPF models mainly include the interval iteration method, affine arithmetic, optimizing-scenarios method, and central limit theorem (Wang et al., 2024).
Most IPF methods must incorporate probabilistic statistics and optimization techniques. Therefore, the proposed method separates power flow and energy uncertainty into two stages. In this stage, grid-level reconfiguration, AC power flow analysis is performed using DIgSILENT to ensure compliance with system constraints. Energy uncertainty is addressed in the third stage, as introduced in Section 3.3.
3.3 Dynamic-level verification
After energy- and grid-level scheduling, the optimal DER scheduling and SR for each time period were obtained and confirmed to be feasible through power flow analysis. However, practical operations often involve fluctuations that are not validated using dynamic simulations during the first two stages.
In particular, the penetration of RE was relatively high in islanded microgrids. Microgrids may experience system-wide blackouts owing to excessive transient fluctuations that trigger protection systems. Therefore, the results obtained from the first two stages must undergo a dynamic-level analysis to ensure grid reliability during operation.
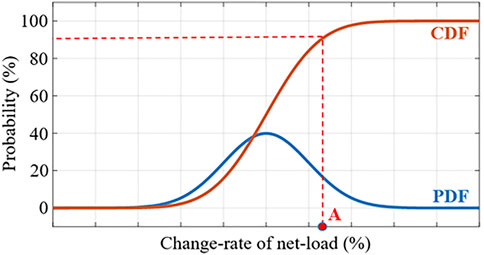
The net load depicted in (Equation 38) using historical data drives the microgrid fluctuations calculated using (Equation 39). The net load fluctuation probability density function and cumulative distribution function curves is shown in Figure 4, where
The VaR method applies a confidence level to evaluate net load fluctuations against acceptable thresholds. For example, at a 90% confidence level, the net load fluctuation at point A can be computed using (Equation 40). A dynamic simulation was performed to assess the system’s ability to withstand these fluctuations.
Islanded microgrids adjust DER output in real-time to restore the supply-demand balance, often using droop control for frequency regulation and power sharing. When there is a deviation between measured frequency
Frequency variation is represented by the swing Equation 42 (Hong et al., 2022), where
The frequency variation rate (
To avoid triggering under frequency relay, the maximum allowable frequency deviation (
From (Equation 46),
If there are no real roots for the solution to (Equation 47), triggering the lower limit of permissible frequency is impossible. Therefore, the constraint that must be satisfied is given by (Equation 48). Using (Equation 48), the maximum permissible initial net load power variation (
The net load variation is calculated at a specified confidence level, as shown in (Equation 40). If
The load-shedding selection starts with the lowest priority and smallest power demand, accumulating to
4 Simulation results
4.1 System parameters
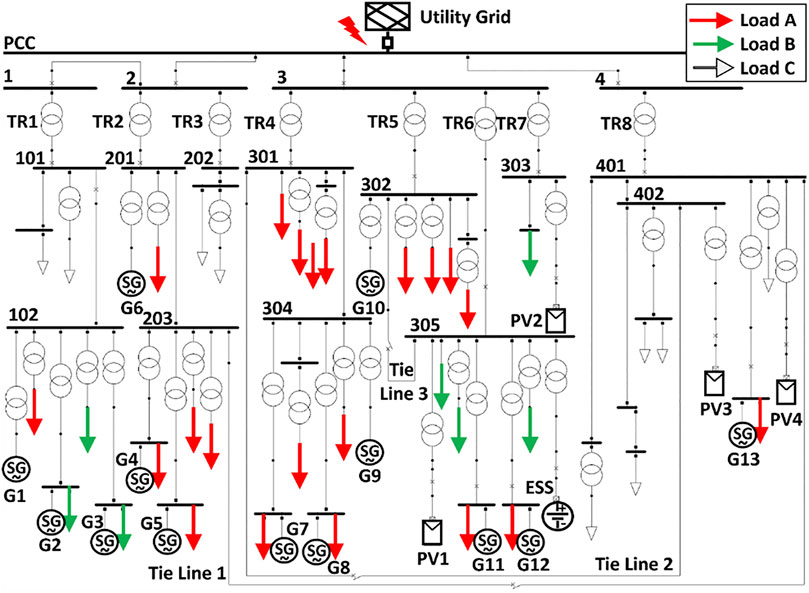
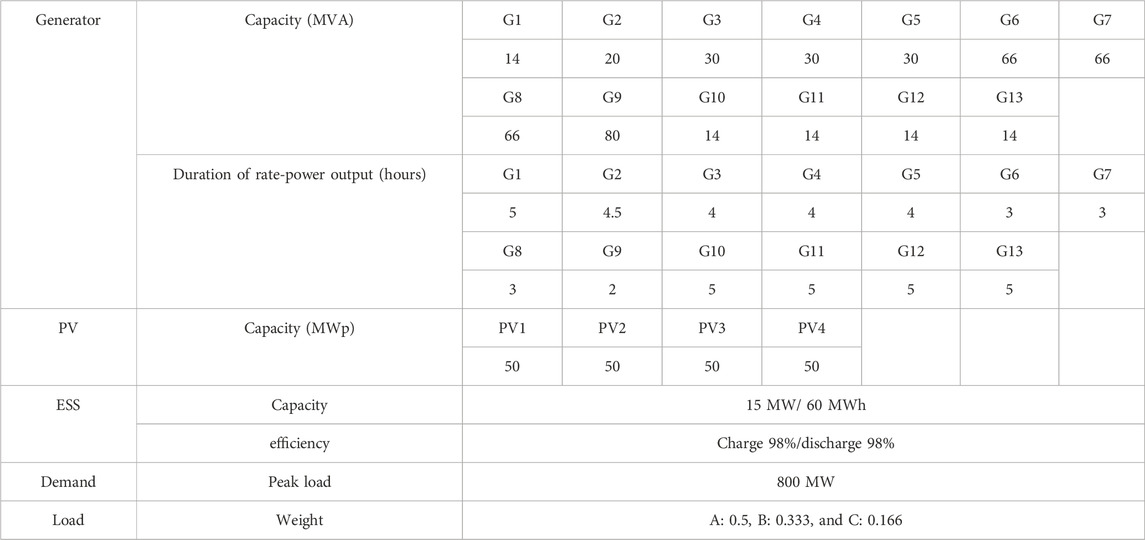
The feasibility of the proposed method was validated using the power system of a large-scale manufacturing campus in Taiwan. The single-line diagram of the park is shown in Figure 5, which includes 13 DGs with a total installed capacity of 458 MW. Relevant parameters are provided in Table 3. There are 51 controllable switches, of which 3 are normally open, and the rest are normally closed. Some modifications were made to the PV, ESS, and tie lines.
The actual maximum power consumption of the campus is approximately 800 MW, with load supply prioritized into three categories. The assumed load curves for each category are illustrated in Figure 6A, with the priority order being Load A > B > C. The PV power generation curve is shown in Figure 6B. HILP event assumed a power outage from the grid at different times with varying ED to validate the improvement in system resilience using the proposed method.
4.1.1 Energy-level scheduling
We assumed that HILP event occurred at 6 a.m. and lasted for 6 hours. The multi-objective optimization results of the first stage (energy-level scheduling) are shown in Figure 7A. The figure illustrates the Pareto front of multi-objective optimization problem. Solutions on the Pareto front are non-dominated with respect to each other. In this study, the solution closest to the origin is selected, namely the knee point, as a compromising result for scheduling.
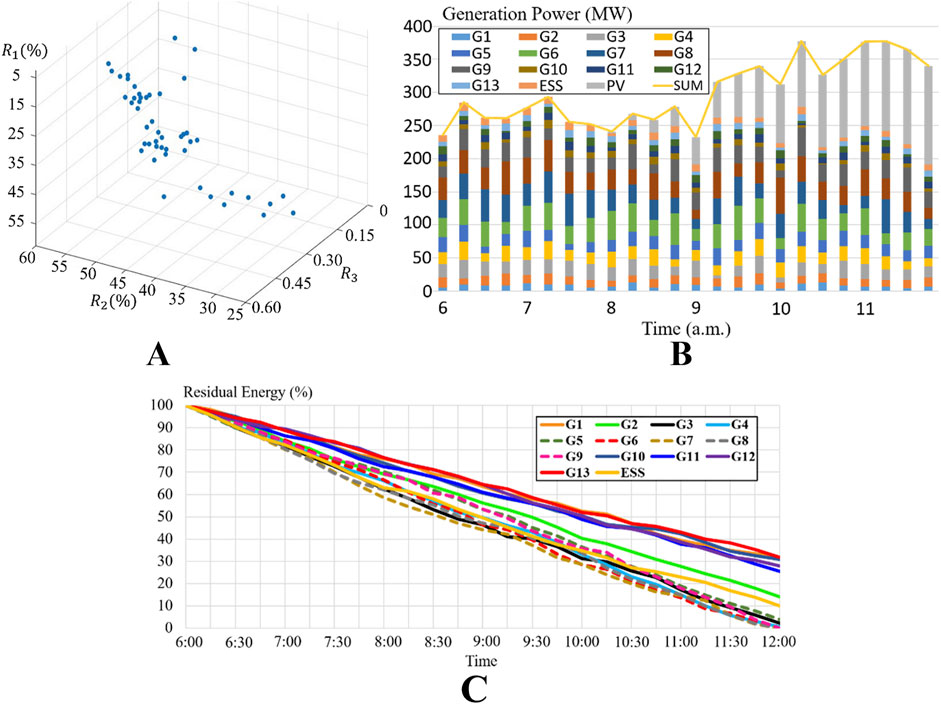
Figure 7. Result of energy-level scheduling (A) Pareto front (B) the scheduling result of the knee point (C) residual energy of energy resources.
The scheduling results of compromising solution during 6-h ED are shown in Figure 7B. It can be observed that PV generation starts to increase around 9 a.m. Consequently, the scheduling results show that the energy output from DGs is more concentrated before 9 a.m. to maximize the utilization of PV generation. This demonstrates that the first stage of scheduling method not only considers the capacity limitations of DGs but also adaptively adjusts to solar generation trend. However, since the load also begins to rise after 9 a.m., even though PV generation increases, DGs still need to maintain a certain output to balance supply and demand.
In the optimal scheduling stage, DERs should be properly managed during event, ideally depleting their remaining energy just as event concludes. This approach prevents premature energy release that could lead to a complete blackout in the later stages of event and avoids an overly conservative scenario where excessive energy remains unused.
Figure 7C illustrates the residual energy trajectory for each DERs. The values for ESS are represented as SOC, while for DGs, the values reflect the remaining fuel corresponding to residual energy. Figure 7C demonstrates that the proposed method nearly exhausts fuel by the end of event. Although G1 and G10-G13 still have 30% of their energy remaining, the actual residual energy is low due to their smaller capacity and fuel storage space.
4.1.2 Grid-level reconfiguration results
The first-stage of energy-level scheduling only optimizes DERs power scheduling for resilience and does not guarantee compliance with grid code. Therefore, the second-stage SR was verified through power flow analysis using DIgSILENT. SR consider the differences in load importance and line losses. The results at 10 a.m. after SR optimization are shown in Figure 8A. This diagram indicates that the manufacturing campus can be divided into four supply zones, namely μGrid 1 to μGrid 4.
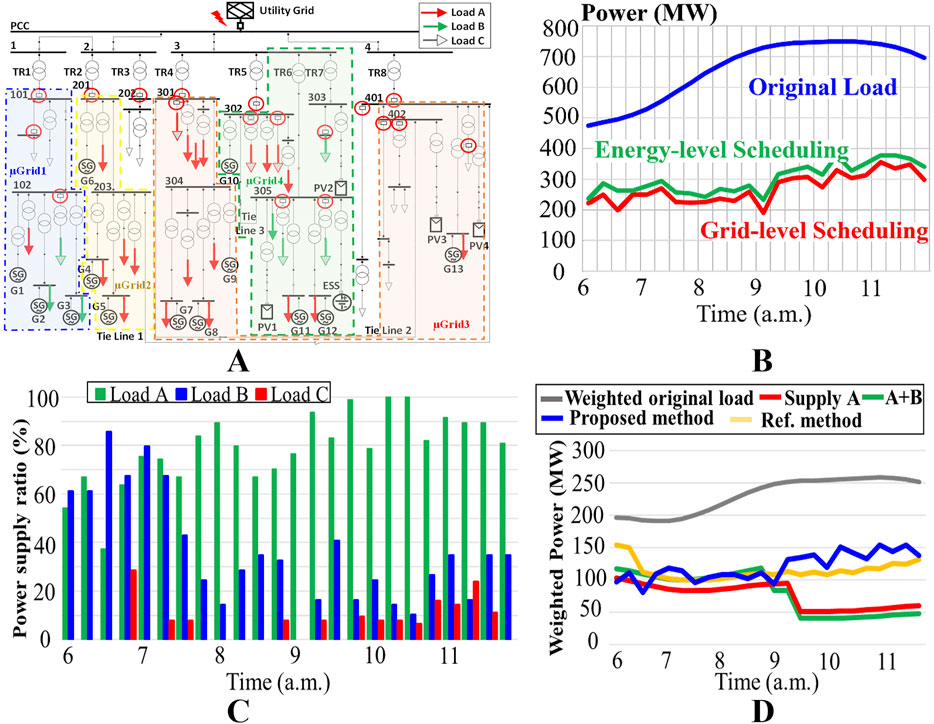
Figure 8. Grid-level reconfiguration results of six-hour HILP event (A) Microgrid partition (B) Scheduling results (C) Power supply ratio (D) Weighted power supply with different dispatch methods (Mohan et al., 2022).
At 10 a.m., PV generation is sufficient; therefore, the tie line 2 from 402 to 301 is closed, allowing PV to supply loads A at buses 301 and 304, as indicated by the orange blocks, μGrid 2. Figure 8B shows the scheduling results for HILP event. It can be observed that the ideal results from energy-level scheduling require sacrificing some load to comply with the grid code.
Figure 8C presents the power supply ratio for each load category at 15-minute intervals following the SR optimization. The majority of ED, power is prioritized to critical loads A. Post 9 a.m., the increase in PV generation is capable of meeting almost 80% of the demand for load A. By incorporating the design of load weight factors, SR strategy can efficiently supply most of the power to loads A and B, thereby enhancing RI.
The proposed method is compared with two intuitive operational methods currently used on campus and the method from Mohan et al., 2022. The methods currently used on campus include “Supply A” and “Supply A + B.” Due to the lack of tie lines, the system is divided into eight small power supply zones during a power outage, based on the primary transformers (TR1-TR8). Since all PV inverters are grid-connected types, PV in non-generator zones will shut down due to the lack of a reference voltage.
In addition to comparing with the two existing intuitive methods, references with similar application scenarios to the proposed method are added for comparison. Mohan et al., 2022 aims to enhance the resilience of the distribution system through optimized energy storage scheduling. The three comparison methods are described as follows:
• Supply A + B method: Loads category of A and B are supplied intuitively. If power capacity or energy in each zone is insufficient, the smallest loads B are gradually shed until a balance is achieved. If shedding all loads B is still insufficient, the smallest loads A are gradually shed.
• Supply A method: Provides power exclusively to loads A and gradually sheds the smallest loads first if power supply ability, including capacity or energy, is insufficient.
• Ref. method (Mohan et al., 2022): Fuzzy logic is used to control the charging and discharging of ESS to enhance system resiliency, considering the load importance and the SOC of ESS.
Figure 8D compares the proposed method with different control methods. All curves represent the weighted load supply. It is evident that the proposed method supplies a higher load value during event compared to the two intuitive operational methods. Particularly, the power supply curve after 9:00 shows that the proposed method can supply more load by fully utilizing PV generation through system reconfiguration compared to “Supply A” and “Supply A + B”. Compared to “Supply A + B”, “Supply A” delays load shedding until 09:15 by shedding load B.
Moreover, since the method from Mohan et al. (2022) also considers PV generation and load importance, the weighted power supply curve is similar to that of the proposed method. However, “Ref. method” only considers ESS charge and discharge control and lacks the energy-level scheduling present in the proposed method. Therefore, during HILP, the proposed method optimizes energy allocation based on resilience index.
The comparison of RI for the four scenarios is listed in Table 4. It is evident that the proposed method outperforms the intuitive operational methods. Additionally, since

Table 4. Resilience indices of HILP event (Mohan et al., 2022).
4.1.3 Grid-level reconfiguration results
The grid-level reconfiguration ensures that steady-state operating conditions satisfy the grid codes. However, uncertainties in load and PV can lead to net load fluctuations, potentially causing stability issues in islanded microgrids. In other words, microgrid must be able to ride through the fluctuations caused by loads and RE.
In this study, VaR method was adopted, with a confidence level of 97.5%, corresponding to a VaR of 2.5%. This is approximately equivalent to a net load variation of 10%. Therefore, through dynamic simulation, a 10% net load variation is applied to the four μGrids obtained by the second stage. The system architecture diagram of the four μGrids is shown in Figure 8A, respectively represented by different colors. Dynamic simulation was performed on each μGrid to confirm whether the respective minimum frequency dropped below 59.5 Hz. If it does, it indicates that when VaR = 2.5%, a μGrid may trigger low-frequency protection due to net load fluctuations. In other words, the current solution still requires some load shedding to ensure stability.
Taking 10 a.m. as an example, Figure 9 depict the simulation results of a 10% instantaneous net load surge occurring at 60 s for four μGrids. Figure 9A shows the simulation results for μGrid 1. The frequency nadir was 59.46 Hz, which triggered a low-frequency relay. The system may enter a blackout state, indicating that μGrid 1 cannot withstand a 10% net load fluctuation. According to (50), the shedding requirement of μGrid 1 should be at least greater than
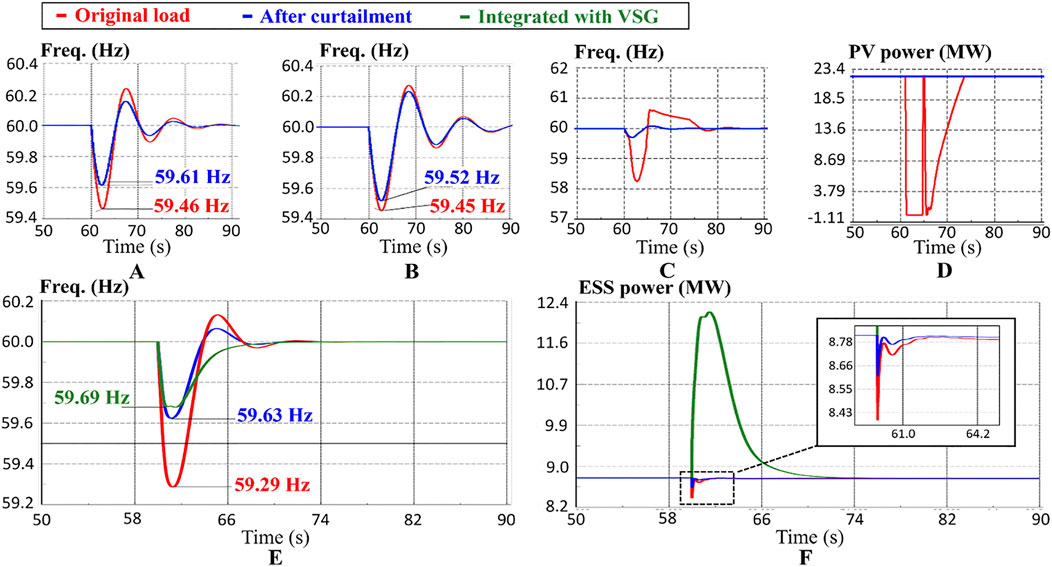
Figure 9. Dynamic-level verification result under confidence-level 97.5% at 10 a.m. (A) μGrid one frequency (B) μGrid 2 frequency (C) μGrid 3 frequency (D) PV power in μGrid 3 (E) μGrid 4 frequency (F) ESS power in μGrid 4.
Figure 9B shows the simulation results for μGrid 2. Under the original load conditions, with confidence level of 97.5%, frequency nadir was 59.45 Hz. Shedding 5.23 MW was necessary to increase frequency nadir to 59.52 Hz. In μGrid 3, there are more PV system connected. After experiencing a 10% net load fluctuation, frequency nadir falls below 59.5 Hz, as shown in Figure 9C. It is worth noting that the activation of low-frequency protection will cause the PV system to disconnect, as shown in Figure 9D. This will exacerbate the supply-demand imbalance during the transient period. Consequently, the frequency further accelerates downward to 58.2 Hz. Through simulation verification,μGrid 3 needs to shed 13.15 MW of load to ensure the system can withstand net load fluctuations at a 97.5% confidence level.
In addition to DGs and PV units, μGrid 4 was connected to ESS. If ESS operates under fixed-power control, μGrid 4 cannot withstand a 10% net load fluctuation. The frequency nadir drops to 59.14 Hz, as shown in Figure 9E. A further reduction of 34.3 MW in supply power is required to increase frequency nadir to 59.75 Hz.
The addition of VSG control to ESS helps increase the inertia of the grid, enhancing the ability of microgrid to handle sudden fluctuations in net load. When the frequency suddenly decreases, ESS with VSG control can provide instant power to support system frequency, as shown in Figure 9F. As shown in Figures 9E, F, when there is a sudden increase in net load, the ESS with VSG control will instantly increase its output to support the frequency. Based on the simulation, VSG control effectively increases frequency nadir to 59.69 Hz without additional load shedding. Other frequency control methods may have similar effects; however, this study merely used VSG (Long et al., 2021) as a demonstrative case for analysis.
From the above results, it is evident that Grid-level reconfiguration generally does not consider transient system fluctuation issues. Through dynamic-level verification, it is possible to plan for a higher level of supply stability within an islanded area. Taking the event at 10 a.m. as an example, the originally planned load supply was 646 MW.
However, considering 97.5% confidence level for the net load fluctuations, an additional shedding of 57.48 MW was required, which is equivalent to reducing the supply by 8.9% to ensure system stability. If ESS with VSG control, the shedding requirement decreases to 23.18 MW, thereby reducing the curtailed load from 8.9% to 3.59%.
4.2 Eight-hour HILP event
To verify the feasibility of the proposed method, different HILP events were assumed to occur in the campus. The HILP event occurs at 12 p.m. and lasts for 8 h. Due to limited oil storage capacity and PV generation dropping to zero after 6:00 p.m., the 8-hour incident poses a challenge to the power supply. If the load is not properly scheduled, the system will experience blackouts, resulting in additional restart costs.
Figure 10 shows the weighted power supply curves for the 8-hour HILP event under different methods described in Section 4.2.2. “Supply A”, which only supplies loads A, does not result in a complete blackout during the event, but the total power supply is significantly lower. Both “Supply A + B” and “Ref. Method” experience total blackouts after PV generation ceases because they lack the energy-level scheduling of the proposed method.
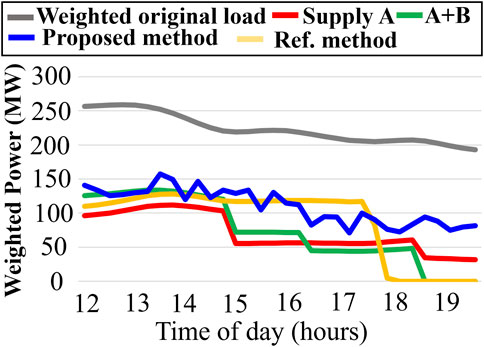
Figure 10. Weighted power supply of eight-hour HILP event with different dispatch methods (Mohan et al., 2022).
Additionally, Table 4 lists the RI for different scheduling methods. When the HILP incident becomes more severe, the proposed method demonstrates a more significant advantage over other methods. The fact that
The proposed method shows significant improvements across all three indicators. In addition to preventing blackouts, the minimum power supply increases from 68 MW with the “Supply A” method to 177 MW. Compared to other methods, the first stage of energy reservation in this method enhances the system’s resilience.
4.3 Sensitivity analyses
In the proposed three-stage resilience enhancement method, ED is required as an input for the first stage. However, actual situations often differ from expectations. To validate the practical feasibility of the proposed method, this paper conducts grid resilience enhancement planning based on HILP event of 6 h ED. Compare the method proposed with “Supply A + B” and “Supply A” methods to examine the impact on RI when actual ED differs from originally set duration.
As shown in Figure 11, the proposed method outperforms the other two methods across all three RI. Since
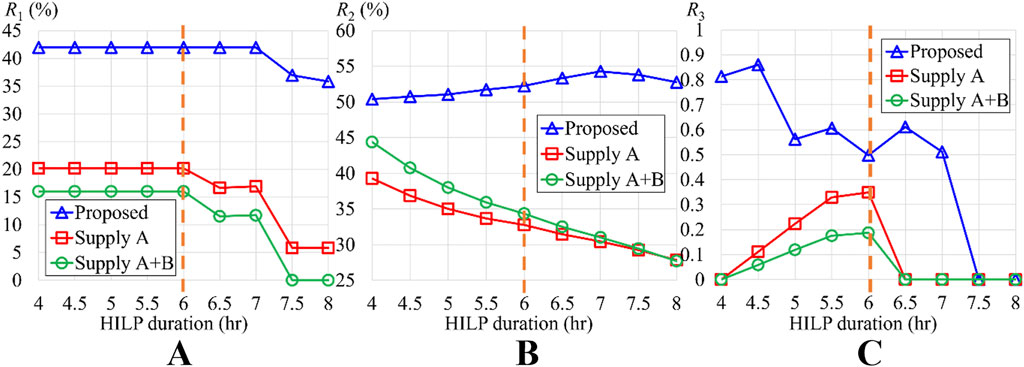
Figure 11. The impact of different actual power outage duration on RI when HILP is estimated to be 6 h (A)
When ED is 8 hours,
This mismanagement of energy is even more evident in
The
Conversely, if actual ED exceeds the expected length, the recovery slope does not change significantly. However, if the duration surpasses a certain threshold, such as more than 1.5 h in this case, the insufficient energy in later stages may result in a loss of recovery capability, as shown in Figure 11C.
The above analysis indicates that the proposed scheduling method outperforms traditional “Supply A” and “Supply A + B” methods under varying ED. The actual duration significantly influences RI. Furthermore, optimal energy scheduling can prevent microgrid from entering a complete blackout. However, if ED significantly exceeds expectations and depletes energy sources, even optimized scheduling may not improve
5 Conclusion
This study proposes composite resilience indices for a user-side microgrid, considering load priority, the speed of supply decline and recovery, and energy shortages. Additionally, a three-stage optimal dispatch and reconfiguration strategy for resilience is proposed, analyzing aspects such as energy supply and demand, system steady-state, and dynamic-state constrains. A feasible scheduling strategy was obtained by integrating DIgSILENT simulations.
Furthermore, the proposed method can schedule heterogeneous resources to optimize RE utilization. The integration of load and RE forecasting techniques can be considered for future work. Dynamic-level validation ensures that the protection system is not triggered by net load fluctuations within appropriate risk tolerance levels. The introduction of VSG in ESS reduces the need for demand shedding at the same desired risk level.
Compared with the existing “supply A” method, simulation results show that the proposed method increases the minimal power supply (
Sensitivity analysis of ED uncertainty indicates that the proposed method maintains its advantage over existing methods even with changes in ED. Moreover, when there is a discrepancy between expected and actual ED, the proposed method still outperforms the existing methods in all RI. The approach proposed in this study not only provides more feasible scheduling solutions for the user-side microgrid to cope with HILP events but also significantly enhances system resilience.
Data availability statement
The original contributions presented in the study are included in the article/supplementary material, further inquiries can be directed to the corresponding author.
Author contributions
Y-SW: Conceptualization, Data curation, Formal Analysis, Investigation, Methodology, Resources, Software, Supervision, Validation, Visualization, Writing–original draft, Writing–review and editing. J-TL: Validation, Visualization, Writing–review and editing. H-TY: Funding acquisition, Project administration, Validation, Writing–review and editing.
Funding
The author(s) declare that financial support was received for the research, authorship, and/or publication of this article. This work was supported by the National Science and Technology Council, R.O.C, under Grants 113-2218-E-006-009-.
Conflict of interest
The authors declare that the research was conducted in the absence of any commercial or financial relationships that could be construed as a potential conflict of interest.
Publisher’s note
All claims expressed in this article are solely those of the authors and do not necessarily represent those of their affiliated organizations, or those of the publisher, the editors and the reviewers. Any product that may be evaluated in this article, or claim that may be made by its manufacturer, is not guaranteed or endorsed by the publisher.
References
Bian, Y., Bie, Z., and Lin, Y. (2018). A hierarchical optimization model for multi-microgrids to enhance power system resilience. (Portland, OR, USA: IEEE Power and Energy Society General Meeting). doi:10.1109/PESGM.2018.8585932
Bie, Z., Lin, Y., Li, G., and Li, F. (2017). Battling the extreme: a study on the power system resilience. IEEE 105, 1253–1266. doi:10.1109/JPROC.2017.2679040
Braun, M., Hachmann, C., and Haack, J. (2020). Blackouts, restoration, and islanding: a system resilience perspective. IEEE Power and Energy Mag. 18 (4), 54–63. doi:10.1109/MPE.2020.2986659
Chanda, S., Srivastava, K., Mohanpurkar, M. U., and Hovsapian, R. (2018). Quantifying power distribution system resiliency using code-based metric. IEEE Trans. Industry Appl. 54 (4), 3676–3686. doi:10.1109/TIA.2018.2808483
Chowdhury, S., and Zhang, Y. (2024). Two-stage stochastic optimal power flow for microgrids with uncertain wildfire effects. IEEE Access 12, 68857–68869. doi:10.1109/ACCESS.2024.3397920
Confrey, J. A. H., Stuban, M. F., and Eveleigh, T. J. (2020). Energy storage systems architecture optimization for grid resilience with high penetration of distributed photovoltaic generation. IEEE Syst. J. 14 (1), 1135–1146. doi:10.1109/JSYST.2019.2918273
da Costa, L. C., Thomé, F. S., Garcia, J. D., and Pereira, M. V. F. (2021). Reliability-constrained power system expansion planning: a stochastic risk-averse optimization approach. IEEE Trans. Power Syst. 36 (1), 97–106. doi:10.1109/TPWRS.2020.3007974
Fan, B., Liu, X., Xiao, G., Yang, X., Chen, B., and Wang, P. (2024). Enhancing adaptability of restoration strategy for distribution network: a meta-based graph reinforcement learning approach. IEEE Internet Things J. 11 (14), 25440–25453. doi:10.1109/JIOT.2024.3396641
Hamidieh, M., and Ghassemi, M. (2022). Microgrids and resilience: a review. IEEE Access 10, 106059–106080. doi:10.1109/ACCESS.2022.3211511
He, C., Dai, C., Wu, L., and Liu, T. (2018). Robust network hardening strategy for enhancing resilience of integrated electricity and natural gas distribution systems against natural disasters. IEEE Trans. Power Syst. 33 (5), 5787–5798. doi:10.1109/TPWRS.2018.2820383
Hong, Q., Ji, L., Blair, S. M., Tzelepis, D., Karimi, M., Terzija, V., et al. (2022). A new load shedding scheme with consideration of distributed energy resources’ active power ramping capability. IEEE Trans. Power Syst. 37 (1), 81–93. doi:10.1109/TPWRS.2021.3090268
Huang, G., Wang, J., Chen, C., Qi, J., and Guo, C. (2017). Integration of preventive and emergency responses for power grid resilience enhancement. IEEE Trans. Power Syst. 32 (6), 4451–4463. doi:10.1109/TPWRS.2017.2685640
Huang, W., Zhang, X., Li, K., Zhang, N., Strbac, G., and Kang, C. (2022). Resilience oriented planning of urban multi-energy systems with generalized energy storage sources. IEEE Trans. Power Syst. 37 (4), 2906–2918. doi:10.1109/TPWRS.2021.3123074
Jiang, T., Sun, T., Liu, G., Li, X., Zhang, R., and Li, F. (2022). Resilience evaluation and enhancement for island city integrated energy systems. IEEE Trans. Smart Grid 13 (4), 2744–2760. doi:10.1109/TSG.2022.3157856
Kadir, S. U., Majumder, S., Srivastava, A. K., Chhokra, A. D., Neema, H., Dubey, A., et al. (2024). Reinforcement-learning-based proactive control for enabling power grid resilience to wildfire. IEEE Trans. Industrial Inf. 20 (1), 795–805. doi:10.1109/TII.2023.3263500
Kaloti, S. A., and Chowdhury, B. H. (2023). Toward reaching a consensus on the concept of power system resilience: definitions, assessment frameworks, and metrics. IEEE Access 11, 81401–81418. doi:10.1109/ACCESS.2023.3300292
Li, Q., Zhang, X., Guo, J., Shan, X., Wang, Z., Li, Z., et al. (2022). Integrating reinforcement learning and optimal power dispatch to enhance power grid resilience. IEEE Trans. Circuits Syst. II Express Briefs 69 (3), 1402–1406. doi:10.1109/TCSII.2021.3131316
Li, Z., Shahidehpour, M., Aminifar, F., Alabdulwahab, A., and Al-Turki, Y. (2017). Networked microgrids for enhancing the power system resilience. Proc. IEEE 105 (7), 1289–1310. doi:10.1109/JPROC.2017.2685558
Liu, M., Feng, Q., Fan, D., Dui, H., Sun, B., Ren, Y., et al. (2023). Resilience importance measure and optimization considering the stepwise recovery of system performance. IEEE Trans. Reliab. 72 (3), 1064–1077. doi:10.1109/TR.2022.3196058
Liu, X., Shahidehpour, M., Li, Z., Liu, X., Cao, Y., and Bie, Z. (2017). Microgrids for enhancing the power grid resilience in extreme conditions. IEEE Trans. Smart Grid 8 (2), 1–597. doi:10.1109/TSG.2016.2579999
Long, B., Liao, Y., Chong, K. T., Rodríguez, J., and Guerrero, J. M. (2021). MPC-controlled virtual synchronous generator to enhance frequency and voltage dynamic performance in islanded microgrids. IEEE Trans. Smart Grid 12 (2), 953–964. doi:10.1109/TSG.2020.3027051
Mahzarnia, M. M. P., Baboli, T., and Siano, P. (2020). A review of the measures to enhance power systems resilience. IEEE Syst. J. 14 (3), 4059–4070. doi:10.1109/JSYST.2020.2965993
Mohan, G. N. V., Bhende, C. N., and Srivastava, A. K. (2022). Intelligent control of battery storage for resiliency enhancement of distribution system. IEEE Syst. J. 16 (2), 2229–2239. doi:10.1109/JSYST.2021.3083757
Panteli, M., Trakas, D. N., Mancarella, P., and Hatziargyriou, N. D. (2017) “Power systems resilience assessment: hardening and smart operational enhancement strategies,” 105. IEEE, 1202–1213. doi:10.1109/JPROC.2017.2691357
Shen, Y., Gu, C., Ma, Z., Yang, X., and Zhao, P. (2021). A two-stage resilience enhancement for distribution systems under hurricane attacks. IEEE Syst. J. 15 (1), 653–661. doi:10.1109/JSYST.2020.2997186
Stankovic, A. M., Tomsovic, K. L., De Caro, F., Braun, M., Chow, J. H., Čukalevski, N., et al. (2023). Methods for analysis and quantification of power system resilience. IEEE Trans. Power Syst. 38 (5), 4774–4787. doi:10.1109/TPWRS.2022.3212688
Ti, B., Li, G., Zhou, M., and Wang, J. (2022). Resilience assessment and improvement for cyber-physical power systems under typhoon disasters. IEEE Trans. Smart Grid 13 (1), 783–794. doi:10.1109/TSG.2021.3114512
Tong, T., Yan, Y., and Xia, Y. (2024). Fault restoration strategy for multi energy distribution systems with consideration of resilience enhancement. IEEE Can. J. Electr. Comput. Eng. 47 (2), 87–94. doi:10.1109/ICJECE.2024.3380062
Vugrin, E., Castillo, A., and Silva-Monroy, C. (2017). Resilience metrics for the electric power system: a performance-based approach. Livermore, albuquerque, nm, USA. Tech. Rep. SAND2017-1493. doi:10.2172/1367499
Wang, D., Zhang, C., Li, J., Zhu, L., Zhou, B., Zhou, Q., et al. (2024). A novel interval power flow method based on hybrid box-ellipsoid uncertain sets. IEEE Trans. Power Syst. 39 (4), 6111–6114. doi:10.1109/TPWRS.2024.3391921
Wang, Y., Huang, T., Li, X., Tang, J., Wu, Z., Mo, Y., et al. (2021a). A resilience assessment framework for distribution systems under typhoon disasters. IEEE Access 9, 155224–155233. doi:10.1109/ACCESS.2021.3128967
Wang, Y., Rousis, A. O., and Strbac, G. (2021b). A three-level planning model for optimal sizing of networked microgrids considering a trade-off between resilience and cost. IEEE Trans. Power Syst. 36 (6), 5657–5669. doi:10.1109/TPWRS.2021.3076128
Xia, N., Deng, J., Zheng, T., Zhang, H., Wang, J., Peng, S., et al. (2022). Fuzzy logic based network reconfiguration strategy during power system restoration. IEEE Syst. J. 16 (3), 4735–4743. doi:10.1109/JSYST.2021.3123325
Yang, X., Zhou, Z., Zhang, Y., Liu, J., Wen, J., Wu, Q., et al. (2023). Resilience-oriented Co-deployment of remote-controlled switches and soft open points in distribution networks. IEEE Trans. Power Syst. 38 (2), 1350–1365. doi:10.1109/TPWRS.2022.3176024
Yao, Y., Liu, W., Jain, R., Chowdhury, B., Wang, J., and Cox, R. (2023). Quantitative metrics for grid resilience evaluation and optimization. IEEE Trans. Sustain. Energy 14 (2), 1244–1258. doi:10.1109/TSTE.2022.3230019
Zhang, C., Liu, Q., Zhou, B., Chung, C. Y., Li, J., Zhu, L., et al. (2023). A central limit theorem-based method for DC and AC power flow analysis under interval uncertainty of renewable power generation. IEEE Trans. Sustain. Energy 14 (1), 563–575. doi:10.1109/TSTE.2022.3220567
Keywords: battery energy storage system, microgrid, multi-objective optimization, power system resilience, power system simulation, risk management, system reconfiguration, virtual synchronous generator
Citation: Wu Y-S, Liao J-T and Yang H-T (2024) Three-stage resilience enhancement via optimal dispatch and reconfiguration for a microgrid. Front. Energy Res. 12:1461383. doi: 10.3389/fenrg.2024.1461383
Received: 08 July 2024; Accepted: 30 September 2024;
Published: 15 October 2024.
Edited by:
Shiyu Yang, Oregon Institute of Technology, United StatesCopyright © 2024 Wu, Liao and Yang. This is an open-access article distributed under the terms of the Creative Commons Attribution License (CC BY). The use, distribution or reproduction in other forums is permitted, provided the original author(s) and the copyright owner(s) are credited and that the original publication in this journal is cited, in accordance with accepted academic practice. No use, distribution or reproduction is permitted which does not comply with these terms.
*Correspondence: Hong-Tzer Yang, aHR5YW5nQG1haWwubmNrdS5lZHUudHc=
 Yi-Syuan Wu
 Jian-Tang Liao
 Hong-Tzer Yang