- 1Jabalpur Engineering College, Jabalpur, Madhya Pradesh, India
- 2Madhav Institute of Technology & Science, Gwalior, Madhya Pradesh, India
This paper presents a unique optimization method based on the incomprehensible but intelligible-in-time (IbI) logic algorithm (ILA) to optimally place dispersed generators in small, medium, large, and very large (16-, 33-, 69-, and 118-bus) radial distribution power networks to reduce power losses, the total operating cost, and the voltage deviation and improve the voltage level. Two types of multiple distributed generators (DGs) are employed in this study, one working at unity power factor and the other at 0.866 p.f. The IbI logic algorithm works by understanding concepts that are not currently recognized as logical but are expected to become logical over time. The proposed approach was used to address a multi-objective multi-DG placement problem. The results generated through this method were compared with those generated by other methods and were observed to be comparatively remarkable.
1 Introduction
Addressing the growing demand for power systems is challenging for the existing power line infrastructure. Distribution networks experience high I2R power losses because of low voltage and high current ratings. In addition, a low X/R ratio of the distribution level leads to more power loss and a decrease in voltage magnitude compared to the transmission level. It has a direct impact on the financial aspect, the efficiency of utilities, and the system’s voltage profile, particularly in heavy load conditions. This poses severe challenges to power utilities. The problem can be solved by increasing the capacity of power systems or using distributed generators (DGs) to address the regional consumer demand (Ackermann et al., 2001). DGs can be described as small electric power-generating sources that are generally located near centers of consumption, with sizes ranging from 1 kW to 50 MW. According to El-Khattam and Salama (2004), DGs are broadly classified into traditional and non-traditional generators. Traditional generators use combustion engines such as micro-turbines and natural gas turbines, which belong to the categories of simple cycle, recuperated cycle, and combined-cycle gas turbines. Non-traditional generators can be divided into electrochemical devices, storage types, and renewable devices. Fuel cells (FCs) are primary electrochemical devices. Storage devices include batteries and flywheels. Meanwhile, renewable technologies, including PV cells and wind turbines, are presently more popular. DGs are more advantageous than conventional power-generating approaches in numerous capacities. First, they are more cost-effective and efficient because they reduce transmission losses and increase proximity to the energy consumption points. Additionally, DGs can provide power during periods of high demand. This circumvents the need for expensive peak-load power plants. Second, distributed electricity production is decentralized and, thus, less susceptible to outages. It is more reliable than conventional power plants. Third, because DGs use pollution-free renewable energy sources such as wind, solar, and geothermal resources, these are more ecologically advantageous than conventional power plants. Large-scale power facilities can have substantial adverse effects on the environment. However, DGs may decrease the need for these facilities. Finally, auxiliary services, such as frequency control and voltage support, which improve the resilience and dependability of the grid, are additional advantages that distributed generation can provide to power systems (Selim et al., 2023).
To maximize the advantages of DGs and minimize the detrimental effects on power systems, optimizing their position and size is imperative. To optimize DG allocation, a mathematical optimization objective function is formulated and solved. This improves the capacity, performance, reliability, and longevity of the power system. Optimization techniques have been effective in computing the appropriate sizing for the best position of DGs. The advantages include a higher utilization of energy resources, improved system performance, and lower expenses and emissions. In addition to the advantages of DG technology, certain connection issues exist. These include the voltage level, system frequency variations in power flow, protection, reactive power, and power conditioning (Peperman et al., 2005).
DGs are divided into four categories based on their real and imaginary power delivery capabilities (as illustrated by Hung et al. (2010)):
Type-1 (T-I): It has the potential of delivering only ‘P’ at unity p.f., such as microturbines, PV arrays, and fuel cells.
Type-2 (T-II): It can only inject ‘Q’ at zero p.f., such as gas turbines.
Type-3 (T-III): It is designed to provide both ‘P’ and ‘Q’ at p.f. from 0.8 to 0.99, such as wind, tidal, and geothermal plants.
Type-4 (T-IV): It may provide ‘P’ but absorb ‘Q,’ such as doubly fed induction generators.
2 Literature review
To solve the optimal allocation problem of DGs, various objective functions are considered. These include real power loss, reactive power loss, voltage-profile improvement, voltage deviation, voltage stability index, power loss index, operational cost, cost of the power from the DG, and environmental and emission issues. Occasionally, these functions are considered individually. Alternatively, many of these are combined to form a multi-objective problem. Researchers have implemented different techniques to address this problem with respect to the objective function. These optimization methods were broadly classified by Viral and Khatod (2012), Pesaran et al. (2016), and Jain et al. (2017) into analytical methods, heuristic or meta-heuristic methods, hybrid methods, and the artificial intelligence approach.
Analytical methodologies use mathematical formulations to analyze the effect of DG-injected power on the power system’s performance. This is exhibited by the improved analytical (IA) method and exhaustive load flow (ELF) optimization method (Hung and Mithulananthan, 2013). Several indices were developed and calculated using an analytical method. Hung and Mithulananthan (2013) used the highly common but significant index called loss sensitivity factor based on the exact loss formula given by Elgerd (1971). Khatod et al. (2006) used analytical equations to compute different sensitivity indices such as the active power-loss, reactive power-loss, and voltage-magnitude sensitivities for a 69 bus system. Acharya et al. (2006) developed a priority list for power loss reduction using the LSF method with DGs in IEEE 30-, 33-, and 69-bus radial distribution systems (RDSs). Another analytical approach, introduced by Tah and Das (2016), used a ‘p’ bus to control the voltage magnitude of a ‘PQV’ bus for the 33- and 69-bus systems. Occasionally, the results obtained from analytical approaches are ineffective because these are dependent on network topological constraints.
Consequently, several investigators shifted to metaheuristic-based optimization strategies. Metaheuristic approaches effectively address optimization challenges without requiring a comprehensive analysis. Numerous heuristic optimization methods have been used in the power sector for DGs. These heuristic algorithms are categorized on the basis of their inspiration and involve evolutionary actions (e.g., swarm actions and food searches), physical rules, and human-related concepts. These algorithms use the exploration and exploitation phases to identify the best local solution from global options. Certain evolutionary phenomenon approaches have been employed to identify the best site and size of DG units. These include the following:
• Genetic algorithm (GA) used by Singh et al. (2019); Kashyap et al. (2017); Musa and Hashim (2019); Nezhadpashaki et al. (2020); Gopu et al. (2021); Rosado and Agustin (1998); El-Ela et al. (2010).
• Refined GA by Zhu (2002).
• Particle swarm optimization (PSO) proposed by El-Zonkolky (2011); Kansal et al. (2011, 2013); Lalitha et al. (2005), SPSO by Khalil et al. (2013), and multi-objective PSO by Ganguly et al. (2013).
• Hybrid PSO used by Aman et al. (2014).
• BAT algorithm used by Xin-She et al. (2010); Behera et al. (2015); Saxena et al. (2022).
• Whale optimization algorithm used by Prakash and Lakshminarayana (2018).
• Shark optimization used by Ali et al. (2023).
• Ant lion optimization used by Ali et al. (2018a).
• Bacterial foraging used by Devi and Geethanjali (2014); Imran et al. (2014).
• Krill herd optimization algorithm used by Sultana and Roy (2015).
• Moth flame optimizer used by Das and Srivastava (2017).
• Swine influenza optimization used by Sharma et al. (2016).
• Invasive weed algorithm used by Prabha and Jayabarathi (2016).
• Osprey and Walrus optimization algorithms used by TM et al. (2024).
Heuristic procedures based on physical rules such as slime mold optimization (Amigue et al., 2021), simulated annealing (Dharageshwari and Nayanatara, 2015), arithmetic optimization algorithm (Khan et al., 2023), and Thevenin-based impedance stability index (Talha et al., 2023) were also employed to solve multi-objective DG problem. Meanwhile, human-related concepts such as the modified teaching–learning-based optimization algorithm (García and Mena, 2013) were used to solve single and multi-objective DG allocation. In these studies, single and multi-objective problems were addressed. In single objective functions, power-loss mitigation or voltage-level improvement are important features. Meanwhile, power loss reduction, voltage improvement, and operating cost reduction are the key factors for multi-objective functions.
The most popular evolutionary approaches amongst researchers are genetic algorithm and particle swarm optimization. Hybrid approaches primarily involve combining one of these two methods with another effective technique. These approaches have been used to obtain the best results with fast convergence. The multi-objective problem of multiple DG allocation was solved in the past by employing these techniques. The GA was combined with PSO by Moradi and Abedini (2012) to achieve better voltage regulation, reduced losses, and improved voltage profiles in 33- and 69-bus systems by optimally placing multiple DGs. The GA combined with the Tabu search algorithm was used by Gandomkar et al. (2005) for placing DG on the demand side to mitigate power losses. PSO combined with fuzzy control (Darvishi et al., 2011), PSO integrated with the shuffled leap frog algorithm (Gitizadeh et al., 2013), and derivative techniques of combination of PSO with other algorithms, such as IPSO-Monte Carlo simulation (Abdi and Afshar, 2013) and bare bone PSO with differential evolution (Arya et al., 2012), are employed to solve the multi-DG placement problem in various test systems. Similarly, the whale optimization algorithm combined with the sine cosine algorithm was discussed by Ali et al. (2018b). A hybrid approach combining symbiotic organism search and a neural network algorithm (SOS–NNA) was proposed by Nguyen et al. (2021) for multi-objective DG and capacitor placement in 33- and 69-bus test systems. A hybrid configuration of ant colony optimization (ACO) and artificial bee colony optimization (ABO) with the point estimate method (PEM) was proposed by Kefayat et al. (2015) for the DG placement problem in 33- and 69-bus radial networks.
Other DG applications, such as PV arrays with storage facilities and the charging of electric vehicles with optimal allocation identification, were presented by Fokui et al. (2023) and Yu et al. (2024). Furthermore, hybrid and metaheuristic techniques were combined to optimally integrate PV modules with wind turbines (Avar and Ehsan, 2024).
This study proposes a unique optimization theory, the incomprehensible but intelligible-in-time (IbI) logic algorithm (ILA), to optimally place dispersed generators into small, medium, large, and very large (16-, 33-, 69-, and 118-bus) radial distribution power networks to reduce power losses, minimize total operating costs, decrease voltage deviation, and improve voltage levels.
3 Problem formulation
The proposed approach aims to minimize the multi-objective function of the DG location and size within a distribution network while considering the unit and operating constraints.
3.1 Load flow in the radial network
A radial distribution network is a form of electrical power distribution network in which power is distributed radially from a single source (such as a substation) to numerous end users or distributing substations. The network comprises feeders that radiate away from the source. It is divided further into distribution networks that provide power to individual consumers.
The load flow in a radial network can be solved repeatedly by applying two distinct sets of iterative equations as follows. The first set of equations calculates the power flow from the last branch to the root node in a backward manner. The second set of equations evaluates the voltage magnitude and angle of each node, beginning with the first node and moving to the final node. The iterative equations are evaluated as follows.
The net real power
where
The voltage magnitude and angle for each bus are evaluated in the forward direction as follows:
Furthermore,
Comparing the equations of
The active power loss of the
Hence, the total active power loss can be expressed as Equation 5,
3.2 Power loss with connected DGs
Optimizing the position of DGs reduces power losses, enhances voltage stability, and reduces expenditures. This, in turn, enhances supply assurance and dependability. The loss in active power when the DG is integrated into the system can be computed as follows:
The total active power loss in the system connected to DGs is mentioned in Equation 6,
3.3 Reduction in power loss
The power loss should be minimized by installing a DG. The active power loss index (APLI) is calculated as the ratio of the total active power losses including those of DG (TAPLDG) to the total active power losses (TAPL) excluding it. It is given by Equation 7,
By installing a DG into the system, the net power loss is reduced by minimizing
3.4 Voltage deviation index
The voltage deviation index (VDI) is also known as the voltage quality index. It is a metric used to analyze the voltage supply standards in electrical power systems. It represents the magnitude of the voltage deviations from the nominal value and is generally expressed as a percentage, as given in Equation 8. A high-voltage deviation index indicates that the voltage supplied varies significantly from the standard voltage level. This may result in equipment malfunction, low electrical device efficiency, and power quality problems.
By installing a DG, the proposed technique aims to minimize the VDI and bring it closer to zero. This would enhance the network performance and increase voltage stability.
3.5 Operational cost reduction
The installation of DGs helps reduce operational costs. It has two main components. One is related to the cost of active power provided by the substation. The second is the cost of the power provided by the DG. The first part can be reduced by limiting the actual power losses. Meanwhile, the second cost can be reduced by extracting less power from the DG. Hence, the total operational cost represented by Equation 9 is,
where
where
3.6 Objective function
The proposed multi-objective optimization approach aims to reduce the power loss, voltage variation, and overall operating costs of the distribution system. This is expressed as Equation 11
where
The following constraints should be satisfied to optimize the objective function:
• The size and site of placement should be considered only at full load.
• The voltages at each bus should remain within the reasonable range of ±5%, i.e., 0.95 to 1.05 p.u.
• The generator operating range should lie within the permissible limit, i.e.,
• The current feeder capability limit should remain within the rated current capability of the branch
4 Load models
According to Imran et al. (2014), various load models are classified on the basis of the load factor ρ, bus voltage (its magnitude and frequency), and real and imaginary power of the load. The effect of a variation in the load at any node ‘i’ is given by
The load factor ρ is defined as the multiplying factor by which the variation in load power at any node is observed. Three load models according to the parameters were considered in this study (constant power load at half loading, full loading, and overloaded conditions; constant current load; and constant impedance load). For these loading systems, ξ is considered 0, 1, and 2, respectively. ψ is also considered 0, 1, and 2, respectively. The load factor for all these types of loads is considered 1 only.
4.1 Incomprehensible but intelligible-in-time logic algorithm
The human brain is an exquisite albeit complex system that understands only what it observes or experiences, referring to these experiences as logic. It can be trained using various types of logic (L). Entities that fall outside the range of understanding of the common brain are rejected as illogical. However, these may be understood by an expert (E). In such cases, logic that can be understood by the common brain is called general logic (G-logic) and that which can be understood only by an expert is called special logic (S-logic). When described by an expert, G-logic can be understood by a non-expert and transformed into S-logic. However, occasionally, even experts are incapable of learning certain S-logic in the current scenario, such as the presence of wormholes in space. We call these experiences non-logics (NLs). It is likely that present NL would transform into logic over time. For example, elderly persons may not have assumed that they would be able to make a video call over the internet or have considered online bank transactions. In their time, these concepts were not considered logical. However, in the present advanced world, these technologies are applied in day-to-day activities and are considered logical. A contradiction always exists between logic and non-logic in understanding and solving a particular problem. Solving problems through logic is imperative. However, there is always a secondary plan for considering NLs that could become logical over a period of time.
A novel optimization method based on the theory of IbI logics, introduced by Mirrashid and Naderpour (2023), is called IbI logic algorithm optimization. The ILA functions similarly to the human mind, which is a sophisticated biological system with special cognitive capacities. The underlying concept of the ILA is that solutions that are presently considered illogical or indecipherable by humans may eventually develop into rational and reasonable solutions.
4.1.1 ILA parameters
1. IbI logic and non-logic: Common understanding is logic. A set of NLs is to be considered, from which the correct NL, capable of becoming IbI logic, must be identified.
2. IbI probability: The likelihood of an NL transforming into IbI logic.
3. Degree: A distance parameter calculated over a period in which NL can be transformed into IbI logic.
4. Comprehensibility: The distance of confidence at any given time for the probability of conversion and the degree of closeness between L and NL.
4.1.2 IbI logic algorithm stages
The ILA comprises a preparation phase and three primary stages, namely, exploration, integration, and exploitation. The preparation phase involves the formation of a group of experts based on the number of models and iterations required. Each stage of the optimization process has a distinct function. Additional solutions are identified within the search space during the exploration phase. Linking these new solutions and pre-existing solutions constitutes the integration step. Identifying the best solution within the search space is the ultimate objective of the exploitation phase. The capacity of ILA optimization for individually monitoring the exploration and exploitation phases provides users control over the algorithm’s performance and the flexibility to modify the parameters as necessary. This is one of the significant advantages of optimization. Moreover, unlike other optimization methods, the ILA is renowned for its efficiency in identifying the best solutions while ensuring rapid computation. All of these processes are independent of characteristics. No reversal is permitted for any solution after passage through the earlier stages of the upcoming iterations. Figure 1 shows the various phases of the ILA.
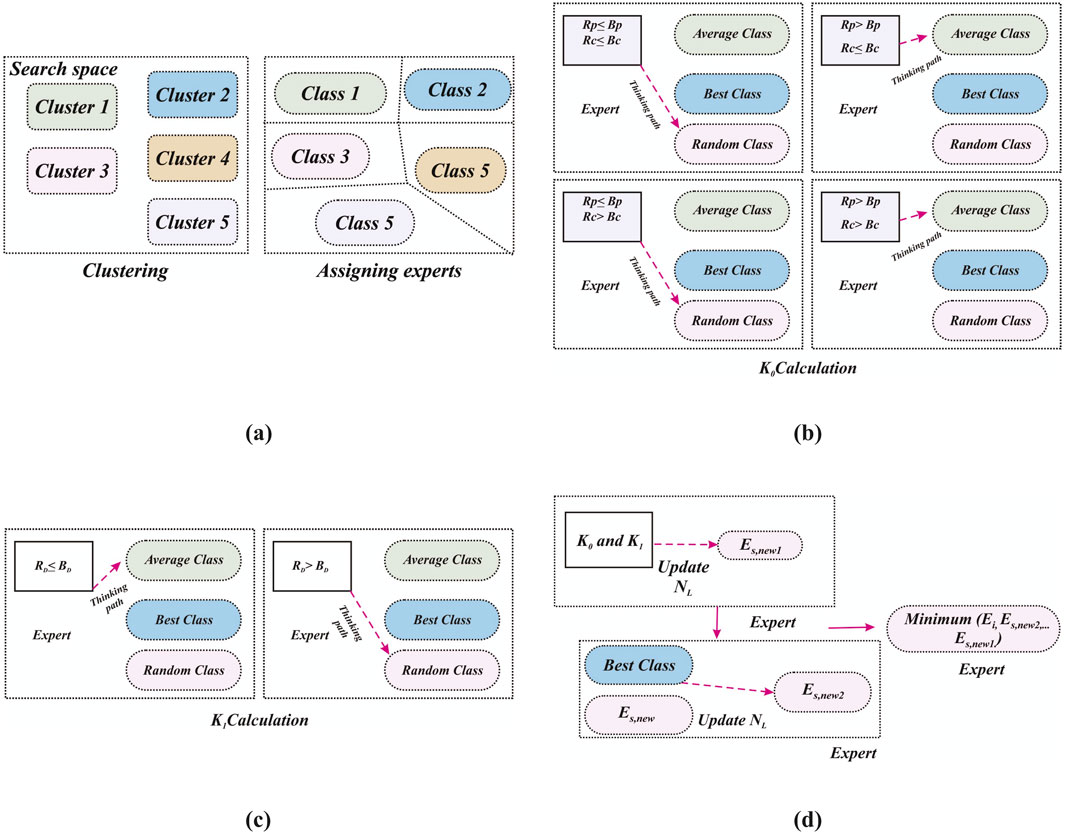
Figure 1. (A) Clustering and grouping of experts, (B) K0 calculation and class selection, (C) K1 calculation and class selection, and (D) final NL computation on knowledge.
4.1.2.1 Phase I—preparation
After setting the starting values of ILA parameters, the number of iterations for each model (nm) is represented as tm. Meanwhile, the total number of iterations is represented as NT, and the number of iterations for the first stage is represented as nt1.
The final observations of each model are forwarded to the next model for further optimization. This process continues until all the models are optimized. The process is then transferred to the next phase.
Before commencing the first stage, a class of experts is formed. Each class is responsible for a topic.
Here, the experts aim to identify the future logic of the topic in the search space provided. The number of classes
4.1.2.2 Phase II—optimization
This phase includes three stages, namely, grouping, integration, and ILA logic search.
4.1.2.2.1 Stage-1 grouping
In this step, each class focuses on every feasible option in the solution space to identify the optimal NL. Prior to each iteration, three primary characteristics are defined. The current iteration logic (L) is the expert (Ei) that had the highest NL value from the previous iteration (Ei,p) across all the classes. The second factor is the class’s best expert EI,g. The third factor is the average of all the experts (Es) denoted as Ag, achieved by each group in the previous iteration.
The following equations from Equation 12 to Equation 14 provide the expressions for comprehensibility, degree, and probability of any ith expert Ei.
where g = 1,2,3, … ng, m.
The following equations from Equation 15 to Equation 17 are the ratios of comprehensibility, degree, and probability. These are updated at the initiation of each iteration.
where I = 1,2,3, … …
The first task is to update new knowledge K0,i,s1 and K1,i,s1. In each stage, the parameters Bp, Bc, and BD are selected randomly between Bmin and Bmax. If Ei is closer to the logic of the present iteration, it can be considered in the computations. This is because it may improve in the subsequent iterations. The knowledge of each expert should be updated according to the ratio, randomness, average value, and iterative value as specified in equations from Equation 18 to Equatio 23. Thus, the best solution can be achieved.
The overall updated knowledge can be expressed by Equation 24,
A further update in the expert value is given as
The best value is provided by
In this stage, the updated value is examined using all the previous values, and the expert retains the position with superior value of fitness.
4.1.2.2.2 Stage-2 integration
In this stage, all the experts are combined, and the knowledge provided in the current iteration is used to increase NL. Initially, all the ratios Rc and RDare computed. Then, RP is calculated using the newly updated value of Pi.
The new knowledge updating process for experts is given by Equations 25–31 for K0,s2 and Ks2, as follows:
When the target is the minimum value of the fitness function, the final
4.1.2.2.3 Stage-3 ILA logic search
The proposed strategy focuses on improving the knowledge of each expert by using the average aggregate knowledge of all the experts. It then updates the knowledge of each expert. The method is repeated until the convergence criteria are met. Before entering the next stage, the average value of the knowledge from the previous stage must be computed. These are provided from Equation 36 to Equation 41.
The ILA is different from conventional algorithms as it has a greater number of tuning parameters. The increased number of optimization phases, including all the stages with their tuning parameters, makes ILA a more controllable and faster-converging algorithm. It is also true that the major asset of the method is its main challenge. The large number of tuning parameters makes the method finely configurable, but achieving that fine configuration is an arduous task.
4.1.3 Process of the ILA for placing DGs in the RDS
The procedure for the implementation of the ILA for the placing of DG in the RDS is as follows:
1. Initialize with the basic parameters, such as the number of buses, base voltage and kVA, minimum DG size, maximum DG size, Vmin and Vmax, initial population, and number of iterations.
2. Apply the backward–forward sweep load flow method for the base case.
3. Form the BIBC-BCBV matrices and the DLF matrix.
4. The base case power losses and the bus voltage values are thus obtained.
5. Select the number of DGs to be placed (in this study, numbers could be 3, 5, or 7).
6. Identify the capacity of DGs using the ILA process.
7. Run the load flow process with the DG size selected, and check for the reduction in losses by placing the DG on suitable locations.
8. If yes, save the size for a particular bus.
9. If no, go to step 6 and repeat the cycle until the convergence is met.
10. The line losses are given as
PG = (dg_value (ind)) and QG = PG*pfdata.
11. The reduction in power losses is calculated as
delPLdg = PDGTloss/PTloss.
12. The voltage index is given as
delvd = max ((v1-finalvoltage)/v1).
13. The reduction in operating cost is expressed as
deltoc = TOC/(c2*PDGmax).
14. The complete objective function is expressed as
final_objective = alpha1*delPLdg + alpha2*delvd + alpha3*deltoc.
15. Display the output.
5 Simulation and results
The proposed technique was tested on four IEEE standard test bus system (i.e., IEEE-16, IEEE-33, IEEE-69, and IEEE-118 bus radial distribution systems) to determine its efficiency on various load types and identify the optimal location of multiple DGs to minimize the objective function (which includes the minimization of the active power losses, voltage deviation index, and operational costs). MATLAB code was developed for the ILA and executed on an Intel® Core™ i7-7700 CPU @ 3.60 GHz desktop installed with 8 GB RAM. The performance of the algorithm is examined over 30 consecutive trials for each dataset, and the best minimum (in case of the power loss and the cost) and maximum (in case of the bus voltage) values are considered. The weighting factors in the objective function were set as α = 0.5, β = 0.4, and γ = 0.1. The cost coefficients x and y were considered 4 USD/kW and 5 USD/kW, respectively. y is generally maintained on the higher side, owing to the maintenance and installation costs of the DGs.
The performance of the ILA method depends on the selection of various input values. The number of iterations and initial population (number of experts) were set to 20 and 50, respectively. Five models were considered. Bmin and Bmax were set to 0.4 and 0.6, respectively. The maximum iteration percentage required for stages 1 and 2 is 33% each. The replication value for clustering (ηrep) was 10. The number of trials to converge the class in ηrep replication is considered 100. The values for ILA coefficients considered c1 were randomly selected from the range between 0 and 1, c2 was randomly chosen between −1.5 and 1.5, c3 was randomly chosen between −1.5 and 1.5, c4 and c5 were selected randomly between 0 and 1, c6 was selected between −0.75 and 0.75, c7 was randomly chosen between −0.75 and 0.75, c8 is randomly selected between 0 and 1, c9 is a random vector selected from −0.25 and 0.25, c10 was randomly chosen between −0.25 and 0.25, and c11 was randomly chosen between 0 and 1.
The efficacy of the proposed approach was tested on various load types, such as constant power (CP) at light load (0.5), full load (1.0), heavy load (1.6), constant current (CC), and constant impedance (CI) loads. Two types of DGs were considered in this study: T-I (injects active power at unity power factor) and T-III (capable of feeding real and imaginary powers at a power factor of 0.866).
5.1 IEEE 16-bus system
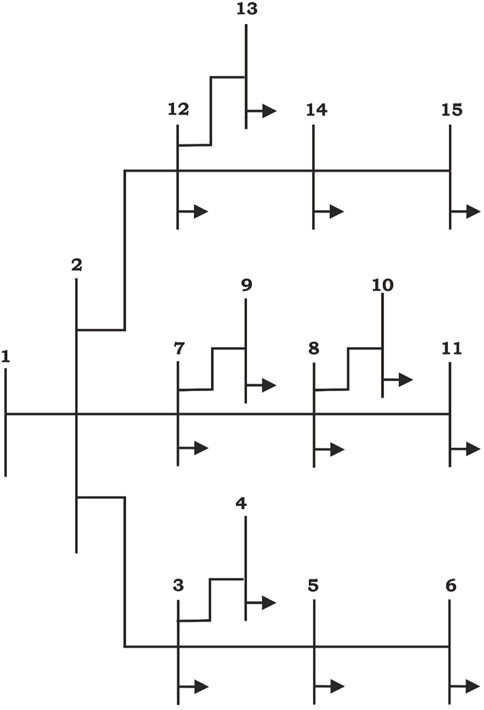
Initially, to test the operation of the ILA optimization technique, a small standard test system with 16 buses was considered. The initial version of this system had 16 buses, 3 feeders, and 13 branches. However, according to Aman et al. (2014), the earlier version was modified into the single feeder, 15-bus radial network shown in Figure 2. The bus and line data were obtained from Aman et al. (2014). The base values, load values, and losses for the 16-bus system were VBASE = 12.66 kV, BASE = 100 MVA, PLOAD = 28,700 kW, QLOAD = 5,900 kVAr, Ploss = 511.40 kW, and Qloss = 590.37 kVAr. The voltage limit at all the buses was set within 0.95–1.05 p.u. The real power loss without DG inclusion was 511.43 kW, and the reactive power loss was 590.3668 kVAr. According to Behera et al. (2015), a 50% penetration of DG was considered. The base case load flow proposed by Singh and Bala (2015), without DG integration, was run. Then, DG was added to the buses.
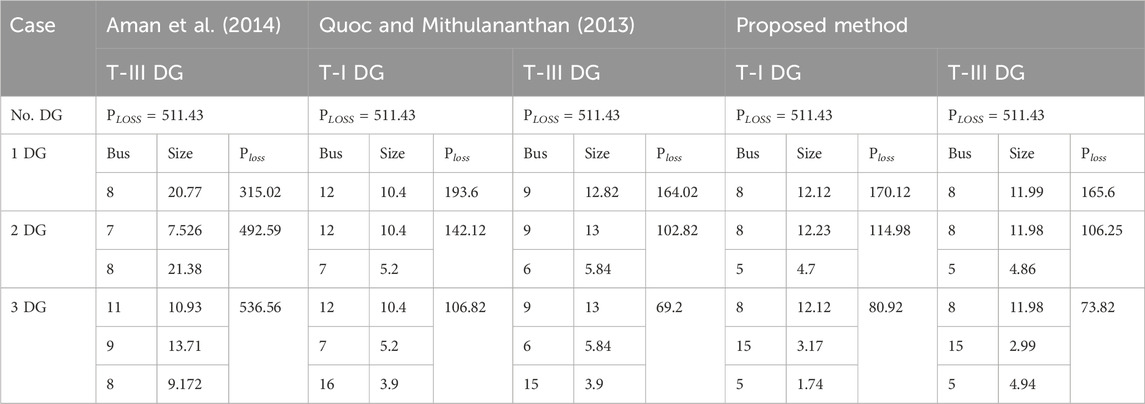
First, the T-I DG was implemented for all types of load models. The results shown in Table 1 were found effective. Three numbers of both types of DGs, i.e., T-I and T-III were connected to the system to obtain optimum outcomes. In Table 2, these results are compared with those of previous studies conducted by Aman et al. (2014) and Quoc and Mithulananthan (2013). Compared with the results of Aman et al. (2014), which reported a loss of 536.56 kW, the proposed method displayed a remarkable loss reduction of 73.82 kW with the integration of T-III. Similarly, with the integration of T-I DG, the proposed method obtained 80.92 kW, unlike the 106.82 kW reported by Quoc and Mithulananthan (2013). Figure 3 depicts the voltage profile and convergence characteristics of both types of DGs. With no DG integrated into the system, the minimum and maximum reported voltages are 0.969 p.u. at bus 11 and 1.00 p.u. at bus 1, respectively. However, with the insertion of three T-I DGs into the network, the voltage improved by 0.991 p.u. at bus 9 and 1.00 p.u. at bus 1. Meanwhile, with the installation of three T-III DGs, the voltage limit ranged between 0.993 p.u. at bus 4 and 1.0001 p.u. at bus 8.
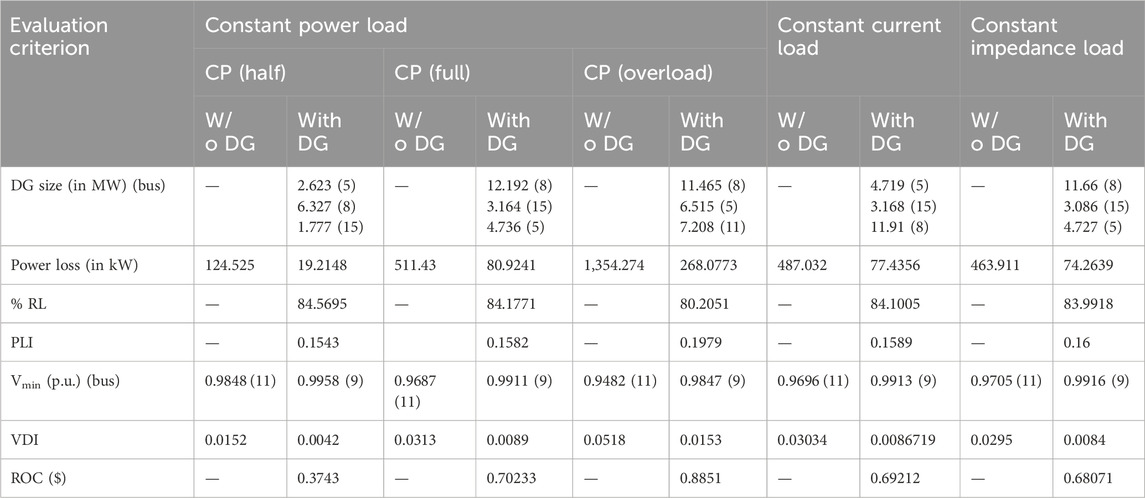
Table 1. Performance evaluation of the IEEE 16-bus system for various load models using the IbI logic algorithm.
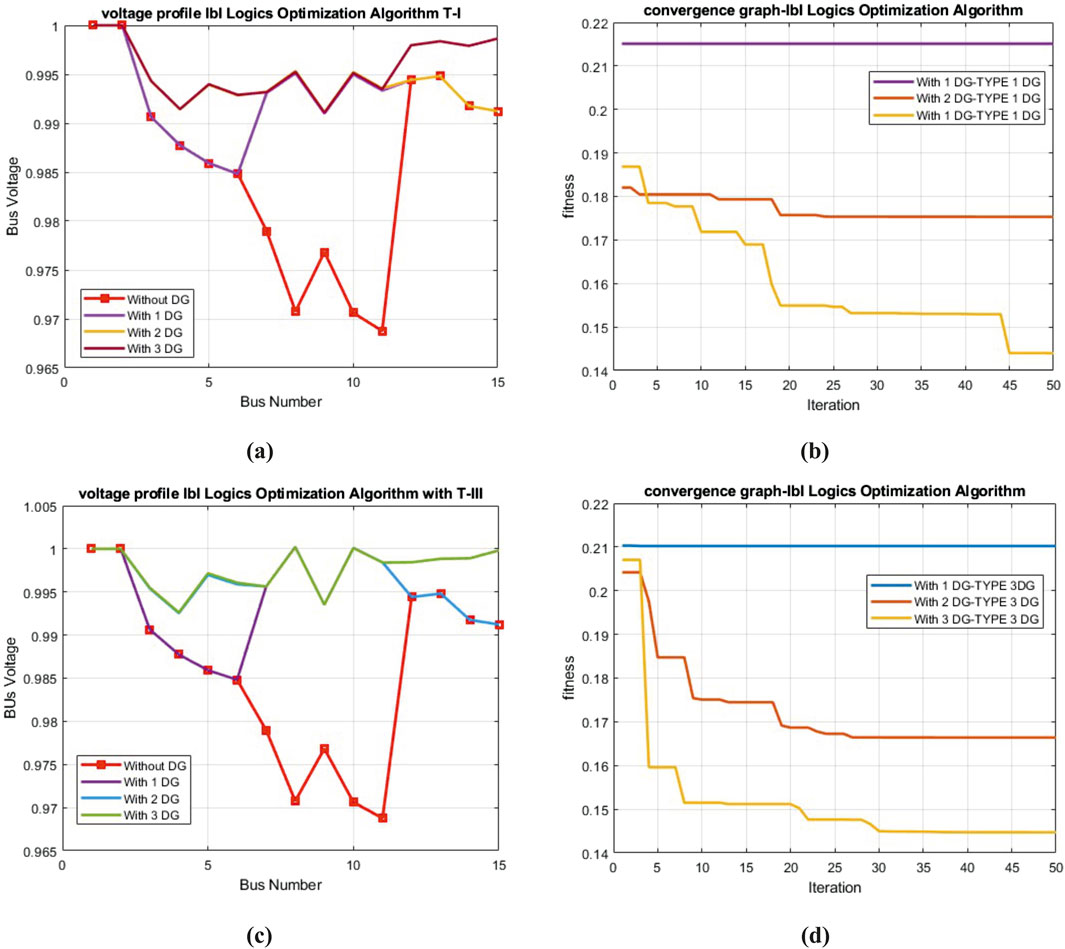
Figure 3. (A) Voltage profile of the 16-bus network with T-I DG. (B) Convergence graph for T-I DG. (C) Voltage profile of the 16-bus network with T-III DG. (D) Convergence graph for T-III DG.
5.2 IEEE 33-bus system
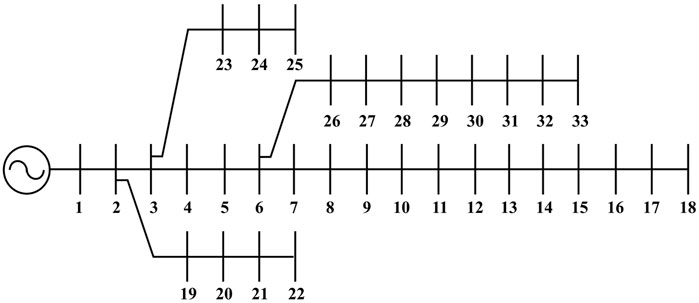
The second test system considered is a medium-sized radial network comprising 33 buses and 32 branches shown in Figure 4. It is completely radial in characteristic. The base values, load values, and losses for the 33-bus system were VBASE = 12.66 kV, SBASE = 100 MVA, PLOAD = 3,715 kW, QLOAD = 2,300 kVAr, Ploss = 202.67 kW, and Qloss = 135.14 kVAr. The bus and line data were obtained from Baran and Wu (1989a). The voltage limits at the buses were set between 0.95 and 1.05 p.u. The real and reactive power losses for this system were 202.67 kW and 135.141 kVAr, respectively. The detailed results for various load types are shown in Table 3. It includes DG capacity, power loss, percentage reduction in losses, power loss index, voltage deviation index, minimum bus voltage and its number, and operating cost.
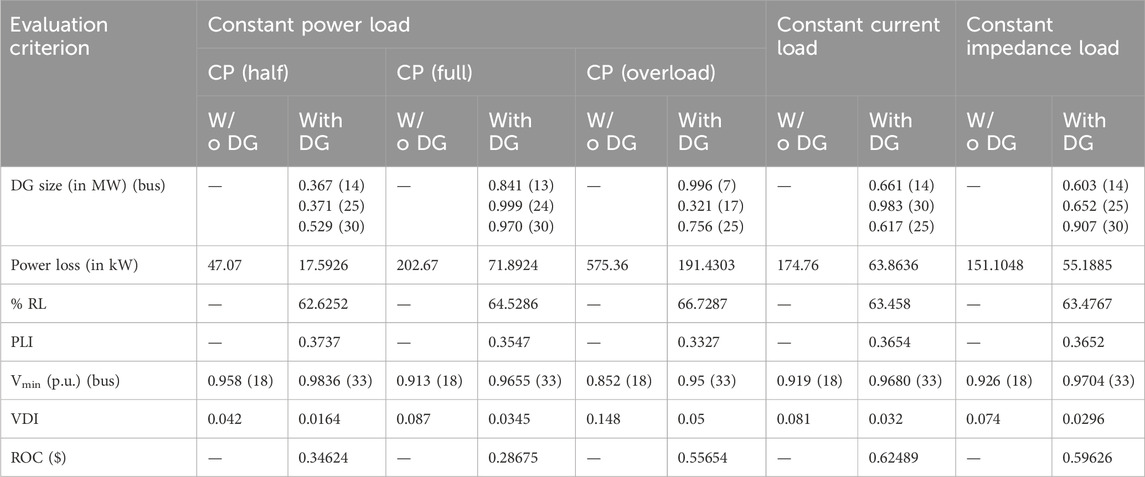
Table 3. Performance evaluation of the IEEE 33-bus system for various load models using the IbI logic algorithm.
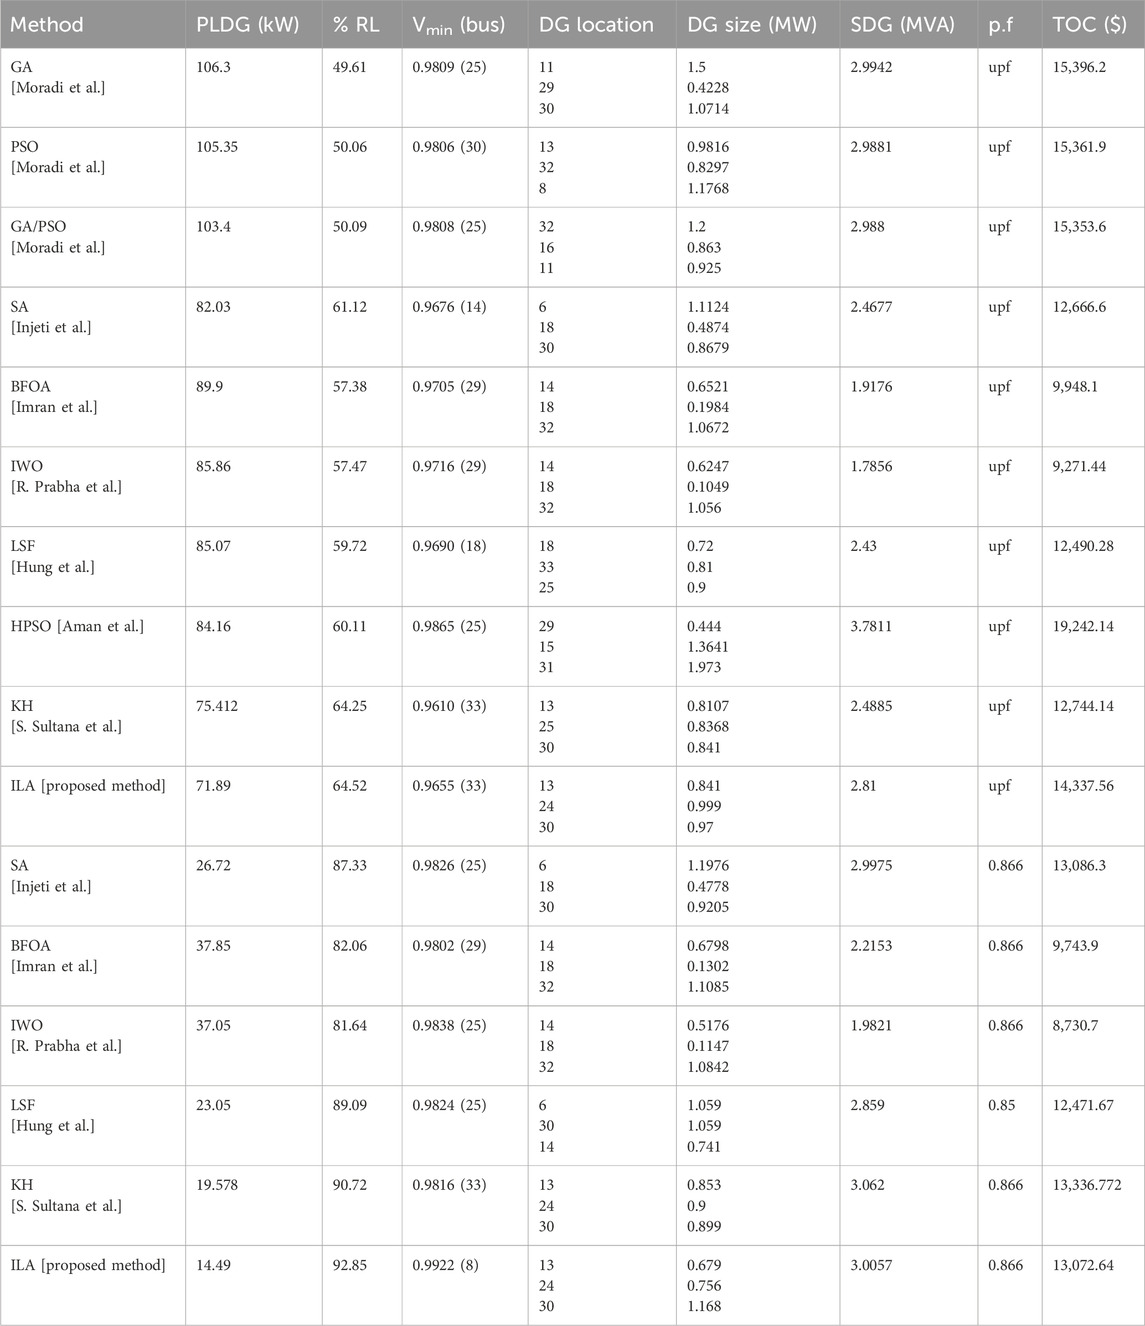
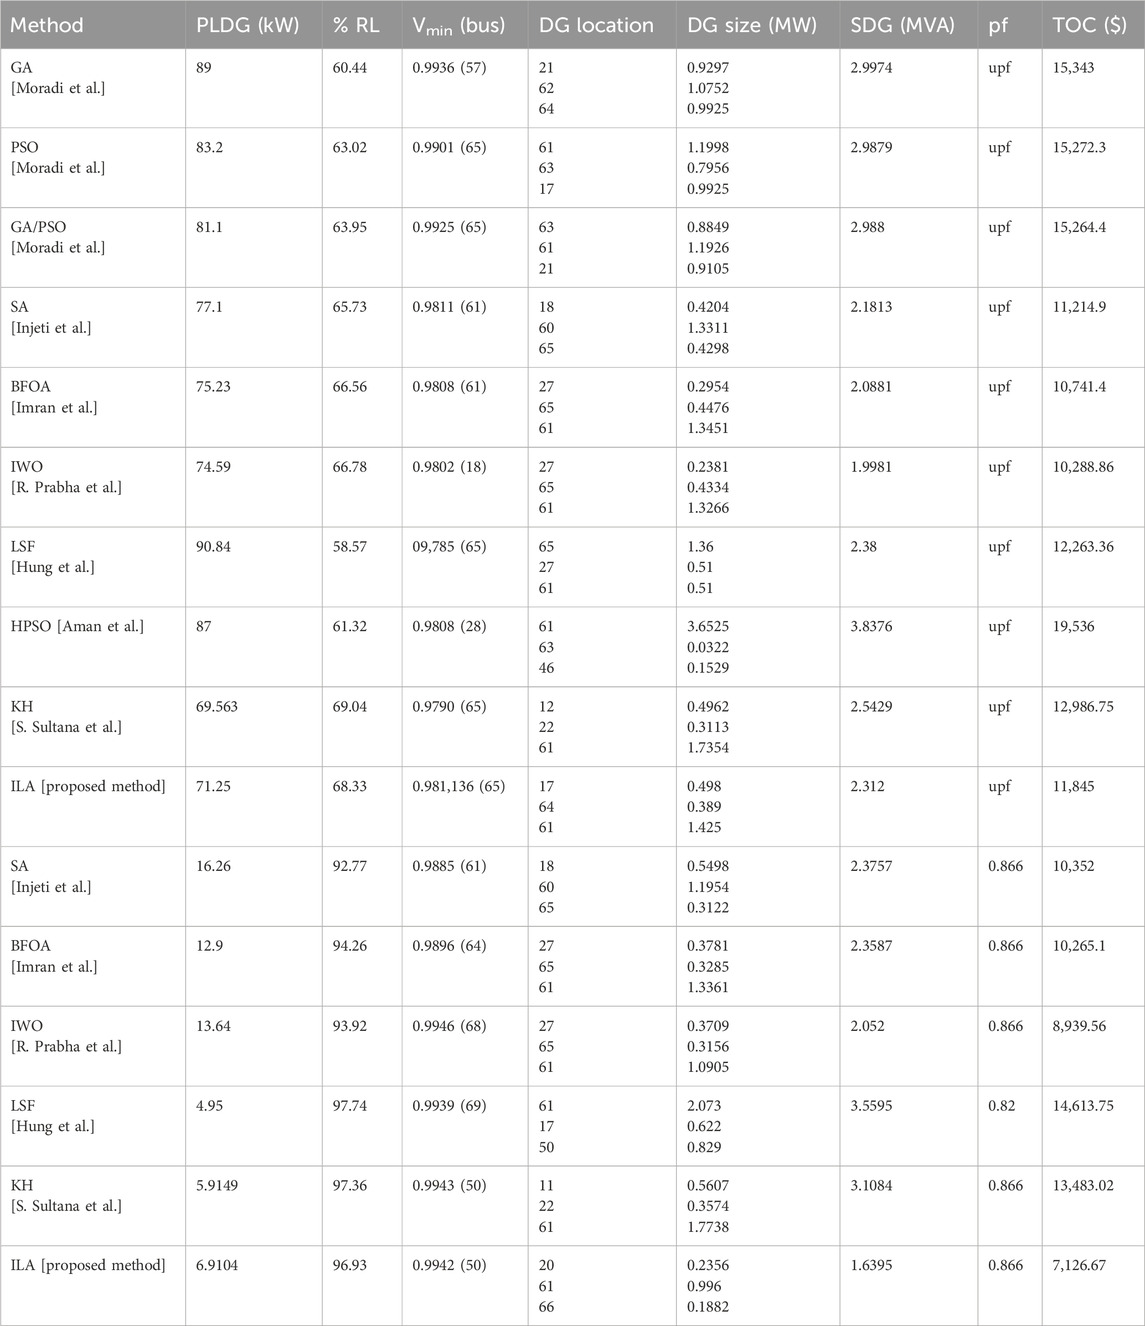
Three DGs were connected to achieve the objective function. The results are summarized in Table 4. These are observed to be better than those achieved by the previous works from many perspectives. The results are compared with those reported by Moradi and Abedini (2012), Kumar Injeti and Kumar (2013), Imran et al. (2014), Prabha and Jayabarathi (2016), Quoc and Mithulananthan (2013), Aman et al. (2014), and Sultana and Roy (2015). The power losses obtained with the integration of the type-I DG were 71.89 kW compared with previously reported losses. Similarly, for the type-III DG, the reported loss was 14.49 kW. It was significantly lower than those achieved in these works. The voltage profiles of the type-I and type-III DGs are shown in Figures 5A, C, respectively. The convergence characteristics of the objective function with respect to the number of iterations are shown in Figures 5B, D, respectively.
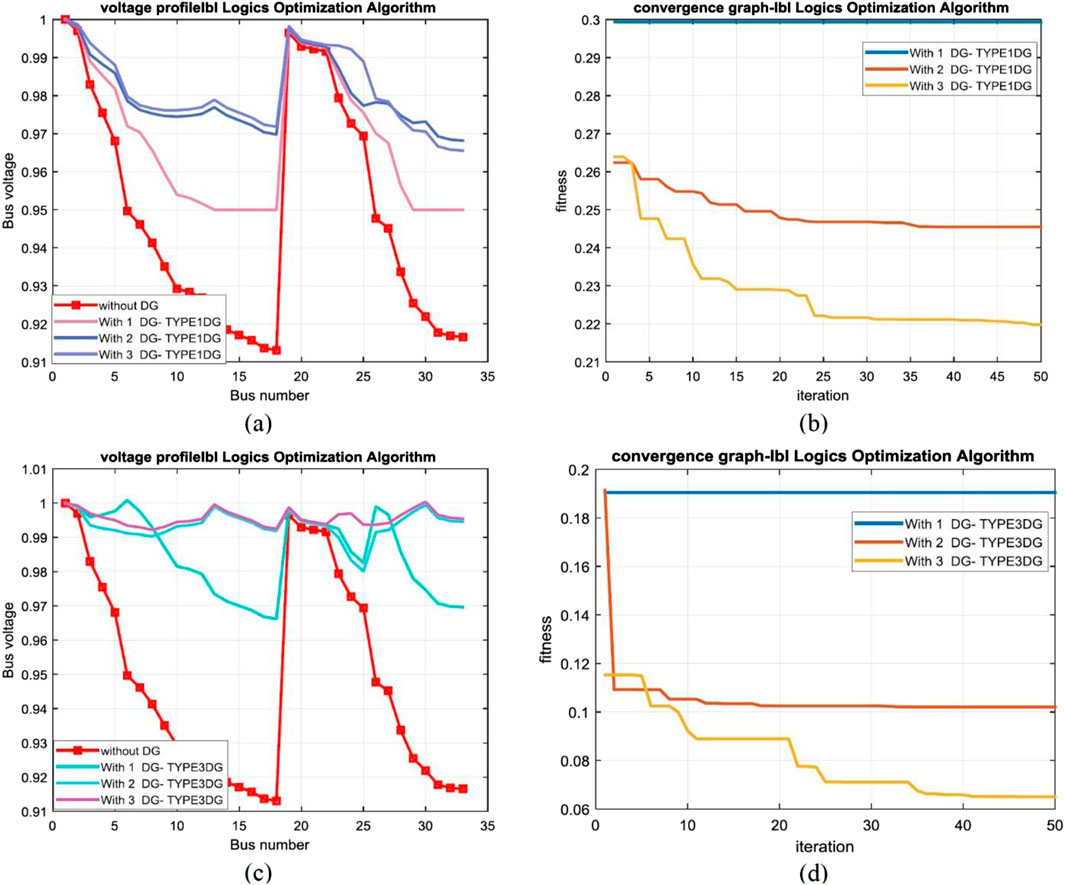
Figure 5. (A) Voltage profile of the 33-bus network with T-I DG. (B) Convergence graph for T-I DG. (C) Voltage profile of the 33-bus network with T-III DG. (D) Convergence graph for T-III DG.
5.2.1 IEEE 69-bus system
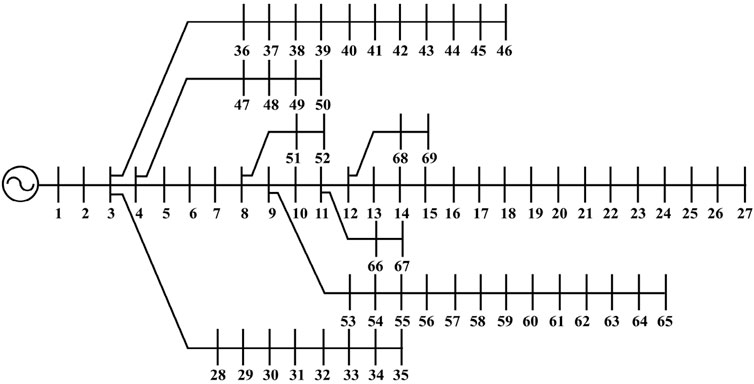
The next system considered was a large distribution network comprising 69 buses and 68 branches. The line and bus data were obtained from Baran and Wu (1989b). The single line representation is shown in Figure 6. The real and reactive power losses were 224.9606 kW and 102.147 kVAr, respectively. The base voltage was 12.66 kV. The load on the system was set to 3,802.1 kW. The base power was 100 MVA. The voltage constraints were set between 0.95 and 1.05 p. u. The maximum permissible limit for DG penetration was set to 50%. Three DGs of type-I and type-III were connected in the system. The load flow was performed for all the load models. The results are reported in Table 5. This network involved a convergence criteria issue. Therefore, the number of iterations was increased to 100 instead of 50. Therefore, good results were obtained, compared with those reported by Moradi and Abedini (2012), Kumar Injeti and Kumar (2013), Imran et al. (2014), Prabha and Jayabarathi (2016), Quoc and Mithulananthan (2013), Aman et al. (2014), and Sultana and Roy (2015), as shown in Table 6.
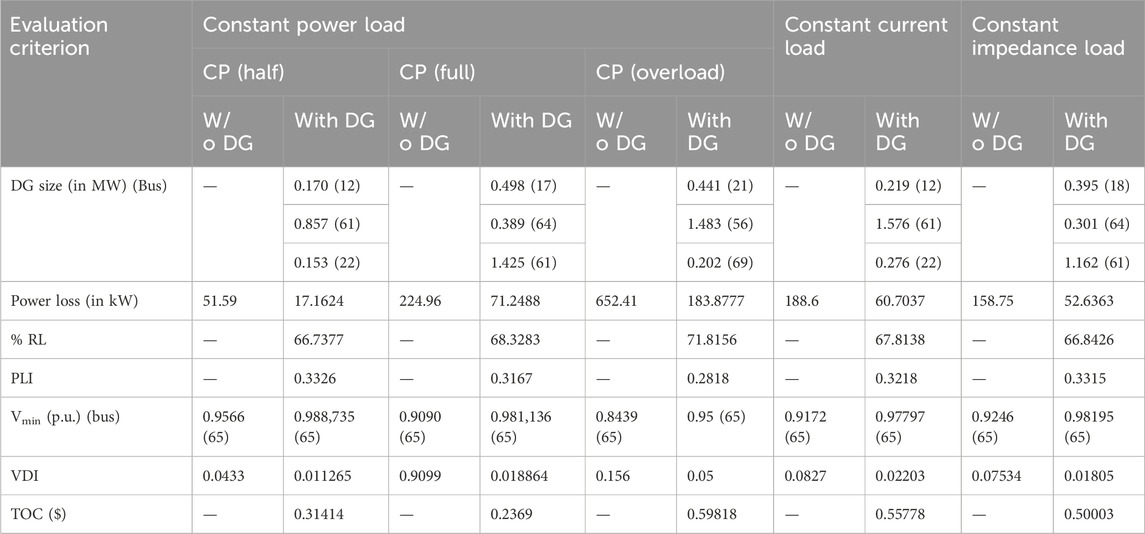
Table 5. Performance evaluation of the IEEE 69-bus system for various load models using the IbI logic algorithm.
The computed loss with the implementation of type-I DG was 71.25 kW using this method. This value is better than 89.0 kW obtained by the GA, 83.2 kW by PSO, and 81.1 kW by GA/PSO, as reported by Moradi and Abedini (2012). The value also shows the significance of this method compared to those of Kumar Injeti and Kumar (2013), Imran et al. (2014), Prabha and Jayabarathi (2016), Quoc and Mithulananthan (2013), and Aman et al. (2014). However, it is less effective compared to the results by Sultana and Roy (2015). Although the loss reduction by the ILA is not superior to that achieved by the KH method, the TOC is much significantly lower for the ILA method than that for the KH method. This is because the overall rating of the connected DG was less than that for the KH method.
Similarly, when the type-III DGs were optimally connected to the system using the IbI logic algorithm method, the results obtained were better than those achieved using the SA, BFOA, and IWO techniques. This is evident in Table 6. The losses were reduced less by the ILA than by the Loss Sensitivity Factor (LSF) and Krill Herd (KH) methods. However, the overall connected size of the DG was significantly smaller than those of these two superior methods. Hence, the total operating cost was significantly lower in the ILA method. The voltage profiles for type-I and type-III DGs for the 69-bus system are shown in Figures 7A, C, respectively. Meanwhile, the convergence of the objective function is shown in Figures 7B, D.
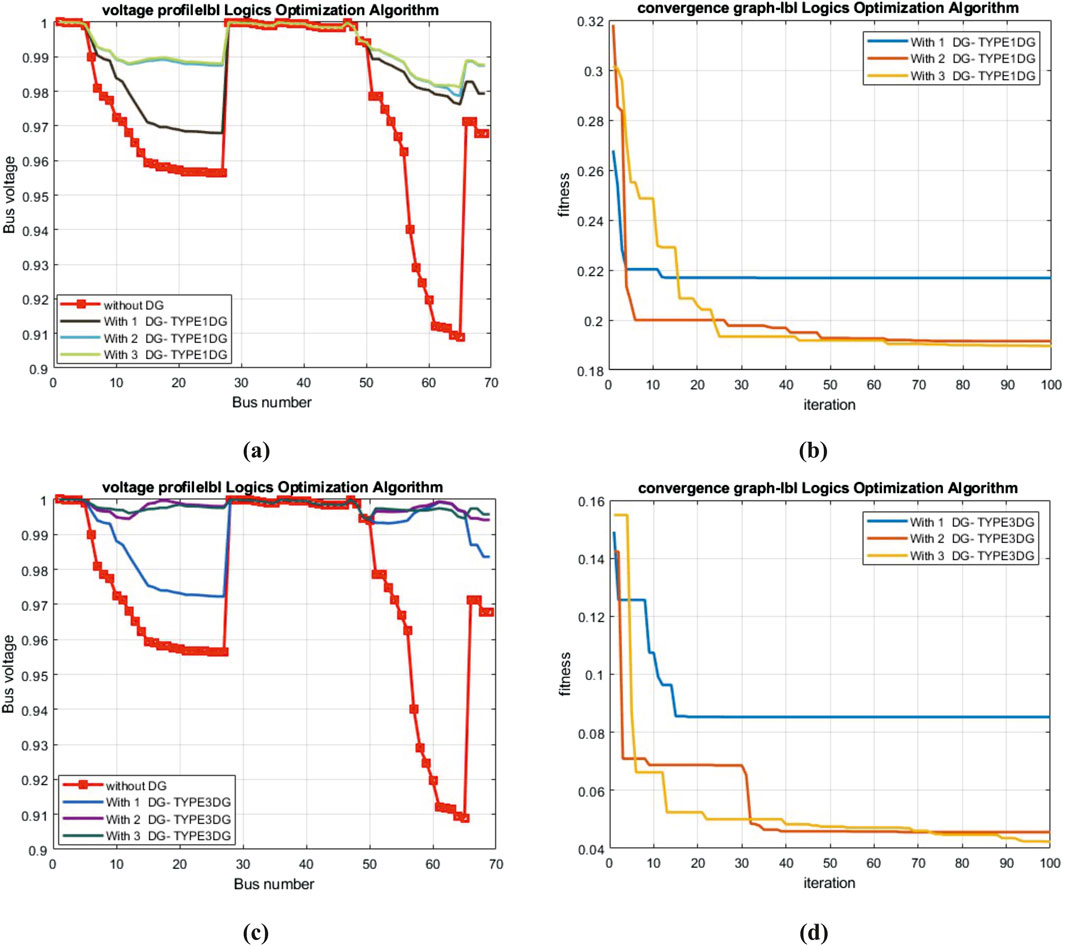
Figure 7. (A) Voltage profile of the 69-bus network with T-I DG. (B) Convergence graph for T-I DG. (C) Voltage profile of the 69-bus network with T-III DG. (D) Convergence graph for T-III DG.
5.3 IEEE 118-bus system
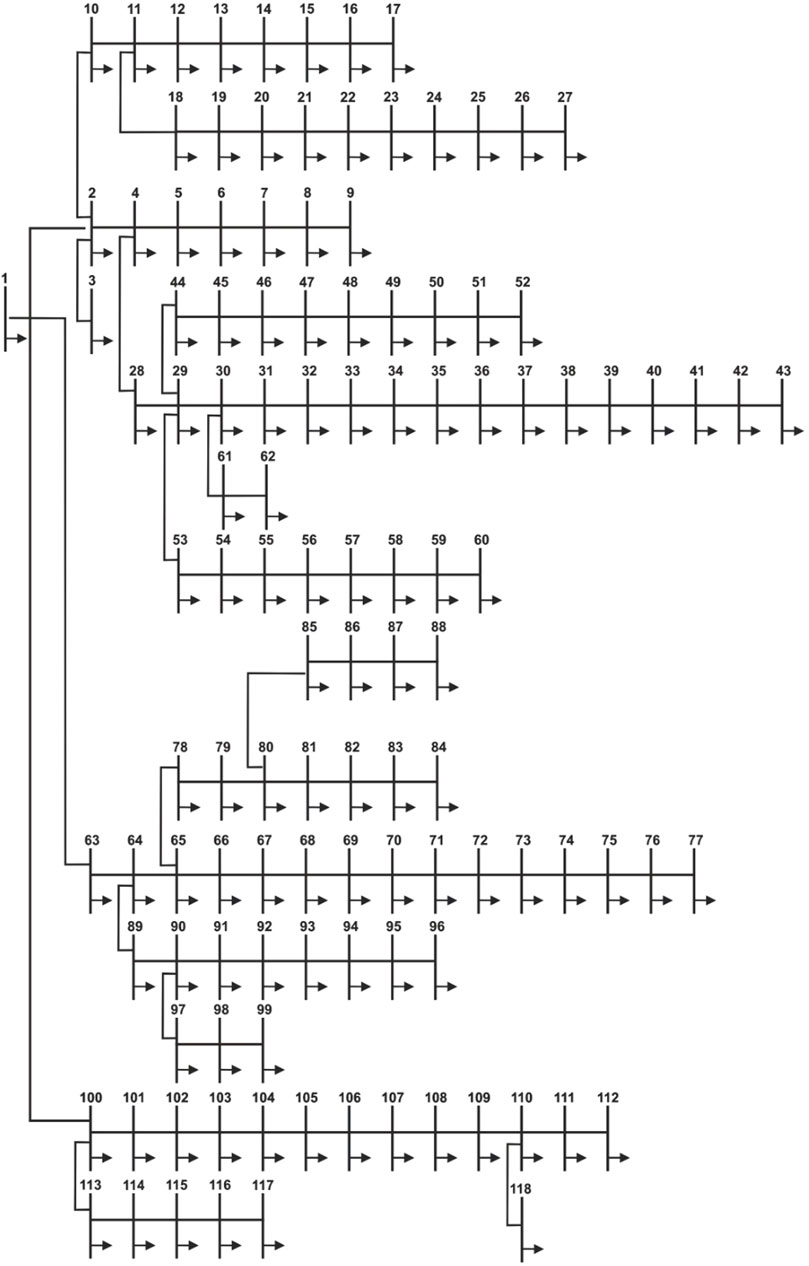
The ILA was tested on a 118-bus system shown in Figure 8 to demonstrate its optimal performance for a very large-scale distribution of networks. The base values, load values, and losses for the 118-bus system were VBASE = 11 kV, SBASE = 100 MVA, PLOAD = 22,709.72 kW, QLOAD = 17,041.06 kVAr, Ploss = 1,298.09 kW, and Qloss = 978.73 kVAr referred by Sultana and Roy (2015). The 118-bus radial distribution networks required seven DGs. However, the established approach was adaptable to any number. Meanwhile, the number of DG units in a test system depends on their size. However, introducing many DG units into a system can cause increased power losses. In this study, two cases were formulated for analyzing the impact of integrating five and seven DG units into the system. Both cases were tested for different load models.
5.3.1 Case 1: IEEE 118-bus system with five DGs
The real and reactive power losses for this network are 1,298.09 kW and 978.73 kVAr. The reported real power loss is 576.239 kW with the integration of type-I DG. This value is close to that reported by Sultana and Roy (2015) and significantly less than that obtained by Kumar Injeti and Kumar (2013). In addition, the TOC obtained is lower because the connected size was less.
Similarly, compared with the results of Kumar Injeti and Kumar (2013), the power loss is improved by 381.1619 kW, and 6.224 MVA less power was required to connect. The performance evaluation and comparative analysis for 118-bus system with five DGs are given in Tables 7, 8 respectively. This reduced the operating cost. The voltage profiles and convergence characteristics for type-I and type-III are shown in Figure 9.
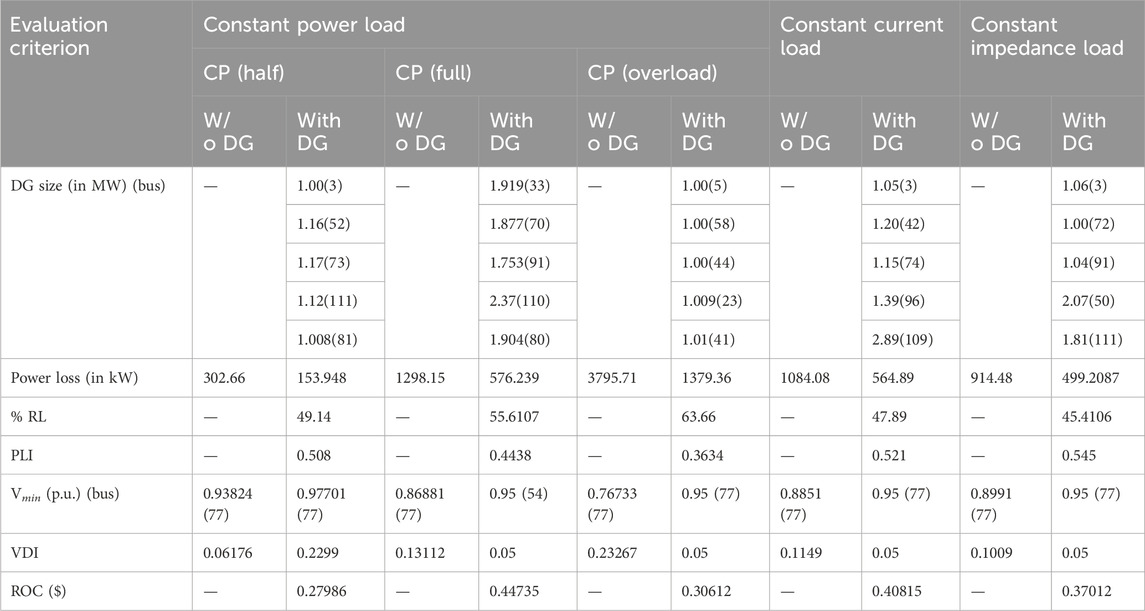
Table 7. Performance evaluation of the IEEE 118 bus system with five DGs for various load models using IbI Logic algorithm.
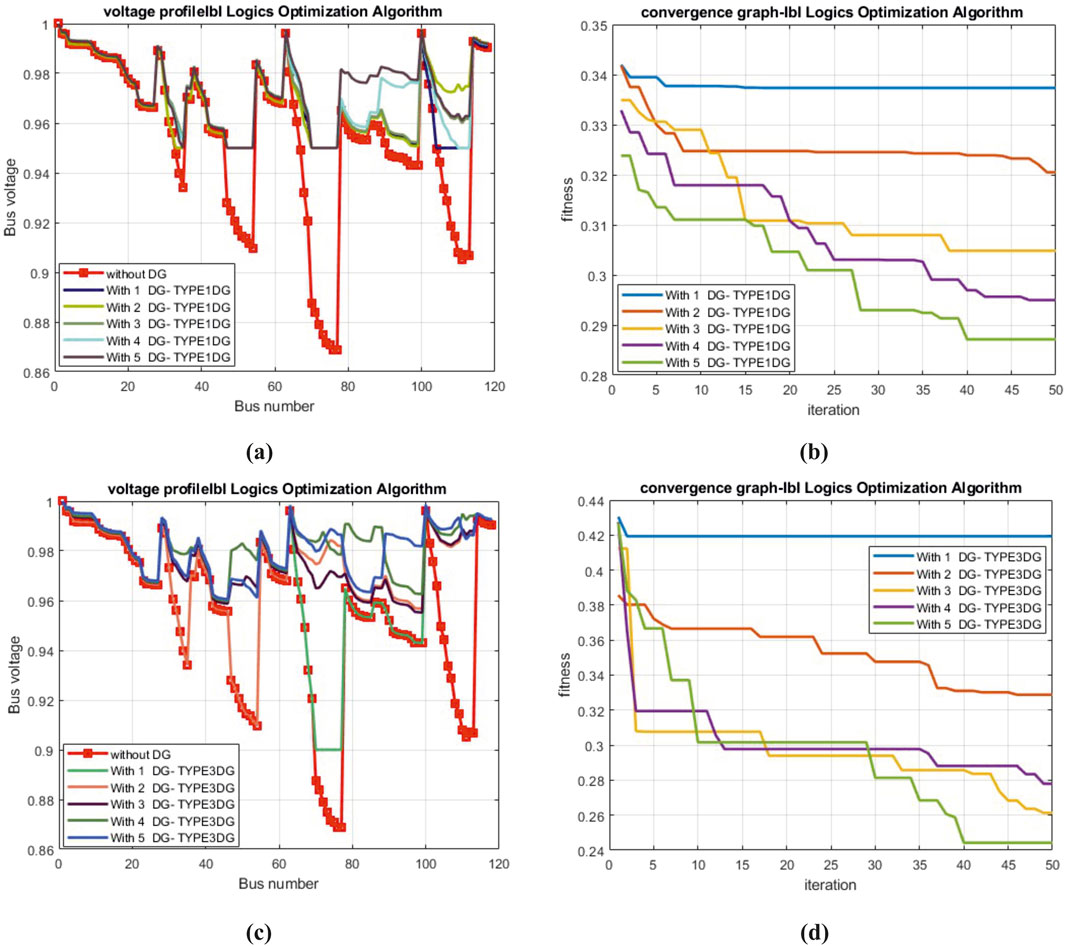
Figure 9. (A) Voltage profile of the 118-bus network with five T-I DGs. (B) Convergence graph for T-I DG. (C) Voltage profile of the 118-bus network with five T-III DGs. (D) Convergence graph for T-III DG.
5.3.2 Case 2: IEEE 118-bus system with seven DGs
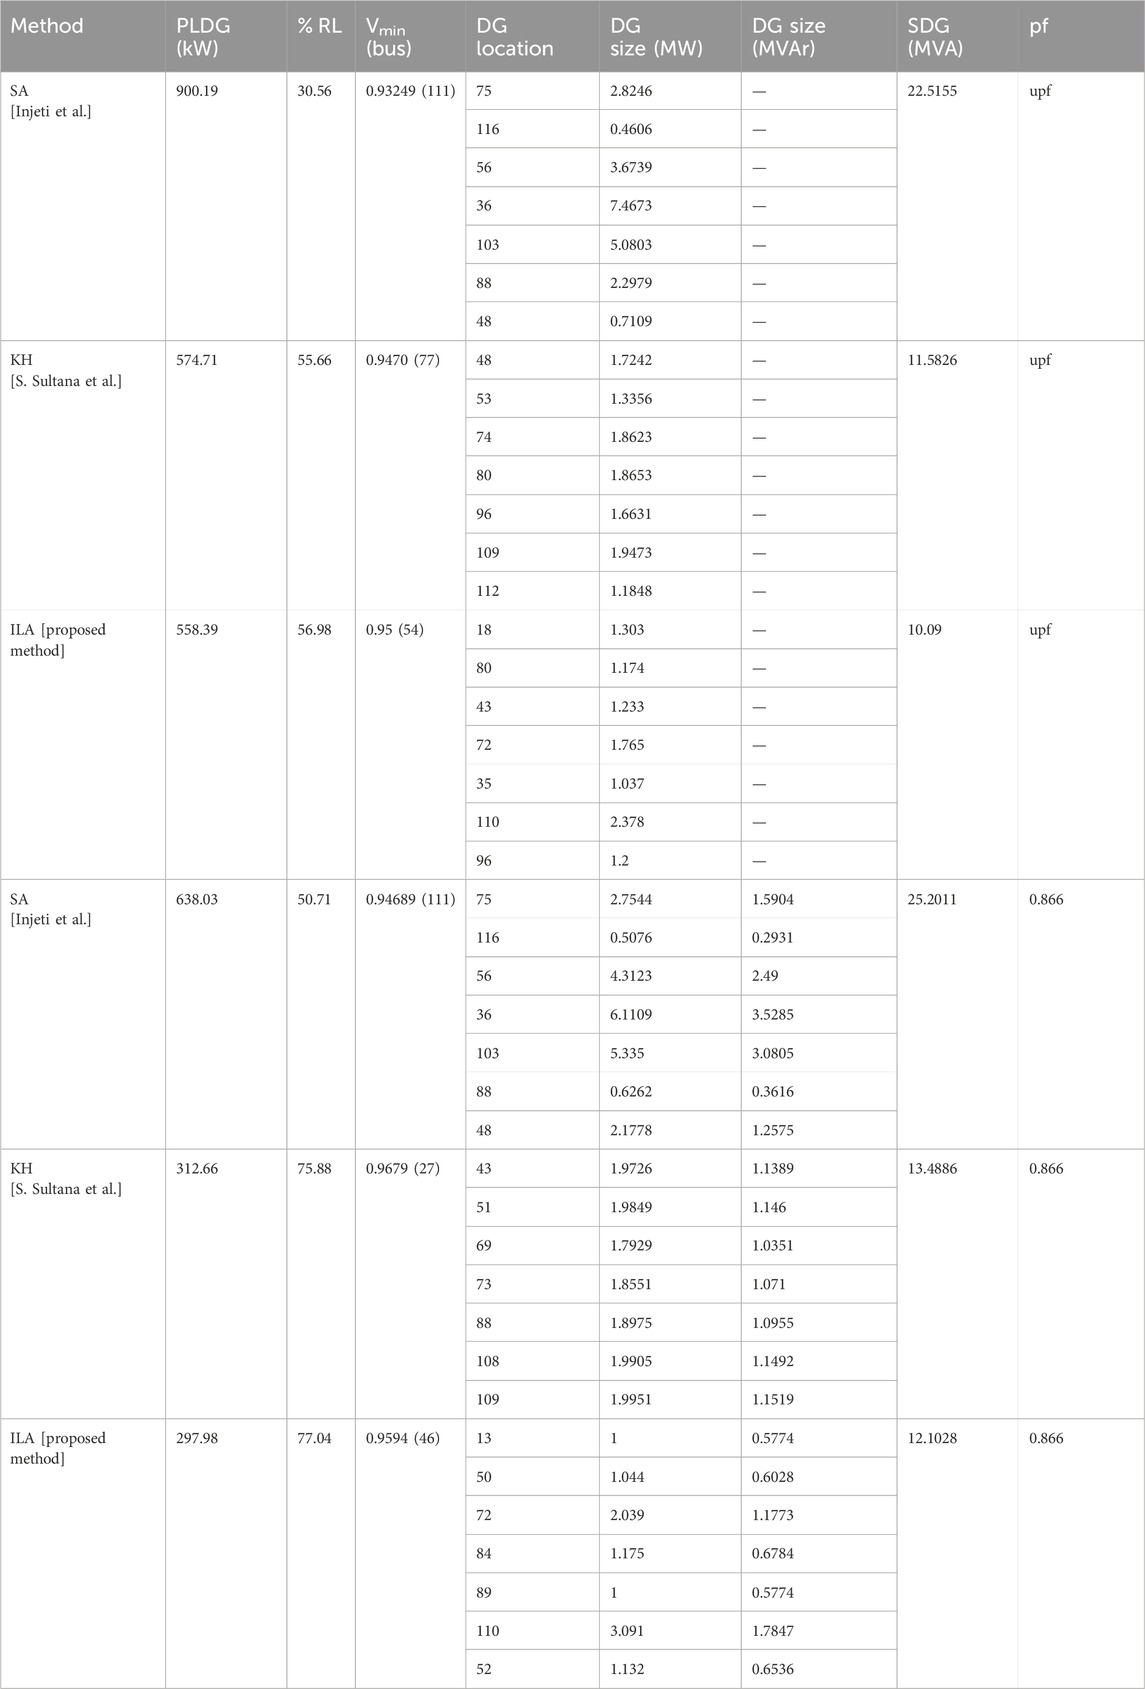
The optimal locations of the seven type-I DGs are located at bus numbers 18, 80, 43, 72, 35, 110, and 96; with a total capacity of 10.09 MVA, these DGs reduced the loss in the 118-bus system to 558.7097 kW. This was better than that achieved by kumar Injeti and Kumar (2013) and Sultana and Roy (2015). The type-III DG units, operating at 0.866 p. f., connected to bus numbers 13, 50, 72, 84, 89, 110, and 52 reduced the power loss to 297.9819 kW. In addition, the operating cost was lower than that in the two previous studies because the overall DG capacity connected in the ILA was 10.09 MVA for the T-I DG and 12.1028 MVA at 0.866 p. f. for the T-III DG. The performance evaluation and comparative analysis for 118-bus system with seven DGs are given in Tables 9, 10 respectively. The bus voltages have been drawn for all the DG conditions. The convergence characteristics of the objective function with respect to the iterations are shown in Figure 10.
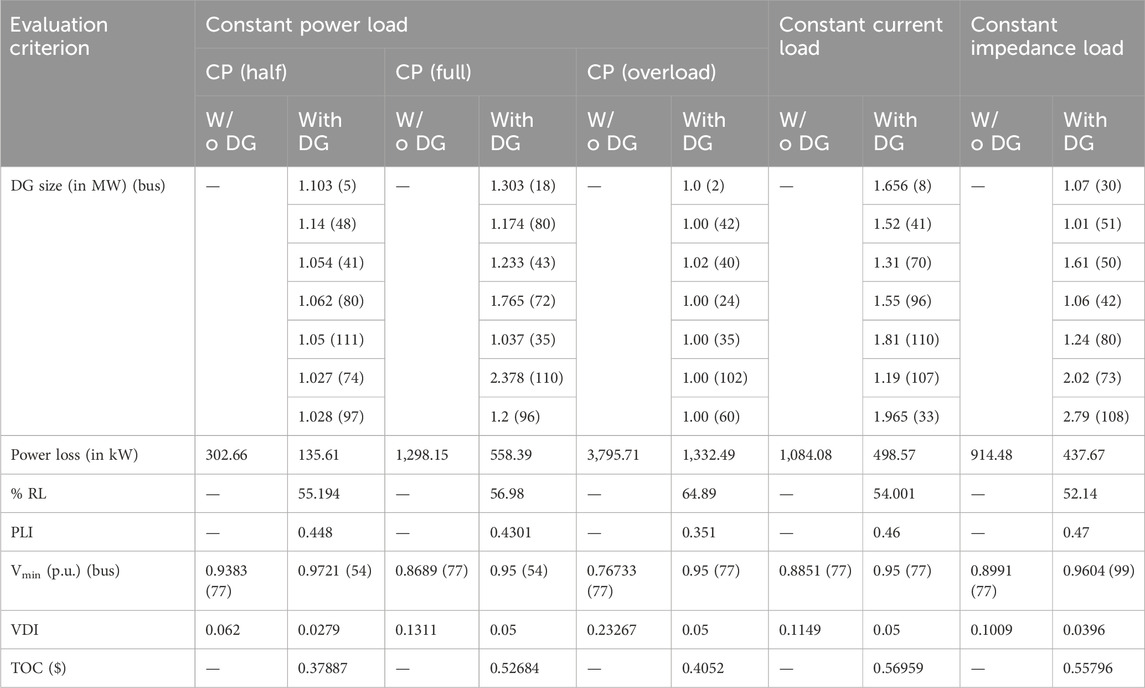
Table 9. Performance evaluation of the IEEE-118 bus system with seven DGs for various load models using IbI Logic algorithm.
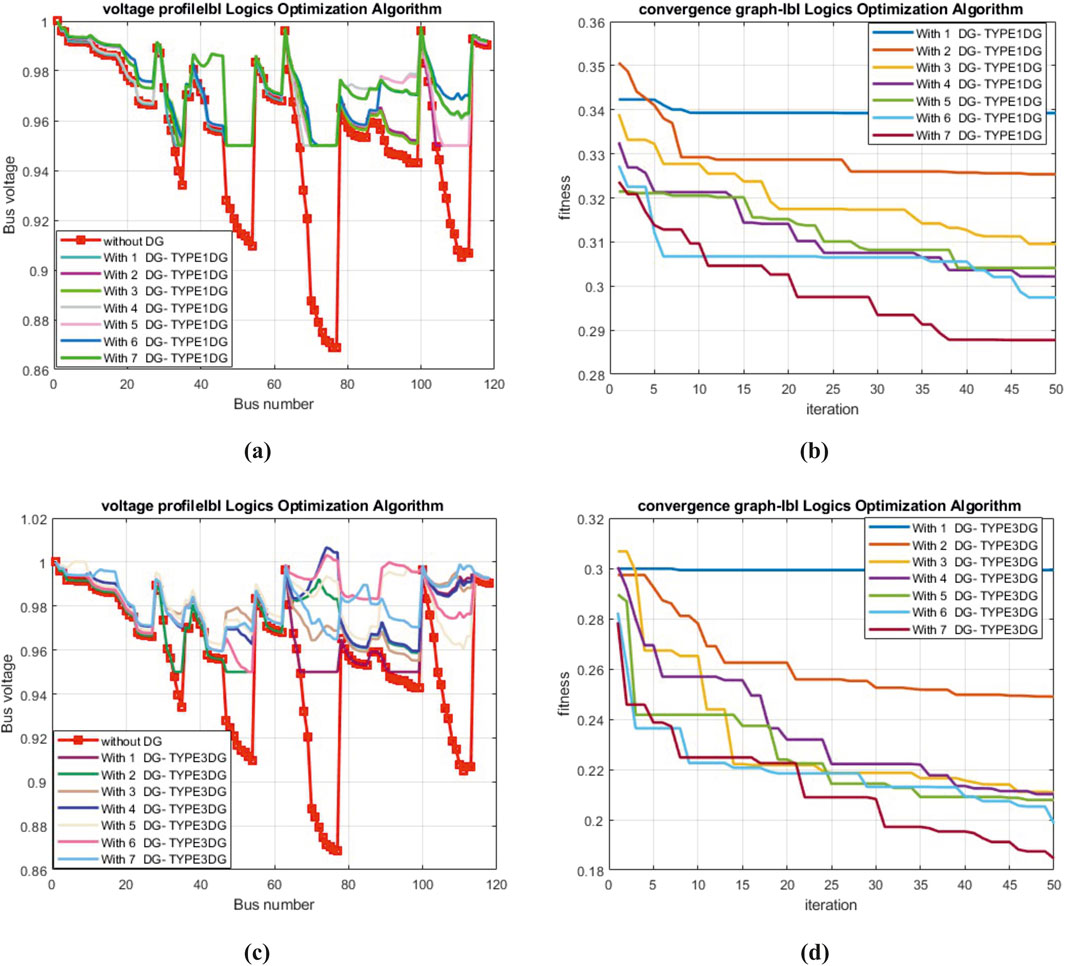
Figure 10. (A) Voltage profile of the 118-bus network with seven T-I DGs. (B) Convergence graph for T-I DG. (C) Voltage profile of the 118-bus network with seven T-III DGs. (D) Convergence graph for T-III DG.
The worst, best, average, median, and standard deviation values of bus voltages for test systems with the implementation of T-I and T-III into all the systems under study are given in Table 11.
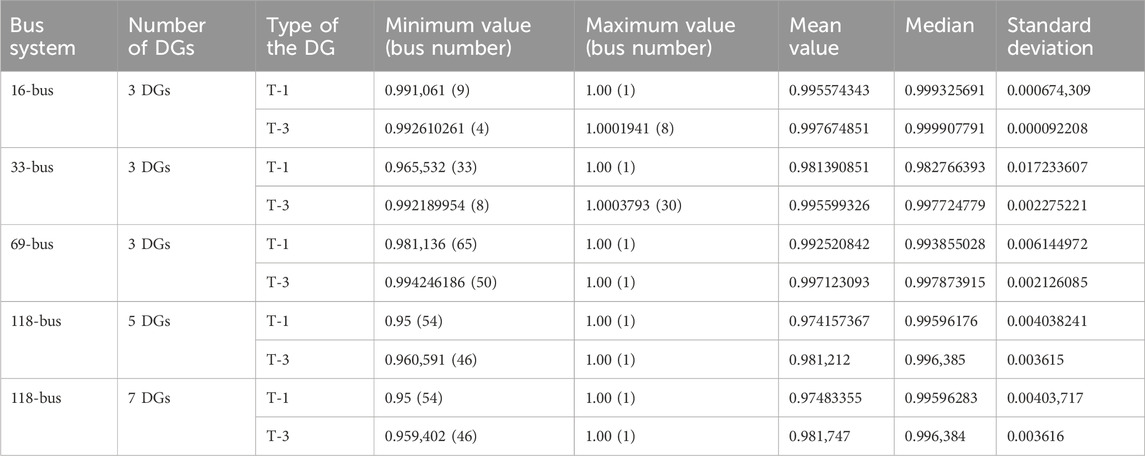
Table 11. The worst, best, average, median, and standard deviation values of bus voltages for test systems with the implementation of T-I and T-III into all the systems under study.
6 Conclusion
This study investigated the challenging mixed problem of placing and sizing DGs to minimize real power losses as the voltage profile increases. A novel ILA method was used, for the first time, to identify the optimal size and location of DGs. To demonstrate the validity and effectiveness of the proposed technique, it was tested on very small, small, medium, and large-scale distribution networks, and hence, it shows the capability to be tuned at every size of the distribution network Furthermore, its performance was compared with those achieved by previous published works. The recommended technique outperformed the existing algorithms in terms of single objective or as a whole, and the convergence characteristics of the objective function value. The analysis of different DG combinations to find the best possible solution to the problem, inclusion of the environmental objectives in problem formulation, and the analysis of DG performance with the 3 phase non-linear load could be the future scope for utilizing this algorithm.
Data availability statement
The original contributions presented in the study are included in the article/supplementary material; further inquiries can be directed to the corresponding author.
Author contributions
NS: Conceptualization, Data curation, Formal Analysis, Investigation, Methodology, Project administration, Resources, Software, Validation, Visualization, Writing–original draft, Writing–review and editing. MP: Supervision, Validation, Writing–review and editing. LS: Supervision, Writing–review and editing.
Funding
The author(s) declare that no financial support was received for the research, authorship, and/or publication of this article.
Conflict of interest
The authors declare that the research was conducted in the absence of any commercial or financial relationships that could be construed as a potential conflict of interest.
Publisher’s note
All claims expressed in this article are solely those of the authors and do not necessarily represent those of their affiliated organizations, or those of the publisher, the editors, and the reviewers. Any product that may be evaluated in this article, or claim that may be made by its manufacturer, is not guaranteed or endorsed by the publisher.
References
Abdi, S., and Afshar, K. (2013). Application of IPSO-Monte Carlo for optimal distributed generation allocation and sizing. Electr. Power Energy Syst. 44, 786–797. doi:10.1016/j.ijepes.2012.08.006
Acharya, N., Mahat, P., and Mithulananthan, N. (2006). An analytical approach for DG allocation in primary distribution network. Electr. Power Energy Syst. 28, 669–678. doi:10.1016/j.ijepes.2006.02.013
Ackermann, T., Andersson, G., and Soder, L. (2001). Distributed generation: a definition. Electr. Power Syst. Res. 57, 195–204. doi:10.1016/s0378-7796(01)00101-8
Ali, A. H., Youssef, A. R., George, T., and Kamel, S. (2018a). “Optimal DG allocation in distribution systems using Ant lion optimizer,” in 2018 International Conference on Innovative Trends in Computer Engineering (ITCE), Aswan, Egypt, February 19–21, 2018.
Ali, E. S., Elazim, S. M. A., Hakmi, S. H., and Mossad, M. I. (2023). Optimal allocation and size of renewable energy sources as distributed generations using shark optimization algorithm in radial distribution systems. Energies 16, 3983. doi:10.3390/en16103983
Ali, S., Kamel, S., and Juardo, F. (2018b). “Voltage profile improvement in active distribution networks using hybrid WOA-SCA optimization algorithm,” in Twentieth International Middle East Power Systems Conference (MEPCON), Cairo, Egypt, December 18–20, 2018.
Aman, M. M., Jasmon, G. B., Bakar, A. H. A., and Mokhlis, H. (2014). A new approach for optimum simultaneous multi-Dg distributed generation units placement and sizing based on maximization of system loadability using HPSO (hybrid particle swarm optimization) algorithm. Energy 66, 202–215. doi:10.1016/j.energy.2013.12.037
Amigue, F. F., Essiane, S. N., Ngoffé, S. P., Ondoa, G. A., Mengounou, G. M., and Nna, T. P. N. (2021). Slime mould optimization algorithms for optimal distributed generation integration in distribution electrical network. Int. J. Electr. Comput. Eng. 15.
Arya, L. D., Koshti, A., and Choube, S. C. (2012). Distributed generation planning using differential evolution accounting voltage stability consideration. Electr. Power Energy Syst. 42, 196–207. doi:10.1016/j.ijepes.2012.04.011
Avar, A., and Ehsan, G. (2024). Optimal integration and planning of PV and wind renewable energy sources into distribution networks using the hybrid model of analytical techniques and metaheuristic algorithms: a deep learning-based approach. Comput. Electr. Eng. 117, 109280. doi:10.1016/j.compeleceng.2024.109280
Baran, M. E., and Wu, F. F. (1989a). Network reconfiguration in distribution systems for loss reduction and load balancing. IEEE Trans. Power Deliv. 4, 1401–1407. doi:10.1109/61.25627
Baran, M. E., and Wu, F. F. (1989b). Optimal capacitor placement on radial distribution systems. IEEE Trans. Power Deliv. 4, 725–734. doi:10.1109/61.19265
Behera, S. R., Dash, S. P., and Panigrahi, B. K. (2015). “Optimal placement and sizing of DGs in radial distribution system (RDS) using Bat algorithm,” in 2015 International Conference on Circuit, Power and Computing Technologies (ICCPCT-2015), Nagercoil, India, 19–20, March 2015.
Darvishi, A., Alimardani, A., and Abdi, B. (2011). Optimized fuzzy control algorithm in integration of energy storage in distribution grids. Energy Procedia 12, 951–957. doi:10.1016/j.egypro.2011.10.125
Das, A., and Srivastava, L. (2017). “Optimal placement and sizing of distributed generation units for power loss reduction using Moth-flame optimization algorithm,” in International Conference on Intelligent Computing, Instrumentation and Control Technologies (ICICICT), Kerala, India, 06–07, July 2017.
Devi, S., and Geethanjali, M. (2014). Application of Modified Bacterial Foraging optimization algorithm for optimal placement and sizing of distributed generation. Expert Syst. Appl. 41, 2772–2781. doi:10.1016/j.eswa.2013.10.010
Dharageshwari, K., and Nayanatara, C. (2015). “Multiobjective optimal placement of multiple distributed generations in IEEE 33 bus radial system using simulated annealing,” in International Conference on 512 Circuit, Power and Computing Technologies, Nagercoil, India, 19–20, March 2015.
El-Ela, A. A. A., Allam, S. M., and Shatla, M. (2010). Maximal optimal benefits of distributed generation using genetic algorithms. Electr. Power Syst. Res. 80, 869–877. doi:10.1016/j.epsr.2009.12.021
El-Khattam, W., and Salama, M. M. A. (2004). Distributed Generation technologies, definitions and benefits. Electr. Power Syst. Res. 71, 119–128. doi:10.1016/j.epsr.2004.01.006
El-Zonkolky, A. M. (2011). Optimal placement of multi-distributed generation units including different load models using particle swarm optimization. Swarm Evol. Comput. 1, 50–59. doi:10.1016/j.swevo.2011.02.003
Fokui, R. E. A., Kouonchie, W. S. T., and N, P. K. (2023). Optimal allocation of plug-in electric vehicle charging stations in the distribution network with distributed generation. Green Energy Intelligent Transp. 2, 100094. doi:10.1016/j.geits.2023.100094
Gandomkar, M., Vakilian, M., and Ehsan, M. (2005). A genetic-based tabu search algorithm for optimal DG allocation in distribution networks. Electr. Power Coomponents Syst. 33, 1351–1362. doi:10.1080/15325000590964254
Ganguly, S., Sahoo, N. C., and Das, D. (2013). Multi-objective particle swarm optimization based on fuzzy-Pareto-dominance for possibilistic planning of electrical distribution systems incorporating distributed generation. Fuzzy Sets Syst. 213, 47–73. doi:10.1016/j.fss.2012.07.005
García, J. A. M., and Mena, A. J. G. (2013). Optimal distributed generation location and size using a modified teaching-learning based optimization algorithm. Electr. Power Energy Syst. 50, 65–75. doi:10.1016/j.ijepes.2013.02.023
Gitizadeh, M., Vahed, A. A., and Aghaei, J. (2013). Multistage distribution system expansion planning considering distributed generation using hybrid evolutionary algorithms. Appl. Energy 101, 655–666. doi:10.1016/j.apenergy.2012.07.010
Gopu, P., Naaz, S., and Aiman, K. (2021). “Optimal placement of distributed generation using genetic algorithm,” in International Conference on Advances in Electrical, Computing, Communication and sustainable Technologies (ICAECT), Bhilai, India, February 19–20, 2021.
Hung, D. Q., and Mithulananthan, N. (2013). Multiple distributed generator placement in primary distribution networks for loss reduction. IEEE Trans. industrial Electron. 60, 1700–1708. doi:10.1109/tie.2011.2112316
Hung, D. Q., Mithulananthan, N., and Bansal, R. C. (2010). Analytical expressions for DG allocation in primary distribution networks. IEEE Trans. Energy Convers. 25, 814–820. doi:10.1109/tec.2010.2044414
Imran, M., and Kowsalya, A.M (2014). Optimal size and siting of multiple distributed generators in distribution system using bacterial foraging optimization. Swarm Evol. Comput. 15, 58–65. doi:10.1016/j.swevo.2013.12.001
Jain, S., Kalambe, S., Agnihotri, G., and Mishra, A. (2017). Distributed generation deployment: state-of- the-art of distribution system planning in sustainable era. Renew. Sustain. Energy Rev. 545 (77), 363–385. doi:10.1016/j.rser.2017.04.024
Kansal, B. B. R. S., Sai, B., Tyagi, V., and Kumar, (2011). Optimal placement of distributed generation indistribution networks. Int. J. Eng. Sci. Technol. 3, 47–55. doi:10.4314/ijest.v3i3.68421
Kansal, S., Kumar, V., and Tyagi, B. (2013). Optimal placement of different type of DG sources indistribution networks. Int. J. Electr. Power & Energy Syst. 53, 752–760. doi:10.1016/j.ijepes.2013.05.040
Kashyap, M., and Mittal, A.S (2017). “Optimal placement of distributed generation using genetic algorithm approach,” in Proceedings of the second International Conference on Microelectronics, Computing & 552 Communication System, Bhilai, India, February 19–20, 2021.
Kefayat, M., Ara, A. L., and Niaki, S. A. N. (2015). A hybrid of ant colony optimization and artificial bee colony algorithm for probabilistic optimal placement and sizing of distributed energy resources. Energy Conservation Manag. 92, 149–161. doi:10.1016/j.enconman.2014.12.037
Khalil, T. M., Gorpinich, A. V., and Elbanna, G. (2013). “Combination of capacitor placement and reconfiguration for loss reduction in distribution systems using selective PSO,” in 22nd International Conference on Electricity Distribution, Stockholm, June 10–13, 2013.
Khan, M. T., Singh, P., Chouhan, A., Arya, R., Verma, A., Titare, L. S., et al. (2023). Optimal placement of multiple distributed generators using a novel voltage stability indicator employing arithmetic optimization algorithm. Comput. Electr. Eng. 100, 108853.
Khatod, D. K., Pant, V., and Sharma, J. D. (2006). A novel approach for sensitivity calculations in the radial distribution system. IEEE Trans. power Deliv. 21, 2048–2057. doi:10.1109/tpwrd.2006.874651
Kumar Injeti, S., and Kumar, N. P. (2013). A novel approach to identity optimal access point and capacity of multiple DGs in a small, medium, and large scale radial distribution systems. Electr. Power Energy Syst. 45, 142–151. doi:10.1016/j.ijepes.2012.08.043
Lalitha, M., Reddy, V. C. V., and Usha, V. (2005). Optimal DG placement for minimum real power loss in radial distribution systems using PSO. J. Theor. Appl. Inf. Technol., 107–116.
Mirrashid, M., and Naderpour, H. (2023). Incomprehensible but Intelligible-in-time logics: theory and optimization algorithm. Knowledge-Based Sytems 264, 110305. doi:10.1016/j.knosys.2023.110305
Moradi, M. H., and Abedini, M. (2012). A combination of genetic algorithm and particle swarm optimization for optimal DG location and sizing in distribution systems. Electr. Power Energy Syst. 34, 66–74. doi:10.1016/j.ijepes.2011.08.023
Musa, A., and Hashim, (2019). Optimal sizing and location of multiple distributed generation for power loss minimization using genetic algorithm. Indonesian J. Electr. Eng. Comput. Sci. 16, 956. doi:10.11591/ijeecs.v16.i2.pp956-963
Nezhadpashaki, M. A., Farid, K., and Abbasi, S. (2020). Optimal placement and sizing of distributed generation with small signal stability constraint. Sustain. Energy Grids Netw. 23, 100380. doi:10.1016/j.segan.2020.100380
Nguyen, T. P., Nguyen, T. A., Phan, T. V., and Vo, D. N. (2021). A comprehensive analysis for multi-objective distributed generations and capacitor banks placement in radial distribution networks using hybrid neural network algorithm. Knowledge-Based Syst. 231, 107387–107388. doi:10.1016/j.knosys.2021.107387
Peperman, G., Driesen, J., Haeseldonckx, D., Belmans, R., and D’haeseleer, W. (2005). Distributed generation: definition, benefits and issues. Energy Policy 33, 787–798. doi:10.1016/j.enpol.2003.10.004
Pesaran, M. H. A., Huy, P. D., and Vigna, K. R. (2016). A review of the optimal allocation of distributed generation: objectives, constraint, methods, and algorithms. Renew. Sustain. Energy Rev. doi:10.1016/j.rser.2016.10.071
Prabha, D. R., and Jayabarathi, T. (2016). Optimal placement and sizing of multiple distributed generating units in distribution networks by invasive weed optimization algorithm. Ain Shams Eng. J. 7, 683–694. doi:10.1016/j.asej.2015.05.014
Prakash, D. B., and Lakshminarayana, C. (2018). Multiple DG placements in radial distribution system for multi objectives using Whale Optimization Algorithm. Alex. Eng. J. 57, 2797–2806. doi:10.1016/j.aej.2017.11.003
Quoc, H. D., and Mithulananthan, N. (2013). Multiple distributed generator placement in primary distribution networks for loss reduction. IEEE Trans. Industrial Electron. 60, 1700–1708. doi:10.1109/tie.2011.2112316
Rosado, I. J. R., and Agustin, J. L. (1998). Genetic algorithms applied to the design of large power distribution systems. IEEE Trans. Power Syst. 13, 696–703. doi:10.1109/59.667402
Saxena, N., Pandit, M., and Srivastava, L. (2022). “Improved binary bat algorithm for optimally placing multiple DGs in RDN,” in 2022 IEEE 10th Power India International Conference (PIICON), New Delhi, India, November 25–27, 2023.
Selim, A., Hassan, M. H., Kamel, S., and Hussein, A. G. (2023). Allocation of distributed generator inpower networks through an enhanced jellyfish search algorithm. Energy Rep. 10, 4761–4780. doi:10.1016/j.egyr.2023.11.032
Sharma, S., Bhattacharjee, S., and Bhattacharya, A. (2016). Quasi-oppositional swine Influenza model based optimization with quarantine for optimal allocation of DG in radial distribution network. Electrcal power Energy Syst. 74, 348–373. doi:10.1016/j.ijepes.2015.07.034
Singh, B., Mukherjee, V., and Tiwari, P. (2019). GA-based optimization for optimally placed and properly coordinated control of distributed generations and Static Var Compensator in distribution networks. Energy Rep. 5, 926–959. doi:10.1016/j.egyr.2019.07.007
Singh, N., and Bala, R. (2015). A novel method for power flow solution of radial distribution network. Int. J. Eng. Dev. Reasearch 3, 2321–9939.
Sultana, S., and Roy, P. K. (2015). Krill herd algorithm for optimal location of distributed generator in radial distribution systems. Appl. Soft Comput. J. doi:10.1016/j.asoc.2015.11.036
Tah, A., and Das, D. (2016). Novel analytical method for the placement and sizing of distributed generation unit on distribution networks with and without considering P and PQV buses. PQV buses 78, 401–413. doi:10.1016/j.ijepes.2015.12.009
Talha, E. G., Selcuk, E., and Mehmet, A. Y. (2023). Optimal DG allocation and sizing in distribution systems with Thevenin based impedance stability index. Int. J. Electr. Power & Energy Syst. 144, 108555. doi:10.1016/j.ijepes.2022.108555
Tm, P., Mp, D., At, D., Mq, D., and Tt, N. (2024). Optimal design and operation of wind turbines inRadial distribution power grids for power loss minimization. Appl. Sci. 14, 1462. doi:10.3390/app14041462
Viral, R. K., and Khatod, D. K. (2012). Optimal planning of distributed generation systems in distribution system: a review. Renew. Sustain. Energy Rev. 16, 5146–5165. doi:10.1016/j.rser.2012.05.020
Xin-She, Y. (2010). A new metaheuristic Bat-inspired algorithm. NICSO. Sci. 284 65, 74. doi:10.1007/978-3-642-12538-6_6
Yu, D., Tang, R., and Pan, L. (2024). Optimal allocation of photovoltaic energy storage in DC distribution network based on interval linear programming. J. Energy Storage 85, 110981. doi:10.1016/j.est.2024.110981
Keywords: distributed generation, optimal placement of distributed generators, radial distribution network, incomprehensible but intelligible-in-time logics, load models, power loss reduction, voltage profile improvement, voltage deviation index
Citation: Saxena N, Pandit M and Srivastava L (2024) Multi-objective DG placement in radial distribution systems using the IbI logic algorithm. Front. Energy Res. 12:1453715. doi: 10.3389/fenrg.2024.1453715
Received: 23 June 2024; Accepted: 29 August 2024;
Published: 26 November 2024.
Edited by:
Yiji Lu, University of Glasgow, United KingdomReviewed by:
Jordan Radosavljević, Faculty of Technical Sciences, SerbiaMinh Quan Duong, The University of Danang, Vietnam
Copyright © 2024 Saxena, Pandit and Srivastava. This is an open-access article distributed under the terms of the Creative Commons Attribution License (CC BY). The use, distribution or reproduction in other forums is permitted, provided the original author(s) and the copyright owner(s) are credited and that the original publication in this journal is cited, in accordance with accepted academic practice. No use, distribution or reproduction is permitted which does not comply with these terms.
*Correspondence: Nitin Saxena, bG9nb250b25pdGluc2F4ZW5hQGdtYWlsLmNvbQ==
 Nitin Saxena
 M Pandit2