 Weiru Wang
 Fan Hu2
- 1The department is Power Grid Technology Center, State Grid Shanxi Electric Power Research Institute, Taiyuan, China
- 2State Grid Shanxi Electric Power Company, Taiyuan, China
As global warming increases the frequent occurrences of natural disasters, the reduction of carbon emissions has become an important issue around the world. The chemical industry is an important source of carbon emissions in China. The carbon emissions of the chemical industry are calculated from 2000 to 2019 by using the emission factor method. The logarithmic mean divisia index (LMDI) method is exploited to analyze the factors that influence carbon emissions, and the emissions variations are attributed to the contributions of carbon intensity, energy structure, energy intensity, industrial value-added rate, per capita industrial output value, and industrial scale. The results of decomposition show that per capita industrial output value is the main driving factor, and energy intensity is the main inhibiting factor of the chemical industry’s carbon emissions. In order to quantify the variation of carbon emissions, the extended stochastic impacts by regression on population, affluence, and technology (STIRPAT) model is constructed and examined. Using the STIRPAT model, the basic scenario and energy intensity control scenario are set, and the carbon emissions are predicted, which shows that under a strict energy intensity control scenario, carbon emissions may reach a peak around 2031. The factors influencing the decomposition and prediction of carbon emissions should be helpful in reducing the carbon emissions of the chemical industry in China.
1 Introduction
Global warming and the resulting frequent occurrence of natural disasters have become a big threat to human survival. Reduction of carbon emissions is key and has become the consensus of the international community (Reichstein et al., 2013; Seneviratne et al., 2016). The rapid development of the economy has brought about huge carbon emissions in China. To effectively reduce carbon emissions, the Chinese government hopes to realize carbon peaking in 2030 and carbon neutrality in 2060. Thus, China faces huge pressure to reduce carbon emissions. The analysis and prediction of carbon emissions are of great significance for controlling the total amount and intensity of carbon emissions in China.
From a macro perspective, the electric power, construction, and chemical industries are the main sources of carbon emissions in China. Researches on carbon emissions reduction in the fields of power, construction, and civil aviation have attracted much attention (Alajmi, 2022; Li et al., 2024; Wu et al., 2022), construction (Lai et al., 2023; Leslie, 2022), and civil aviation (Li et al., 2023; Liu et al., 2020) has attracted much attention. The chemical industry is an important part of China’s economy that includes five sub-industries: the oil and natural gas extraction industry; the petroleum processing, coking, and nuclear fuel processing industry; the chemical raw materials and chemical products manufacturing industry; the chemical fiber manufacturing industry; and the rubber and plastic products industry. Thus, analyzing the factors that influence the chemical industry and predicting its carbon emissions should be helpful for the reduction of carbon emissions in the context of carbon peaking and carbon neutrality.
The chemical industry is a high-energy-consumption industry. The carbon emissions of the chemical industry are process related. Zhang Y. et al. (2019) presented local carbon emission factors of coal chemical products in China based on first-hand data from 23 coal chemical enterprises and the total carbon emission of China’s coal chemical industry. Neelis et al. (2007) presented a bottom-up analysis of energy use and carbon loss in the chemical industry using datasets on production processes for 52 of the most important bulk chemicals as well as production volumes. Zhao et al. (2022) developed a MESSAGEix-ammonia model with detailed process descriptions to evaluate the energy-saving and emissions reduction potential in China’s ammonia industry.
Many different types of products are produced in the chemical industry. As a result, it is complex and difficult to accurately calculate the carbon emissions of the chemical industry from the perspective of products. However, it is viable to analyze the carbon emissions and influencing factors of the chemical industry from a macro perspective. The popular methods of analyzing influencing factors include structure decomposition analysis (SDA) and index decomposition analysis (IDA). Among these models, the logarithmic mean divisia index (LMDI) method (Ang, 2005; Ang, 2015) is widely used in the fields of energy, environment, industries (Boqiang and Liu, 2017), and regions (İpek Tunç et al., 2009; Moutinho et al., 2015) because it is easy to build the model and eliminate the residuals. Lin and Long (2016) analyzed carbon emissions of the chemical industry in China and found that the output per worker, industrial economic scale, energy intensity, and energy structure were the main factors that influenced carbon emissions changes in the chemical industry. Zhang L. et al. (2019) identified the driving factors of carbon emissions from coal conversion using coal as raw material and fuel in China using LMDI.
Predicting carbon emissions is the foundation of controlling them, and prediction has attracted much attention. Huo et al. (2023) predicted the carbon peak time under three distinct scenarios for the transportation sector based on a support vector machine model improved by a genetic algorithm (GA-SVM). Liu et al. (2023) carried out carbon emissions predicting and decoupling analysis based on the particle swarm optimization–extreme learning machine (PSO-ELM) combined model for Chongqing Municipality, China. Zhang et al. (2023) investigated the carbon footprint prediction of the thermal power industry in Zhejiang province of China. Zhang L. et al. (2019) predicted the carbon emissions of China’s coal conversion by setting scenarios with different annual average growth rates for different levels of production and gave the possible amounts of carbon emission between 2020 and 2030. Lu et al. (2020) employed a particle swarm optimization (PSO) algorithm and back propagation neural network model to predict carbon emissions for the heavy chemical industry in the 2017–2035 time frame on the basis of the previous data. Yin et al. (2023) predicted the carbon dioxide emissions in China using a gray model with multi-parameter combination optimization. Predicting carbon emissions using machine learning on a large amount of data has attracted much attention. However, data for calculating carbon emissions of the macro industry usually come from a statistical yearbook that is published yearly or every 5 years. Thus, predicting the carbon emissions of a macro industry based on machine learning may be limited due to the small amount of data.
The investigations on factors influencing the carbon emissions of the chemical industry in China have focused on some sub-sectors and chemical products, and the predictions of carbon emissions have focused on regions and industries such as transportation, power, and coal conversion. The influencing factors and prediction of carbon emissions of the chemical industry have not been fully investigated. In this paper, we investigate the factors that influence carbon emissions for the chemical industry and its five sub-industries simultaneously and predict carbon emissions for the whole chemical industry in China. The carbon emissions of the chemical industry are calculated utilizing the emission factor method recommended by the United Nations Intergovernmental Panel on Climate Change (UNIPCC). The influencing factors of the chemical industry and its five sub-industries are analyzed by LMDI. According to the result of LMDI, several factors are selected to build the STIRPAT model, and carbon emissions of the chemical industry are predicted from 2020 to 2035.
2 Calculation of carbon emissions
The carbon emissions of the chemical industry are calculated using the emission factor method. The calculation of carbon emissions based on emission factor is mainly dependent on the fuel combustion amount, carbon content, and carbon oxidation rate of unit fuel and other parameters and can be written as (Commission, 2015)
where
According to the China Statistical Yearbook and the China Energy Statistical Yearbook, the final energy consumption of the chemical industry includes raw coal, washing coal, other washing coal, coke, coke oven gas, blast furnace gas, converter gas, other gas, crude oil, gasoline, kerosene, diesel, fuel oil, naphtha, petroleum coke, liquefied petroleum gas, refinery dry gas, other petroleum products, natural gas, liquefied natural gas, heat and electricity (22 kinds). In order to reflect energy structure, the 22 kinds of energy are divided into five types: coal energy, oil energy, natural gas energy, thermal energy, and electric energy. The carbon emissions of coal energy, oil energy and natural gas energy are calculated by using Equation 1. The carbon emission factor of the heat is 0.11 t/GJ, and the carbon emissions of the power industry are calculated according to the national averaged carbon emission factor, taking it as 0.5839 t/MWh. The carbon emissions of the chemical industry in units of million tons (Mt) from 2000–2019 are shown in Figure 1. As shown in Figure 1, the carbon emissions of petroleum processing, coking, and nuclear fuel processing industry and chemical raw materials and chemical products manufacturing industry contribute a large part of the total carbon emissions of the chemical industry.
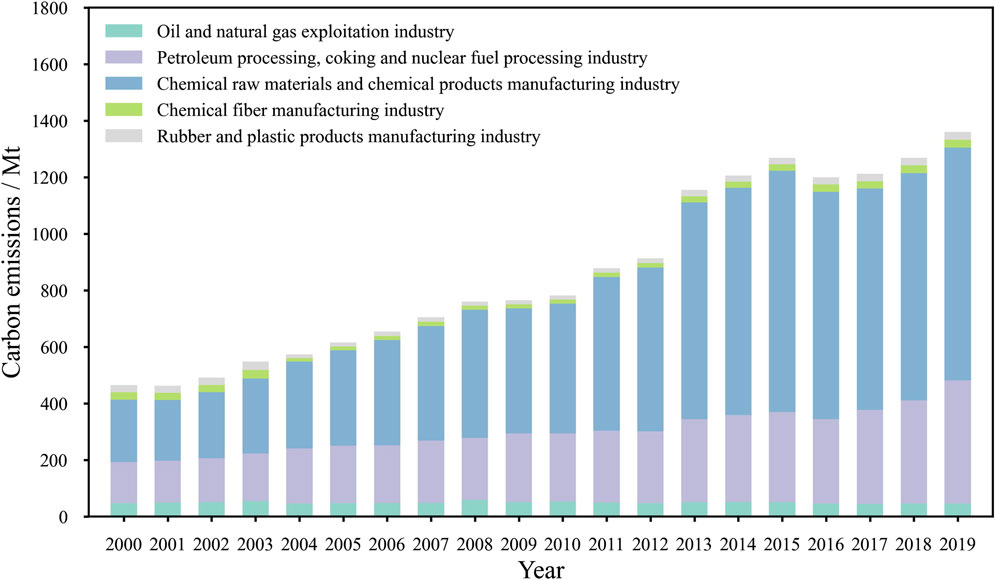
Figure 1. Carbon emissions of the chemical industry in China from 2000 to 2019.
3 Analysis of influencing factors
In this paper, the LMDI method is used to analyze influencing factors of carbon emissions in the chemical industry. Based on the Kaya identity (Kaya, 1989), carbon emissions can be decomposed into several factors and can be written as
where
In Equation 2, one multiplier represents an influencing factor, and the meaning and abbreviation of each multiplier are shown in Table 1. The functions of six influencing factors are described as follows: the carbon intensity factor evaluates energy quality, energy substitutions, and installation of abatement technologies in the chemical industry. The energy structure factor reflects the change in the relative share of different types of energy in the total energy consumption of the chemical industry. The energy intensity factor measures the comprehensive energy utilization efficiency of the chemical industry. The industrial added-value rate factor presents the economic benefits of reducing intermediate consumption of the chemical industry. The per capita industrial output value factor reflects the productivity level of the chemical industry. The industrial scale factor represents the potential for expansion of the chemical industry.
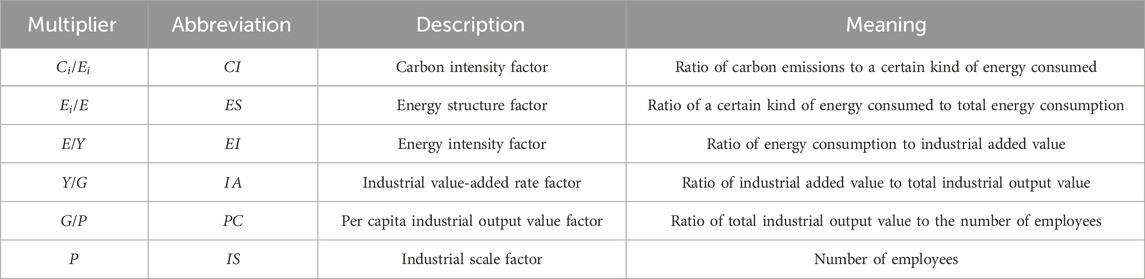
Table 1. Definition of variables in LMDI.
Using the LMDI method and Equation 2, the change of carbon emissions from base year 0 to target year T is divided into six parts as follows (Ang, 2005; Ang, 2015):
where
In Equation 3, the superscripts T and 0 denote the
The variations in carbon emissions due to the six influencing factors from 2001–2019 can be calculated using Equation 3. The results are shown in Figure 2. It can be seen that variations of carbon emissions resulting from the energy structure factor, industrial added-value rate factor, per capita industrial output factor, and industrial scale factor are positive, and the variation from the energy intensity factor is negative in Figure 2. Positive variation means that this factor increases emissions, while negative variation means that this factor leads to reduced emissions. As a result, per capita industrial output value is the main driving factor, and energy intensity is the main inhibiting factor of the chemical industry in China. Moreover, the carbon emissions result from industry scale increased from 2001–2014 and decreased after 2015, as shown in Figure 2. Although the carbon emissions continued to increase in this period as the development of the chemical industry, the growth is slowing.
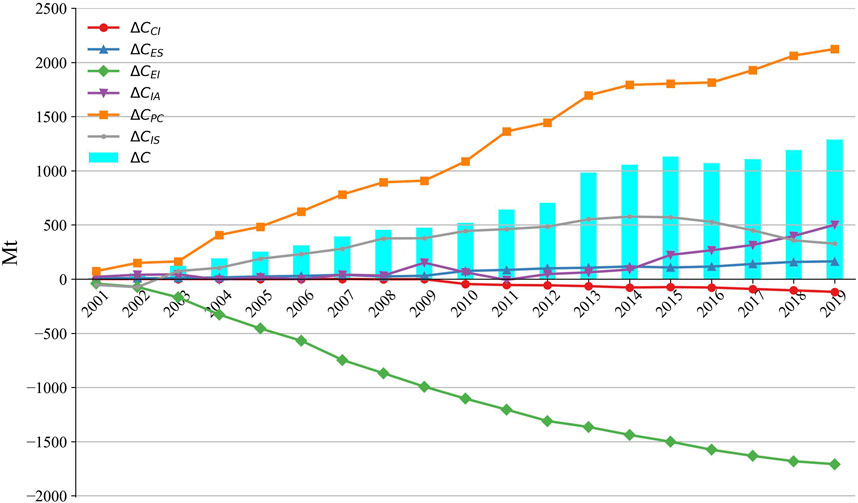
Figure 2. Variations in carbon emission due to six influencing factors.
In order to quantify the influence of the six factors, the contribution rate of each factor can be calculated using Equation 4.
In Equation 4,

Figure 3. Contribution rates of each influencing factor.
In order to contrast different sub-industries of the chemical industry, the influencing factors of five sub-industries are analyzed and shown in Figure 4. It can be seen from Figure 4 that per capita industrial output value is the main driving factor, and energy intensity is the main inhibiting factor for all the five sub-industries as same as the whole chemical industry. Among the five sub-industries, the emission variatons of the sub-industry of petroleum processing, coking, and nuclear fuel processing industry and the sub-industy of chemical raw materials and chemical products manufacturing industry are much larger than those of the other three sub-industries. Moreover, the variation of carbon emissions due to the industry scale factor is larger than that of the per capita industrial output value for the rubber and plastic products manufacturing sub-industry before 2013. After that time, the variations due to the two factors are comparable, which is obviously different for the other sub-industries.
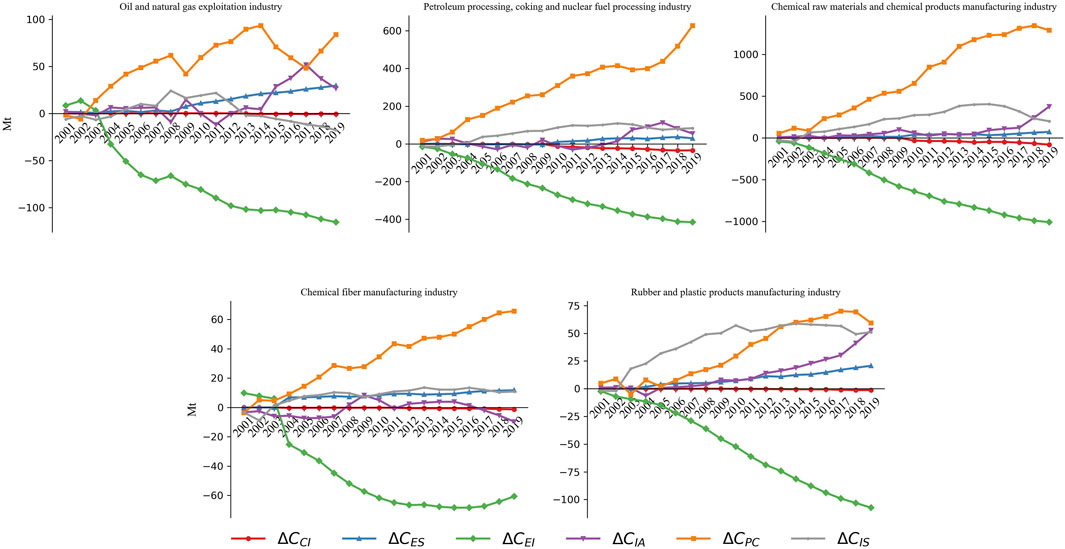
Figure 4. LMDI decomposition of five sub-industries of the chemical industry.
4 Prediction of carbon emission
4.1 STIRPAT model
The IPAT model was developed to capture the impact of socio-economic factors on environmental pressures (Ehrlich and Holdren, 1971; Holdren and Ehrlich, 1974) and identifies three main factors affecting the environment: population size, affluence, and technology levels. However, the impact of each factor on the dependent variable is equally proportional in this model, which is not in line with the general laws of economic operation. Dietz et al. refined it in 2003 and obtained the STIRPAT model (York et al., 2003a, b), which can be expressed as follows:
where
Considering carbon emissions in the chemical industry, some variables in the traditional STIRPAT model are replaced to highlight the characteristics of the chemical industry. The investment scale has a more important influence on the overall scale of the chemical industry, which can reflect the production and operation of the industry better than the population scale; thus, the population size in the original model is replaced by the fixed asset investment. In addition, the affluence level in the original model is replaced by the labor output per capita, which is the ratio of gross industrial output to the number of employees. Moreover, the technology level is measured by energy intensity to reflect the technology level of the chemical industry, which is defined as total energy consumption divided by gross industrial output value, and its smaller value indicates a higher technology level.
As can be seen from LMDI decomposition, energy structure may influence the carbon emissions of the chemical industry. Thus, the ratios of coal, oil, natural gas, heat, and electricity to the total energy consumption are added to the model. The logarithmic approach is used to treat the total energy consumption shares, fixed asset investment, per capita output, energy intensity, and the shares of coal/oil/natural gas/heat/electricity to eliminate the effect of the magnitude. The model variables are defined as shown in Table 2. With the factors mentioned above considered, the extended STIRPAT model can be expressed as
where
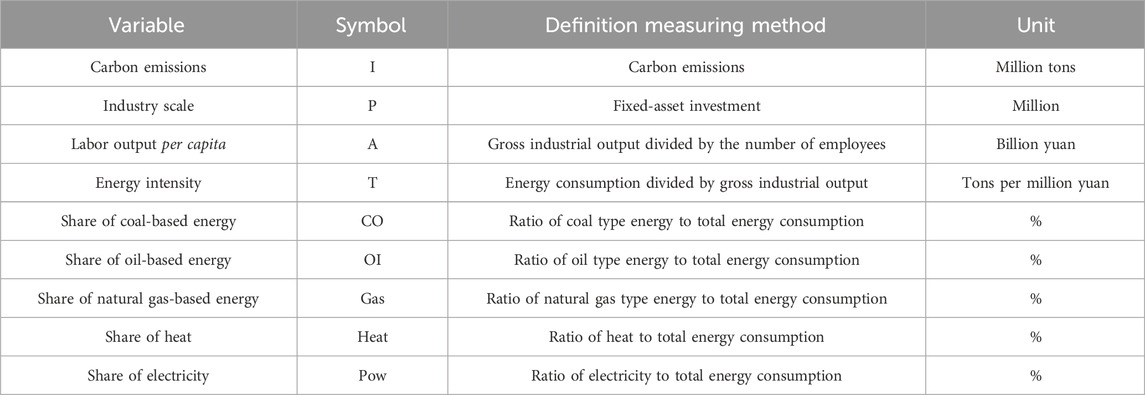
Table 2. Variables in the STIRPAT model.
The extended STIRPAT model expressed in Equation 7 has introduced multiple variables that are related to the carbon emissions of the chemical industry. However, there may be a correlation between the independent variables. If there is a strong linear relationship between each independent variable, the true relationship between the independent and dependent variables cannot be found. This is usually called multicollinearity. Therefore, to ensure the accuracy of the regression results, multicollinearity testing should be carried out before regression.
Ordinary least squares (OLS) regression and multicollinearity among the variables are tested. The model in Equation 7 can be fit well (
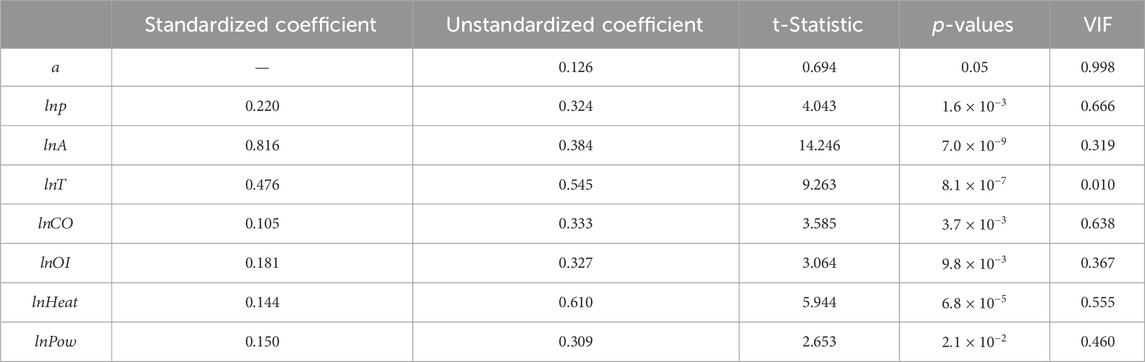
Table 3. Ridge regression results with
The fitting results show that the regression coefficients of the independent variables pass the T-test and have economic significance, and the VIF values calculated according to the ridge regression are less than 5, which implies that the model after the ridge regression can avoid the influence of multicollinearity. The regression equation can be written as
In order to verify the validity of the model, the annual data of variables from 2000 to 2019 are brought into the equation to calculate the fitted values of carbon emissions, and the fitted values and the historical values are compared. The results are shown in Figure 5 the fitted values of carbon emissions are close to the historical values.
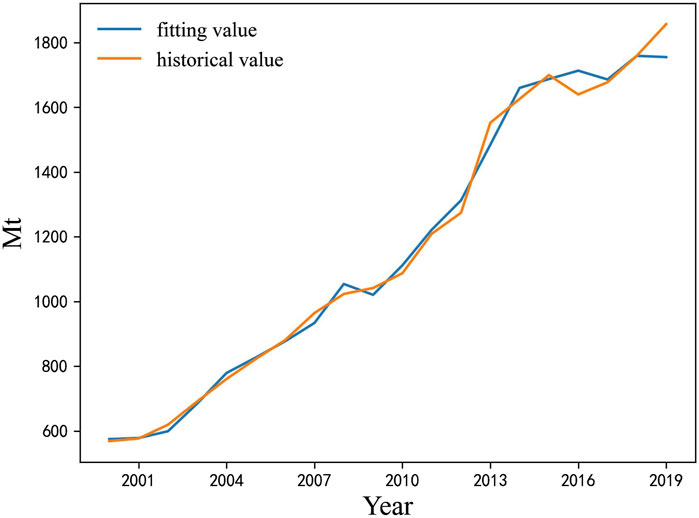
Figure 5. Historical and fitting values of carbon emissions.
4.2 Prediction based on the STIRPAT model
In this paper, the extended STIRPAT model in Equation 8 is exploited to predict the carbon emissions from 2020–2035 under a basic scenario and energy intensity control scenario for the chemical industry in China. The basic scenario assumes that variables increase with a mean growth rate of the last 5 years, and the noise of Gaussian distribution with a mean value of 0.0 and variance of 0.01 is added to the mean growth rate considering external disturbance. The energy intensity control scenario assumes that the growth rate of energy intensity is controlled by the carbon emissions reduction policy, and the remaining variables grow at the same rate as the basic scenario. The energy intensity continues to grow at a growth rate close to 12.0% under the basic scenario. Thus, considering the actual situation and the lag effect of the policy constraint effect, it is assumed that the growth rate of energy intensity grows from the initial value to 15.0% and then decreases to 9.0% with a reduction rate of −2.0% yearly, and a final decrease to 8.0% at the end of the period.
The growth rates and values of variables are calculated, and then carbon emissions are calculated according to the extended STIRPAT model in Equation 8 under the basic scenario and the energy intensity control scenario from 2020–2035. The carbon emissions are shown in Figure 6. As can be seen from Figure 6, the carbon emissions continue to grow under the basic scenario and will not achieve carbon peaking until 2035. Meanwhile, the carbon emissions will increase slightly, peak around 2031, and then decrease under the energy intensity control scenario.
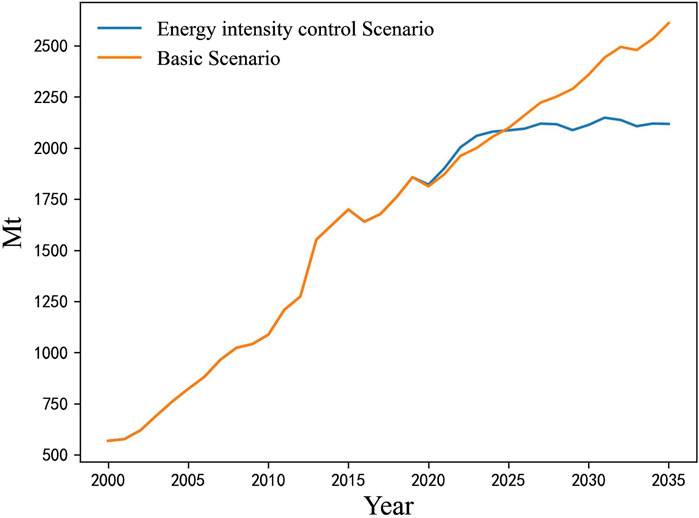
Figure 6. Historical value and predicted value of carbon emissions under the basic scenario and the energy intensity control scenario.
5 Conclusion
In this paper, the factors influencing carbon emissions in the chemical industry in China are analyzed by using the LMDI method and predicted according to the extended STIRPAT model from 2020–2035. Among the influencing factors, the industrial output value per capita is the main driving factor, which results in carbon emissions increasing with the development of the chemical industry. Energy intensity is the main inhibiting factor of the chemical industry because advances in technology will be accompanied by a decrease of carbon emissions per added value of the chemical industry. In the context of carbon peaking, the carbon emissions intensity should be controlled strictly. Compared with traditional thermal power, wind power and photovoltaic power have a lower carbon emissions factor. Therefore, from the development process of the chemical industry in the future, the energy intensity should be greatly reduced. In addition to vigorously promoting emerging technologies to reduce the energy intensity of the industry, electric energy substitution should be promoted as much as possible, using electric energy to replace fossil energy and green power to replace thermal power. These measures will support China’s chemical industry in achieving the goal of carbon neutrality and carbon peak as soon as possible from multiple perspectives.
Data availability statement
The raw data supporting the conclusions of this article will be made available by the authors, without undue reservation.
Author contributions
WW: conceptualization, writing–original draft, and writing–review and editing. FH: methodology and writing–review and editing. ML: methodology and writing–review and editing. XS: data curation, resources, and writing–review and editing. XL: visualization and writing–review and editing.
Funding
The author(s) declare that financial support was received for the research, authorship, and/or publication of this article. This research was supported in part by the State Grid Shanxi Electric Power Company Technology Project under Approval No. 520530220024.
Conflict of interest
Authors FH and XS were employed by State Grid Shanxi Electric Power Company.
The remaining authors declare that the research was conducted in the absence of any commercial or financial relationships that could be construed as a potential conflict of interest.
The authors declare that this study received funding from State Grid Shanxi Electric Power Company. The funder had the following involvement in the study: methodology, writing–review, data curation and editing.
Publisher’s note
All claims expressed in this article are solely those of the authors and do not necessarily represent those of their affiliated organizations, or those of the publisher, the editors, and the reviewers. Any product that may be evaluated in this article, or claim that may be made by its manufacturer, is not guaranteed or endorsed by the publisher.
References
Alajmi, R. G. (2022). Carbon emissions and electricity generation modeling in Saudi Arabia. Environ. Sci. Pollut. Res. 29 (16), 23169–23179. doi:10.1007/s11356-021-17354-0
Ang, B. W. (2005). The lmdi approach to decomposition analysis: a practical guide. Energy Policy 33 (7), 867–871. doi:10.1016/j.enpol.2003.10.010
Ang, B. W. (2015). Lmdi decomposition approach: a guide for implementation. Energy Policy 86, 233–238. doi:10.1016/j.enpol.2015.07.007
Boqiang, L., and Liu, K. (2017). Using lmdi to analyze the decoupling of carbon dioxide emissions from China’s heavy industry. Sustainability 9 (7), 1198. doi:10.3390/su9071198
Commission, T. N. D. A. (2015). Accounting methods and reporting guidelines for greenhouse gas emissions of Chinese chemical production enterprises (trial) [in chinese].
Ehrlich, P. R., and Holdren, J. P. (1971). Impact of population growth: complacency concerning this component of man's predicament is unjustified and counterproductive. Science 171 (3977), 1212–1217. doi:10.1126/science.171.3977.1212
Hoerl, A. E., and Kennard, R. W. (1970). Ridge regression: biased estimation for nonorthogonal problems. Technometrics 12 (1), 55–67. doi:10.2307/1267351
Holdren, J. P., and Ehrlich, P. R. (1974). Human population and the global environment: population growth, rising per capita material consumption, and disruptive technologies have made civilization a global ecological force. Am. Sci. 62 (3), 282–292.
Huo, Z., Zha, X., Lu, M., Ma, T., and Lu, Z. (2023). Prediction of carbon emission of the transportation sector in jiangsu province-regression prediction model based on ga-svm. Sustain. Basel, Switz. 15 (4), 3631. doi:10.3390/su15043631
İpek Tunç, G., Türüt-Aşık, S., and Akbostancı, E. (2009). A decomposition analysis of co2 emissions from energy use: Turkish case. Energy Policy 37 (11), 4689–4699. doi:10.1016/j.enpol.2009.06.019
Kaya, Y. (1989). Impact of carbon dioxide emission control on gnp growth: interpretation of proposed scenarios. Intergovernmental Panel On Climate Change/Response Strategies Working Group, May.
Lai, K. E., Rahiman, N. A., Othman, N., Ali, K. N., Lim, Y. W., Moayedi, F., et al. (2023). Quantification process of carbon emissions in the construction industry. Energy Build. 289, 113025. doi:10.1016/j.enbuild.2023.113025
Leslie, M. (2022). Construction industry innovation takes aim at reducing carbon emissions. Engineering 19, 7–10. doi:10.1016/j.eng.2022.10.001
Li, C., Li, Y., and Xing, J. (2023). Multivariate grey prediction model application in civil aviation carbon emission based on fractional order accumulation and background value optimization. Sustainability 15 (11), 9127. doi:10.3390/su15119127
Li, Y., Yang, X., Du, E., Liu, Y., Zhang, S., Yang, C., et al. (2024). A review on carbon emission accounting approaches for the electricity power industry. Appl. Energy 359, 122681. doi:10.1016/j.apenergy.2024.122681
Lin, B., and Long, H. (2016). Emissions reduction in China׳s chemical industry – based on lmdi. Renew. Sustain. Energy Rev. 53, 1348–1355. doi:10.1016/j.rser.2015.09.045
Liu, B., Chang, H., Li, Y., and Zhao, Y. (2023). Carbon emissions predicting and decoupling analysis based on the pso-elm combined prediction model: evidence from chongqing municipality, China. Environ. Sci. Pollut. Res. 30 (32), 78849–78864. doi:10.1007/s11356-023-28022-w
Liu, X., Hang, Y., Wang, Q., and Zhou, D. (2020). Drivers of civil aviation carbon emission change: a two-stage efficiency-oriented decomposition approach. Transp. Res. Part D-Transport Environ. 89, 102612. doi:10.1016/j.trd.2020.102612
Lu, C., Li, W., and Gao, S. (2020). Driving determinants and prospective prediction simulations on carbon emissions peak for China’s heavy chemical industry. J. Clean. Prod. 251, 119642. doi:10.1016/j.jclepro.2019.119642
Marquaridt, D. W. (1970). Generalized inverses, ridge regression, biased linear estimation, and nonlinear estimation. Technometrics 12 (3), 591–612. doi:10.2307/1267205
Moutinho, V., Moreira, A. C., and Silva, P. M. (2015). The driving forces of change in energy-related co2 emissions in eastern, western, northern and southern europe: the lmdi approach to decomposition analysis. Renew. Sustain. Energy Rev. 50, 1485–1499. doi:10.1016/j.rser.2015.05.072
Neelis, M., Patel, M., Bach, P., and Blok, K. (2007). Analysis of energy use and carbon losses in the chemical industry. Appl. Energy 84 (7-8), 853–862. doi:10.1016/j.apenergy.2007.01.015
Reichstein, M., Bahn, M., Ciais, P., Frank, D., Mahecha, M. D., Seneviratne, S. I., et al. (2013). Climate extremes and the carbon cycle. Nature 500 (7462), 287–295. doi:10.1038/nature12350
Seneviratne, S. I., Donat, M. G., Pitman, A. J., Knutti, R., and Wilby, R. L. (2016). Allowable co2 emissions based on regional and impact-related climate targets. Nature 529 (7587), 477–483. doi:10.1038/nature16542
Wu, X., Xu, C., Ma, T., Xu, J., and Zhang, C. (2022). Carbon emission of China's power industry: driving factors and emission reduction path. Environ. Sci. Pollut. Res. 29 (52), 78345–78360. doi:10.1007/s11356-022-21297-5
Yin, F., Bo, Z., Yu, L., and Wang, J. (2023). Prediction of carbon dioxide emissions in China using a novel grey model with multi-parameter combination optimization. J. Clean. Prod. 404, 136889. doi:10.1016/j.jclepro.2023.136889
York, R., Rosa, E. A., and Dietz, T. (2003a). Footprints on the earth: the environmental consequences of modernity. Am. Sociol. Rev. 68 (2), 279–300. doi:10.1177/000312240306800205
York, R., Rosa, E. A., and Dietz, T. (2003b). Stirpat, ipat and impact: analytic tools for unpacking the driving forces of environmental impacts. Ecol. Econ. 46 (3), 351–365. doi:10.1016/s0921-8009(03)00188-5
Zhang, C., Zou, X., and Lin, C. (2023). Carbon footprint prediction of thermal power industry under the dual-carbon target: a case study of zhejiang province, China. Sustain. Basel, Switz. 15 (4), 3280. doi:10.3390/su15043280
Zhang, L., Shen, Q., Wang, M., Sun, N., Wei, W., Lei, Y., et al. (2019). Driving factors and predictions of co2 emission in China's coal chemical industry. J. Clean. Prod. 210, 1131–1140. doi:10.1016/j.jclepro.2018.10.352
Zhang, Y., Yuan, Z., Margni, M., Bulle, C., Hua, H., Jiang, S., et al. (2019). Intensive carbon dioxide emission of coal chemical industry in China. Appl. Energy 236, 540–550. doi:10.1016/j.apenergy.2018.12.022
Keywords: carbon emission, carbon prediction, influencing factor decomposition, LMDI, STIRPAT model
Citation: Wang W, Hu F, Li M, Shi X and Liu X (2024) Influencing factors and predictions of carbon emissions for the chemical industry in China. Front. Energy Res. 12:1442106. doi: 10.3389/fenrg.2024.1442106
Received: 01 June 2024; Accepted: 20 September 2024;
Published: 14 October 2024.
Edited by:
Amir Riaz, University of Maryland, United StatesReviewed by:
Godwin Norense Osarumwense Asemota, University of Rwanda, RwandaZhipeng Qin, Guangxi University, China
Copyright © 2024 Wang, Hu, Li, Shi and Liu. This is an open-access article distributed under the terms of the Creative Commons Attribution License (CC BY). The use, distribution or reproduction in other forums is permitted, provided the original author(s) and the copyright owner(s) are credited and that the original publication in this journal is cited, in accordance with accepted academic practice. No use, distribution or reproduction is permitted which does not comply with these terms.
*Correspondence: Weiru Wang, aGR3YW5nd2VpcnUyMDIzQDE2My5jb20=