- Department of Mechanical and Industrial Engineering, Norwegian University of Science and Technology, Trondheim, Norway
Subsea production systems operate in harsh and hostile environments, making them subject to degradation that leads to failure. This is also the case for the final elements of safety-instrumented systems (SISs) that are installed to protect subsea production systems. As a result, the classic SIS performance assessment methods that assume constant failure rates may not be realistic for subsea elements, which may experience both random failures and natural degradation. The location of subsea production also provides challenges for accessing the system to perform repair, and this often results in delays before repair following revealed failures. In this paper, we explore all these issues by developing formulations that incorporate degradation and random failures as well as repair delays to assess the performance of the system. The degradation of the system is modeled with the Weibull distribution, while an exponential distribution is used to model the random failures. The impacts of different maintenance strategies on safety are also explored with case studies.
1 Introduction
Technical safety barriers have been widely used in different industries, such as oil and gas, nuclear, and chemical engineering sectors, to ensure safe operation, maximize production, and limit downtime. Popular among these are the safety-instrumented systems (SIS). An SIS is an independent protection layer installed to mitigate the risk associated with a specified hazard (Rausand, 2004). An SIS typically consists of one or more sensor(s), a logic solver, and one or more final element(s) (IEC 61511:2016). SISs are designed to detect the onset of hazardous situations and to act to prevent their occurrence or mitigate their consequences. The sensors monitor a process variable (e.g., flow pressure or temperature) and relay the measurement to a logic solver, which compares the measurement against a preset value. In a situation where there is a deviation, the logic solver will send a signal to activate the final element, such as cutting off flow in the case of a shutdown valve in a pipeline.
The use of SISs is heavily regulated due to its criticality to safety. Standards such as IEC61508 (IEC 61508:2010) and IEC61511 (IEC 61511:2016) govern the design, installation, and operation of such systems. To comply with the requirements of the standards, it is important to demonstrate by quantitative analysis that the performance of the system meets the minimum required level in terms of acceptable risk. The performance measure recommended by the International Electrotechnical Commission (IEC) standards is the average probability of failure on demand
Several studies have assessed the
The multi-state Markov process has been used to address degradation within the SIS. Oliveira et al. (2016) and Oliveira (2018) developed models to evaluate the PFD considering degradation brought about by the test. This is a binary state model with a constant failure rate as degradation due to aging is not considered. Srivastav et al. (2020) considered degradation due to aging as well as the impact of testing. In the model, the failure rate is multiplied by a factor depending on the degraded state of the system following a test. Although this framework extends the binary state model by considering intermediate degraded states, it requires expert judgment to select initial parameters for changing the failure rate as well as to select the number of degraded states. There is also an exponential increase in the number of possibilities for the combination of system states and transition rates as the number of tests increases, making the assessment computationally intensive and time consuming.
The gamma process, a well-known process for modeling degradation, has also been applied to model the degradation of SIS. Zhang et al. (2019) analyzed the performance of redundant safety-instrumented systems subject to degradation and external demands using the gamma process. The natural aging of the component follows the gamma process. The external demand arrives following a homogeneous Poisson process, and its impact is assumed to be non-negative and gamma-distributed. The system fails if the combined accumulated damage exceeds a given threshold. Although this approach provides a more realistic assessment of the degradation of the system, a monitoring variable is required. In practice, the monitored parameter does not always follow the gamma process, and some computations and transformations must be done on the variable to suit the analysis. For example, considering the closing time of a shutdown valve as a monitored variable, this value fluctuates between tests and, therefore, cannot be used directly as the monitored value in the gamma process.
The Weibull distribution is another approach used to address the non-constant failure rate/degradation of SIS. The Weibull distribution offers flexibility, as the distribution parameters can be adapted to model the internal degradation and time to failure of the system. Jigar (2013) applied the Weibull distribution to develop analytical formulas based on the ratio between cumulative distribution functions for assessing the reliability of the SIS. Rogova et al. (2017) extended the model to incorporate common cause failures (CCFs) and diagnostic coverage (DC) for more complex systems with more than one component. Wu et al. (2018) developed approximation formulas based on the average failure rate in an interval to assess the performance of SIS while also considering the effect of partial tests (PT) on the reliability performance.
The above-mentioned works are based on the assumption that the system is repaired and put back into service immediately or almost immediately following the test, thereby ignoring the duration of the repair in their assessment. However, some other issues remain to be considered in the subsea context. These systems are not easily accessible, and thus, there is a delay following the test before the repair is carried out. This repair delay is non-negligible and should be considered in the assessment. Wu et al. (2019) addressed the problem of delayed restoration in their paper considering partial test and full test. However, they assumed that the system was as good as new following repair after a full test. This is often not the case with most mechanical systems unless there is a complete overhaul. Another issue to consider is that different failure modes may occur on the same system, and these can bring more challenges to the decision making with respect to testing and maintenance. The systems are often subject to random external shocks that may cause sudden failure to the system.
To address this issue, we analyze the performance of the SIS final element subject to failure due to different (heterogenous) failure modes in this paper. Subsea systems operate in a very hostile environment with harsh conditions. Aside from failures due to aging and degradation, the systems are also exposed to random shocks. We also consider the impact of delayed restoration on the unavailability/
The main objective of this paper is to provide formulations for analyzing the unavailability of subsea SIS final elements subject to different (heterogenous) failure modes as well as the impact of delayed restoration. The main contribution/novelty in this paper is that we consider the impact of different failure modes with different failure distributions for the SIS final element in conjunction with delayed repair and formulate simple approximation formulas for assessing the system unavailability.
The rest of the paper is organized as follows: Section 2 presents a brief description of key concepts associated with SISs and performance analysis of SISs, as well as assumptions used in the analyses. Section 2 presents the analytical formulation of unavailability and average unavailability for different test intervals as well as the entire mission time of the system. Section 4 gives case studies and some numerical examples of applying the formulations to determine the unavailability as well as the effects of different parameters on the average unavailability. Section 6 provides a summary and conclusion of the paper. Suggestions for further work are also given in this section.
2 Definitions and assumptions
This section presents some definitions and assumptions for SIS performance assessment and lays the groundwork for the analytical formulation that follows.
2.1 Safety-instrumented system
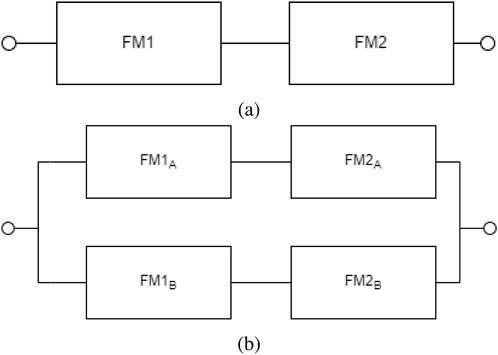
A safety-instrumented system (SIS) is an independent protection layer installed to mitigate the risk associated with the operation of a specified hazardous system (Rausand, 2004). It consists of at least three subsystems: sensors, logic solvers, and the final element. The sensors monitor a pre-defined process variable (such as temperature or pressure). The measurement is transmitted to the logic solver, which compares it with a set value. In the event of a hazardous situation (temperature or pressure too high or too low, depending on the system and operation), the logic solver sends a signal to activate the final element. In this paper, we focus on the final element, specifically the shutdown valve. In the oil and gas industry, the shutdown valve is a very common final element used to cut off flow in pipelines or other processes. They are often set up in a 1oo1 or 1oo2 configuration. The 1oo2 is thought to have higher reliability because both valves need to fail for the system to fail, but where the risk to safety is not high, the 1oo1 set-up can be useful and more economical in terms of capital investment. Demand for these valves is low, and accordingly, they are classified by the IEC standards as a SIS with a low-demand mode of operation. Typical demand is less than once per year on average (IEC 61508:2010; IEC 61511:2016). Because these valves are inactive for a long period of time, any failure is not known until they are activated either through demand or a test. Such failures are referred to as dangerous undetected (DU) failures.
2.2 Safety unavailability
The safety unavailability of a safety system is the probability that the system is not able to perform its required function on demand (Rausand, 2004). The main contributions to safety unavailability include (Hauge et al., 2013):
In this paper, we focus on safety unavailability due to DU failures and safety unavailability due to restoration actions. In offshore and subsea installations, there is often a delay after failure is detected in the valve until the valve is restored. This kind of delay poses a different kind of risk to the operation. Quantifying these risks enables appropriate risk reduction actions to be put in place.
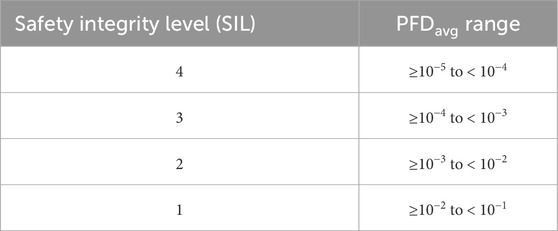
Safety integrity is a fundamental concept in the IEC standards. According to the international electrotechnical vocabulary (IEV 821-12-54), safety integrity is the ability of a safety-related system to achieve its required safety functions under all the stated conditions within a stated operational environment and within a stated duration (IEC, 2017). The safety integrity is classified into four discrete levels called safety integrity levels (SILs), which is, in turn, defined by the
SIL targets are typically assigned to safety functions during the planning and design stage. Components and subsystems are then selected along with configurations to meet the required SIL targets in operation.
2.3 Assumptions for analysis
The following assumptions are made to further facilitate the formulations in this paper:
1. The system is subjected to two kinds of failure modes: 1. Failures due to degradation (failure mode 1, or FM1) and 2. Failures due to random external shocks to the system (failure mode 2, or FM2).
2. The degradation of the system follows the Weibull distribution with probability density function (PDF):
where
3. External shocks causing sudden failures to the system are assumed to arrive following a homogeneous Poisson process with a pdf given by
where
4. The components and failure modes are assumed to be stochastically independent. However, the probability of having more than one failure mode present in the same component at any given point in time is considered low and negligible.
5. The system is regularly proof-tested. Tests are non-destructive and have no negative impact on the system. The tests are performed simultaneously for the final elements, and the testing duration is considered negligible. See, for example, Torres-Echeverría et al. (2009), Hauge et al. (2013), or Rausand (2014) for how to quantify the average unavailability of non-negligible test times.
6. Following proof tests, revealed failures are repaired. However, there will be a delay before the repair is carried out. The delay is the same regardless of number of items to repair. With respect to FM 1, repairs are assumed to be minimal, thereby making the entire system not as good as new following repairs.
7. Common cause failures (CCF) for a 1oo2 configuration, as well as the effects of dangerous detected (DD) failures for both configurations, are excluded. This is to keep the focus on quantifying the impact of the different failure modes, as well as the impact of delayed restoration on safety unavailability, while keeping the analysis relatively simple.
3 Safety unavailability analysis
This section presents the formulations for assessing the unavailability and
3.1 Unavailability formulation
The unavailability of the system is defined for the system as the instantaneous inability to fulfil its intended function due to failure. The unavailability of the system can be analytically evaluated in different testing intervals.
3.1.1 Failure and conditional failure probability
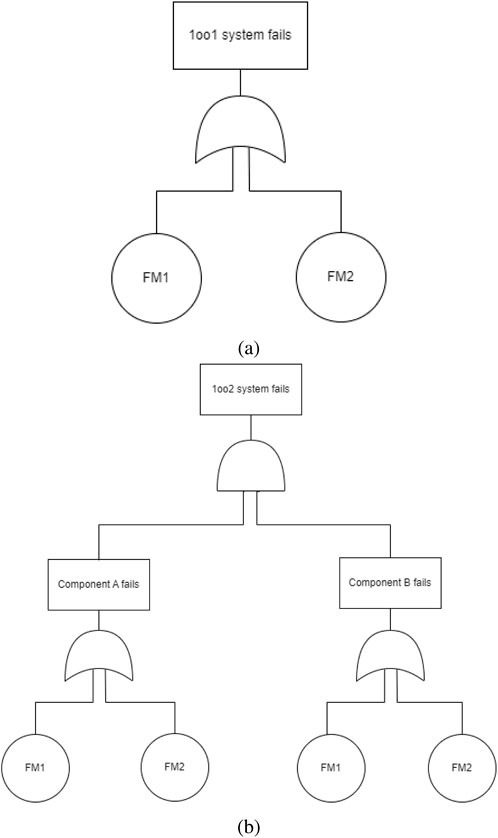
A 1oo1 system will fail if either of the two failure modes is present in the system. Let
The CDF of the system, which is the probability that the system is in a failed state at a given point in time, is given as:
Note this approximation takes low values (i.e.,
For a 1oo2 system, failure will occur only when both components are in a failed state. Let
The probability that the system is in a failed state at time, t, is given as
Assuming both components are identical
for low values of
Given that the system is functioning at time,
and for a 1oo2 system
Equations 1–11 provides formulas for the failure probability, conditional failure probability and lays the foundation for the unavailability formulation in the next section.
3.1.2 Analytical formulation of unavailability
Given
and for a 1oo2 system as
If t is in the second interval
In the interval
and for a 1oo2 system
For the interval
and for a 1oo2 system
For subsequent intervals
and for a 1oo2 system
In the interval
Equations 12–21 provide formulas for calculating the unavailability in different test intervals for a 1oo1 and a 1oo2 system. The intervals may be constant or non-constant, depending on the operational requirements of the system. It is important to note that the first two intervals are unique in their formulations, particularly when we consider delays before repair. If we assume no delays before repair, then only the first interval has a unique formulation. The repair delay is deterministic and can include the actual repair duration.
3.1.3 Average unavailability formulation
The average unavailability gives the average proportion of time the system is unable to fulfill its intended function in a given time interval. In the previous section, we established the instantaneous unavailability for the system in the different testing intervals. Likewise, we can find the average unavailability for the system in the different testing intervals. The average unavailability for a system in a given interval can generally be expressed as
The approximation applies if we consider a time unit increment of
So, considering the first test interval,
and for a 1oo2 system
For the second interval,
and for a 1oo2 system
With respect to subsequent intervals,
and for a 1oo2 system
The above formulations (Equations 23–28) give the average unavailability for the system in different test intervals. However, we may be interested in finding the total average unavailability for a given mission time
4 Case studies and performance analysis
The shut-in pressure in new oil and gas fields exceeds the design pressure capacity for flowlines and risers. Without a pressure protection system, the flowline and risers would be overpressured and could rupture upon topside shutdown or other flow blockage. The subsea high-integrity pressure protection system (HIPPS) is an important part of the overall pressure protection system in subsea production. The system is typically designed to withstand adverse operating conditions, namely, high pressure and temperature, as well as harsh environmental conditions that may promote erosion and corrosion of the system parts. A HIPPS is subjected to different test and maintenance strategies in accordance with relevant standards to promote improved dynamic performance. It is typically configured in a basic 1oo1 or 1oo2 set-up. Due to its operating conditions, the mechanical components are subject to gradual degradation leading up to failures but also may experience random instantaneous failures. Access to any failures revealed during a test is difficult due to their location and requires planning before repair is carried out, resulting in a delay before repair. The reservoir pressure decays rapidly when the field is producing. After 4–5 years, the shut-in pressure is expected to be below the capacity of the flowlines and risers, and the HIPPS valves can be locked open Bak and Roald Sirevaag (2007). Based on this consideration, the HIPPS will serve as an application case for the proposed approach.
The HIPPS system is designed to comply with the IEC61508/IEC61511 standards to fulfill the safety integrity level requirements for a system in low-demand mode at SIL3 (NOG GL-070:2018).
To apply the proposed approach, the relevant parameters for the HIPPS are chosen as:
To keep the assessment of unavailability consistent, we consider the time of the first test to be the same for both periodic and non-periodic testing. This is to ensure consistency from the second interval because the unavailability due to repairs of revealed failures in the first interval is carried over and considered a part of the second interval (Equation 14; Equation 15). The first test is assumed to be after 6 months (4,380 h).
For periodic testing with intervals of 1 year (8,760 h), the following are the test times: T1 = 4,380 h, T2 = 13,140 h, T3 = 21,900 h, T4 = 30,660 h, T5 = 39,420 h, and T6 = 43,800 h. For non-periodic testing, we consider decreasing test intervals of 17,520 h, 13,140 h, and 8,760 h after the first test as follows: T1 = 4,380 h, T2 = 21,900 h, T3 = 35,040 h, and T4 = 43,800 h.
4.1 Instantaneous unavailability analysis
We analyze the unavailability of the system for both 1oo1 and 1oo2 systems using Equations 12–21. We consider different cases as follows:
From Figure 3, we observe the general trend for the unavailability as a linear increase for a 1oo1 system and a non-linear increase for a 1oo2 system.
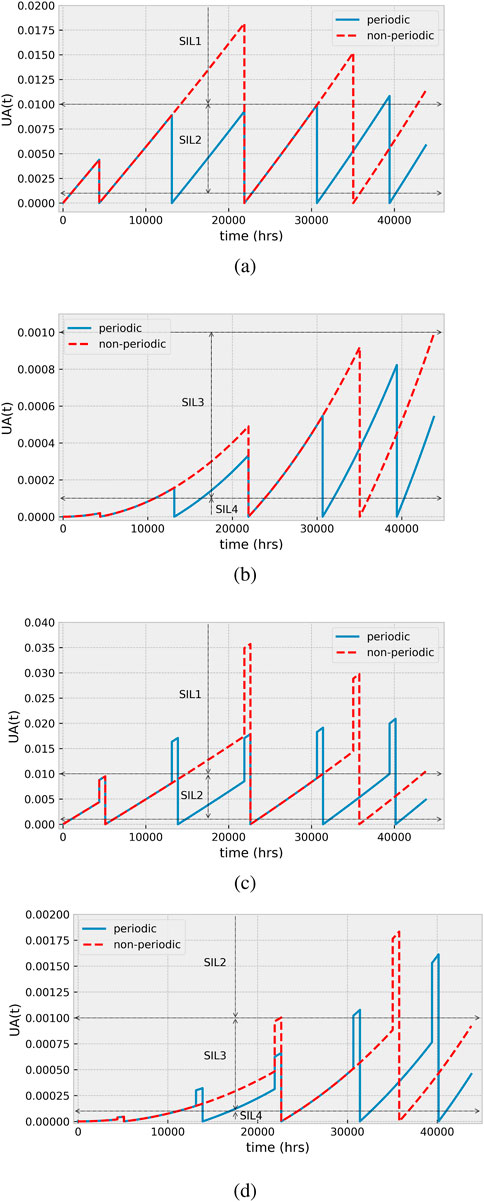
Figure 3. Comparison of instantaneous unavailability for periodic and non-periodic test intervals for (A) Case 1, (B) Case 2, (C) Case 3, and (D) Case 4.
For the 1oo1 configuration, the instantaneous unavailability increases with subsequent test intervals, with the highest point reached just before the fifth test at 39,420 h with periodic testing. On the other hand, the non-periodic testing has a decreasing instantaneous unavailability in subsequent intervals after the second interval in keeping with the decreasing test intervals, with the highest point reached just before the second test (Figures 3A, C).
For a 1oo2 system, the trend is similar for both periodic and non-periodic test intervals. The instantaneous unavailability increases with subsequent test intervals, with the peak coming just before the fifth test for the periodic test and at the end of the mission time for non-periodic testing with no repair delays (Figure 3B). However, in the case with repair delays, both periodic and non-periodic reach their peak unavailability just before the repair is completed following the last test within the mission time (Figure 3D).
In terms of reliability, the 1oo1 configuration with no repair delays achieves SIL 2 for all the intervals except the fifth test interval with periodic testing. With non-periodic testing, SIL 2 is achieved only within the first interval, with the rest of the interval reaching SIL 1. On the other hand, considering repair delays, both test strategies achieve SIL 1 for all intervals except the first (both strategies) and the last (periodic testing only) intervals.
For a 1oo2 system, SIL 3 is achieved for all intervals for both periodic and non-periodic test intervals without repair delays. With repair delay, SIL 2 is reached from the third and fourth test intervals for non-periodic and periodic test strategies, respectively, and it returns to within SIL 3 for the remainder of the mission time following the penultimate test.
4.2 Average unavailability analysis
Although the instantaneous unavailability shows the trend for unavailability, the average unavailability gives a measure of the expected proportion of time the system is unavailable within a given period. We consider two analyses of the average unavailability:
1. Test intervals. As we saw in Section 4.1, the rate of increase of the instantaneous unavailability is different for different test intervals influenced by the test strategy. Therefore, we analyze the average unavailability for the different intervals.
2. Mission time. It could also be interesting to consider the entire mission time for the system. This is particularly useful for selecting a strategy that gives an overall lower unavailability.
4.2.1 Test intervals
We analyze the average unavailability for both 1oo1 and 1oo2 configurations for different test intervals using Equations 23–28 and for the same cases as in Section 4.1.
The results show that generally, the periodic test strategy gives lower average unavailability than the non-periodic testing strategy (Figure 4); however, both strategies achieve a minimum SIL2 for a 1oo1 system and a minimum SIL3 for a 1oo2 system for all intervals.
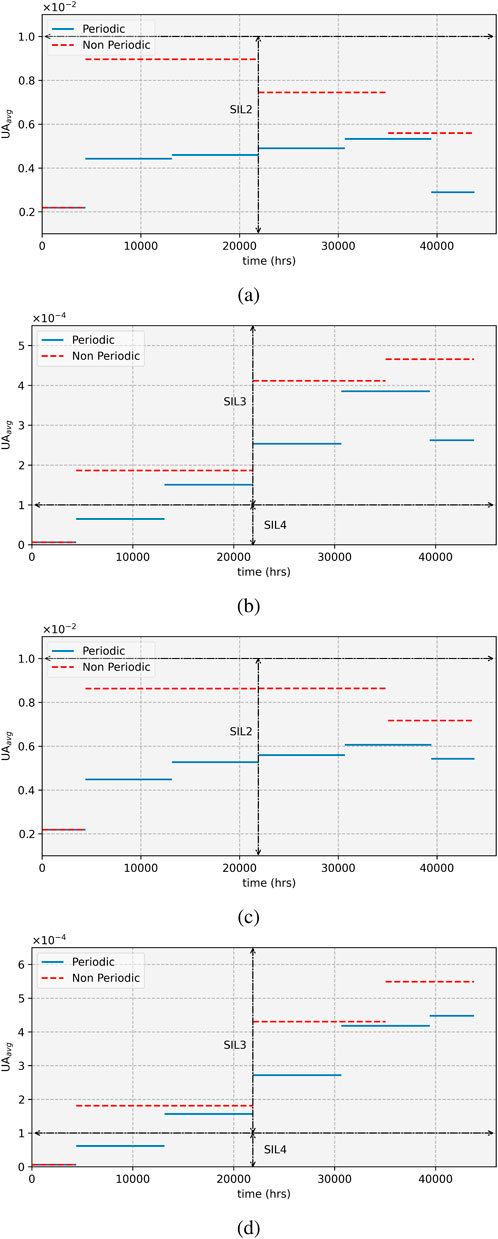
Figure 4. Comparison of average unavailability for periodic and non-periodic test intervals for (A) Case 1, (B) Case 2, (C) Case 3, and (D) Case 4.
The decreasing test intervals of the non-periodic strategy are reflected in the decreasing average unavailability from the second interval for subsequent intervals for a 1oo1 set-up, as illustrated in Figures 4A, C. However, this is not the case with the 1oo2 set-up, as the average unavailability increases for subsequent intervals, albeit the difference gradually reduces with the decreasing non-periodic test intervals (Figures 4B, D).
Given a SIL target of SIL2 for a 1oo1 and SIL3 for a 1oo2 set-up, the non-periodic testing strategy gives a better option from an economic perspective, as the number of tests is reduced. On the other hand, a target
4.2.2 Mission time
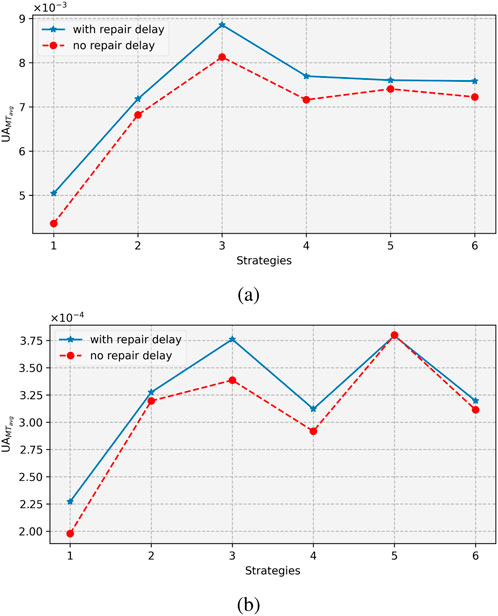
In this section, we consider the entire mission time for the system. We analyze the average unavailability for the entire mission time, considering different testing strategies using Equation 29. We also compare for repair delays and with no repair delays. The following testing strategies are used:
Strategies 1–3 are variants of periodic testing with intervals of 1 year, 1.5 years, and 2 years, respectively. Strategies 4–6 are variants of non-periodic testing with decreasing test intervals (i.e., intervals between subsequent tests decrease,
Figure 5 shows the results for the different strategies. Generally, with periodic testing, the unavailability increases with the length of the interval between the tests for both 1oo1 and 1oo2 configurations and for both delays before repair and without delays. For non-periodic testing, the three strategies (4–6) have similar performance trends for the 1oo2 set-up and for the 1oo1 set-up without repair delays. For this group, the decreasing test interval (Strategy 4) gives the lowest unavailability, while the increasing test (Strategy 5) interval gives the highest unavailability. For a 1oo1 set-up with a repair delay, the decreasing interval (Strategy 4) gives the highest unavailability, while the mixed test interval (Strategy 6) gives the lowest.
4.3 Effect of parameters on unavailability
In this section, we examine the effect of different parameters on the average unavailability of the system for both 1oo1 and 1oo2 configurations with periodic and non-periodic testing strategies. Based on their performance, Strategy 1 is selected for periodic testing, and Strategy 4 is selected f or non-periodic testing. The strategies are described in Section 4.2.2.
4.3.1 Combined effect of
We examine the combined effect of
Figure 6 shows the result of the analysis. On the y-axis, we have
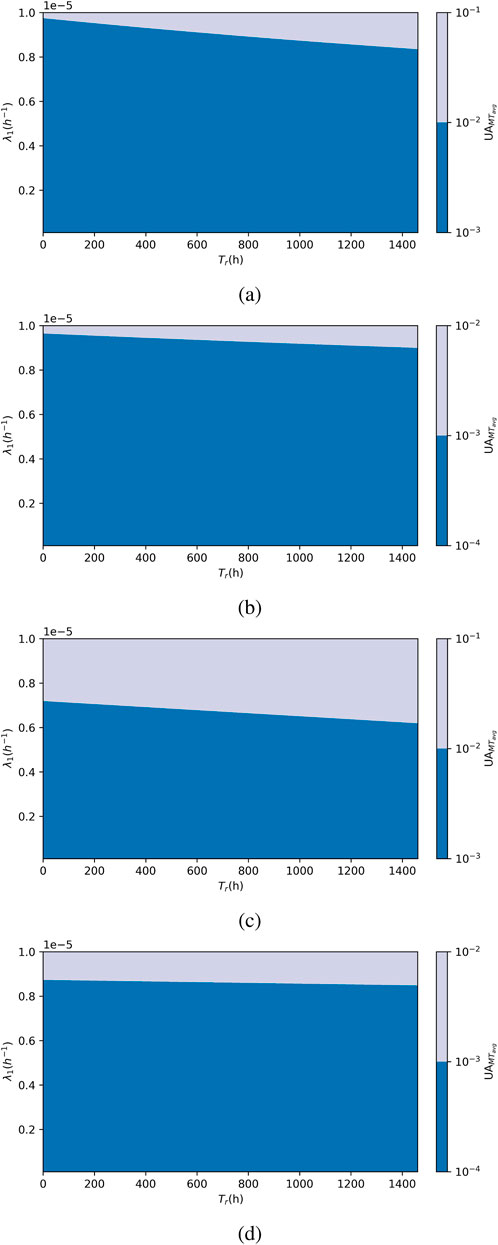
Figure 6. Effect of
For periodic testing strategies (Figures 6A, B), a change in SIL occurs at high values of
For non-periodic test strategies (Figures 6C, D), the threshold for
In summary, for the 1oo1 set-up, while the non-periodic strategy reduces the number of tests, which in turn reduces the number of stoppages, saves costs, and reduces production losses, the threshold for
4.3.2 Combined effect of
Here, we look at the effect of
From Figure 7, we see that average unavailability is more sensitive to changes in
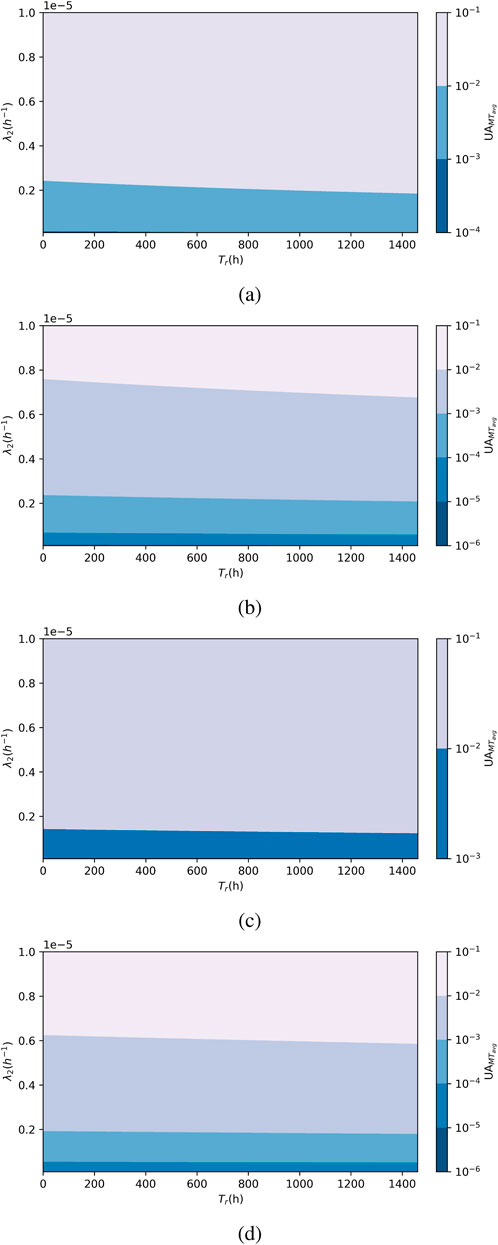
Figure 7. Effect of
The threshold is lower for the non-periodic test strategy and requires
A lower threshold for
4.3.3 Combined effect of
In this section, we analyze the effect of
The result in Figure 8 shows average unavailability ranging from SIL 1 to SIL 3 for a 1oo1 set-up and from SIL 1 to below SIL 4 for a 1oo2 set-up.
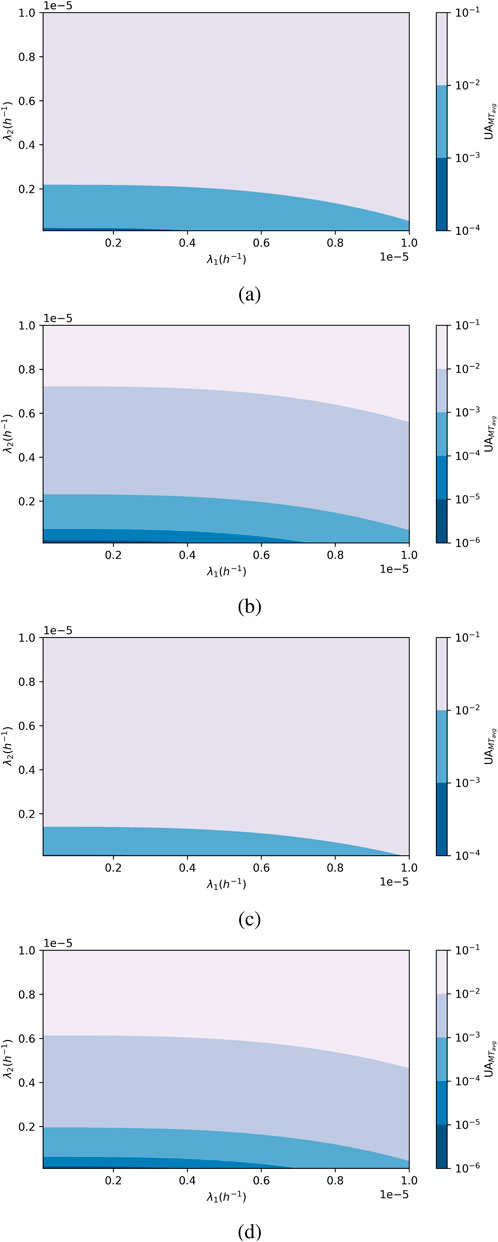
Figure 8. Effect of
To determine the threshold for minimum SIL requirement, we first look at the maximum tolerable value for
For a non-periodic test strategy, the threshold is at
This result shows that FM2 has a significantly higher impact on average unavailability than FM1. In terms of reliability performance improvement, efforts should be made to reduce the occurrence of FM2; otherwise, more frequent testing should be adopted. On the other hand, if
5 Monte Carlo simulation for verification
A Monte Carlo simulation (MCS) is applied to verify the proposed analytical formulations. The simulation is performed with codes written using the Python programming language. The simulation procedures for a 1oo1 and a 1oo2 system are briefly described below.
5.1 Monte Carlo simulation model for a 1oo1 system
We define the following variables for the simulation: t (global simulation time), TFM1 and TFM2 (time of occurrence of FM1 and FM2, respectively), Ttest (time of test), TI (test intervals), Tr (calendar time of repair), TFail (calendar time of system failure), sysFailed (logical state of the system; 0 if the system is working and 1 if the system failed), CumFail (cumulative time system spends in a failed state).
1. Initialize the system and system characteristics and relevant variables: sysFailed = 0, t = 0, Ttest = TI, and Tr = inf (infinity).
2. Draw time until occurrence of each failure mode: TFM1 = T
3. Select the next transition time: t = min{TFM1, TFM2, Ttest, Tr}
4. Update the variables and system statistics as relevant depending on the selected event as follows:
i. if t = TFM1 or t = TFM2, the system will fail if it is not already in a failed state. Thus, if sysFailed = 0, then sysFailed = 1, TFail = t, and TFM1 or TFM2 = inf.
ii. if t = Ttest: we check if the system is in a failed state and activate repair. Thus, if sysFailed = 1, then Tr = t + repairDelay. The next test time then becomes Ttest = t + TI.
iii. if t = Tr, the repair is completed, and sysFailed = 0. Next, the repair time is set to infinity (Tr = inf). We update the time the system spent in a failed state: CumFail = CumFail + (t − TFail). Finally, we draw next time until failure occurrence of each failure mode: TFM1 = t + T
5. We repeat steps 3 and 4 until the simulation time, t, is greater than the time horizon (mission time) under consideration.
6. Then, we repeat all the steps for a sufficient number of simulations, N.
7. The average unavailability is then calculated as the total time the system spends in the failed state divided by the product of the mission time and number of simulations (N),
5.2 Monte Carlo simulation model for a 1oo2 system
The model for the 1oo2 system is similar to that of 1oo1 except with added variables to reflect the added component in the system. In addition to the variables defined above, we introduce the following variables: C1Failed and C2Failed to represent the logical state of the components similar to the variable sysFailed. In addition, we have TC1FM1 and TC1FM2 (for time to occurrence of FM1 and FM2, respectively) for component 1 and TC2FM1 and TC2FM2 (for time to occurrence of FM1 and FM2, respectively) for component 2.
The steps are as follows:
1. Initialize the system and system characteristics and the relevant variables: C1Failed = 0, C2Failed = 0, sysFailed = 0, Ttest = TI, and Tr = inf.
2. Draw time until occurrence of the failure modes for each component: TC1FM1
3. Select the next transition time: t = min{TC1FM1, TC1FM2, TC2FM1, TC2FM2, Ttest, Tr}.
4. Update the variables and system statistics as relevant depending on the selected event as follows:
i. if t = TC1FM1 or t = TC1FM2, then if C1 = 0, C1 then becomes 1, and TC1FM1 or TC1FM2 is set to infinity as relevant.
ii. if t = TC2FM1 or t = TC2FM2, then if C2 = 0, C2 then becomes 1, and TC2FM1 or TC2FM2 is set to infinity as relevant.
iii. if t = Ttest: we check for component failure and activate repair if any component is in a failed state. Thus, if C1Failed = 1 or C2Failed = 1, then Tr = t + repairDelay. The next test time then becomes Ttest = t + TI.
iv. if t = Tr, the repair is completed. The time of the next repair is set to infinity (Tr = inf) and:
v. we check for system failure: if C1Failed = 1 and C2Failed = 1 and sysFailed = 0, then sysFailed = 1, and Tfail = t.
vi. we repeat steps 3 to 5 until simulation time, t, is greater than the time horizon (mission time) under consideration.
vii. then we repeat all steps for a sufficient number of simulations, N.
viii. we calculate the average unavailability as described in the previous section.
The results of the simulation are shown in Table 2. The number of simulations for a 1oo1 and a 1oo2 set-up is kept fixed at
6 Conclusion and further works
In this paper, we have explored the analysis of unavailability for the final element of an SIS operating in a subsea environment and subject to heterogeneous failure modes. Analytical formulations have been developed to incorporate degradation and random failures in the assessment. Furthermore, delays following tests have been incorporated in these formulations to examine the impact of delayed repair on system unavailability. The Weibull distribution has been adopted to model the degradation of the component, while the exponential distribution has been adopted to model random failures.
We focus on the HIPPS valves in the case study. Analyses are done for the time-dependent unavailability and average unavailability for different testing strategies. The results show that the periodic testing strategy generally gives lower unavailability, although it requires more testing to be carried out than a non-periodic testing strategy. However, both strategies are likely to meet a given SIL target, making the non-periodic strategy a more desirable option from an economic perspective. The effects of the parameters were also studied for both strategies. The selection of a strategy should be made based on the reliability of the valves in terms of failure occurrence, paying particular attention to random failures (FM2). Another issue to consider is the availability of maintenance resources, which will impact the length of the repair delay.
The work done in this paper is limited to full-proof tests only. Partial tests have been shown to improve the reliability performance of an SIS. An extension of this work will be to incorporate partial tests into the formulation. Another issue that can be considered is the incorporation of common cause failures, as the components in this work are assumed to be independent.
Data availability statement
The original contributions presented in the study are included in the article/supplementary material; further inquiries can be directed to the corresponding authors.
Author contributions
ED: conceptualization, data curation, formal analysis, investigation, methodology, software, validation, visualization, writing–original draft, and writing–review and editing. YL: conceptualization, funding acquisition, methodology, project administration, supervision, and writing–review and editing.
Funding
The author(s) declare that financial support was received for the research, authorship, and/or publication of this article. The research receives support from the IKTPLUSS program (Project No. 309628) and the NORGLOBAL2 program (Project No. 322410) of the Research Council of Norway.
Conflict of interest
The authors declare that the research was conducted in the absence of any commercial or financial relationships that could be construed as a potential conflict of interest.
Publisher’s note
All claims expressed in this article are solely those of the authors and do not necessarily represent those of their affiliated organizations, or those of the publisher, the editors, and the reviewers. Any product that may be evaluated in this article, or claim that may be made by its manufacturer, is not guaranteed or endorsed by the publisher.
References
Bak, L., and Roald Sirevaag, H. S. (2007). Hipps protects subsea production in hp/ht conditions. Available at: https://www.offshore-mag.com/subsea/article/16760889/hipps-protects-subsea-production-in-hp-ht-conditions.
Chebila, M., and Innal, F. (2015). Generalized analytical expressions for safety instrumented systems’ performance measures: pfdavg and pfh. J. Loss Prev. Process Industries 34, 167–176. Available at: https://www.sciencedirect.com/science/article/pii/S0950423015000480doi:10.1016/j.jlp.2015.02.002
Hauge, S., Hokstad, P., Corneliussen, K., and Sikkerhet, S. (2013). Reliability prediction method for safety instrumented systems: PDS method handbook. Technical Report. Trondheim: SINTEF Technology and Society.
IEC (2017). Internationa electrotechnical vocabulary. Available at: https://std.iec.ch/iev/iev.nsf/display?openformievref=821-12-54.
IEC 61508 (2010). Functional safety of electrical/electronic/programmable electronic safety-related systems – Part 1-7. Geneva: International Electrotechnical Commission.
IEC 61511 (2016). Functional safety-safety instrumented systems for the process industry sector. Geneva: International Electrotechnical Commission.
Jigar, A. A. (2013). Quantification of reliability performance: analysis methods for safety instrumented system. Master’s thesis. Trondheim: NTNU.
Liu, Y., and Rausand, M. (2011). Reliability assessment of safety instrumented systems subject to different demand modes. J. Loss Prev. Process Industries 24, 49–56. doi:10.1016/j.jlp.2010.08.014
NOG GL-070:(2018). Application of IEC 61508 and IEC 61511 in the Norwegian petroleum industry. Guideline. Norwegian oil and gas. Stavanger.
Oliveira, F. (2018). General theory of evaluation of pfd of sis subject to periodic testing. DNV-GL Intern. Guidel.
Oliveira, F., Domingues, J., Hafver, A., Lindberg, D., and Pedersen, F. (2016). “Evaluation of pfd of safety systems with time-dependent and test step-varying failure rates,” in Risk, reliability and safety: innovating theory and practice: proceedings of ESREL 2016, 413.
Rausand, M. (2014). Reliability of safety-critical systems: theory and applications. John Wiley and Sons.
Rogova, E., Lodewijks, G., and Lundteigen, M. A. (2017). Analytical formulas of pfd and pfh calculation for systems with nonconstant failure rates. Proc. Institution Mech. Eng. Part O J. Risk Reliab. 231, 373–382. doi:10.1177/1748006X17694999
Srivastav, H., Barros, A., and Lundteigen, M. A. (2020). Modelling framework for performance analysis of sis subject to degradation due to proof tests. Reliab. Eng. and Syst. Saf. 195, 106702. Available at: https://www.sciencedirect.com/science/article/pii/S0951832019301450doi:10.1016/j.ress.2019.106702
Torres-Echeverría, A., Martorell, S., and Thompson, H. (2009). Modelling and optimization of proof testing policies for safety instrumented systems. Reliab. Eng. and Syst. Saf. 94, 838–854. Available at: https://www.sciencedirect.com/science/article/pii/S0951832008002287doi:10.1016/j.ress.2008.09.006
Vatn, J. (2007). “Veien frem til world class maintenance: maintenance optimisation,” in A course in railway maintenance optimisation arranged (Trondheim, Norway: the Norwegian University of Science and Technology NTNU).
Wu, S., Zhang, L., Lundteigen, M. A., Liu, Y., and Zheng, W. (2018). Reliability assessment for final elements of siss with time dependent failures. J. Loss Prev. Process Industries 51, 186–199. Available at: https://www.sciencedirect.com/science/article/pii/S0950423017305430doi:10.1016/j.jlp.2017.12.007
Wu, S., Zhang, L., Zheng, W., Liu, Y., and Lundteigen, M. A. (2019). Reliability modeling of subsea siss partial testing subject to delayed restoration. Reliab. Eng. and Syst. Saf. 191, 106546. doi:10.1016/j.ress.2019.106546
Zhang, A., Barros, A., and Liu, Y. (2019). Performance analysis of redundant safety-instrumented systems subject to degradation and external demands. J. Loss Prev. Process Industries 62, 103946. Available at: https://www.sciencedirect.com/science/article/pii/S0950423019305741doi:10.1016/j.jlp.2019.103946
Keywords: safety instrumented system, heterogenous failure, performance assessment, subsea production, safety integrity
Citation: Dan E and Liu Y (2024) Performance assessment of subsea safety systems subject to heterogeneous failure modes and repair delays. Front. Energy Res. 12:1430894. doi: 10.3389/fenrg.2024.1430894
Received: 10 May 2024; Accepted: 23 September 2024;
Published: 22 October 2024.
Edited by:
Xiaohu Yang, Xi’an Jiaotong University, ChinaReviewed by:
Aibo Zhang, University of Science and Technology Beijing, ChinaKhalil Ur Rahman, Pakistan Nuclear Regulatory Authority, Pakistan
Copyright © 2024 Dan and Liu. This is an open-access article distributed under the terms of the Creative Commons Attribution License (CC BY). The use, distribution or reproduction in other forums is permitted, provided the original author(s) and the copyright owner(s) are credited and that the original publication in this journal is cited, in accordance with accepted academic practice. No use, distribution or reproduction is permitted which does not comply with these terms.
*Correspondence: Emefon Dan, ZW1lZm9uLmUuZGFuQG50bnUubm8=; Yiliu Liu, eWlsaXUubGl1QG50bnUubm8=
 Emefon Dan
 Yiliu Liu